genetically modified organisms and the deterioration of ... · overall pesticide use on gmo crops...
TRANSCRIPT
Genetically Modified Organisms and the deterioration of health in the United StatesN.L. Swanson, 4/24/2013
This document was first published as a series of articles on Seattle examiner.com
Washington state residents likely to vote on GMO food labels
Hearings have been held in both the Washington state Senate (Feb. 14) and the House (March 5) on the initiative to label GMOs in our food. It is highly unusual for the legislature to take action on an initiative so it is likely that I-522 will show up on our ballots next November. It behooves us to educate ourselves about this important issue.
A majority of Americans favor labeling GMOs According to a poll taken two weeks ago by the Huffington Post, 82% of Americans think that GMOs should be labeled, 9% believe they don't need to be labeled and 8% aren't sure. The poll also showed that, while most people think that GMOs should be labeled, many people don't really know too much about GMOs.
What is a GMO?A genetically modified organism, or GMO is the term commonly used for crops that have been genetically engineered (GE) to produce some desired trait. The first GE crops were tobacco plants modified in 1986 to be resistant to direct application of herbicides. The following year, tobacco plants were engineered to resist insects. There followed a host of field trials to also develop plants resistant to viral and fungal diseases and to modify traits such as ripening, starch content and so on. In 1995 the FDA approved GE corn, soy, cotton, canola, potato, squash and tomato for commercialization and the amount of GE crops since then has been steadily increasing. Most often the genes are altered to render the plant resistant to either insects or herbicides.
How are plants engineered to be insect resistant (IR)?Sections of the DNA from the bacteria known as Bacillus thuringiensis (Bt)are isolated and inserted into the plant cells by a process known as genetic transformation. The entire plant is then regenerated from the transgenic plant cells. There are thousands of different Bt strains that produce protein crystals toxic to insect pests. Particular strains are chosen to target specific plant pests. The resulting plant contains the Bt toxin in its cells. When the plant is eaten by the target insect the toxin binds to receptors in the insect's gut, causing the gut wall to break down and allowing toxin spores and normal gut bacteria to enter the body. As spores and bacteria proliferate in the body, the insect dies.
How are plants engineered to be herbicide tolerant (HT)?Micro-organisms are identified that are tolerant of the active chemical in the herbicide. In the case of glyphosate, the active ingredient in Roundup, glyphosate-resistant enzymes are isolated from a strain of Agrobacterium. These are inserted into the genes of the plant via a multi-step process resulting in a plant that can withstand direct application of the herbicide.
The stance taken by Monsanto, Dow and the other peddlers of both chemicals and genetically engineered seeds is that GMO food is “identical to non-GMO products.” They claim that genetic engineering is no different than plant hybridization, which has been practiced for centuries. It is the reason they gave, and the EPA accepted, for not having to submit GMO food to rigorous testing to obtain EPA approval. It's up to the companies that manufacture GMOs to research and determine the

safety of their products.
Not only are the bacteria genes themselves potentially toxic, but the plants can be sprayed directly with herbicides, the herbicide-resistant plants absorb the poisons and we eat them. It's difficult to understand how this can be considered “essentially” the same as plant hybridization.
GMOs are prevalent in the U.S. food supply
Chances are that corn chip you are eating has been genetically engineered. Even more so if it has been fried in canola, corn, cottonseed, or soy oil. Most residents of the U.S. are consuming large quantities of Genetically Modified Organisms (GMOs) in their food. GMOs were first approved by the FDA for food crops in 1994. Since then the number of FDA approvals for GMO crops has steadily increased.
How are transgenic or genetically engineered (GE) crops approved?The USDA/Animal and Plant Health Inspection Service (APHIS) issues permits for field trials, and later for general environmental release of GE crops. If the GE crop contains a pesticide, as is the case for Bt crops, approval is also required by the Environmental Protection Agency. If the product from a transgenic crop is for food or feed use, the Food and Drug Administration (FDA) must give final approval before the crops can be grown commercially.
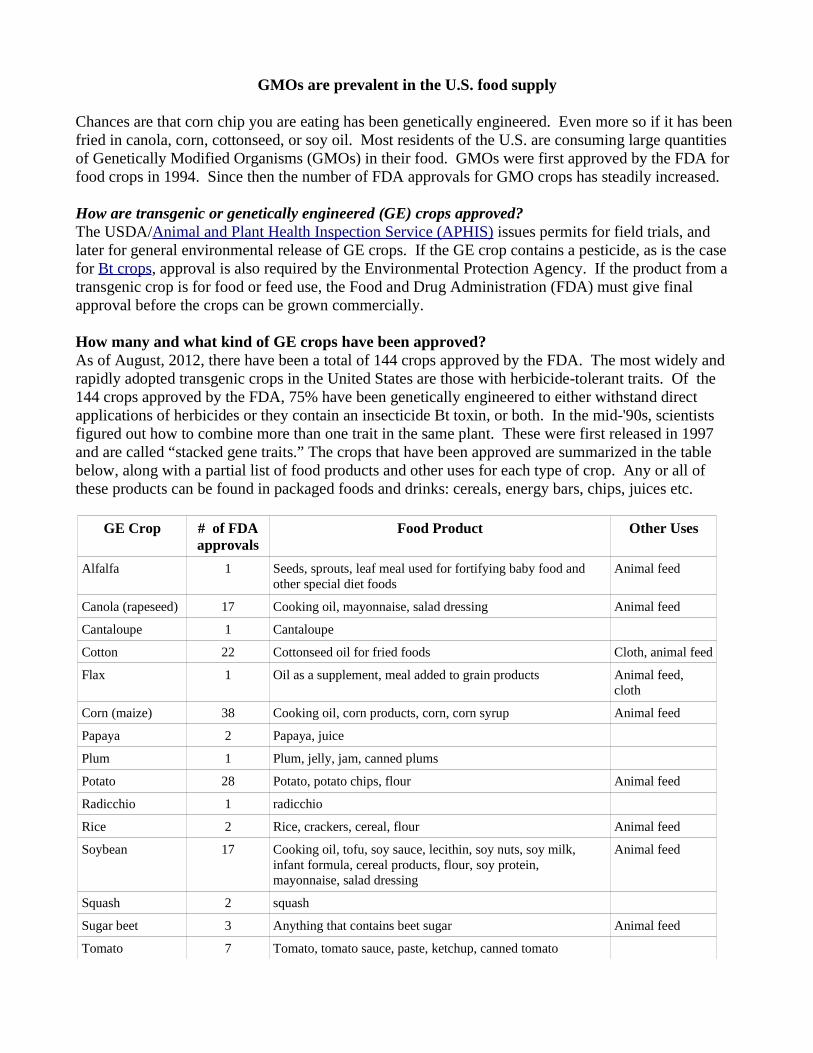
How many and what kind of GE crops have been approved?As of August, 2012, there have been a total of 144 crops approved by the FDA. The most widely and rapidly adopted transgenic crops in the United States are those with herbicide-tolerant traits. Of the 144 crops approved by the FDA, 75% have been genetically engineered to either withstand direct applications of herbicides or they contain an insecticide Bt toxin, or both. In the mid-'90s, scientists figured out how to combine more than one trait in the same plant. These were first released in 1997 and are called “stacked gene traits.” The crops that have been approved are summarized in the table below, along with a partial list of food products and other uses for each type of crop. Any or all of these products can be found in packaged foods and drinks: cereals, energy bars, chips, juices etc.
GE Crop # of FDA approvals
Food Product Other Uses
Alfalfa 1 Seeds, sprouts, leaf meal used for fortifying baby food and other special diet foods
Animal feed
Canola (rapeseed) 17 Cooking oil, mayonnaise, salad dressing Animal feed
Cantaloupe 1 Cantaloupe
Cotton 22 Cottonseed oil for fried foods Cloth, animal feed
Flax 1 Oil as a supplement, meal added to grain products Animal feed, cloth
Corn (maize) 38 Cooking oil, corn products, corn, corn syrup Animal feed
Papaya 2 Papaya, juice
Plum 1 Plum, jelly, jam, canned plums
Potato 28 Potato, potato chips, flour Animal feed
Radicchio 1 radicchio
Rice 2 Rice, crackers, cereal, flour Animal feed
Soybean 17 Cooking oil, tofu, soy sauce, lecithin, soy nuts, soy milk, infant formula, cereal products, flour, soy protein, mayonnaise, salad dressing
Animal feed
Squash 2 squash
Sugar beet 3 Anything that contains beet sugar Animal feed
Tomato 7 Tomato, tomato sauce, paste, ketchup, canned tomato

Wheat 1 Flour
Source: FDA: Completed consultations on bioengineered foods
How prevalent are these transgenic crops in the food supply?
The USDA estimates that in 2012, 93% of all soy, 88% of the corn and 94% of the cotton grown in the U.S. was genetically engineered. The USDA only collects GE data on these three crops. The figure below shows the percent change of GE crops planted since 1996
1996-1999 data: USDA Agricultural Economic Report No. (AER-810) 67 pp, May 2002 2000-2012 data: USDA:NASS National Agricultural Statistics Service
It could be argued that not all of these crops are grown for human consumption. Some are grown for animal feed. But the percentage of the crops grown for animal feed are still in the food supply in the form of meat, eggs, milk and milk products. Some of these crops are grown for bio-fuels and textiles. But as long as the amount used for non-food products are taken randomly from the supply, the percentage does not change. Only if most or all of the GE corn and soy are used for bio-fuels, for example, would the overall percentage change. The same is true for the cotton.
Are you eating GMOs? You have been eating GMOs in steadily increasing amounts since 1996. If your diet consists of a lot of corn, soy, potato, sugar, or packaged foods, you are eating a great deal of GMOs.
19961997
19981999
20002001
20022003
20042005
20062007
20082009
20102011
2012
0
10
20
30
40
50
60
70
80
90
100
Percent of GE crops grown in U.S.
% GE corn & soy% GE soy% GE cotton% GE corn
Year
Pe
rce
nt
GMO crops increase pesticide use
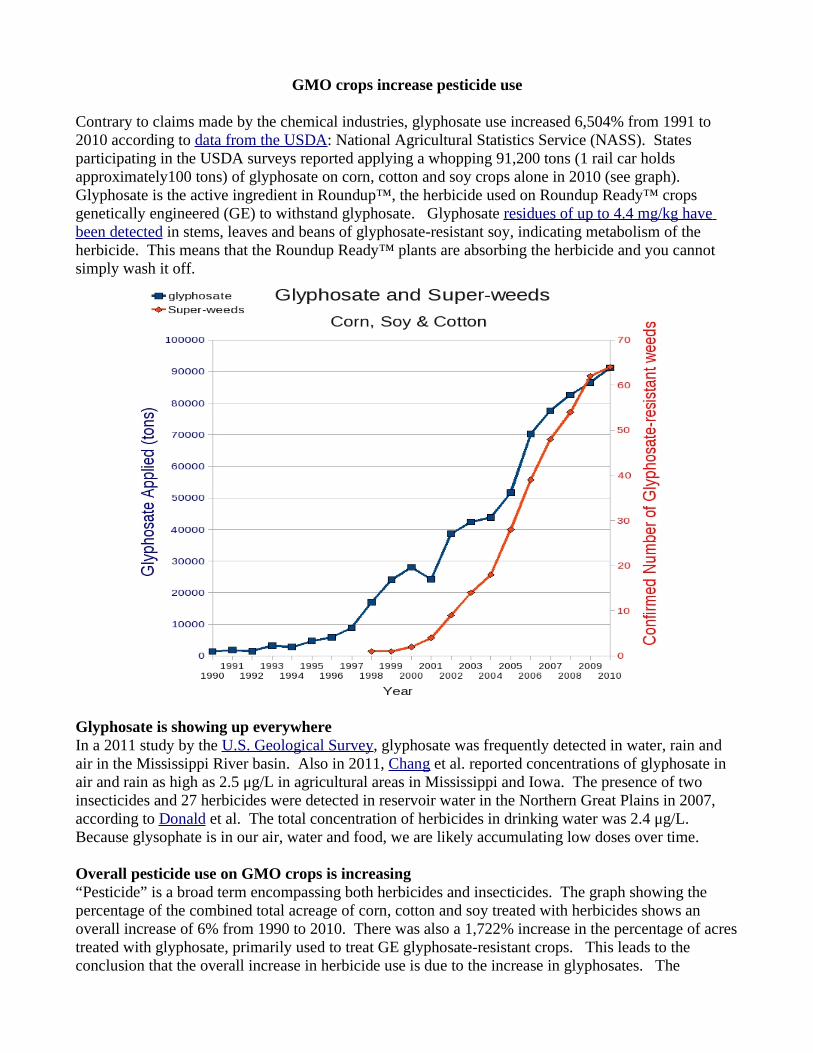
Contrary to claims made by the chemical industries, glyphosate use increased 6,504% from 1991 to 2010 according to data from the USDA: National Agricultural Statistics Service (NASS). States participating in the USDA surveys reported applying a whopping 91,200 tons (1 rail car holds approximately100 tons) of glyphosate on corn, cotton and soy crops alone in 2010 (see graph). Glyphosate is the active ingredient in Roundup™, the herbicide used on Roundup Ready™ crops genetically engineered (GE) to withstand glyphosate. Glyphosate residues of up to 4.4 mg/kg have been detected in stems, leaves and beans of glyphosate-resistant soy, indicating metabolism of the herbicide. This means that the Roundup Ready™ plants are absorbing the herbicide and you cannot simply wash it off.
Glyphosate is showing up everywhereIn a 2011 study by the U.S. Geological Survey, glyphosate was frequently detected in water, rain and air in the Mississippi River basin. Also in 2011, Chang et al. reported concentrations of glyphosate in air and rain as high as 2.5 μg/L in agricultural areas in Mississippi and Iowa. The presence of two insecticides and 27 herbicides were detected in reservoir water in the Northern Great Plains in 2007, according to Donald et al. The total concentration of herbicides in drinking water was 2.4 μg/L. Because glysophate is in our air, water and food, we are likely accumulating low doses over time.
Overall pesticide use on GMO crops is increasing“Pesticide” is a broad term encompassing both herbicides and insecticides. The graph showing the percentage of the combined total acreage of corn, cotton and soy treated with herbicides shows an overall increase of 6% from 1990 to 2010. There was also a 1,722% increase in the percentage of acres treated with glyphosate, primarily used to treat GE glyphosate-resistant crops. This leads to the conclusion that the overall increase in herbicide use is due to the increase in glyphosates. The
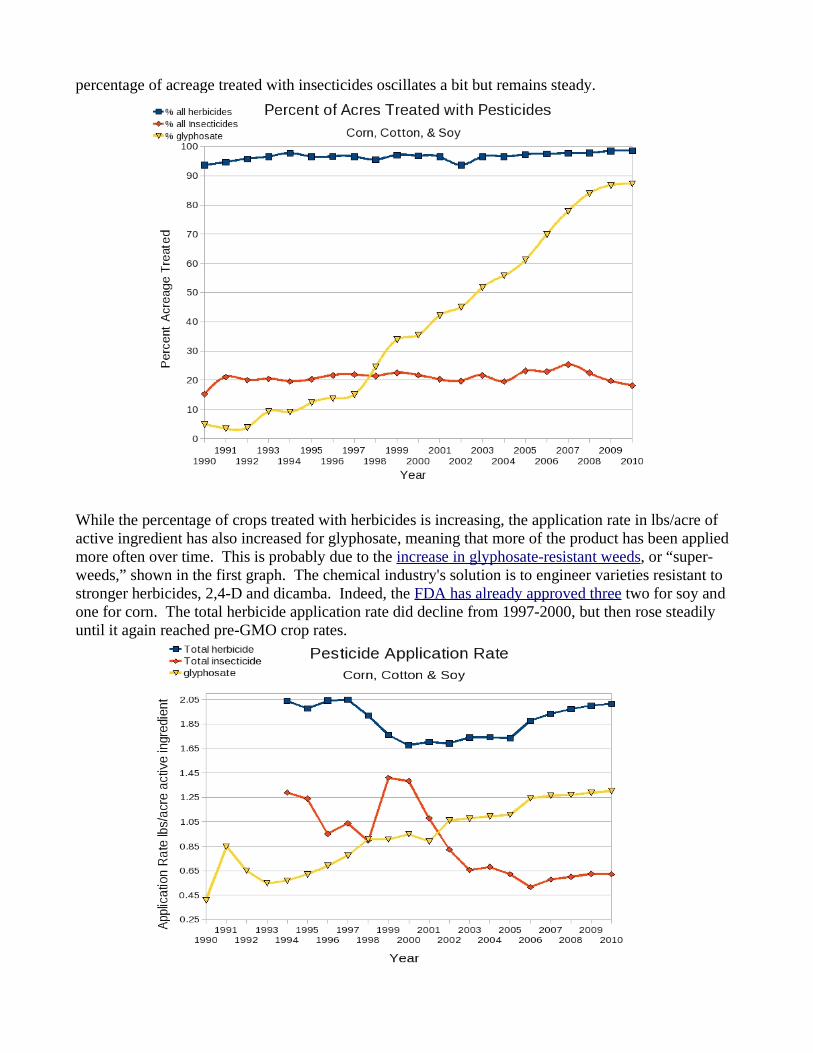
percentage of acreage treated with insecticides oscillates a bit but remains steady.
While the percentage of crops treated with herbicides is increasing, the application rate in lbs/acre of active ingredient has also increased for glyphosate, meaning that more of the product has been applied more often over time. This is probably due to the increase in glyphosate-resistant weeds, or “super-weeds,” shown in the first graph. The chemical industry's solution is to engineer varieties resistant to stronger herbicides, 2,4-D and dicamba. Indeed, the FDA has already approved three two for soy and one for corn. The total herbicide application rate did decline from 1997-2000, but then rose steadily until it again reached pre-GMO crop rates.
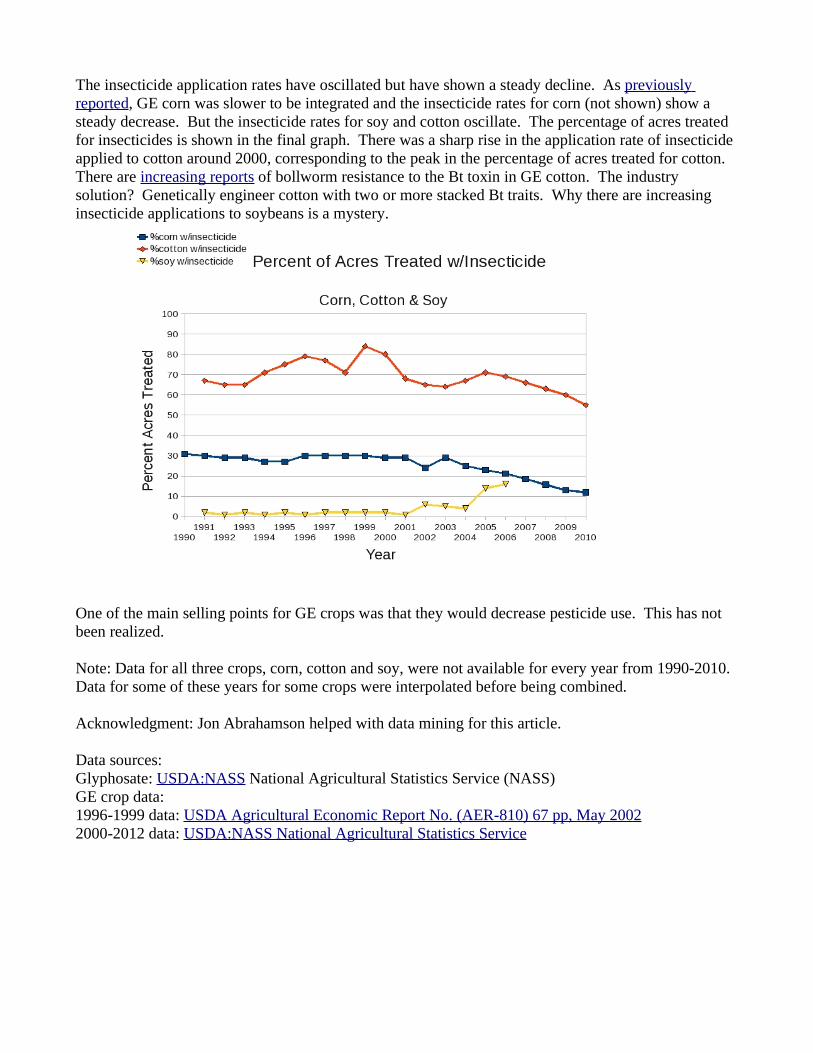
The insecticide application rates have oscillated but have shown a steady decline. As previously reported, GE corn was slower to be integrated and the insecticide rates for corn (not shown) show a steady decrease. But the insecticide rates for soy and cotton oscillate. The percentage of acres treated for insecticides is shown in the final graph. There was a sharp rise in the application rate of insecticide applied to cotton around 2000, corresponding to the peak in the percentage of acres treated for cotton. There are increasing reports of bollworm resistance to the Bt toxin in GE cotton. The industry solution? Genetically engineer cotton with two or more stacked Bt traits. Why there are increasing insecticide applications to soybeans is a mystery.
One of the main selling points for GE crops was that they would decrease pesticide use. This has not been realized.
Note: Data for all three crops, corn, cotton and soy, were not available for every year from 1990-2010. Data for some of these years for some crops were interpolated before being combined.
Acknowledgment: Jon Abrahamson helped with data mining for this article.
Data sources:Glyphosate: USDA:NASS National Agricultural Statistics Service (NASS)GE crop data:1996-1999 data: USDA Agricultural Economic Report No. (AER-810) 67 pp, May 20022000-2012 data: USDA:NASS National Agricultural Statistics Service
Data trends show correlations between increases in organ diseases and GMOs
Prevalence and incidence data show correlations between diseases of the organs and the increase in Genetically Modified Organisms (GMOs) in the food supply, along with the increase in glyphosate-based herbicide applications (see slide show). More and more studies have revealed carcinogenic and endocrine disrupting effects of Roundup at lower doses than those authorized for residues found in Genetically Modified Organisms (see notes below).
What is an endocrine disruptor?
The endocrine system controls the body's chemical messages through hormones. Hormones are secreted directly into the blood by the endocrine glands: pineal, hypothalmus, pituitary, adrenal, thyroid, thymus, pancreas, ovaries and testes. The glands release carefully measured amounts of chemicals into the bloodstream to regulate important functions including growth and development, reproduction, healthy weight, mood and organ performance. An endocrine disruptor is a chemical that either mimics or blocks hormones and disrupts the body's normal functions. This disruption can happen through altering normal hormone levels, halting or stimulating the production of hormones, or interacting directly with the organ the hormone was meant to regulate. Because hormones work at very small doses, endocrine disruption can occur from low-dose exposure to hormonally active chemicals. Low doses over long periods of time may lead to very serious illnesses.
What are the effects of endocrine disruption?
Endocrine disruptors can lead to failure in all systems in the body that are controlled by hormones. Imbalances and malfunctions of the endocrine system can lead to diabetes, kidney disease, hypertension, obesity, osteoporosis, Cushing's syndrome, hypo- and hyperthyroidism, infertility, birth defects, erectile dysfunction, cancer (breast, prostate, liver, brain, thyroid, non-Hodgkin's lymphoma), sexual development problems, neurological disorders (learning disabilities, attention deficit disorder, autism, dementia, Alzheimer's, Parkinson's, schizophrenia) among others. Endocrine disruptors are especially damaging to growth in fetuses, babies and children.
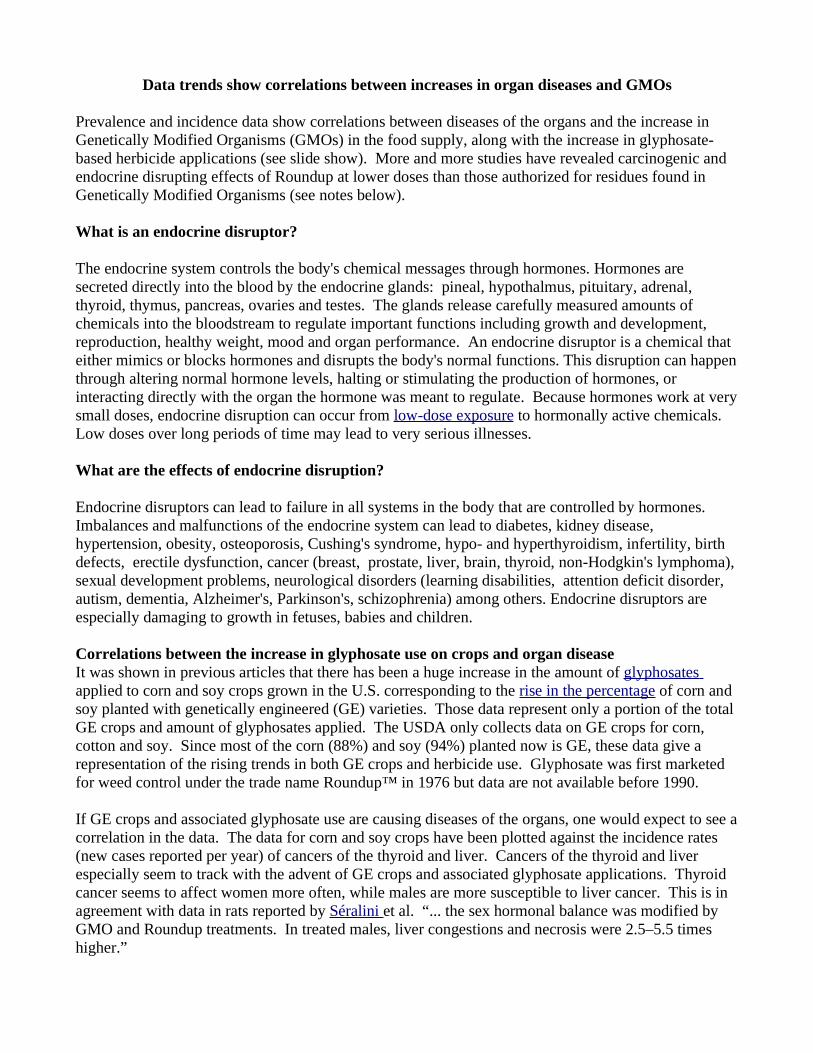
Correlations between the increase in glyphosate use on crops and organ diseaseIt was shown in previous articles that there has been a huge increase in the amount of glyphosates applied to corn and soy crops grown in the U.S. corresponding to the rise in the percentage of corn and soy planted with genetically engineered (GE) varieties. Those data represent only a portion of the total GE crops and amount of glyphosates applied. The USDA only collects data on GE crops for corn, cotton and soy. Since most of the corn (88%) and soy (94%) planted now is GE, these data give a representation of the rising trends in both GE crops and herbicide use. Glyphosate was first marketed for weed control under the trade name Roundup™ in 1976 but data are not available before 1990.
If GE crops and associated glyphosate use are causing diseases of the organs, one would expect to see a correlation in the data. The data for corn and soy crops have been plotted against the incidence rates (new cases reported per year) of cancers of the thyroid and liver. Cancers of the thyroid and liver especially seem to track with the advent of GE crops and associated glyphosate applications. Thyroid cancer seems to affect women more often, while males are more susceptible to liver cancer. This is in agreement with data in rats reported by Séralini et al. “... the sex hormonal balance was modified by GMO and Roundup treatments. In treated males, liver congestions and necrosis were 2.5–5.5 times higher.”
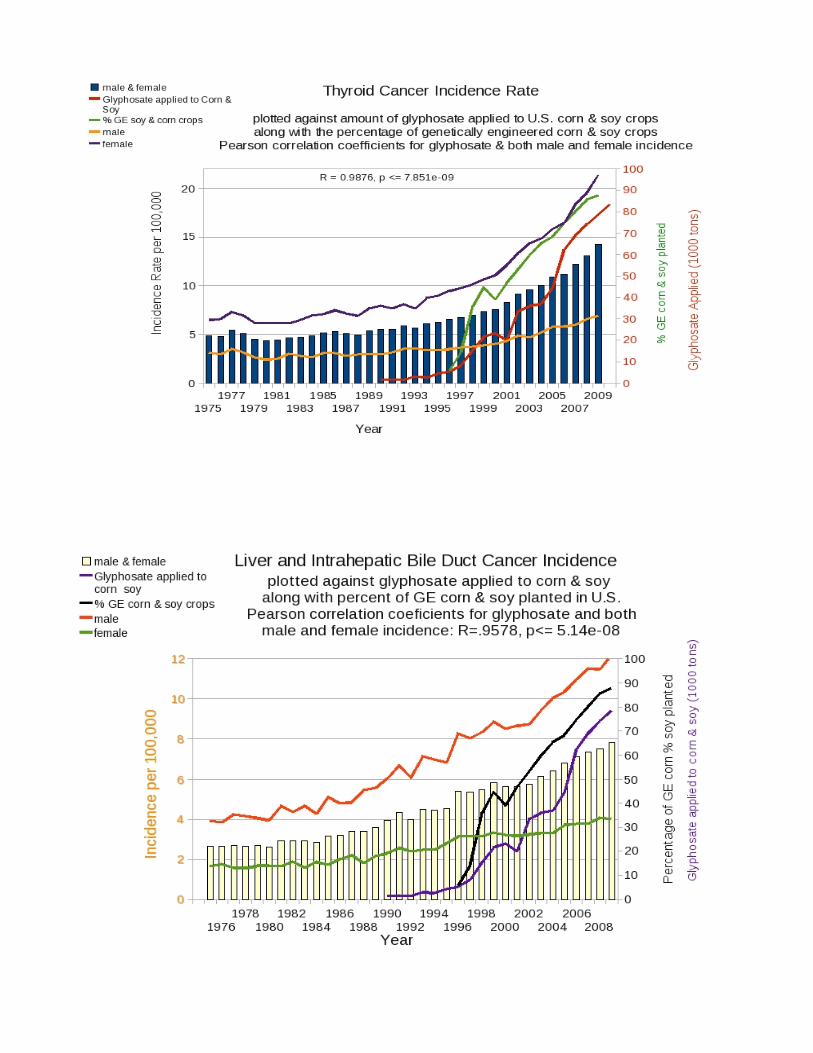
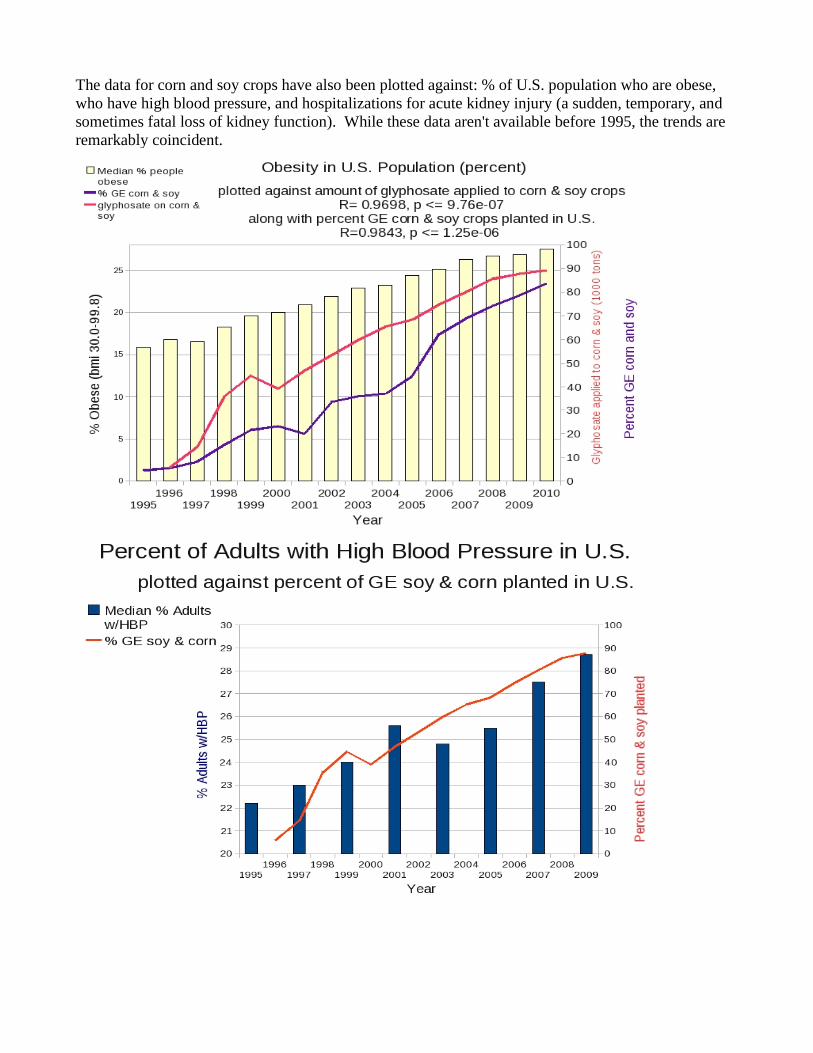
The data for corn and soy crops have also been plotted against: % of U.S. population who are obese, who have high blood pressure, and hospitalizations for acute kidney injury (a sudden, temporary, and sometimes fatal loss of kidney function). While these data aren't available before 1995, the trends are remarkably coincident.
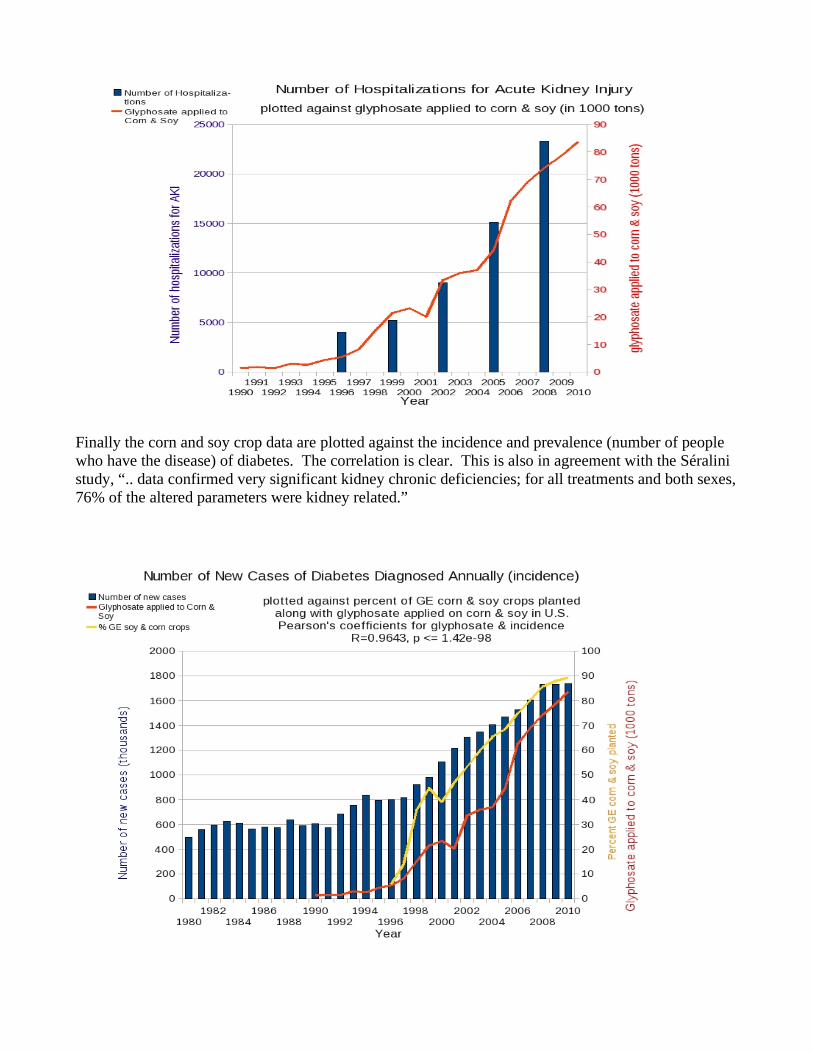
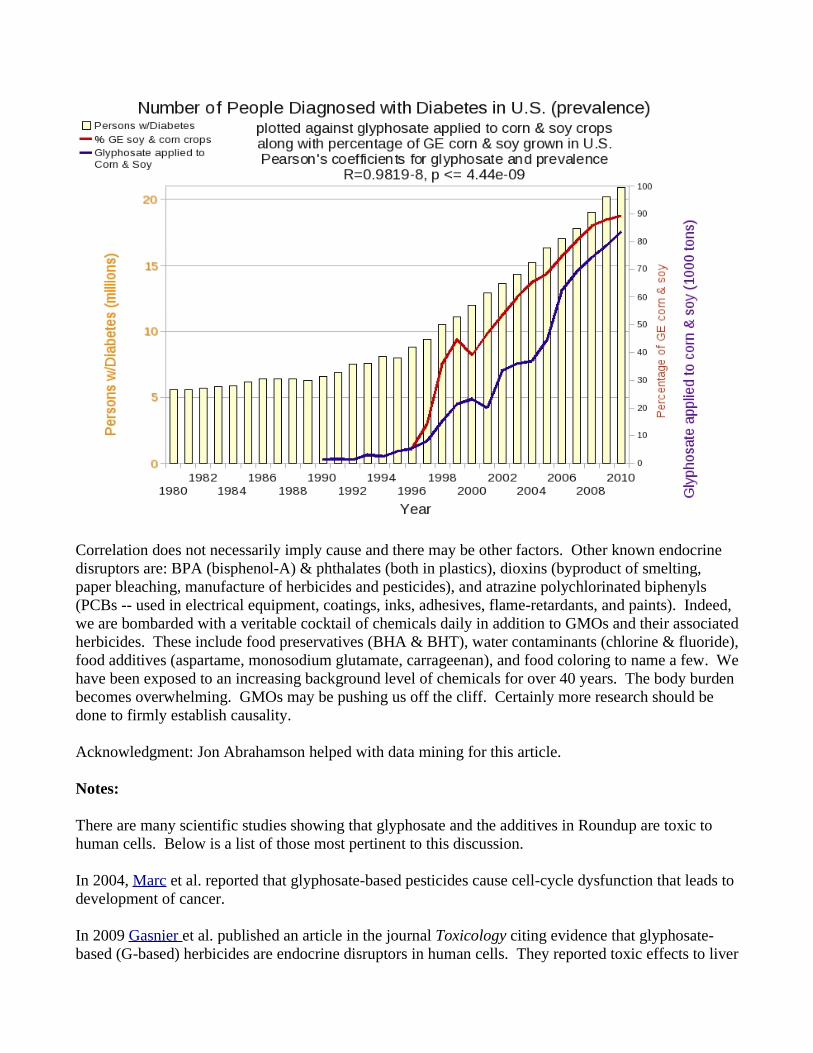
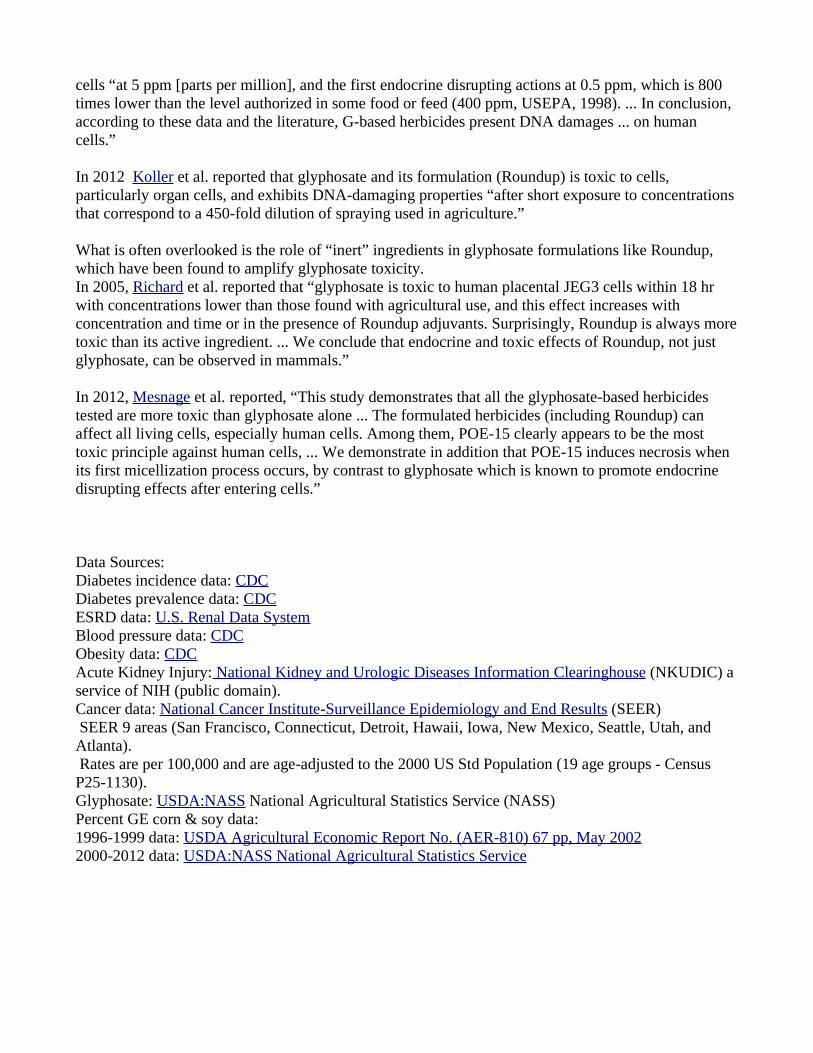
Finally the corn and soy crop data are plotted against the incidence and prevalence (number of people who have the disease) of diabetes. The correlation is clear. This is also in agreement with the Séralini study, “.. data confirmed very significant kidney chronic deficiencies; for all treatments and both sexes, 76% of the altered parameters were kidney related.”
Correlation does not necessarily imply cause and there may be other factors. Other known endocrine disruptors are: BPA (bisphenol-A) & phthalates (both in plastics), dioxins (byproduct of smelting, paper bleaching, manufacture of herbicides and pesticides), and atrazine polychlorinated biphenyls (PCBs -- used in electrical equipment, coatings, inks, adhesives, flame-retardants, and paints). Indeed, we are bombarded with a veritable cocktail of chemicals daily in addition to GMOs and their associated herbicides. These include food preservatives (BHA & BHT), water contaminants (chlorine & fluoride), food additives (aspartame, monosodium glutamate, carrageenan), and food coloring to name a few. We have been exposed to an increasing background level of chemicals for over 40 years. The body burden becomes overwhelming. GMOs may be pushing us off the cliff. Certainly more research should be done to firmly establish causality.
Acknowledgment: Jon Abrahamson helped with data mining for this article.
Notes:
There are many scientific studies showing that glyphosate and the additives in Roundup are toxic to human cells. Below is a list of those most pertinent to this discussion.
In 2004, Marc et al. reported that glyphosate-based pesticides cause cell-cycle dysfunction that leads to development of cancer.
In 2009 Gasnier et al. published an article in the journal Toxicology citing evidence that glyphosate-based (G-based) herbicides are endocrine disruptors in human cells. They reported toxic effects to liver
cells “at 5 ppm [parts per million], and the first endocrine disrupting actions at 0.5 ppm, which is 800 times lower than the level authorized in some food or feed (400 ppm, USEPA, 1998). ... In conclusion, according to these data and the literature, G-based herbicides present DNA damages ... on human cells.”
In 2012 Koller et al. reported that glyphosate and its formulation (Roundup) is toxic to cells, particularly organ cells, and exhibits DNA-damaging properties “after short exposure to concentrations that correspond to a 450-fold dilution of spraying used in agriculture.”
What is often overlooked is the role of “inert” ingredients in glyphosate formulations like Roundup, which have been found to amplify glyphosate toxicity. In 2005, Richard et al. reported that “glyphosate is toxic to human placental JEG3 cells within 18 hr with concentrations lower than those found with agricultural use, and this effect increases with concentration and time or in the presence of Roundup adjuvants. Surprisingly, Roundup is always more toxic than its active ingredient. ... We conclude that endocrine and toxic effects of Roundup, not just glyphosate, can be observed in mammals.”
In 2012, Mesnage et al. reported, “This study demonstrates that all the glyphosate-based herbicides tested are more toxic than glyphosate alone ... The formulated herbicides (including Roundup) can affect all living cells, especially human cells. Among them, POE-15 clearly appears to be the most toxic principle against human cells, ... We demonstrate in addition that POE-15 induces necrosis when its first micellization process occurs, by contrast to glyphosate which is known to promote endocrine disrupting effects after entering cells.”
Data Sources:Diabetes incidence data: CDCDiabetes prevalence data: CDCESRD data: U.S. Renal Data SystemBlood pressure data: CDCObesity data: CDCAcute Kidney Injury: National Kidney and Urologic Diseases Information Clearinghouse (NKUDIC) a service of NIH (public domain).Cancer data: National Cancer Institute-Surveillance Epidemiology and End Results (SEER) SEER 9 areas (San Francisco, Connecticut, Detroit, Hawaii, Iowa, New Mexico, Seattle, Utah, and Atlanta). Rates are per 100,000 and are age-adjusted to the 2000 US Std Population (19 age groups - Census P25-1130).Glyphosate: USDA:NASS National Agricultural Statistics Service (NASS)Percent GE corn & soy data:1996-1999 data: USDA Agricultural Economic Report No. (AER-810) 67 pp, May 20022000-2012 data: USDA:NASS National Agricultural Statistics Service
Mounting evidence that GMO crops can cause infertility and birth defects
The endocrine disrupting properties of glyphosate can lead to reproductive problems: infertility, miscarriage, birth defects, and sexual development (see notes). Fetuses, infants and children are especially susceptible because they are continually experiencing growth and hormonal changes. For optimal growth and development, it is crucial that their hormonal system is functioning properly. There are increasing reports of glyphosates and glyphosate formulations causing sexual dysfunction, low birth weight, fewer births and sterility in laboratory animals, farm animals and humans (see notes). A Russian study found that feeding hamsters GMO soy resulted in complete sterility after two or three generations. Glyphosate was first marketed in 1976 and its use has exploded since the advent of glyphosate-resistant, genetically engineered (GE) crops in 1995. The herbicide-resistant GE crops absorb glyphosate through direct application and from the soil and it cannot be washed off. It is in the food .
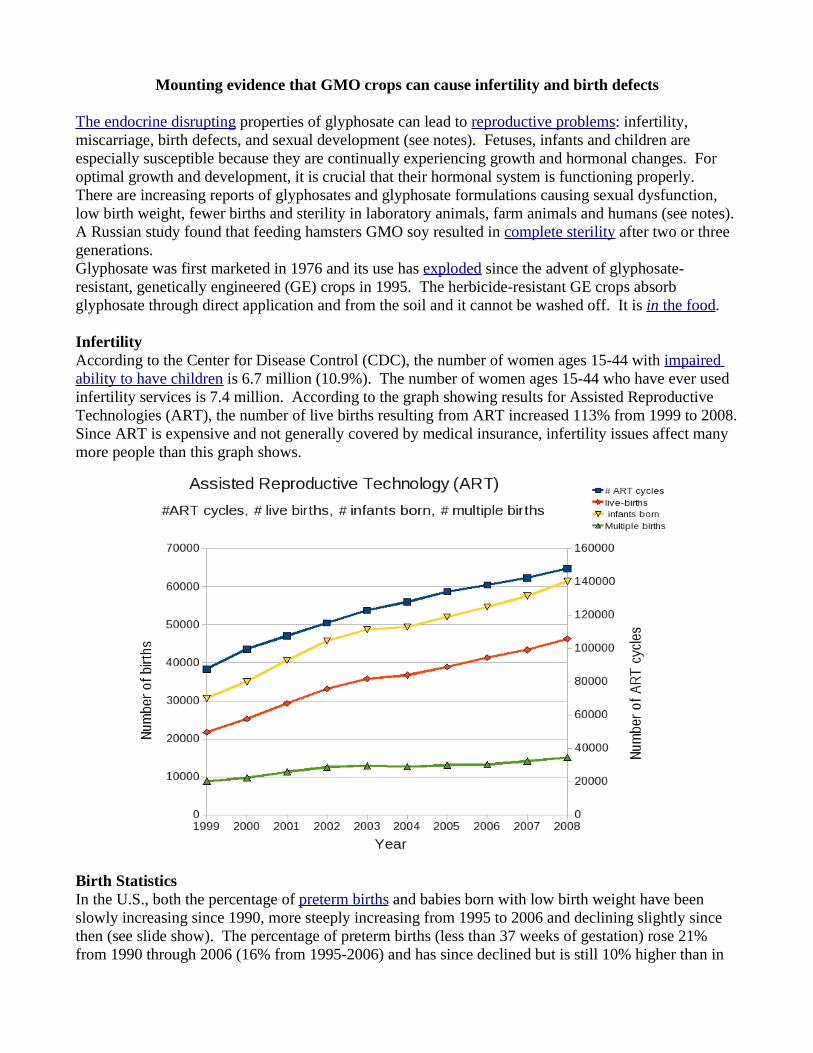
InfertilityAccording to the Center for Disease Control (CDC), the number of women ages 15-44 with impaired ability to have children is 6.7 million (10.9%). The number of women ages 15-44 who have ever used infertility services is 7.4 million. According to the graph showing results for Assisted Reproductive Technologies (ART), the number of live births resulting from ART increased 113% from 1999 to 2008. Since ART is expensive and not generally covered by medical insurance, infertility issues affect many more people than this graph shows.
Birth StatisticsIn the U.S., both the percentage of preterm births and babies born with low birth weight have been slowly increasing since 1990, more steeply increasing from 1995 to 2006 and declining slightly since then (see slide show). The percentage of preterm births (less than 37 weeks of gestation) rose 21% from 1990 through 2006 (16% from 1995-2006) and has since declined but is still 10% higher than in
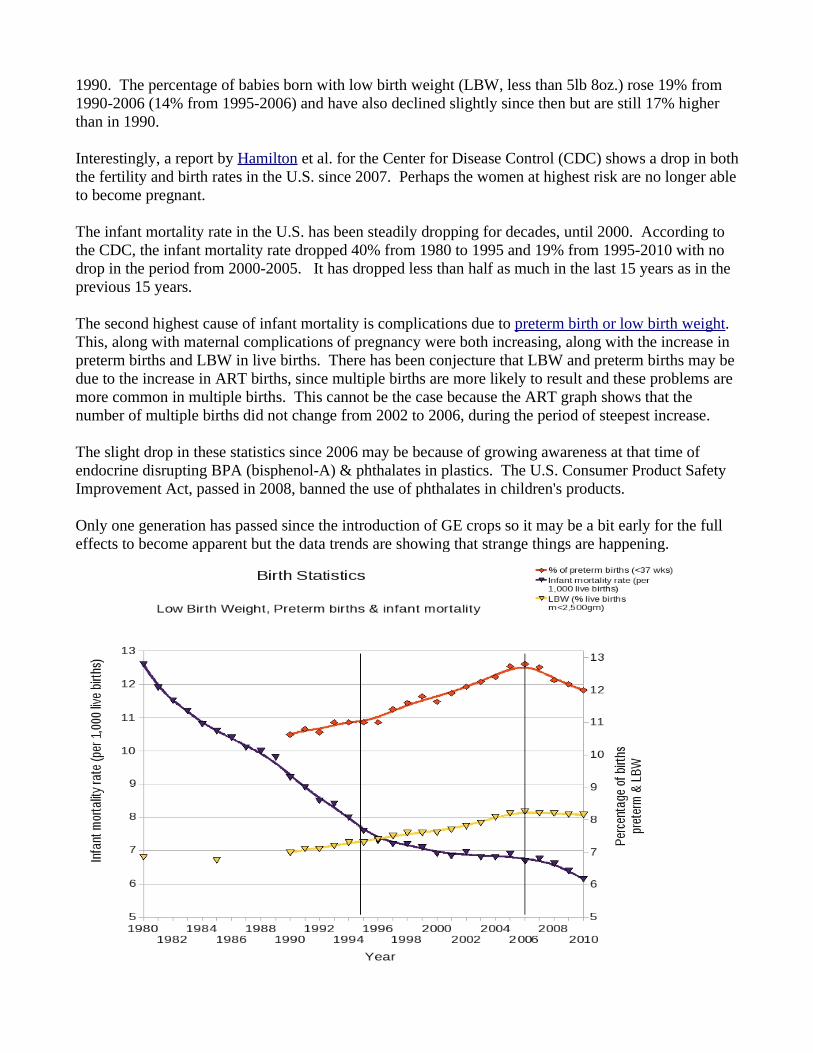
1990. The percentage of babies born with low birth weight (LBW, less than 5lb 8oz.) rose 19% from 1990-2006 (14% from 1995-2006) and have also declined slightly since then but are still 17% higher than in 1990.
Interestingly, a report by Hamilton et al. for the Center for Disease Control (CDC) shows a drop in both the fertility and birth rates in the U.S. since 2007. Perhaps the women at highest risk are no longer able to become pregnant.
The infant mortality rate in the U.S. has been steadily dropping for decades, until 2000. According to the CDC, the infant mortality rate dropped 40% from 1980 to 1995 and 19% from 1995-2010 with no drop in the period from 2000-2005. It has dropped less than half as much in the last 15 years as in the previous 15 years.
The second highest cause of infant mortality is complications due to preterm birth or low birth weight. This, along with maternal complications of pregnancy were both increasing, along with the increase in preterm births and LBW in live births. There has been conjecture that LBW and preterm births may be due to the increase in ART births, since multiple births are more likely to result and these problems are more common in multiple births. This cannot be the case because the ART graph shows that the number of multiple births did not change from 2002 to 2006, during the period of steepest increase.
The slight drop in these statistics since 2006 may be because of growing awareness at that time of endocrine disrupting BPA (bisphenol-A) & phthalates in plastics. The U.S. Consumer Product Safety Improvement Act, passed in 2008, banned the use of phthalates in children's products.
Only one generation has passed since the introduction of GE crops so it may be a bit early for the full effects to become apparent but the data trends are showing that strange things are happening.
Birth defectsThe leading cause of infant mortality in the U.S. is congenital birth defects. There have been reports that glyphosate is toxic to placental, umbilical and embryonic cells (see notes). The placenta, via the umbilical chord, is responsible for delivering vital nutrients and eliminating waste products to and from the fetus. Once the placenta and/or umbilical has been damaged or destroyed, the result can be miscarriage or birth defects. Birth defects due to exposure to glyphosate and glyphosate formulations have been reported for amphibians and for humans (see notes).
Research at Johns Hopkins University shows that women with thyroid disease are at a high risk of delivering infants with birth defects. Strong correlation was shown between cancer of the thyroid and glyphosate use on corn and soy crops and that thyroid cancer affects women more than men.
Birth defects have not been increasing in the U.S., but in the soy-producing regions of Argentina, they have been skyrocketing. In 2010 the University of Cordoba released a report showing that the incidence rate of birth defects in South America has increased by 347% from 1997 to 2008, which they claim is linked to areal spraying of glyphosate on soy crops. People in Argentina began reporting problems in 2002, two years after the first big harvests of GM Roundup Ready soy. “San Jorge in Santa Fe, San Nicolás in Buenos Aires, Ituzaingó neighborhood in Córdoba, and La Leonesa in Chaco, are only some of the places where the increased number of cancer cases, birth defects, reproductive and endocrine disorders, have been suffered and detected ever since systematic pesticide spraying has become commonplace.”
There are many endocrine disrupting chemicals in our environment and in our food. The huge increase in the amount of glyphosate applied to GE food and feed crops has significantly increased our exposure to endocrine disrupting chemicals. Much more research is needed to study the effects.
Notes:Infertility and low birth rates:Laboratory animals:In 1995 Yousef et al. reported on toxic effects of glyphosate on semen characteristics in rabbits, “Pesticide treatment resulted in a decline in body weight, libido, ejaculate volume, sperm concentration, semen initial fructose and semen osmolality. This was accompanied with increases in the abnormal and dead sperm.”
In 2002 Markaverich et al. found that, “Housing adult rats on ground corncob bedding impedes male and female mating behavior and causes acyclicity in females.”
In 2008, Austrian researchers found that mice fed GM corn produced fewer and smaller babies than those fed a non-GM diet.
In April 2010, a Russian study found that after feeding hamsters GM soy for two years over three generations, most were sterile by the third generation.
2011 Siepmann et al. reported, “Hypogonadism and erectile dysfunction associated with soy product consumption,” in a 19-year old male (who was also diabetic). Unfortunately, they didn't make the connection that the soy was almost certainly GE.
In 2012 Antoniou et al. published a review of the evidence of the reproductive toxicity of glyphosate herbicides and concluded that a new and transparent risk assessment needs to be conducted.
In 2012 Irina Ermakova reported low birth weight and a 55.6% mortality rate in the babies of rats fed GMO soy compared to 6.8% in the control group.
Farm animals:An Iowa pig farmer reports sterility and false pregnancies in pigs fed GMO corn.ADanish pig farmer reports birth defects, infertility and low birth rate in pigs fed GMO corn. (English version).
Humans:In 2001 Arbuckle et al, reported on the effect of pesticide exposure on the risk of spontaneous abortion in Ontario. “For late abortions, preconception exposure to glyphosate ... was associated with elevated risks. Postconception exposures were generally associated with late spontaneous abortions. Older maternal age (> 34 years of age) was the strongest risk factor for spontaneous abortions, and we observed several interactions between pesticides in the older age group.”
Birth defects:Cells:In 2005, Richard et al. reported that “glyphosate is toxic to human placental JEG3 cells within 18 hr with concentrations lower than those found with agricultural use, and this effect increases with concentration and time or in the presence of Roundup adjuvants.”
In 2009, Benachour et al. evaluated the toxicity of four glyphosate (G)-based herbicides in Roundup formulations on three different human cell types using a dilution far below agricultural recommendations and corresponds to low levels of residues in food or feed. They reported that glyphosate formulations induce apoptosis and necrosis in human umbilical, embryonic, and placental cells.
Amphibians:In 2010, Paganelli et al. injected low doses (lower than levels used in fumigating) of glyphosate into amphibian embryos and recorded brain, intestinal and heart defects in the fetuses. Effects included reduced head size, genetic alterations in the central nervous system, increased death of cells that help form the skull, deformed cartilage, eye defects, and undeveloped kidneys. In addition, the glyphosate was not breaking down in the cells, but was accumulating. According to the authors these results are “completely comparable to what would happen in the development of the human embryo.”
Humans:In 2009, Mesnage et al. reported two cases of birth defects in the same family in France after multiple pesticide exposure. “Many pesticides were used by this family around pregnancies. The father sprayed, without protection, more than 1.3 tons of pesticides per year including 300 liters of glyphosate based herbicides.”
In 2009, Winchester et al., reported, “Elevated concentrations of agrichemicals in surface water in April–July coincided with higher risk of birth defects in live births with LMPs [last menstrual periods] April–July.”
Data sources:ART data: CDC Infant mortality data: CDC LBW and preterm birth data: CDC and CDC Interactive tables

Data show correlations between increase in neurological diseases and GMOs
The endocrine disrupting properties of glyphosate can lead to neurological disorders (learning disabilities (LD), attention deficit hyperactive disorder (ADHD), autism, dementia, Alzheimer's, schizophrenia and bipolar disorder). Those most susceptible are children and the elderly.
Glyphosate was first marketed in 1976 and its use has exploded since the advent of glyphosate-resistant, genetically engineered (GE) crops in 1995. The herbicide-resistant GE crops absorb glyphosate through direct application and from the soil and it cannot be washed off. It is in the food . Glyphosate has also been found in rivers, streams, air and rain.
The thyroid is an endocrine organ that secretes the thyroid hormone. Thyroid dysfunction has been identified with mood disorders. Depression is frequently associated with low levels of thyroid hormone (hypothyroidism), while mood elevation is often associated with high levels of thyroid hormone (hyperthyroidism). An endocrine disrupting chemical (EDC) can cause erratic behavior. Recent studies have shown links between food additives and neurotoxicity in cells and hyperactive behavior in children. Incidents have been reported of laboratory rats and farm animals exhibiting uncharacteristic aggressive and anti-social behavior on being fed a diet consisting of GMO soy or corn.
Many scientific studies have shown links between thyroid disruption and neurological diseases. “Thyroid hormones are critical for development of the fetal and neonatal brain, as well as for many other aspects of pregnancy and fetal growth. Hypothyroidism in either the mother or fetus frequently results in fetal disease; in humans, this includes a high incidence of mental retardation. ... numerous studies with rats, sheep and humans have reinforced this concept...” According to de Cock et al, “Perinatal exposure to EDCs appears to be associated with the occurrence of ASD [autism spectrum disorder] as well as ADHD. Disruption of thyroid hormone function ... may offer an explanation for the observed relations....” MacSweeney et al. report, “that the mothers of 104 schizophrenic patients had: (1) a significantly higher incidence of thyroid disease than a carefully matched control group; (2) significantly more abortions, still-births and greater infant mortality. The findings and possible relevance of thyroid disease to schizophrenia are discussed.” Strong correlation was shown between cancer of the thyroid and glyphosate use on corn and soy crops and that thyroid cancer affects women more than men. It seems that women are more sensitive to thyroid disruption.
The incidence and prevalence for neurological disorders have been skyrocketing. Data trends over time for neurological disorders are not readily available for two reasons: they are not as well-studied as other diseases (cancer, diabetes etc.), and the diagnostic methods keep changing. The experts argue over whether the increases are real, or a by-product of changes in diagnostics along with greater attention given to these disorders in recent times. For example, a former diagnosis of mental retardation might now result in a diagnosis of autism. Furthermore there is a large degree of overlap in symptoms. Typical manifestations of ADHD, such as distractibility or hyperactivity are also present in pediatric bipolar disorder, for example.
ChildrenADHD According to the New York Times, “an estimated 6.4 million children ages 4 through 17 had received an A.D.H.D. diagnosis at some point in their lives, a 16 percent increase since 2007 and a 41 percent rise in the past decade.” From the Center for Disease Control (CDC), “rates of ADHD diagnosis increased an average of 3% per year from 1997 to 2006 and an average of 5.5% per year from 2003 to 2007. ... It is not possible to tell whether this increase represents a change in the number of children who have ADHD, or a change in the number of children who were diagnosed.” It also
makes a great deal of difference who is doing the reporting: parents or doctors. The disorder affects boys more than girls. Whatever the numbers, there seems to be an increasing behavioral problem with our youth. Our solution is to give them more chemicals in the form of mood-altering drugs.
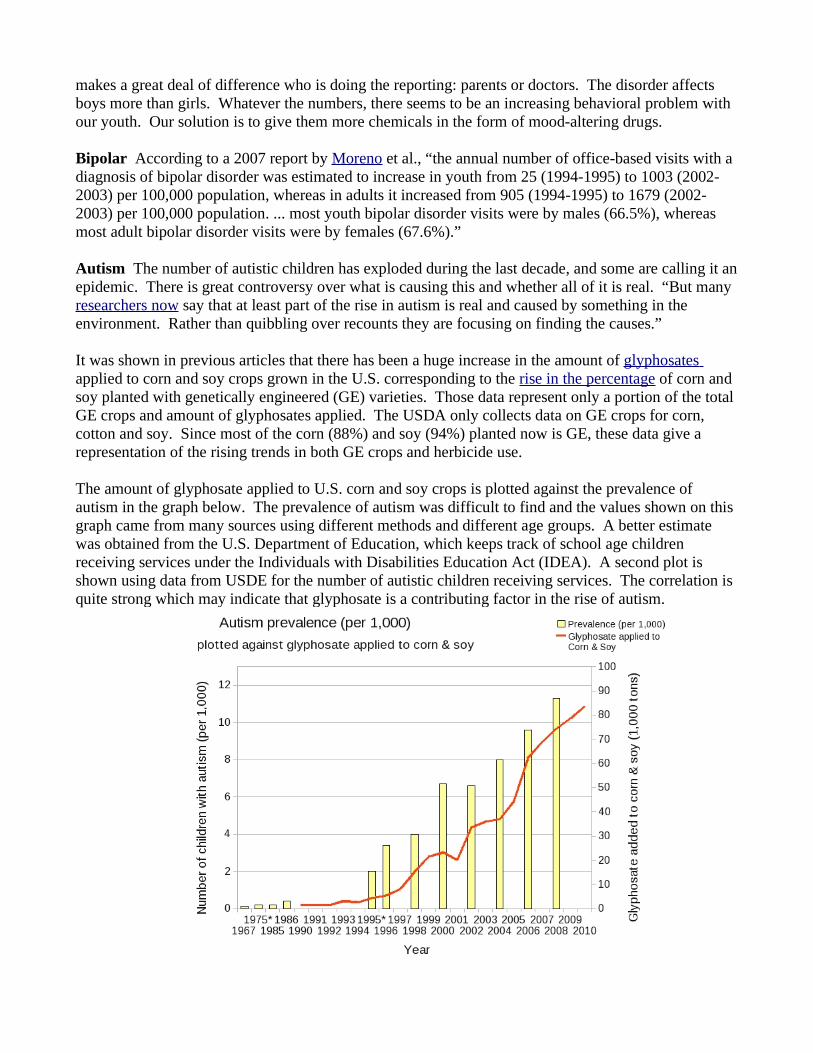
Bipolar According to a 2007 report by Moreno et al., “the annual number of office-based visits with a diagnosis of bipolar disorder was estimated to increase in youth from 25 (1994-1995) to 1003 (2002-2003) per 100,000 population, whereas in adults it increased from 905 (1994-1995) to 1679 (2002-2003) per 100,000 population. ... most youth bipolar disorder visits were by males (66.5%), whereas most adult bipolar disorder visits were by females (67.6%).” Autism The number of autistic children has exploded during the last decade, and some are calling it an epidemic. There is great controversy over what is causing this and whether all of it is real. “But many researchers now say that at least part of the rise in autism is real and caused by something in the environment. Rather than quibbling over recounts they are focusing on finding the causes.”
It was shown in previous articles that there has been a huge increase in the amount of glyphosates applied to corn and soy crops grown in the U.S. corresponding to the rise in the percentage of corn and soy planted with genetically engineered (GE) varieties. Those data represent only a portion of the total GE crops and amount of glyphosates applied. The USDA only collects data on GE crops for corn, cotton and soy. Since most of the corn (88%) and soy (94%) planted now is GE, these data give a representation of the rising trends in both GE crops and herbicide use.
The amount of glyphosate applied to U.S. corn and soy crops is plotted against the prevalence of autism in the graph below. The prevalence of autism was difficult to find and the values shown on this graph came from many sources using different methods and different age groups. A better estimate was obtained from the U.S. Department of Education, which keeps track of school age children receiving services under the Individuals with Disabilities Education Act (IDEA). A second plot is shown using data from USDE for the number of autistic children receiving services. The correlation is quite strong which may indicate that glyphosate is a contributing factor in the rise of autism.
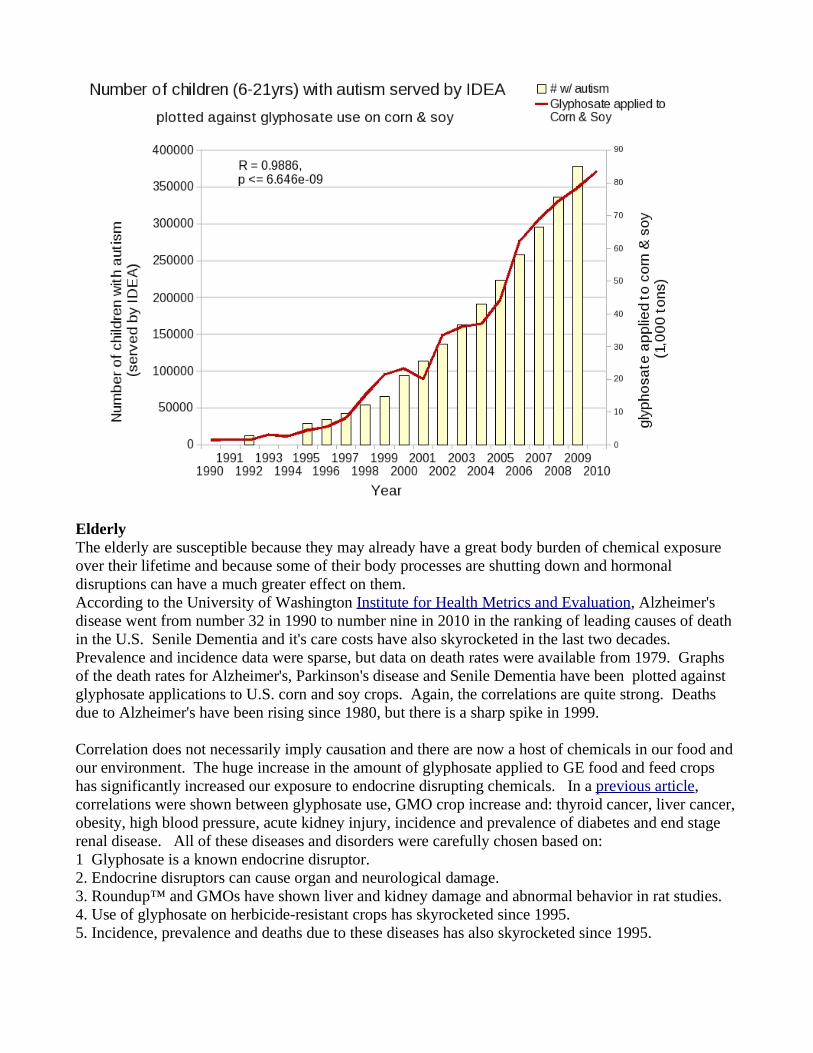
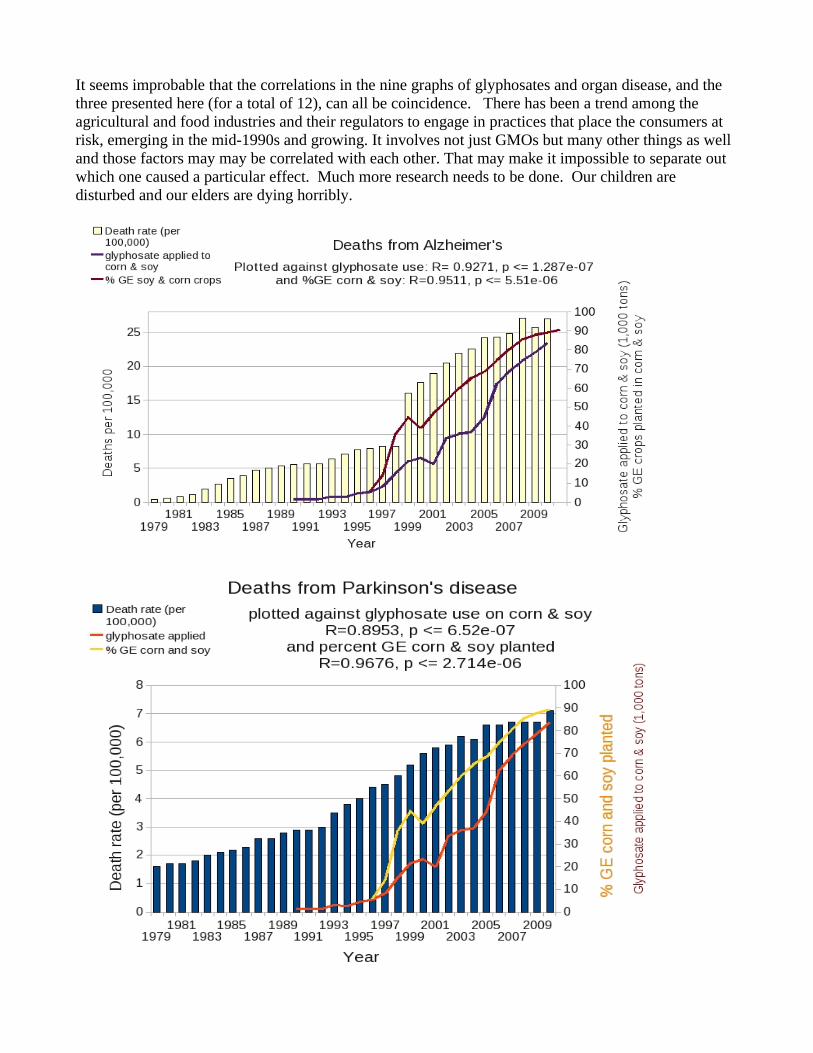
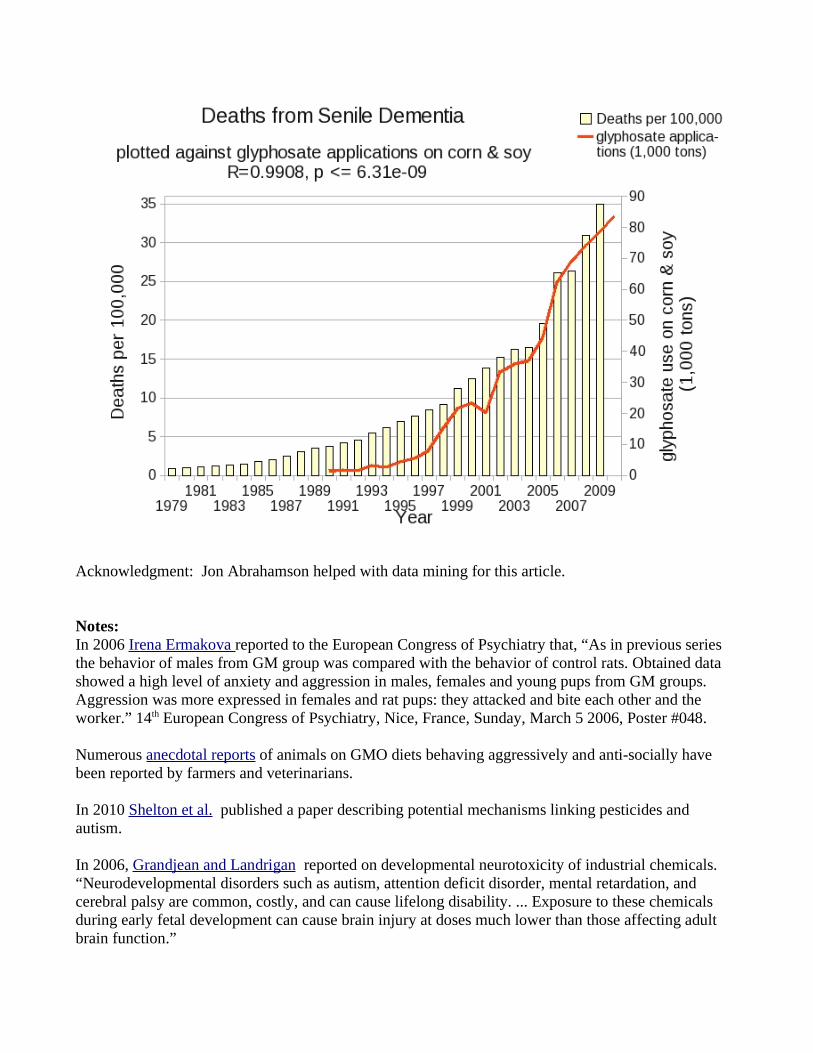
ElderlyThe elderly are susceptible because they may already have a great body burden of chemical exposure over their lifetime and because some of their body processes are shutting down and hormonal disruptions can have a much greater effect on them.According to the University of Washington Institute for Health Metrics and Evaluation, Alzheimer's disease went from number 32 in 1990 to number nine in 2010 in the ranking of leading causes of death in the U.S. Senile Dementia and it's care costs have also skyrocketed in the last two decades.Prevalence and incidence data were sparse, but data on death rates were available from 1979. Graphs of the death rates for Alzheimer's, Parkinson's disease and Senile Dementia have been plotted against glyphosate applications to U.S. corn and soy crops. Again, the correlations are quite strong. Deaths due to Alzheimer's have been rising since 1980, but there is a sharp spike in 1999.
Correlation does not necessarily imply causation and there are now a host of chemicals in our food and our environment. The huge increase in the amount of glyphosate applied to GE food and feed crops has significantly increased our exposure to endocrine disrupting chemicals. In a previous article, correlations were shown between glyphosate use, GMO crop increase and: thyroid cancer, liver cancer, obesity, high blood pressure, acute kidney injury, incidence and prevalence of diabetes and end stage renal disease. All of these diseases and disorders were carefully chosen based on:1 Glyphosate is a known endocrine disruptor.2. Endocrine disruptors can cause organ and neurological damage.3. Roundup™ and GMOs have shown liver and kidney damage and abnormal behavior in rat studies. 4. Use of glyphosate on herbicide-resistant crops has skyrocketed since 1995.5. Incidence, prevalence and deaths due to these diseases has also skyrocketed since 1995.
It seems improbable that the correlations in the nine graphs of glyphosates and organ disease, and the three presented here (for a total of 12), can all be coincidence. There has been a trend among the agricultural and food industries and their regulators to engage in practices that place the consumers at risk, emerging in the mid-1990s and growing. It involves not just GMOs but many other things as well and those factors may may be correlated with each other. That may make it impossible to separate out which one caused a particular effect. Much more research needs to be done. Our children are disturbed and our elders are dying horribly.
Acknowledgment: Jon Abrahamson helped with data mining for this article.
Notes:In 2006 Irena Ermakova reported to the European Congress of Psychiatry that, “As in previous series the behavior of males from GM group was compared with the behavior of control rats. Obtained data showed a high level of anxiety and aggression in males, females and young pups from GM groups. Aggression was more expressed in females and rat pups: they attacked and bite each other and the worker.” 14th European Congress of Psychiatry, Nice, France, Sunday, March 5 2006, Poster #048.
Numerous anecdotal reports of animals on GMO diets behaving aggressively and anti-socially have been reported by farmers and veterinarians.
In 2010 Shelton et al. published a paper describing potential mechanisms linking pesticides and autism.
In 2006, Grandjean and Landrigan reported on developmental neurotoxicity of industrial chemicals.“Neurodevelopmental disorders such as autism, attention deficit disorder, mental retardation, and cerebral palsy are common, costly, and can cause lifelong disability. ... Exposure to these chemicals during early fetal development can cause brain injury at doses much lower than those affecting adult brain function.”
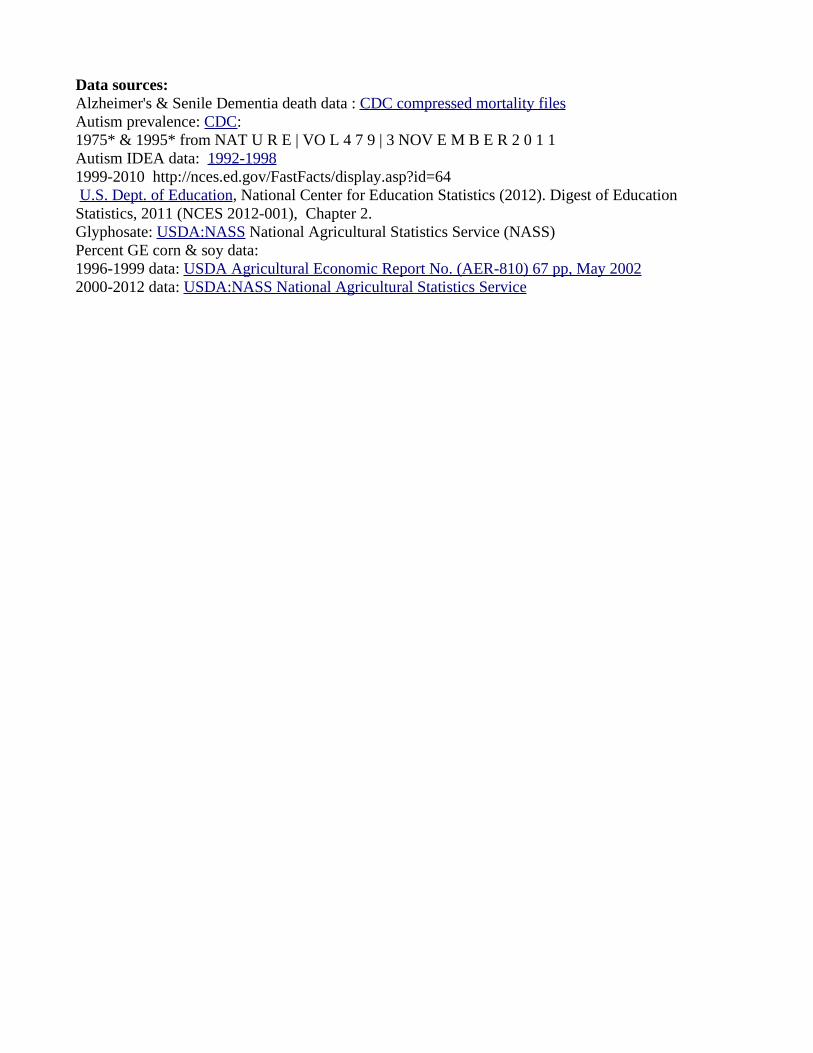
Data sources:Alzheimer's & Senile Dementia death data : CDC compressed mortality filesAutism prevalence: CDC: 1975* & 1995* from NAT U R E | VO L 4 7 9 | 3 NOV E M B E R 2 0 1 1Autism IDEA data: 1992-19981999-2010 http://nces.ed.gov/FastFacts/display.asp?id=64 U.S. Dept. of Education, National Center for Education Statistics (2012). Digest of Education Statistics, 2011 (NCES 2012-001), Chapter 2. Glyphosate: USDA:NASS National Agricultural Statistics Service (NASS)Percent GE corn & soy data:1996-1999 data: USDA Agricultural Economic Report No. (AER-810) 67 pp, May 20022000-2012 data: USDA:NASS National Agricultural Statistics Service
Intestinal disease, immune disease and GMOs
Could crops that are genetically engineered as pesticide producers be a factor in the explosion of intestinal and immune disorders in the U.S.?
GE engineering for insect resistant (IR) cropsSections of the DNA from the bacteria known as Bacillus thuringiensis (Bt) are isolated and inserted into the plant cells by a process known as genetic transformation. The entire plant is then regenerated from the transgenic plant cells. There are thousands of different Bt strains that produce proteins toxic to insect pests. Particular strains are chosen to target specific plant pests. The resulting plant contains the Bt toxin in its cells. When the plant is eaten by the target insect the toxin binds to receptors in the insect's gut, causing the gut wall to break down and allowing toxins and normal gut bacteria to enter the body. As the toxins and bacteria proliferate in the body, the insect dies.Could it be coincidence that this is the exact description of “Leaky Gut syndrome”?
Leaky Gut syndromeAccording to Dr. Andrew Weil, “Leaky gut syndrome is not generally recognized by conventional physicians, but evidence is accumulating that it is a real condition that affects the lining of the intestines. The theory is that leaky gut syndrome (also called increased intestinal permeability), is the result of damage to the intestinal lining, making it less able to protect the internal environment as well as to filter needed nutrients and other biological substances. As a consequence, some bacteria and their toxins, incompletely digested proteins and fats, and waste not normally absorbed may "leak" out of the intestines into the blood stream. This triggers an autoimmune reaction, which can lead to gastrointestinal problems such as abdominal bloating, excessive gas and cramps, fatigue, food sensitivities, joint pain, skin rashes, and autoimmunity.”
Can Leaky Gut be caused by the Bt crops?According to the producers of the Bt insecticide crops, the portion of the Bt DNA that is used does not survive the digestive process in humans. This may be true for the bare DNA strands, but the Bt proteins do survive. Aris et al. found these Bt toxins in the blood of pregnant women and their fetuses which they reported in the journal of Reproductive Toxicology (2011). Even so, say the manufacturers, there is no cause to worry because the toxins are selective and only bind to receptors in the insect gut. Humans don't have these receptors.
According to Dr. Arpad Pusztai, who was involved in the pioneering research on the Bt potato, “There is no [such thing as] absolute selectivity!” Furthermore, he says that the very process of genetic modification causes unknown and uncontrollable mutations in the plant. There is “no means of directing the gene transfer ... You are shooting blindfold ... genetic insertion causes mutations ... You can't say where it [the genetic bit] landed ... you don't know how things were reshuffled.” The plant's own genes are affected and we don't really know how. Pusztai calls this, “insertional mutagenesis,” mutation of an organism caused by the insertion of DNA into the organism's preexisting DNA.
Pusztai did an experiment with rats where he fed one group a food mixture that contained the Bt toxin alone and the other group were fed the the same mixture except it contained the Bt potato. The potato mixture contained 800 times less of the Bt toxin. The rats who were fed the Bt toxin alone were fine, as advertised. But the rats who were fed the Bt potato were not. They were smaller, their livers were smaller, but their stomachs and small intestines were larger. The toxin in the potato was different than the toxin alone. Pusztai published his work (Lancet, 1999) and when his employment contract expired it was not renewed.
The intestinal lining of livestock in the U.S. is so poor these days that meat processors import sausage casings from New Zealand. According to Dr. Huber, “When you look at the intestine of those pigs fed the GMO feed, the lining is deteriorated and the critical microbial balance is drastically changed.”
Intestinal disease and Bt corn
The first Bt corn, cotton and potato were approved by the FDA as food crops in 1995. The corn was genetically engineered to be resistant to the European Corn Borer (ECB). Since then there have been numerous approvals for Bt corn, cotton, potato and, in 2010 for soy. In 2002 the FDA approved another Bt corn variety engineered as an insecticide against the corn rootworm. The Bt potato never really took hold, apparently because the fast-food producers refused to buy it.
The Center for Disease Control (CDC) maintains the National Hospital Discharge Survey. Records were accessed for discharges with any diagnosis listed for a variety of intestinal ailments from 1990-2010. Dr. Charles Benbrook of the Washington State University published a report showing that pesticide use has increased since the advent of GMOs. He obtained data from the USDA and Monsanto reports to estimate percentages of GE corn and cotton that were planted in Bt varieties.
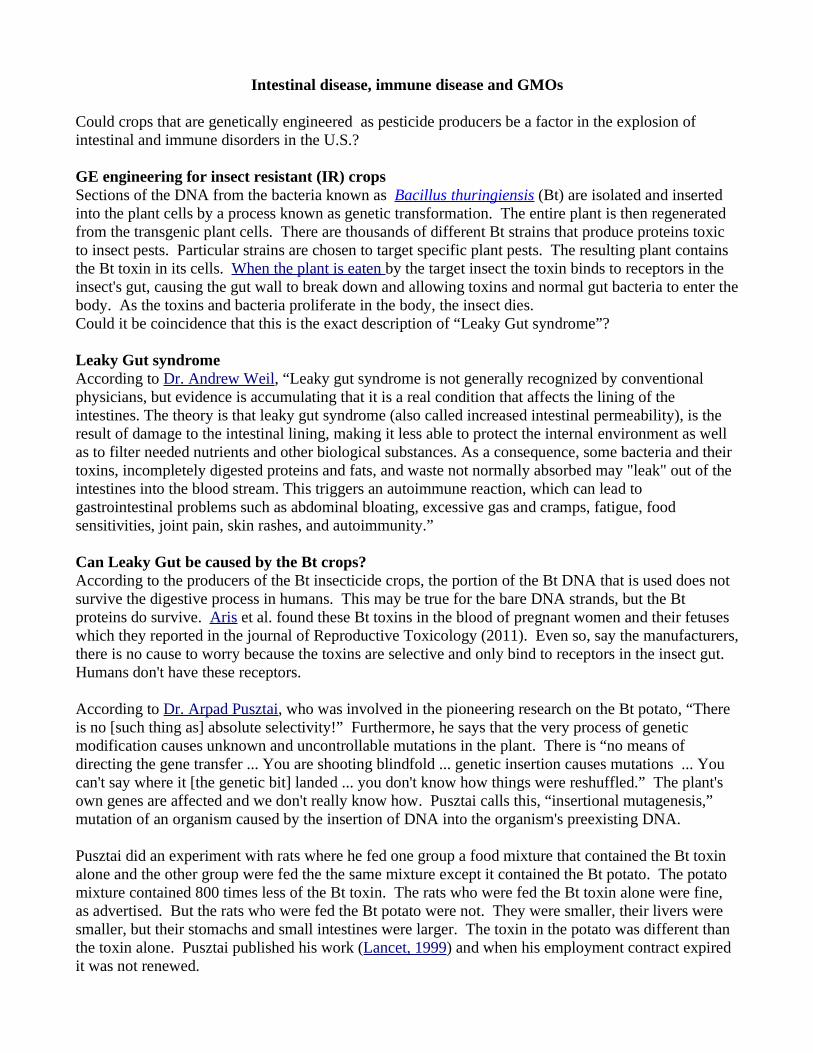
These data are plotted in the graphs below. The first graph is a plot of hospital discharge diagnoses of inflammatory bowel disease (IBD -- Crohn's and ulcerative colitis) against the number of acres of Bt corn planted (ECB-targeted). The diagnoses for IBD begins rising in 1995 and rises and drops along with the availability of Bt corn with a one year delay (two years around 2007-8). The incidence of IBD also showed a high peak around 1978. In an analysis similar to this one, Qin showed that it was strongly correlated with saccharine consumption at that time.
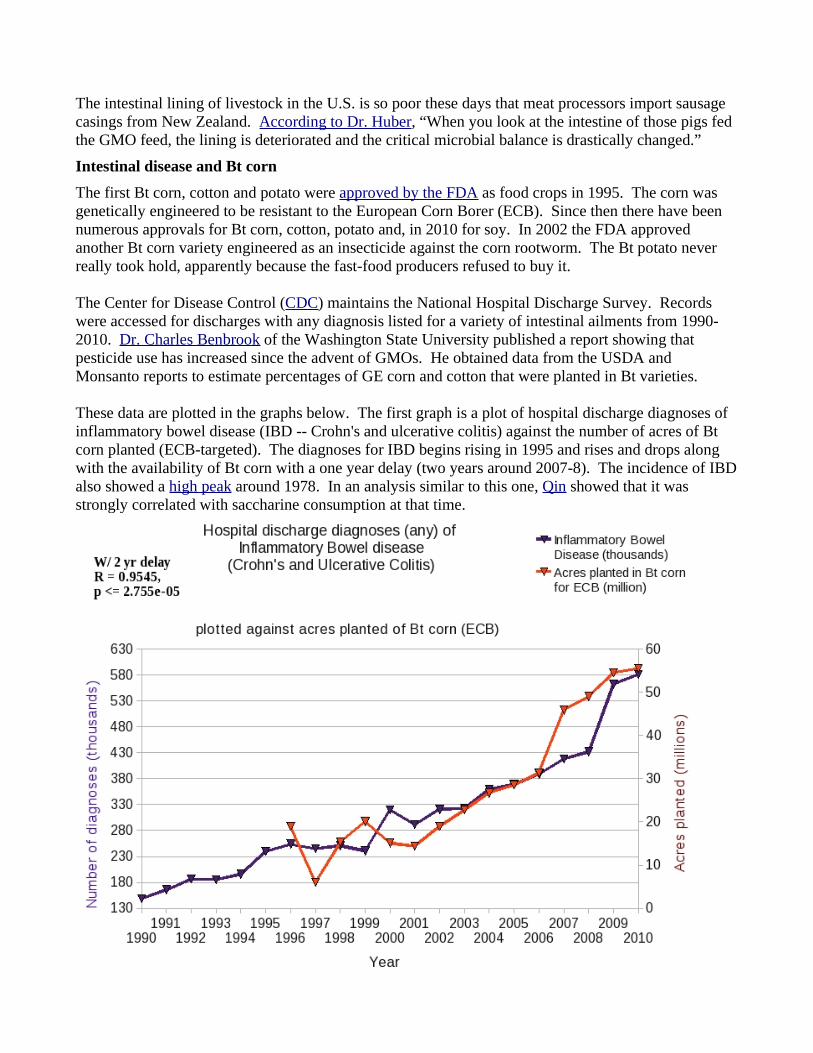
The second graph depicts the number of hospital discharges listing peritonitis diagnoses plotted against the number of acres of Bt corn planted (ECB). The correlation in time in this graph is not as clear as in the previous, but they are marching along in the same direction at approximately the same time. Perforation of part of the gastrointestinal tract is the most common cause of peritonitis.
The third graph shows the the number of diagnoses for chronic constipation plotted against Bt corn planted (ECB and rootworm targeted). Chronic constipation jumped 90% from 2009 to 2010.
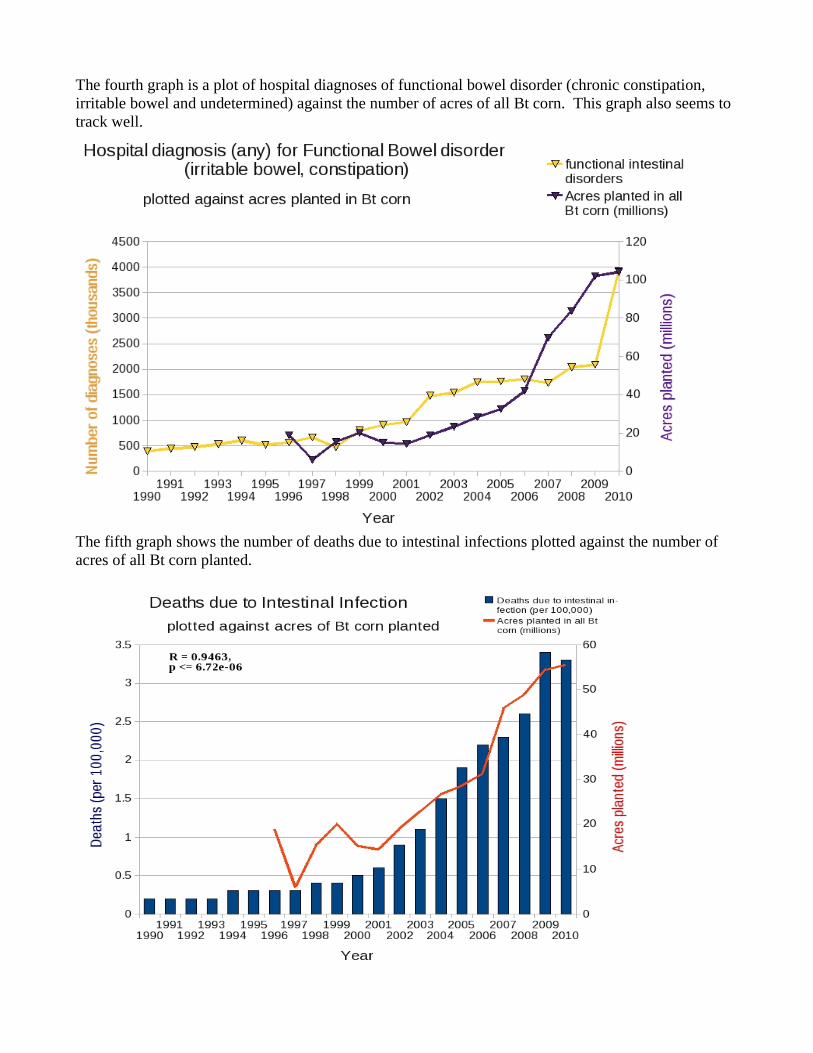
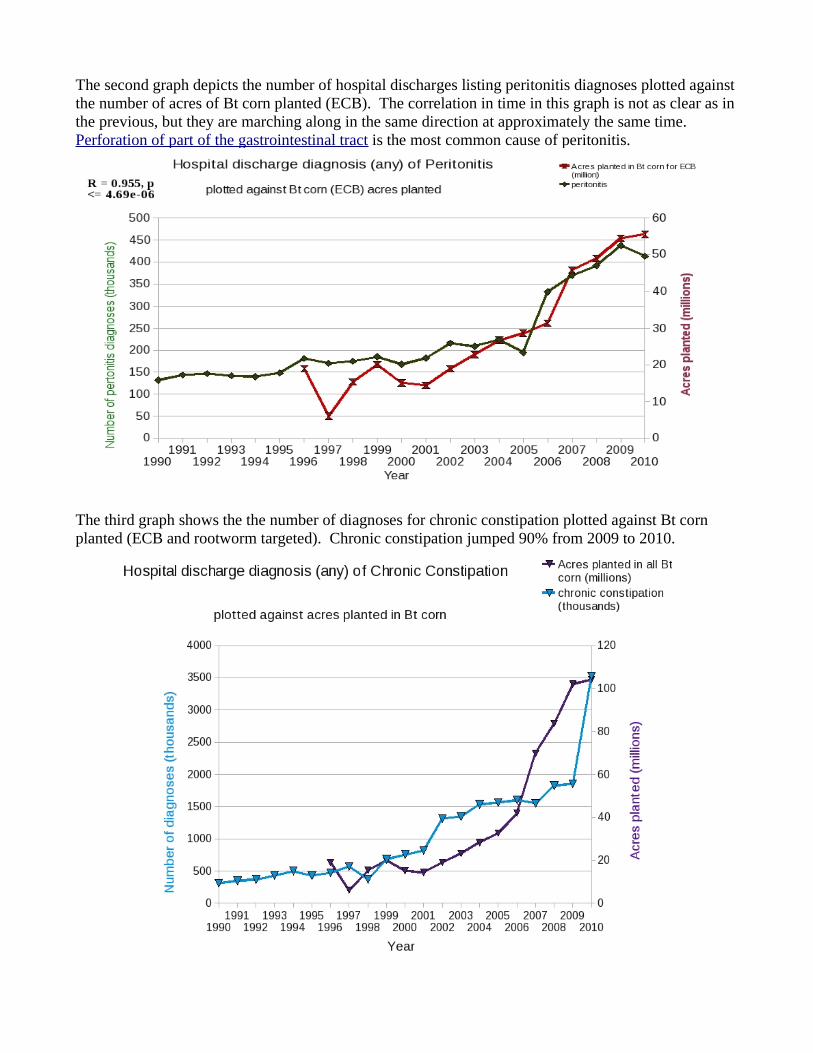
The fourth graph is a plot of hospital diagnoses of functional bowel disorder (chronic constipation, irritable bowel and undetermined) against the number of acres of all Bt corn. This graph also seems to track well.
The fifth graph shows the number of deaths due to intestinal infections plotted against the number of acres of all Bt corn planted.
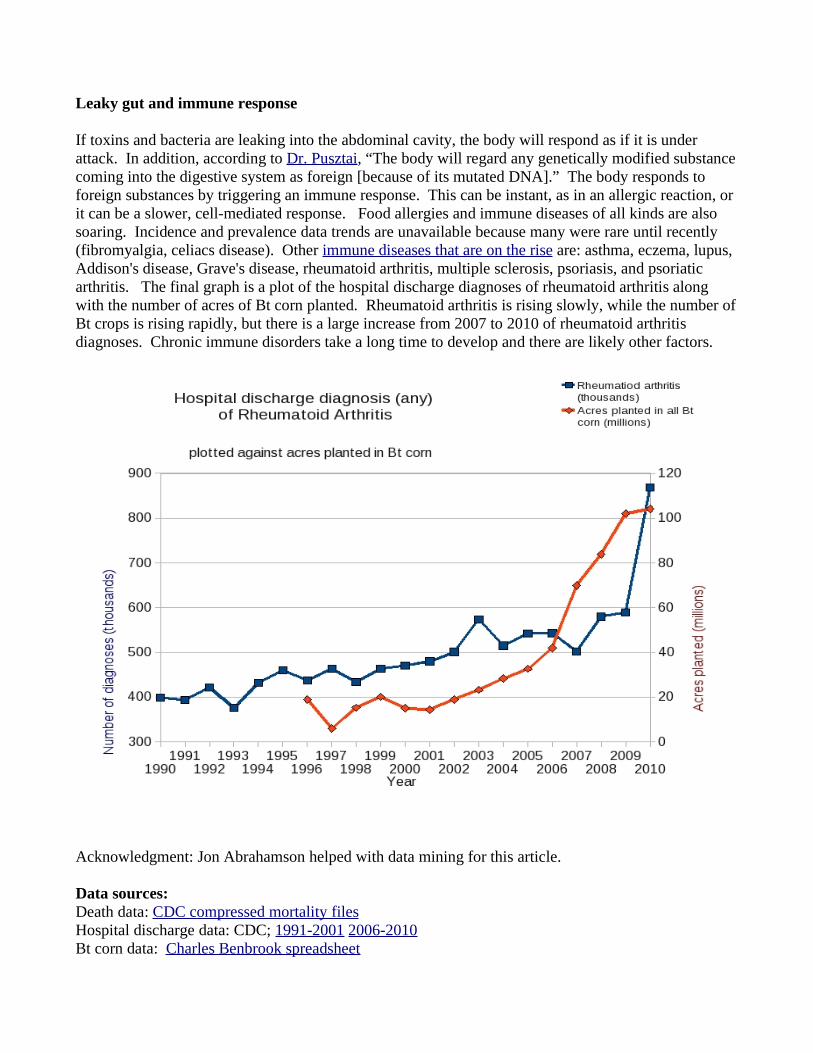
Leaky gut and immune response
If toxins and bacteria are leaking into the abdominal cavity, the body will respond as if it is under attack. In addition, according to Dr. Pusztai, “The body will regard any genetically modified substance coming into the digestive system as foreign [because of its mutated DNA].” The body responds to foreign substances by triggering an immune response. This can be instant, as in an allergic reaction, or it can be a slower, cell-mediated response. Food allergies and immune diseases of all kinds are also soaring. Incidence and prevalence data trends are unavailable because many were rare until recently (fibromyalgia, celiacs disease). Other immune diseases that are on the rise are: asthma, eczema, lupus, Addison's disease, Grave's disease, rheumatoid arthritis, multiple sclerosis, psoriasis, and psoriatic arthritis. The final graph is a plot of the hospital discharge diagnoses of rheumatoid arthritis along with the number of acres of Bt corn planted. Rheumatoid arthritis is rising slowly, while the number of Bt crops is rising rapidly, but there is a large increase from 2007 to 2010 of rheumatoid arthritis diagnoses. Chronic immune disorders take a long time to develop and there are likely other factors.
Acknowledgment: Jon Abrahamson helped with data mining for this article.
Data sources: Death data: CDC compressed mortality filesHospital discharge data: CDC; 1991-2001 2006-2010Bt corn data: Charles Benbrook spreadsheet
Further analyses of glyphosate, GE crops, and disease data
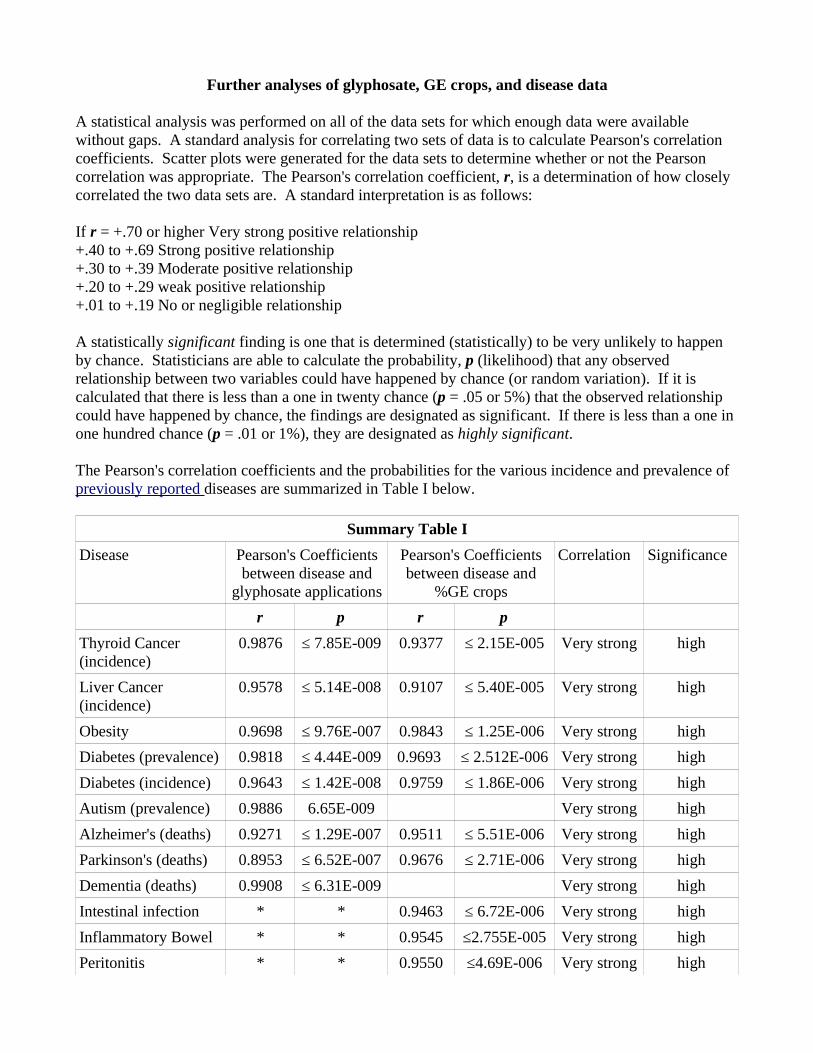
A statistical analysis was performed on all of the data sets for which enough data were available without gaps. A standard analysis for correlating two sets of data is to calculate Pearson's correlation coefficients. Scatter plots were generated for the data sets to determine whether or not the Pearson correlation was appropriate. The Pearson's correlation coefficient, r, is a determination of how closely correlated the two data sets are. A standard interpretation is as follows:
If r = +.70 or higher Very strong positive relationship +.40 to +.69 Strong positive relationship +.30 to +.39 Moderate positive relationship +.20 to +.29 weak positive relationship +.01 to +.19 No or negligible relationship
A statistically significant finding is one that is determined (statistically) to be very unlikely to happen by chance. Statisticians are able to calculate the probability, p (likelihood) that any observed relationship between two variables could have happened by chance (or random variation). If it is calculated that there is less than a one in twenty chance (p = .05 or 5%) that the observed relationship could have happened by chance, the findings are designated as significant. If there is less than a one in one hundred chance (p = .01 or 1%), they are designated as highly significant.
The Pearson's correlation coefficients and the probabilities for the various incidence and prevalence of previously reported diseases are summarized in Table I below.
Summary Table I
Disease Pearson's Coefficients between disease and
glyphosate applications
Pearson's Coefficients between disease and
%GE crops
Correlation Significance
r p r p
Thyroid Cancer (incidence)
0.9876 ≤ 7.85E-009 0.9377 ≤ 2.15E-005 Very strong high
Liver Cancer (incidence)
0.9578 ≤ 5.14E-008 0.9107 ≤ 5.40E-005 Very strong high
Obesity 0.9698 ≤ 9.76E-007 0.9843 ≤ 1.25E-006 Very strong high
Diabetes (prevalence) 0.9818 ≤ 4.44E-009 0.9693 ≤ 2.512E-006 Very strong high
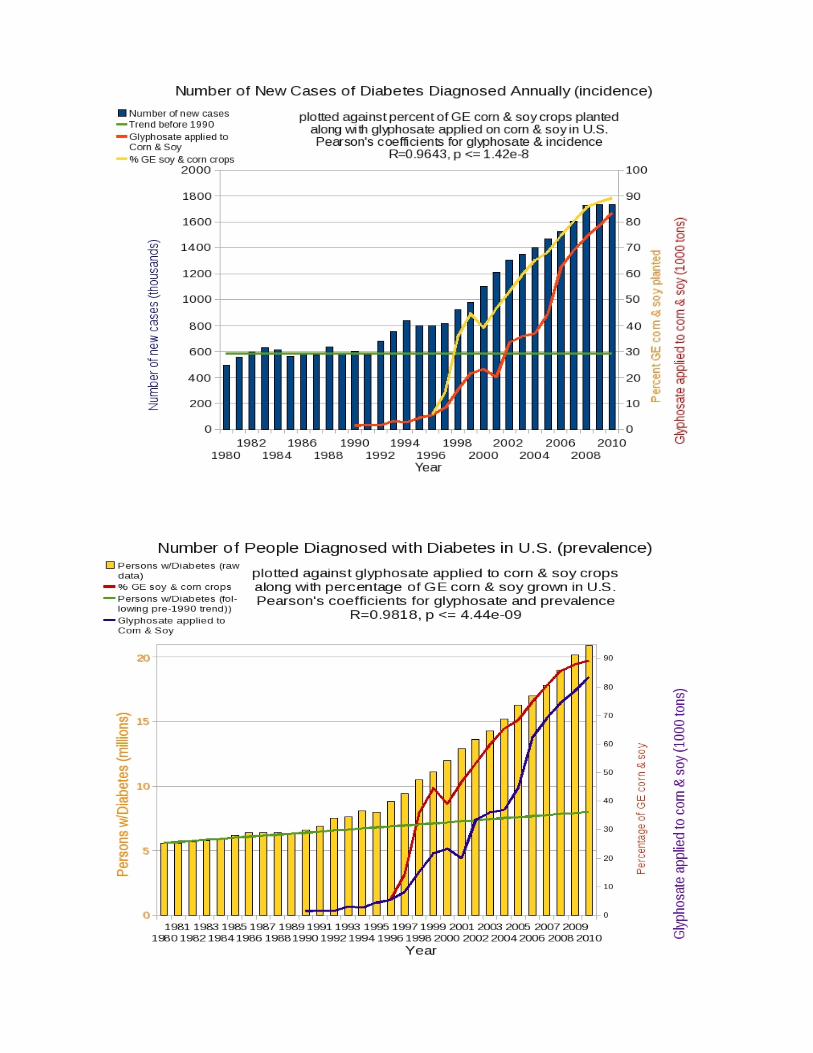
Diabetes (incidence) 0.9643 ≤ 1.42E-008 0.9759 ≤ 1.86E-006 Very strong high
Autism (prevalence) 0.9886 6.65E-009 Very strong high
Alzheimer's (deaths) 0.9271 ≤ 1.29E-007 0.9511 ≤ 5.51E-006 Very strong high
Parkinson's (deaths) 0.8953 ≤ 6.52E-007 0.9676 ≤ 2.71E-006 Very strong high
Dementia (deaths) 0.9908 ≤ 6.31E-009 Very strong high
Intestinal infection * * 0.9463 ≤ 6.72E-006 Very strong high
Inflammatory Bowel * * 0.9545 ≤2.755E-005 Very strong high
Peritonitis * * 0.9550 ≤4.69E-006 Very strong high

Summary Table II
r-value range Correlation w/ glyphosate Correlation w/%GE crops planted
Number w/ r > 0.98 4 Thyroid, Diabetes (P), Autism, Dementia
1 Obesity
Number w/0.96< r < 0.98
2 Obesity,Diabetes (I),
3 Diabetes (both), Parkinson's
Number w/0.94< r < 0.96
1 Liver 3 Alzheimer's,Intestinal. Inflammatory
Bowel
Number w/0.90< r < 0.94
2 Parkinson's, Alzheimer's
2 Liver, Thyroid
• Data were only compared to Bt corn crops for intestinal diseases.
Summary Table II shows which diseases have the highest correlation, with ALL of them having a correlation coefficient greater than 0.90 or 90% with high significance (low probability that the correlation is random).
If we know that a causal factor exists, that is A causes B, then we would expect a high degree of correlation between the two data sets for A and B. The inverse is not true, i.e. because there is a high degree of correlation between A and B it is not necessarily the case that A causes B or vice-versa. However, we have data for 12 diseases all with a high degree of correlation (and even more that were not amenable to the statistical analysis) and very high significance. It seems highly unlikely that all of these can be random coincidence.
Since it is ridiculous to assume that an increase in diabetes causes an increase in glyphosate use, for example, then let us assume the opposite is true. In several of these graphs there is either a constant background or a linear increase in incidence or prevalence of a disease before the '90s. When there is a signal-to-noise problem (the signal is weak due to external noise in the system) it is standard practice in physics and engineering to characterize the noise and subtract it (if it is additive) from the total response to extract the signal. In the case of diabetes, we model the incidence as having two contributors -- one is constant extending over the entire time period, and the other with a much sharper increase beginning when glyphosate started being widely used on crops. We model the prevalence as also having two contributions, one having a slowly increasing slope extending over the entire time period and the other with a much sharper increase. The constant background and the slowly increasing slope were derived from the pre-1990 trends in the data. These are shown in the figures below for the incidence and prevalence of diabetes.
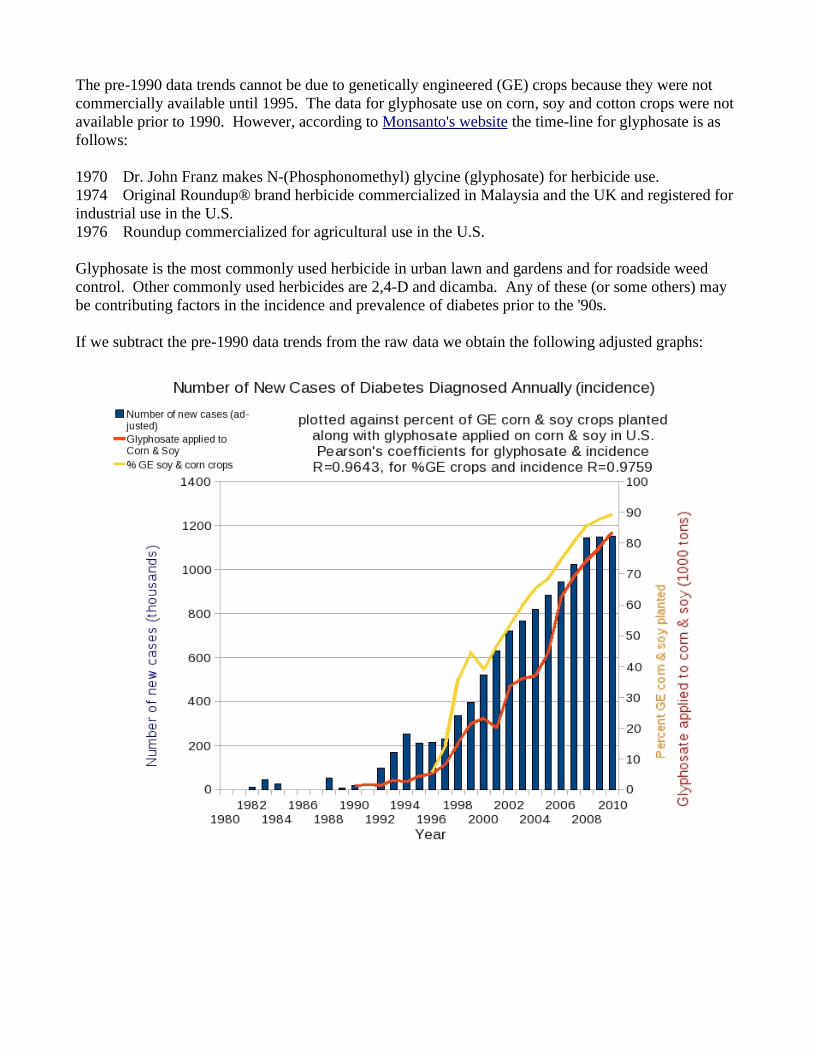
The pre-1990 data trends cannot be due to genetically engineered (GE) crops because they were not commercially available until 1995. The data for glyphosate use on corn, soy and cotton crops were not available prior to 1990. However, according to Monsanto's website the time-line for glyphosate is as follows:
1970 Dr. John Franz makes N-(Phosphonomethyl) glycine (glyphosate) for herbicide use.1974 Original Roundup® brand herbicide commercialized in Malaysia and the UK and registered for industrial use in the U.S.1976 Roundup commercialized for agricultural use in the U.S.
Glyphosate is the most commonly used herbicide in urban lawn and gardens and for roadside weed control. Other commonly used herbicides are 2,4-D and dicamba. Any of these (or some others) may be contributing factors in the incidence and prevalence of diabetes prior to the '90s.
If we subtract the pre-1990 data trends from the raw data we obtain the following adjusted graphs:
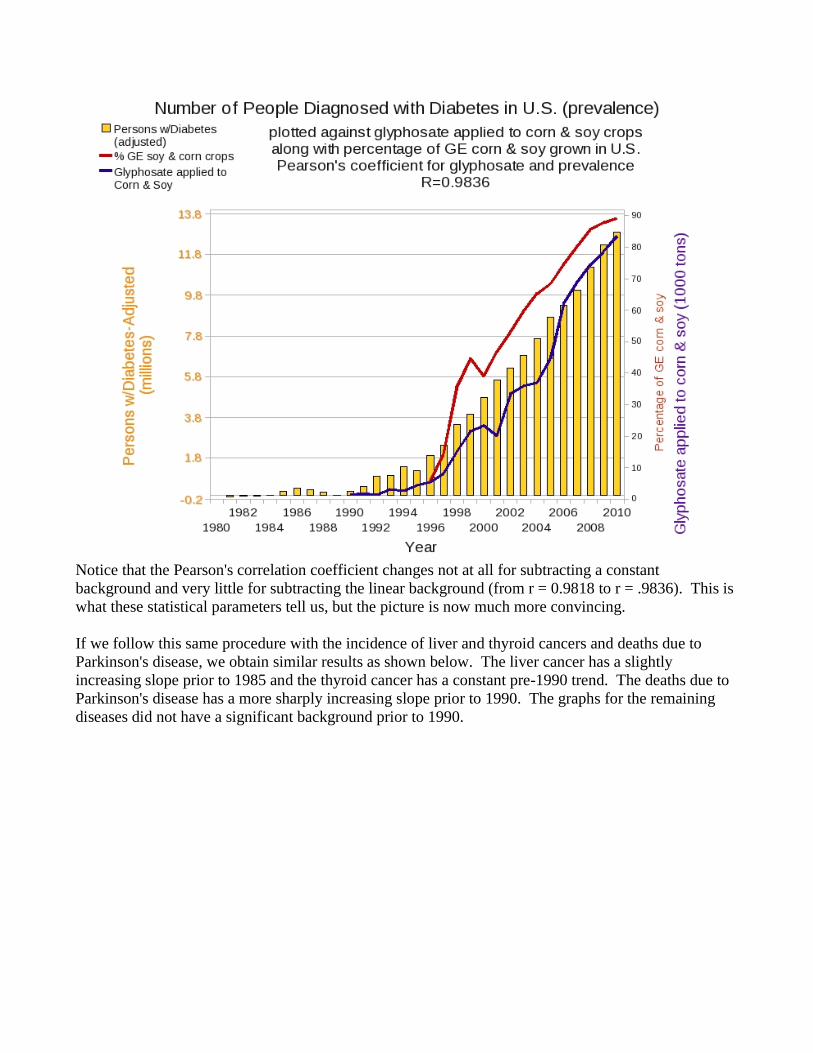
Notice that the Pearson's correlation coefficient changes not at all for subtracting a constant background and very little for subtracting the linear background (from r = 0.9818 to r = .9836). This is what these statistical parameters tell us, but the picture is now much more convincing.
If we follow this same procedure with the incidence of liver and thyroid cancers and deaths due to Parkinson's disease, we obtain similar results as shown below. The liver cancer has a slightly increasing slope prior to 1985 and the thyroid cancer has a constant pre-1990 trend. The deaths due to Parkinson's disease has a more sharply increasing slope prior to 1990. The graphs for the remaining diseases did not have a significant background prior to 1990.
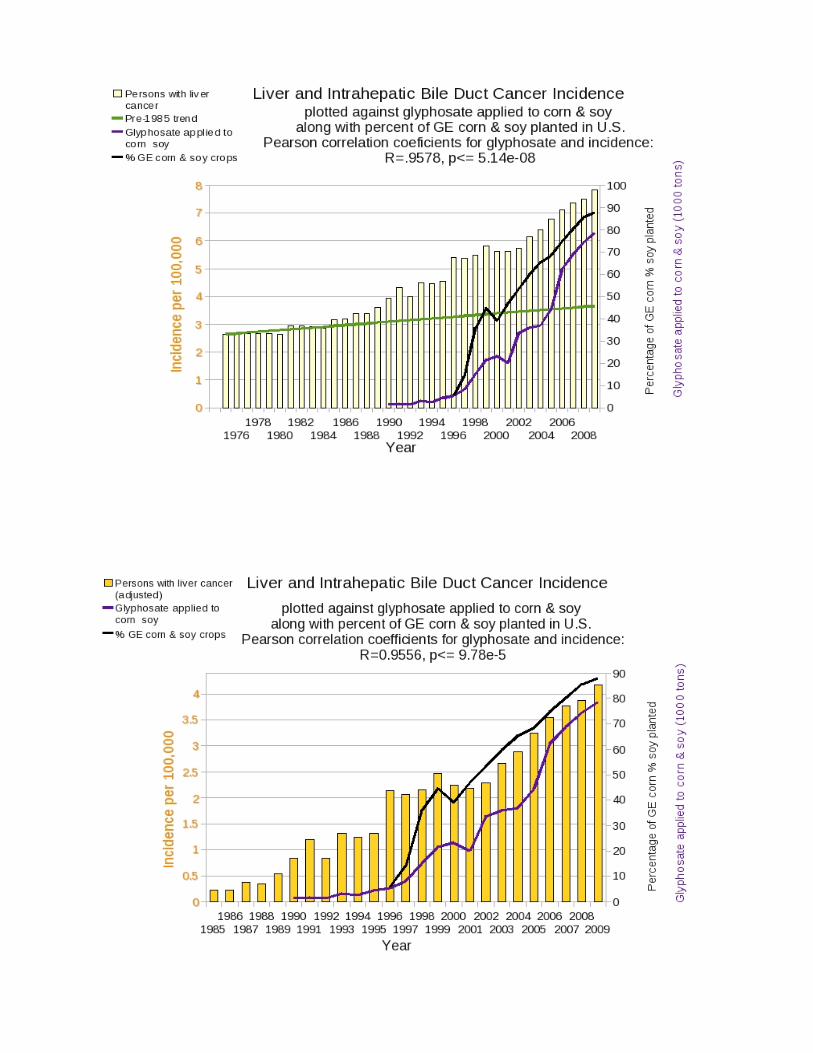
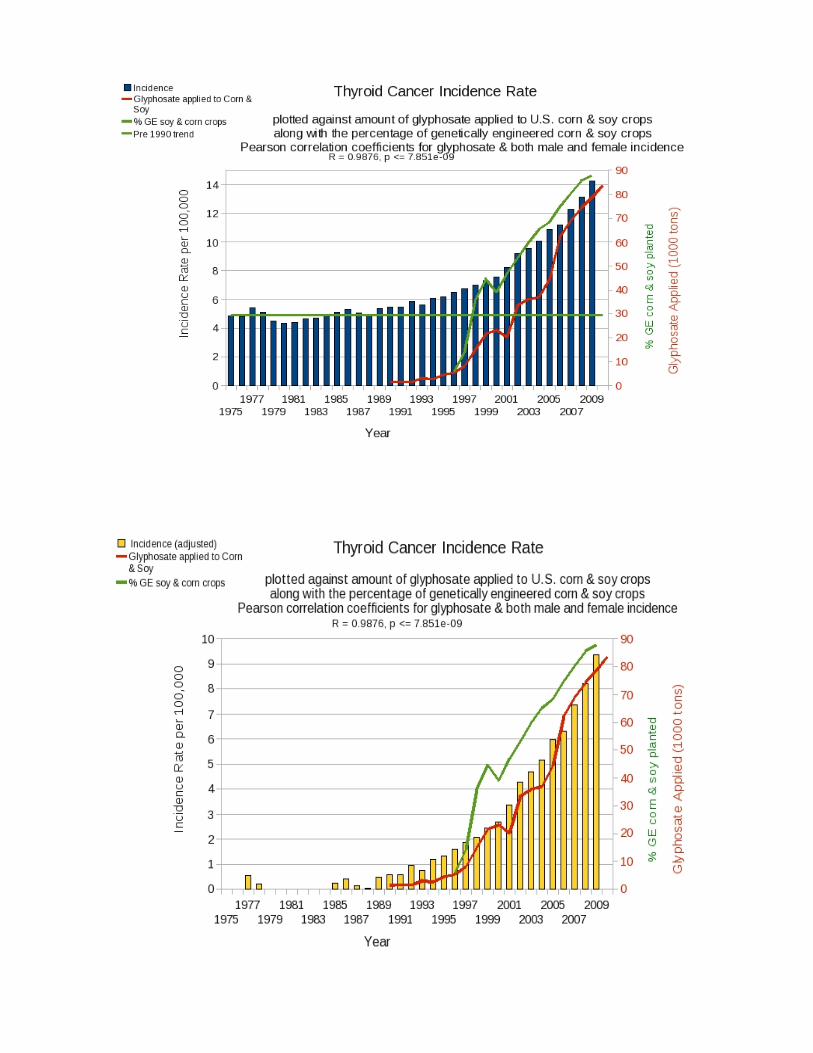
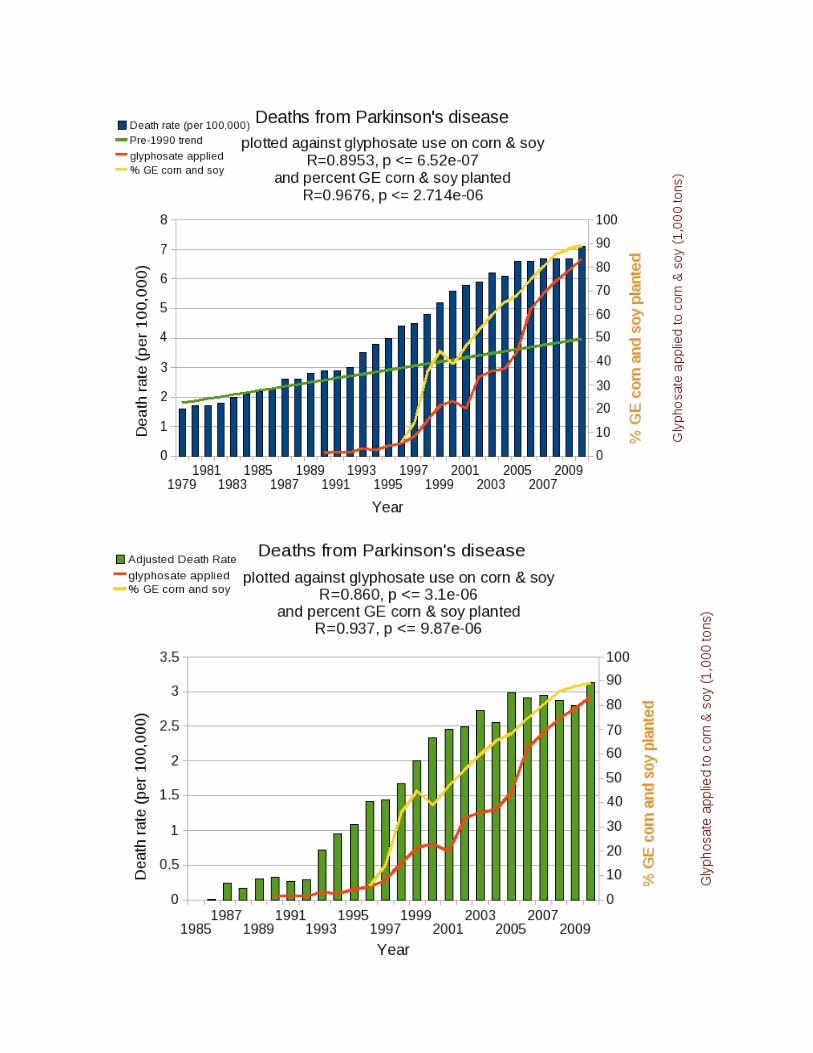
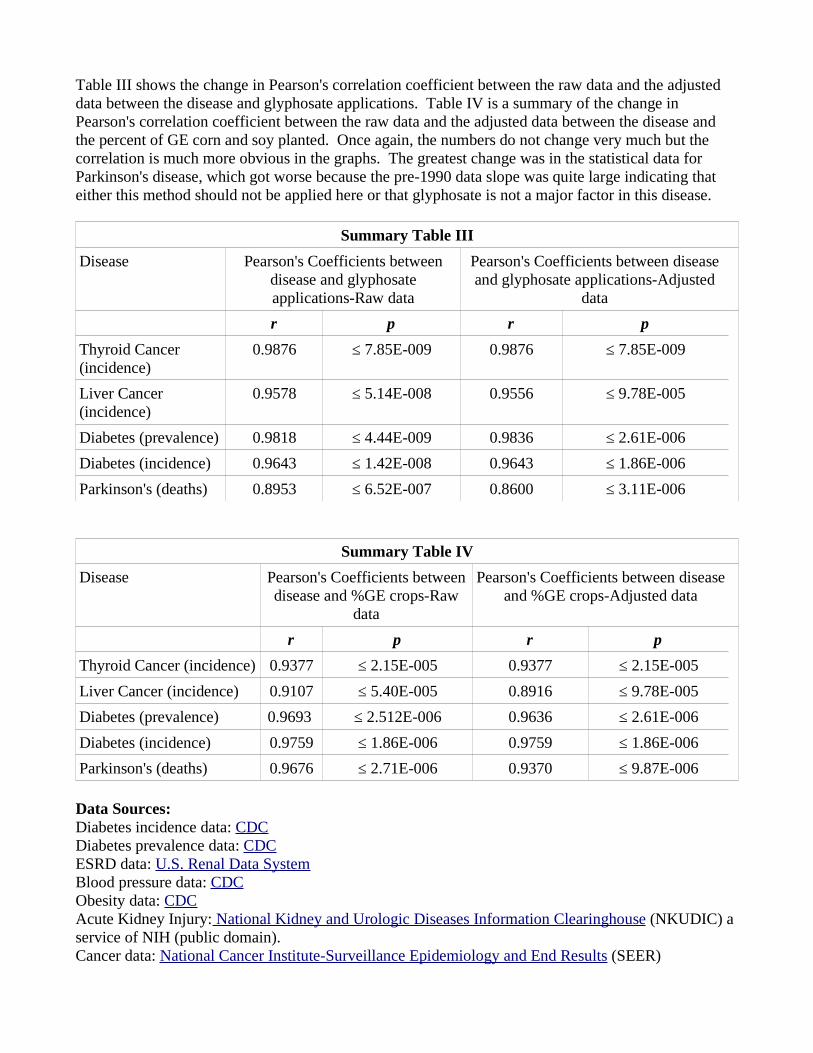
Table III shows the change in Pearson's correlation coefficient between the raw data and the adjusted data between the disease and glyphosate applications. Table IV is a summary of the change in Pearson's correlation coefficient between the raw data and the adjusted data between the disease and the percent of GE corn and soy planted. Once again, the numbers do not change very much but the correlation is much more obvious in the graphs. The greatest change was in the statistical data for Parkinson's disease, which got worse because the pre-1990 data slope was quite large indicating that either this method should not be applied here or that glyphosate is not a major factor in this disease.
Summary Table III
Disease Pearson's Coefficients between disease and glyphosate applications-Raw data
Pearson's Coefficients between disease and glyphosate applications-Adjusted
data
r p r p
Thyroid Cancer (incidence)
0.9876 ≤ 7.85E-009 0.9876 ≤ 7.85E-009
Liver Cancer (incidence)
0.9578 ≤ 5.14E-008 0.9556 ≤ 9.78E-005
Diabetes (prevalence) 0.9818 ≤ 4.44E-009 0.9836 ≤ 2.61E-006
Diabetes (incidence) 0.9643 ≤ 1.42E-008 0.9643 ≤ 1.86E-006
Parkinson's (deaths) 0.8953 ≤ 6.52E-007 0.8600 ≤ 3.11E-006
Summary Table IV
Disease Pearson's Coefficients between disease and %GE crops-Raw
data
Pearson's Coefficients between disease and %GE crops-Adjusted data
r p r p
Thyroid Cancer (incidence) 0.9377 ≤ 2.15E-005 0.9377 ≤ 2.15E-005
Liver Cancer (incidence) 0.9107 ≤ 5.40E-005 0.8916 ≤ 9.78E-005
Diabetes (prevalence) 0.9693 ≤ 2.512E-006 0.9636 ≤ 2.61E-006
Diabetes (incidence) 0.9759 ≤ 1.86E-006 0.9759 ≤ 1.86E-006
Parkinson's (deaths) 0.9676 ≤ 2.71E-006 0.9370 ≤ 9.87E-006
Data Sources:Diabetes incidence data: CDCDiabetes prevalence data: CDCESRD data: U.S. Renal Data SystemBlood pressure data: CDCObesity data: CDCAcute Kidney Injury: National Kidney and Urologic Diseases Information Clearinghouse (NKUDIC) a service of NIH (public domain).Cancer data: National Cancer Institute-Surveillance Epidemiology and End Results (SEER)
SEER 9 areas (San Francisco, Connecticut, Detroit, Hawaii, Iowa, New Mexico, Seattle, Utah, and Atlanta). Rates are per 100,000 and are age-adjusted to the 2000 US Std Population (19 age groups - Census P25-1130).Alzheimer's & Senile Dementia death data : CDC compressed mortality filesAutism prevalence: CDC: 1975* & 1995* from NAT U R E | VO L 4 7 9 | 3 NOV E M B E R 2 0 1 1Autism IDEA data: 1992-19981999-2010 http://nces.ed.gov/FastFacts/display.asp?id=64 U.S. Dept. of Education, National Center for Education Statistics (2012). Digest of Education Statistics, 2011 (NCES 2012-001), Chapter 2. Death data: CDC compressed mortality filesHospital discharge data: CDC; 1991-2001 2006-2010Bt corn data: Charles Benbrook spreadsheetGlyphosate: USDA:NASS National Agricultural Statistics Service (NASS)Percent GE corn & soy data:1996-1999 data: USDA Agricultural Economic Report No. (AER-810) 67 pp, May 20022000-2012 data: USDA:NASS National Agricultural Statistics Service
GMOs and multiple chronic diseases
A paper published 18 April 2013 in the scientific journal Entropy explains the connection between glyphosate and gastrointestinal disorders, obesity, diabetes, heart disease, depression, autism, infertility, cancer and Alzheimer’s disease.
According to the authors, “glyphosate enhances the damaging effects of other food borne chemical residues and environmental toxins. Negative impact on the body is insidious and manifests slowly over time as inflammation damages cellular systems throughout the body. Here, we show how interference with CYP enzymes acts synergistically with disruption of the biosynthesis of aromatic amino acids by gut bacteria, as well as impairment in serum sulfate transport. Consequences are most of the diseases and conditions associated with a Western diet, which include gastrointestinal disorders, obesity, diabetes, heart disease, depression, autism, infertility, cancer and Alzheimer’s disease. We explain the documented effects of glyphosate and its ability to induce disease, and we show that glyphosate is the 'textbook example' of exogenous semiotic entropy: the disruption of homeostasis by environmental toxins.”
Genetically Modified Organisms (GMOs) were first introduced into the food supply in the 1995. One of the primary genetically engineered (GE) traits is resistance to direct herbicide applications. As a result, there has been a huge increase in the amount of glyphosate applied to cotton, corn, canola, sugar beet, and soy crops grown in the U.S. corresponding to the rise in the percentage of these GE varieties planted.
Since GMOs were introduced into the food supply the rate of chronic health conditions among children in the United States increased from 12.8% in 1994 to 26.6% in 2006, particularly for asthma, obesity, and behavior and learning problems. The rate of chronic disease in the entire U.S. population has been dramatically increasing with an estimated 25% of the U.S. population suffering from multiple chronic diseases.
According to a recent article in the Seattle Times, “Drug overdose deaths rose for the 11th straight year [in 2010 according to a CDC report] ... Medicines, mostly prescription drugs, were involved in nearly 60 percent of overdose deaths that year, overshadowing deaths from illicit narcotics. ... Among the medication-related deaths, 17 percent were suicides. The report's data came from death certificates, which aren't always clear on whether a death was a suicide or a tragic attempt at getting high.”
It seems that people are so miserable, they are knocking themselves off with their painkillers. The Academy of Environmental Medicine has issued a position statement on GMO food stating, “...several animal studies indicate serious health risks associated with GM food consumption including infertility, immune dysregulation, accelerated aging, dysregulation of genes associated with cholesterol synthesis, insulin regulation, cell signaling, and protein formation, and changes in the liver, kidney, spleen and gastrointestinal system.“There is more than a casual association between GM foods and adverse health effects. There is causation as defined by Hill's Criteria in the areas of strength of association, consistency, specificity, biological gradient, and biological plausibility. The strength of association and consistency between GM foods and disease is confirmed in several animal studies.” They further state that “because GM foods have not been properly tested for human consumption, and because there is ample evidence of probable harm,” they call on physicians to educate the public and warn their patients to avoid GM foods.

People are ill and they are not waiting for scientists to tell them that GMOs are making them ill. Rachel Linden said in an interview on Weekly Women's GMO Free News, “I don't know why science has replaced common sense. I don't need to check with my doctor to know how I feel when I eat GMOs and how I feel when I don't eat GMOs. I don't need a scientist to tell me forty years from now that they were wrong about GMOs. I'm going to decide for myself right now.” Case studies are piling up of patients who have shown dramatic improvement after taking their doctor's advice and eliminating GMO food. Wouldn't that be so much easier if they had labels?
Does FDA approval mean that GMOs are safe?
The decisions made by the FDA concerning genetically modified food (GMOs) have been based on politics and not science. The official FDA policy on GMOs was first written by Michael R. Taylor who is currently Deputy Commissioner for Foods at the FDA. This position was created in 2009 and filled by Taylor in 2010. At the time Taylor wrote what has since become the FDA policy on GMOs, he was working for the law firm King & Spalding. Among his clients were Monsanto and the International Food Biotechnology Council (IFBC). It was for the IFBC that he wrote the document that eventually, with some editing, became the official FDA policy. In 1991, Taylor left the law firm for the newly created post of Deputy Commissioner for Policy at the FDA. This was his second stint at the FDA. Between 19941996 he was the Administrator of the Food Safety & Inspection Service at the USDA. Following that, he accepted the post of Vice President for Public Policy at Monsanto before taking his current job at the FDA.
A federal law was written in 1958 banning chemical additives in food that are known carcinogens. In 1988, Taylor wrote a paper arguing that this law can be interpreted to allow carcinogenic chemicals in food so long as they are present in low amounts presenting minimal risk. FDA policy states that GMO crops are not even considered additives, but they are “substantially equivalent” to conventional crops and they need no separate category.
Before new drugs are approved by the FDA they must go through a series of rigorous animal testing. If adverse effects are not found in the animal tests, they must then proceed to a series of rigorous clinical trials with human beings. The chemical companies who have developed the genetically engineered (GE) seeds have made the claim to the FDA that their products do not qualify as a new drug because they are essentially identical to nonGMO crops and therefore do not require the same rigorous testing. The EPA agreed and as a result, the FDA’s GMO policy is that the biotechnology companies can determine if their own foods are safe. There are no required safety studies. [See excerpts from the FDA Federal Register at the end of this article.]
A genetically modified plant may or may not require FDA approval (depending on whether or not the modification can be considered an “additive” as in some yeasts, for example). If it does require approval, it is up to the producer to perform the tests to insure safety. The tests that have been performed for FDA approval have all been performed and/or paid for by the petitioner and those data are not published in journals or subjected to peer review. Most of these studies were done on rats, none were undertaken for more than 90 days and many were much less; not nearly long enough for adverse effects to show. There have been no safety studies done by any federal agencies.
Excerpts from the Statement of Policy Foods Derived from New Plant Varieties
FDA Federal Register Volume 57 – 1992 Friday, May 29, 1992
“In most cases, the substances expected to become components of food as a result of genetic modification of a plant will be the same as or substantially similar to substances commonly found in food,...”
“Finally, the principles discussed in this notice do not apply to "new drugs" as defined by section 201 (p) of
the act (21 U.S.C. 321(p)), "new animal drugs" as defined by section 201(w) of the act (21 U.S.C. 321(w)), or to "pesticide chemicals" as defined by section 201(q) of the act. As discussed in section IX., EPA is responsible for pesticide chemicals, including those produced in plants as a result to genetic modification.”[note “the act” is the Federal Food, Drug, and Cosmetic Act ]
“Any genetic modification technique has the potential to alter the composition of food in a manner relevant to food safety, although, based on experience, the likelihood of a safety hazard is typically very low. The following paragraphs describe some potential changes in composition that may require evaluation to assure food safety.”
“Section 402(a)(1) of the act imposes a legal duty on those who introduce food into the market place, including food derived from new crop varieties, to ensure that the food satisfies the applicable safety standard.”“In enacting the amendment [food additive amendment, 1958], Congress recognized that many substances intentionally added to food do not require a formal premarket review by FDA to assure their safety, either because their safety had been established by a long history of use in food or because the nature of the substance and the information generally available to scientists about the substance are such that the substance simply does not raise a safety concern worthy of premarket review by FDA. Congress thus adopted a twostep definition of "food additive." The first step broadly includes any substance the intended use of which results in its becoming a component of food. The second step, however, excludes from the definition of food additive substances that are GRAS [generally recognized as safe]. It is on the basis of the GRAS exception of the "food additive" definition that many ingredients derived from natural sources (such as salt, pepper, vinegar, vegetable oil, and thousands of spices and natural flavors), as well as a host of chemical additives (including some sweeteners, preservatives, and artificial flavors), are able to be lawfully marketed today without having been formally reviewed by FDA and without being the subject of a food additive regulation. The judgment of Congress was that subjecting every intentional additive to FDA premarket review was not necessary to protect public health and would impose an insurmountable burden on FDA and the food industry. It is the responsibility of the producer of a new food to evaluate the safety of the food and assure that the safety requirement of section 402(a)(1) of the act is met.”
“With respect to transferred genetic material (nucleic acids), generally FDA does not anticipate that transferred genetic material would itself be subject to food additive regulation. Nucleic acids are present in the cells of every living organism, including every plant and animal used for food by humans or animals, and do not raise a safety concern as a component of food. In regulatory terms, such material is presumed to be GRAS. Although the guidance provided in section VII. calls for a good understanding of the identity of the genetic material being transferred through genetic modification techniques, FDA does not expect that there will be any serious question about the GRAS status of transferred genetic material.”
“Section VII. of this notice provides guidance to producers of new foods for conducting safety evaluations. This guidance is intended to assist producers in evaluating the safety of the food that they market, regardless of whether the food requires premarket approval by FDA. This guidance also includes criteria and analytical steps that producers can follow in determining whether their product is a candidate for food additive regulation and whether consultation with FDA should be pursued to determine the regulatory status of the product. Ultimately, it is the food producer who is responsible for assuring safety.”