genetically engineered food (methods and detection) || detection methods for genetically modified...
TRANSCRIPT
Genetically Engineered Food. Methods and Detection. 2nd Edition Edited by Knut J. HellerCopyright © 2006 WILEY-VCH Verlag GmbH & Co. KGaA, WeinheimISBN: 3-527-31393-1
10 Detection Methods for Genetically Modified Crops
Rolf Meyer
10.1 Introduction
With the introduction of food derived from genetically modified organisms (GMO) – the first products became commercially available in Europe in 1996 – there has been an increasing need for appropriate analytical methods to monitor compli-ance with the strict regulations in the European Union (EU) and other regions [1]. Today, more than 50 different GM plants have been generated and produced, mostly in the USA, with the trend increasing. For most purposes, a screening or identification step might be sufficient to determine whether a product contains a GMO but the so-called “ threshold regulation” specifies that foodstuffs must be subjected to labeling when material derived from these GMOs is present in food ingredients at a level greater than 0.9% of the food ingredients individually con-sidered. This requires semi-quantitative analysis of GMOs in each ingredient to ascertain whether they are present at >0.9%, which would require labeling, or <0.9%, which would not. Different procedures must therefore be considered to distinguish “identity preserved” (IP) non-GM soya, for example, from soya con-taining proportions of GM soya in processed food products. Accurate determina-tion of the proportion of GM soya is required and it would be necessary to perform quantitative analysis on the ingredients themselves before incorporation into the processed food.
In general, three distinct steps are needed – detection, identification, and quan-titation. Screening methods that provide a positive or negative statement can be used to determine if a product contains a GMO. Assays on raw material are usu-ally performed with the polymerase chain reaction ( PCR) or with immunological assays, for example enzyme-linked immunoassay ( ELISA). Immunological assays are based on the specific binding between an antibody and the expressed trans-genic protein, for example neomycin phosphotransferase II ( NptII), the enzyme 5-pyruvylshikimate-3-phosphate synthase ( EPSPS), or numerous Cry proteins ( Bt, Bacillus thuringiensis, insecticidal endotoxin). If no protein is expressed from intro-duced DNA, this technique cannot be applied. Proteins are denatured during food
202
processing (i.e. thermal treatment) and any conformational change in the epitope structure of the protein renders the test ineffective. Immunological methods are therefore only suitable for raw material analysis. Because DNA is much more ther-mally stable than protein and can survive food processing, processed foods are usually analyzed with PCR methods. A food product might even have undergone such extensive processing that ingredients of potential GMO origin are no longer detectable. Detection of DNA and/or protein become difficult in highly refined in-gredients, for example starch, lecithin, sugar, or vegetable oils. Before GMO iden-tification or screening the presence of amplifiable DNA in a food matrix must be determined using universal or plant species-specific PCR assays (i.e. soya, maize, potato, tomato, or rapeseed-specific). If plant DNA is present and the screening result is positive, further analysis is required to determine whether the GMO is authorized within the EU or in regions with different regulations (e.g. Switzerland, Japan) and at what concentration the GMO is present in the food ingredients (de-termination of the level of GMO is required) [2, 3].
In the identification and quantification of GM crops there are several difficulties. In particular, the ploidy status of the chromosomes in cells and the number of inte-grated copies of the genetic modification are often unknown. The same transgenic construct (“cassette”) could be used in different plant species, for example maize and soybean, and the use of different “cassettes” in the same GM crop to combine GM traits (known as “stacked” genes – e.g. maize Mon810 × T25 from Pioneer) could lead to ambiguous results. The development of methods is hampered by the availability of certified GM crop reference material and access to GM-free material (e.g. from the same parent line).
This chapter gives an overview of analytical methods for DNA which may be needed to detect the presence of genetically modified (GM) crops or for analysis of GM crop-derived produce. This discussion of detection of recombinant DNA in food by PCR is divided into three main steps – DNA extraction, amplification by PCR, and verification of the PCR products [4].
10.2 Isolation of plant DNA
10.2.1 Sampling
One of the major problems in analytical testing is the sampling procedure. A sample must be representative of the batch/lot of the product from which it was taken. The sampling plan and sample size must meet statistical requirements in respect of homogeneity and threshold limit up to which the result should be reli-able. Sampling plans for cereals and pulses are described in ISO 13690 [5]. Raw materials (soya beans, maize kernels) are often not systematically mixed during harvest, storage, transport, etc. whereas for processed ingredients (flour, protein isolate, lecithin, and starch) the variance is less, although batch-to-batch variation
10.2 isolation of plant DNA
203
must also be considered. The heterogeneity of a sample and the threshold set for acceptance of the presence of GM material will define both the number of samples taken and the appropriate sample size. The greater the heterogeneity, the more critical will be the choice of the appropriate sampling plan. For detection of low levels of GM material the sample size required will, to be representative, increase accordingly. The United States Department of Agriculture (USDA), Grain Inspec-tion, Packers and Stockyards Administration (GIPSA, Washington DC) has estab-lished sampling guidelines for diagnostic testing of GM grain [6]. Harmonization of sampling procedures for GMOs and derived products is expected in the future (CEN working group 11; ISO/DIS 21568:2005) [7].
Recommendation 2004/747 [8] of the Commission of the European Communi-ties includes paragraphs about sampling and detection methods.
10.2.2 Sample Preparation
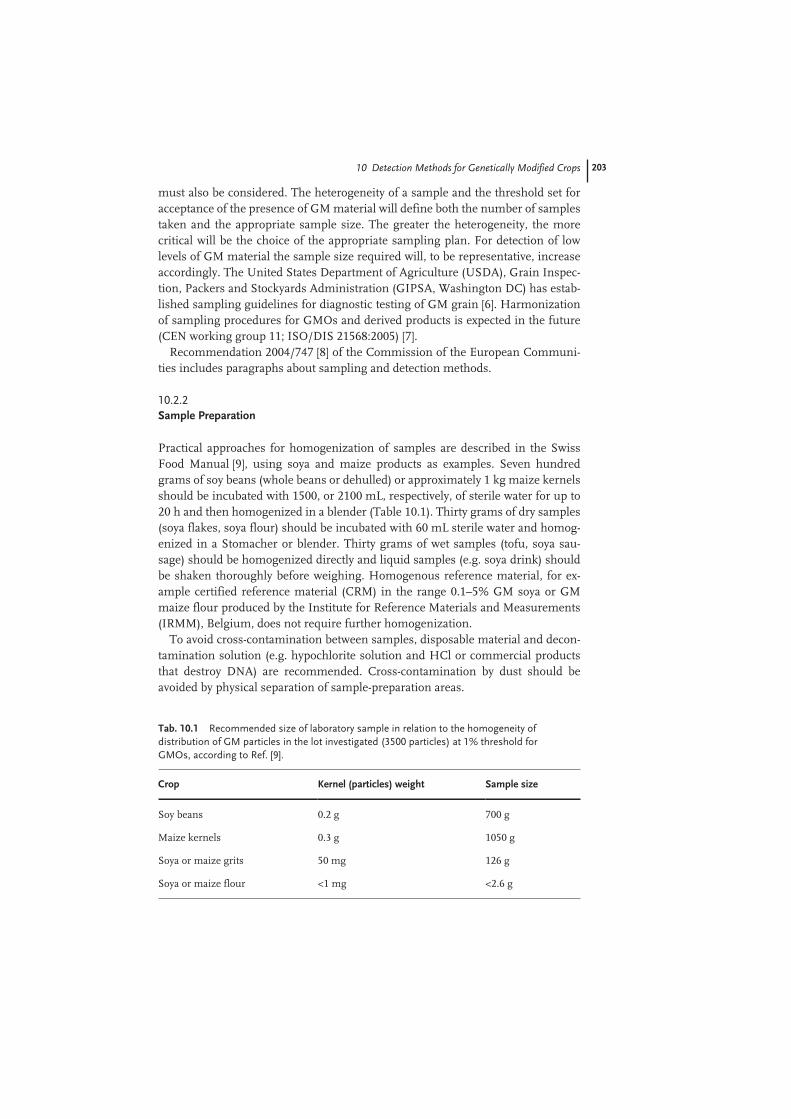
Practical approaches for homogenization of samples are described in the Swiss Food Manual [9], using soya and maize products as examples. Seven hundred grams of soy beans (whole beans or dehulled) or approximately 1 kg maize kernels should be incubated with 1500, or 2100 mL, respectively, of sterile water for up to 20 h and then homogenized in a blender (Table 10.1). Thirty grams of dry samples (soya flakes, soya flour) should be incubated with 60 mL sterile water and homog-enized in a Stomacher or blender. Thirty grams of wet samples (tofu, soya sau-sage) should be homogenized directly and liquid samples (e.g. soya drink) should be shaken thoroughly before weighing. Homogenous reference material, for ex-ample certified reference material (CRM) in the range 0.1–5% GM soya or GM maize flour produced by the Institute for Reference Materials and Measurements (IRMM), Belgium, does not require further homogenization.
To avoid cross-contamination between samples, disposable material and decon-tamination solution (e.g. hypochlorite solution and HCl or commercial products that destroy DNA) are recommended. Cross-contamination by dust should be avoided by physical separation of sample-preparation areas.
10 Detection Methods for Genetically Modified Crops
Tab. 10.1 Recommended size of laboratory sample in relation to the homogeneity of distribution of GM particles in the lot investigated (3500 particles) at 1% threshold for GMOs, according to Ref. [9].
Crop Kernel (particles) weight Sample size
Soy beans 0.2 g 700 g
Maize kernels 0.3 g 1050 g
Soya or maize grits 50 mg 126 g
Soya or maize flour <1 mg <2.6 g
204
10.2.3 DNA Extraction and Analysis
Assuming the laboratory sample is representative of the field sample and that it has been adequately homogenized, even small aliquots of vegetable material or products, usually between 100 and 350 mg, are sufficient for DNA extraction. The efficiency of PCR depends on DNA quality and purity. DNA quality is determined by its fragment length and the extent of damage by exposure to heat, low pH, and/or nucleases that cause hydrolysis, depurination, and/or enzymatic degradation. DNA quality therefore varies depending on the material under examination, the amount of processing of the food sample, and the DNA extraction method applied.
10.2 isolation of plant DNA
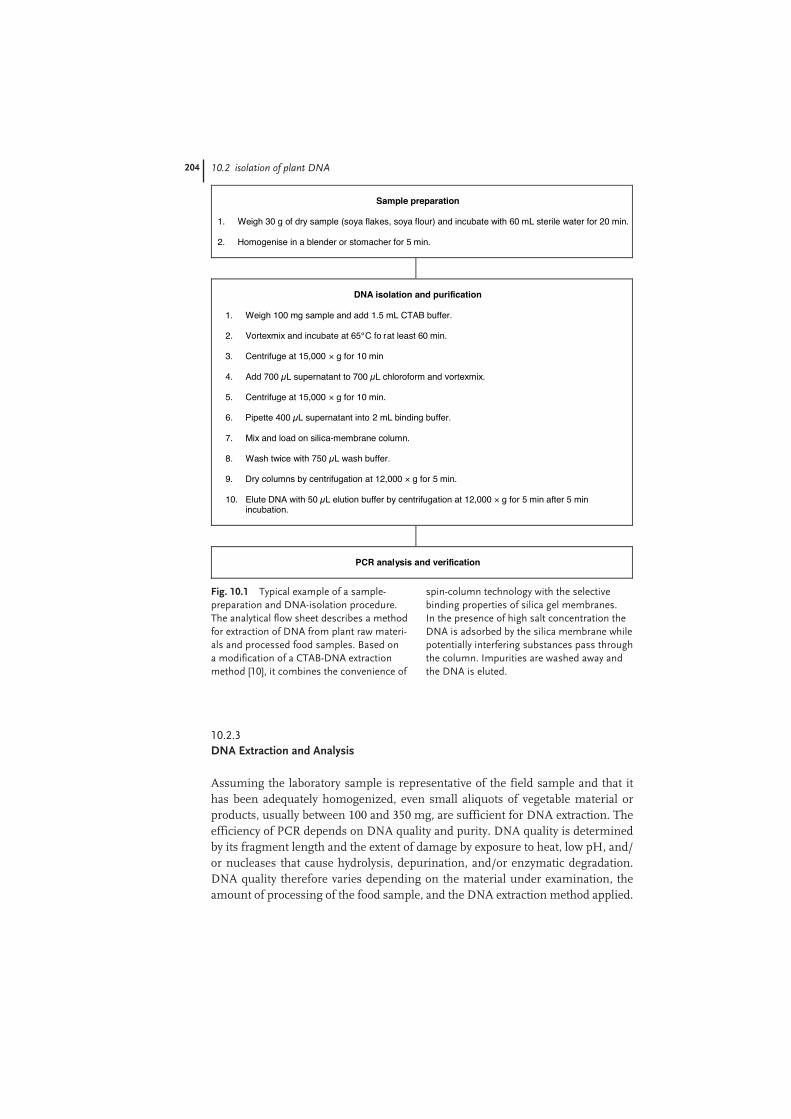
Fig. 10.1 Typical example of a sample-preparation and DNA-isolation procedure. The analytical flow sheet describes a method for extraction of DNA from plant raw materi-als and processed food samples. Based on a modification of a CTAB-DNA extraction method [10], it combines the convenience of
spin-column technology with the selective binding properties of silica gel membranes. In the presence of high salt concentration the DNA is adsorbed by the silica membrane while potentially interfering substances pass through the column. Impurities are washed away and the DNA is eluted.
Sample preparation
1. Weigh 30 g of dry sample (soya flakes, soya flour) and incubate with 60 mL sterile water for 20 min.
2. Homogenise in a blender or stomacher for 5 min.
DNA isolation and purification
1. Weigh 100 mg sample and add 1.5 mL CTAB buffer.
2. Vortexmix and incubate at 65° C fo r at least 60 min.
3. Centrifuge at 15,000 × g for 10 min
4. Add 700 µL supernatant to 700 µL chloroform and vortexmix.
5. Centrifuge at 15,000 × g for 10 min.
6. Pipette 400 µL supernatant into 2 mL binding buffer.
7. Mix and load on silica-membrane column.
8. Wash twice with 750 µL wash buffer.
9. Dry columns by centrifugation at 12,000 × g for 5 min.
10. Elute DNA with 50 µL elution buffer by centrifugation at 12,000 × g for 5 min after 5 minincubation.
PCR analysis and verification
205
DNA isolated from processed ingredients and foods is of low quality, with available targets sequences being rather short, in the range of 100–400 bp (base pairs) for soya protein preparations and processed tomato products. An appropriate choice of primers to obtain short amplicons should therefore be made. Various compo-nents of the food matrix affect the purity of the DNA; examples include polysac-charides, lipids, and polyphenols or chemicals used during the DNA extraction procedure. The key enzyme of the PCR, Taq polymerase, is inhibited by polysac-charides, EDTA, phenol, SDS, and many other compounds.
A vast range of methods is available for isolation of DNA and many have been evaluated for their applicability to GMO detection in plant material and plant-derived food products [3]. Three different approaches to DNA isolation from plant material and plant-derived products are currently favored for GMO detection – the CTAB method [10], DNA-binding silica columns (various commercially available kits), and a combination of these (Fig. 10.1). The use of CTAB as detergent in the DNA extraction buffer is efficient for a wide range of plant materials and plant-derived foods, especially because of good separation of polysaccharides from the DNA. Adapted procedures for starch (enzymatic treatment with α-amylase) and lecithin (use of a hexane extraction step to remove lipids) have been developed to improve the yield and quality of DNA from these matrices [11, 12].
The quantity and purity of the DNA is usually estimated by measuring the absorbance at 260 nm and at 280 nm by means of a spectrophotometer. Absor-bance of 1 unit at 260 nm corresponds to a concentration of 50 µg double-strand-ed DNA mL−1 or 37 µg single-stranded DNA mL−1 (when denatured with 0.2 M NaOH) [9]. The ratio between the absorbance values at 260 nm and 280 nm gives an estimate of DNA purity – pure DNA usually has an A
260/A
280 ratio from 1.7 to
1.9. A higher A260
/A280
ratio is indicative of RNA contamination whereas a lower ratio results from contamination with proteins. Alternatively, the DNA concentra-tion is estimated by measurement fluorescence induced by reagents such as Pico Green (Molecular Probes, USA). The approximate amount of DNA and the aver-age fragment size of DNA isolated from processed food samples is estimated on agarose gel stained with ethidium bromide or fluorescent nucleic acid gel stains. Contamination of the DNA with RNA can occasionally lead to overestimation of the DNA content if no RNase treatment is performed. Usually 5 to 100 ng DNA is used in PCR analysis. The DNA content in low-DNA-containing matrices, for example lecithin and starch, cannot be measured directly.
10.3 Detection Strategies
PCR methods in different formats ( single or nested PCR; PCR–ELISA, QC–PCR, real-time PCR) are available and have found broad application in GMO detection (as reviewed by Anklam et al. [3]).
10 Detection Methods for Genetically Modified Crops
206
10.3.1 Screening
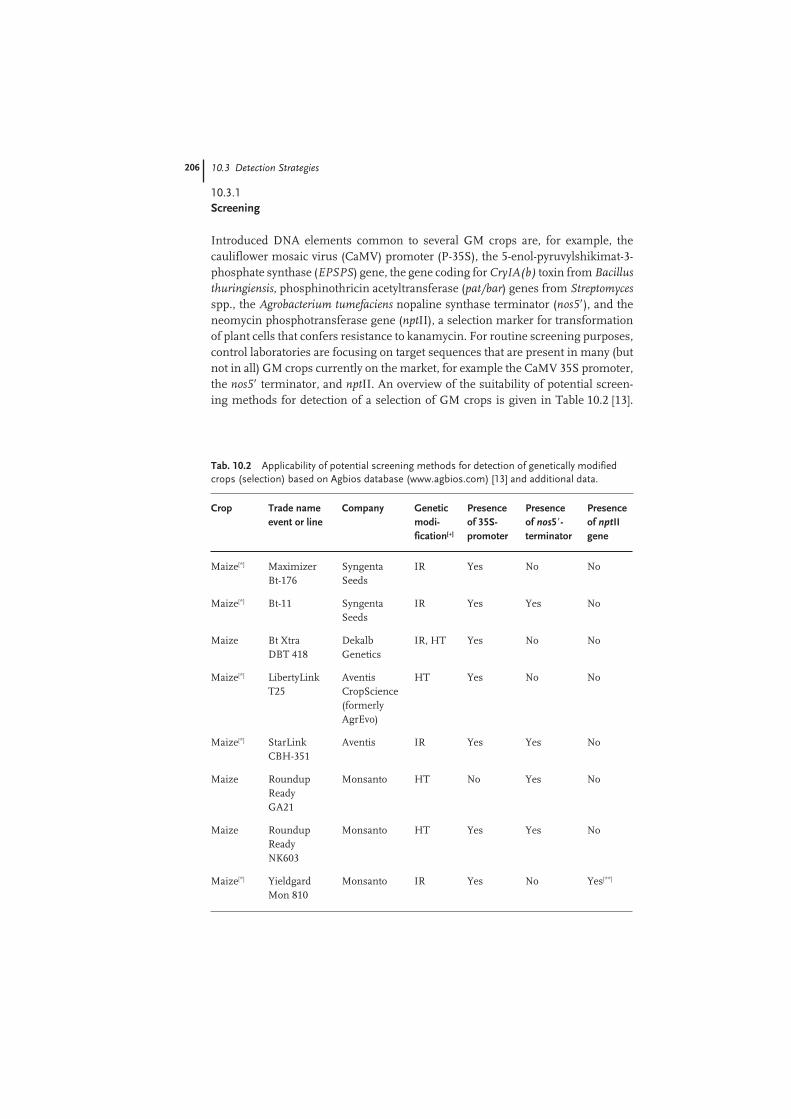
Introduced DNA elements common to several GM crops are, for example, the cauliflower mosaic virus ( CaMV) promoter (P-35S), the 5-enol-pyruvylshikimat-3-phosphate synthase ( EPSPS) gene, the gene coding for CryIA(b) toxin from Bacillus thuringiensis, phosphinothricin acetyltransferase (pat/bar) genes from Streptomyces spp., the Agrobacterium tumefaciens nopaline synthase terminator ( nos5�), and the neomycin phosphotransferase gene ( nptII), a selection marker for transformation of plant cells that confers resistance to kanamycin. For routine screening purposes, control laboratories are focusing on target sequences that are present in many (but not in all) GM crops currently on the market, for example the CaMV 35S promoter, the nos5� terminator, and nptII. An overview of the suitability of potential screen-ing methods for detection of a selection of GM crops is given in Table 10.2 [13].
10.3 Detection Strategies
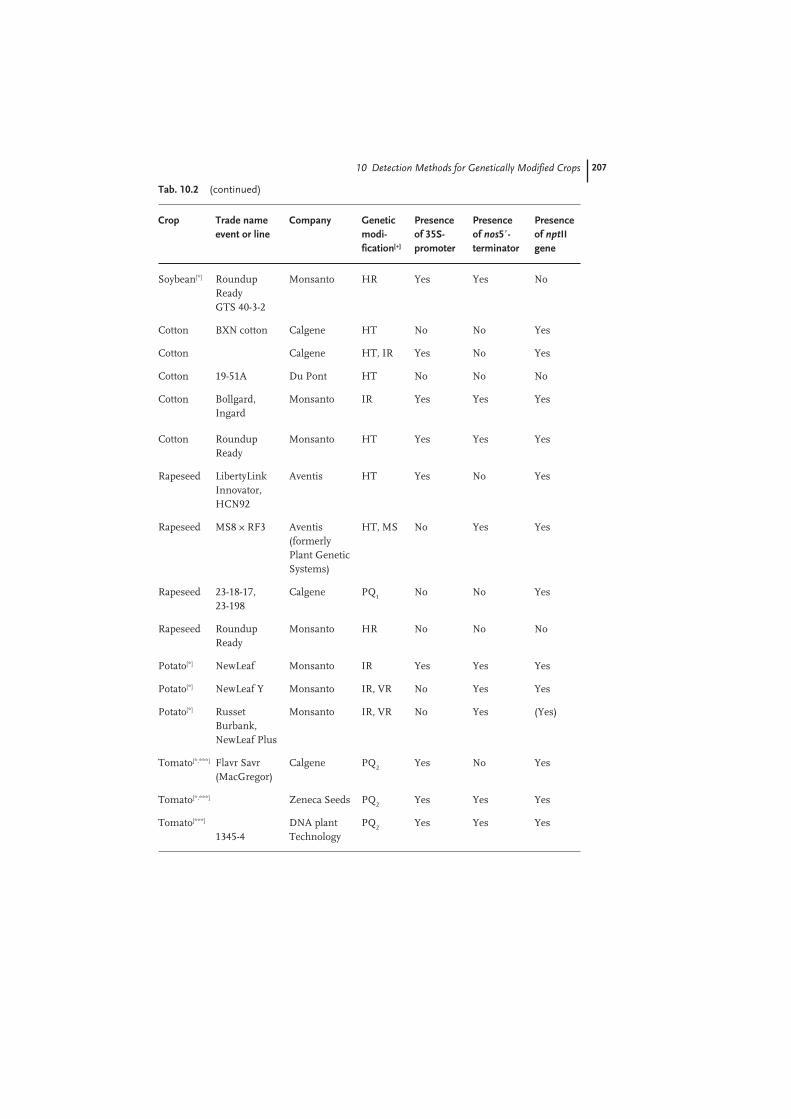
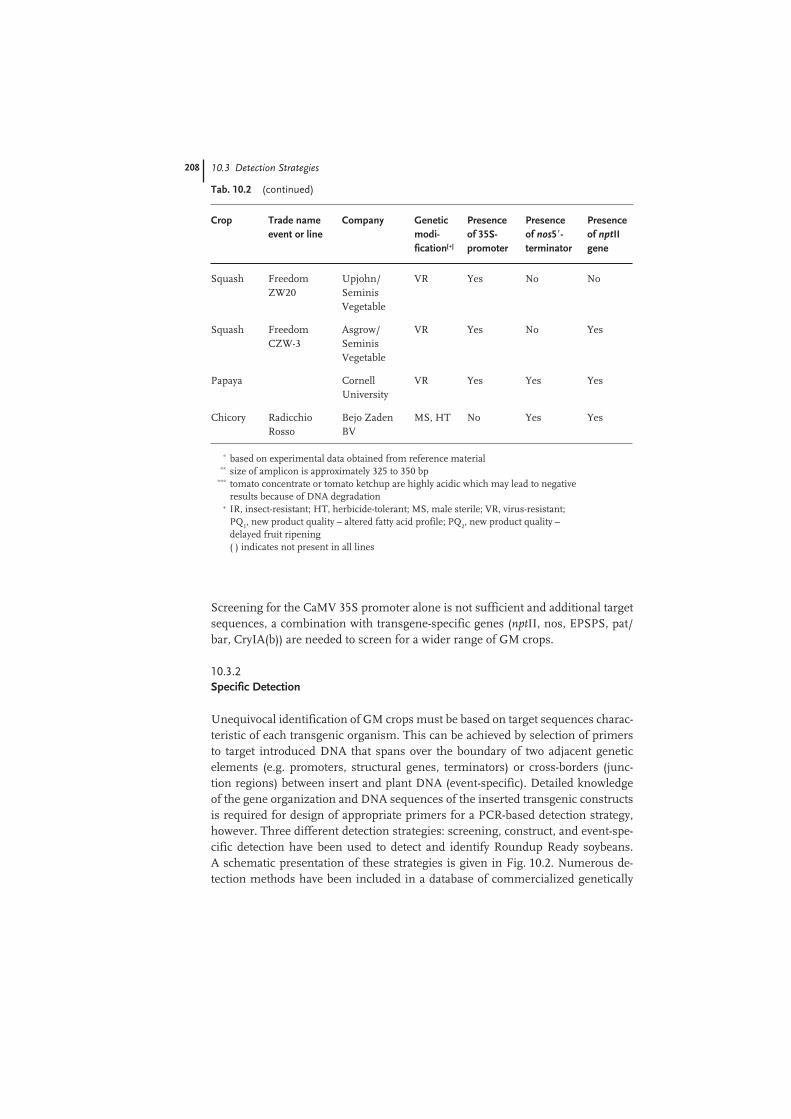
Tab. 10.2 Applicability of potential screening methods for detection of genetically modified crops (selection) based on Agbios database (www.agbios.com) [13] and additional data.
Crop Trade nameevent or line
Company Geneticmodi-fication[+]
Presence of 35S- promoter
Presence of nos5�-terminator
Presence of nptII gene
Maize[*] MaximizerBt-176
Syngenta Seeds
IR Yes No No
Maize[*] Bt-11 Syngenta Seeds
IR Yes Yes No
Maize Bt Xtra DBT 418
Dekalb Genetics
IR, HT Yes No No
Maize[*] LibertyLink T25
Aventis CropScience (formerly AgrEvo)
HT Yes No No
Maize[*] StarLinkCBH-351
Aventis IR Yes Yes No
Maize Roundup ReadyGA21
Monsanto HT No Yes No
Maize Roundup ReadyNK603
Monsanto HT Yes Yes No
Maize[*] Yieldgard Mon 810
Monsanto IR Yes No Yes[**]
20710 Detection Methods for Genetically Modified Crops
Soybean[*] Roundup ReadyGTS 40-3-2
Monsanto HR Yes Yes No
Cotton BXN cotton Calgene HT No No Yes
Cotton Calgene HT, IR Yes No Yes
Cotton 19-51A Du Pont HT No No No
Cotton Bollgard, Ingard
Monsanto IR Yes Yes Yes
Cotton Roundup Ready
Monsanto HT Yes Yes Yes
Rapeseed LibertyLink Innovator, HCN92
Aventis HT Yes No Yes
Rapeseed MS8 × RF3 Aventis (formerly Plant Genetic Systems)
HT, MS No Yes Yes
Rapeseed 23-18-17, 23-198
Calgene PQ1
No No Yes
Rapeseed Roundup Ready
Monsanto HR No No No
Potato[*] NewLeaf Monsanto IR Yes Yes Yes
Potato[*] NewLeaf Y Monsanto IR, VR No Yes Yes
Potato[*] Russet Burbank, NewLeaf Plus
Monsanto IR, VR No Yes (Yes)
Tomato[*,***] Flavr Savr (MacGregor)
Calgene PQ2
Yes No Yes
Tomato[*,***] Zeneca Seeds PQ2
Yes Yes Yes
Tomato[***]
1345-4DNA plant Technology
PQ2
Yes Yes Yes
Crop Trade nameevent or line
Company Geneticmodi-fication[+]
Presence of 35S- promoter
Presence of nos5�-terminator
Presence of nptII gene
Tab. 10.2 (continued)
208
Screening for the CaMV 35S promoter alone is not sufficient and additional target sequences, a combination with transgene-specific genes (nptII, nos, EPSPS, pat/bar, CryIA(b)) are needed to screen for a wider range of GM crops.
10.3.2 Specific Detection
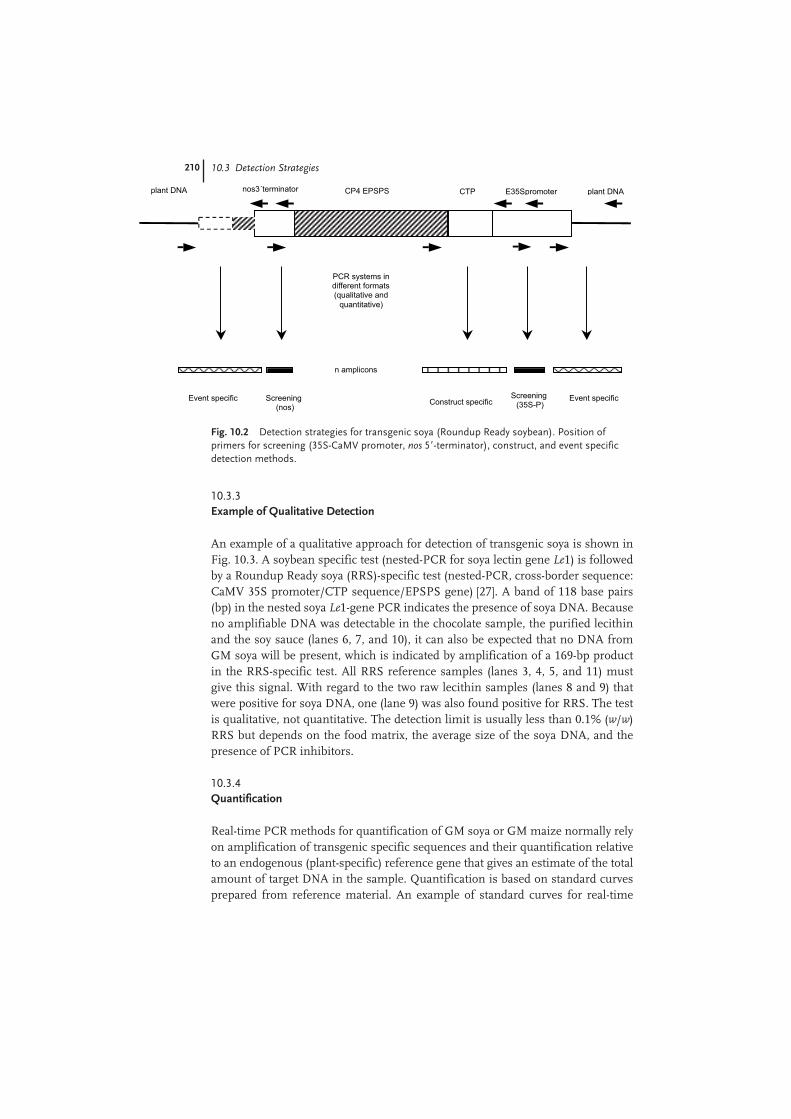
Unequivocal identification of GM crops must be based on target sequences charac-teristic of each transgenic organism. This can be achieved by selection of primers to target introduced DNA that spans over the boundary of two adjacent genetic elements (e.g. promoters, structural genes, terminators) or cross-borders (junc-tion regions) between insert and plant DNA (event-specific). Detailed knowledge of the gene organization and DNA sequences of the inserted transgenic constructs is required for design of appropriate primers for a PCR-based detection strategy, however. Three different detection strategies: screening, construct, and event-spe-cific detection have been used to detect and identify Roundup Ready soybeans. A schematic presentation of these strategies is given in Fig. 10.2. Numerous de-tection methods have been included in a database of commercialized genetically
10.3 Detection Strategies
Squash Freedom ZW20
Upjohn/ Seminis Vegetable
VR Yes No No
Squash Freedom CZW-3
Asgrow/ Seminis Vegetable
VR Yes No Yes
Papaya Cornell University
VR Yes Yes Yes
Chicory Radicchio Rosso
Bejo Zaden BV
MS, HT No Yes Yes
* based on experimental data obtained from reference material ** size of amplicon is approximately 325 to 350 bp *** tomato concentrate or tomato ketchup are highly acidic which may lead to negative results because of DNA degradation + IR, insect-resistant; HT, herbicide-tolerant; MS, male sterile; VR, virus-resistant; PQ
1, new product quality – altered fatty acid profile; PQ
2, new product quality –
delayed fruit ripening ( ) indicates not present in all lines
Crop Trade nameevent or line
Company Geneticmodi-fication[+]
Presence of 35S- promoter
Presence of nos5�-terminator
Presence of nptII gene
Tab. 10.2 (continued)
209
modified foods that gives detailed information about analytical conditions and the references to the original publication and validation data [14].
Demonstration of the presence of amplifiable DNA in a food matrix using uni-versal or plant species-specific PCR assays is recommended before any screening or GM crop identification [15–26], as shown in Table 10.3. The presence or absence of DNA originating from soya extracted from highly processed food can be checked by use of soya-specific PCR systems, for example lectin Le1 (single copy gene) [15]. Other control PCR systems have been described for maize DNA (zein gene, alco-hol dehydrogenase, high mobility group protein, or maize invertase) [16, 17, 26], potato (patatin gene) [18], and rapeseed (acetyl-CoA carboxylase, cruciferin, and na-pin) [20, 21], and also for the natural presence of CaMV in infected vegetables [22], for example Broccoli (Table 10.3). Plant-specific genes are used as a reference for qualitative and quantitative PCR detection of GM crops in mixed food samples.
10 Detection Methods for Genetically Modified Crops
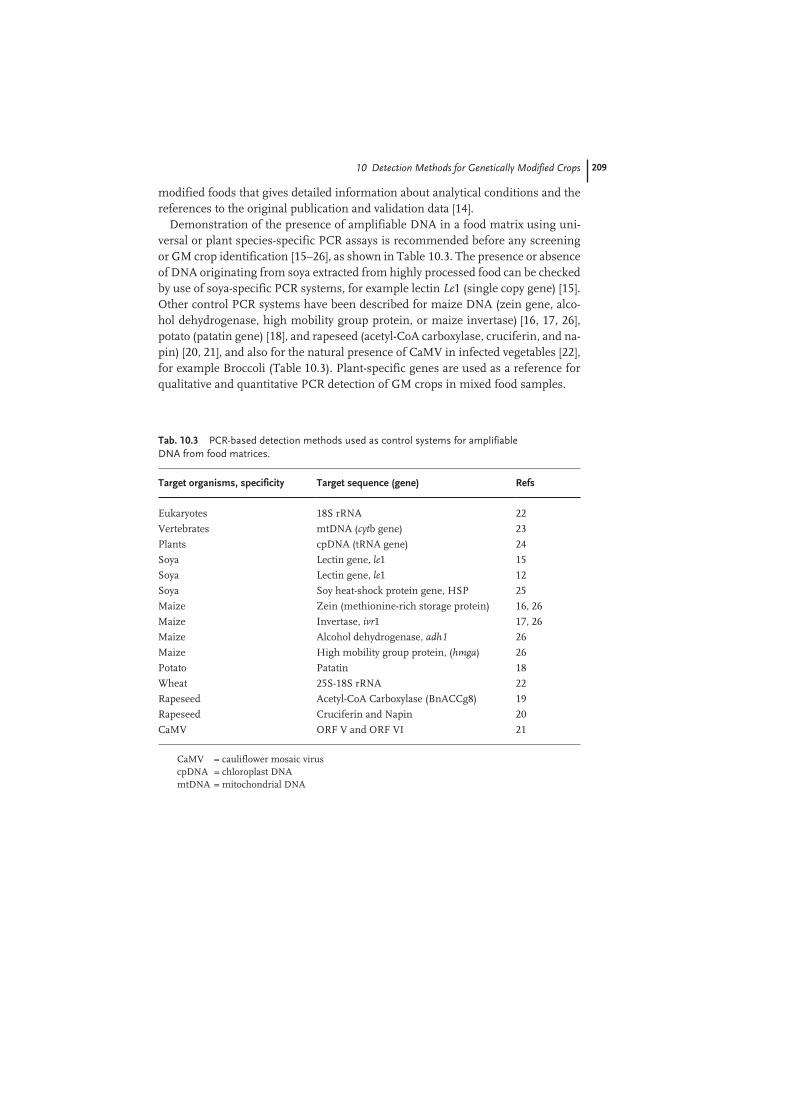
Tab. 10.3 PCR-based detection methods used as control systems for amplifiable DNA from food matrices.
Target organisms, specificity Target sequence (gene) Refs
Eukaryotes 18S rRNA 22
Vertebrates mtDNA (cytb gene) 23
Plants cpDNA (tRNA gene) 24
Soya Lectin gene, le1 15
Soya Lectin gene, le1 12
Soya Soy heat-shock protein gene, HSP 25
Maize Zein ( methionine-rich storage protein) 16, 26
Maize Invertase, ivr1 17, 26
Maize Alcohol dehydrogenase, adh1 26
Maize High mobility group protein, (hmga) 26
Potato Patatin 18
Wheat 25S-18S rRNA 22
Rapeseed Acetyl-CoA Carboxylase (BnACCg8) 19
Rapeseed Cruciferin and Napin 20
CaMV ORF V and ORF VI 21
CaMV = cauliflower mosaic viruscpDNA = chloroplast DNAmtDNA = mitochondrial DNA
210
10.3.3 Example of Qualitative Detection
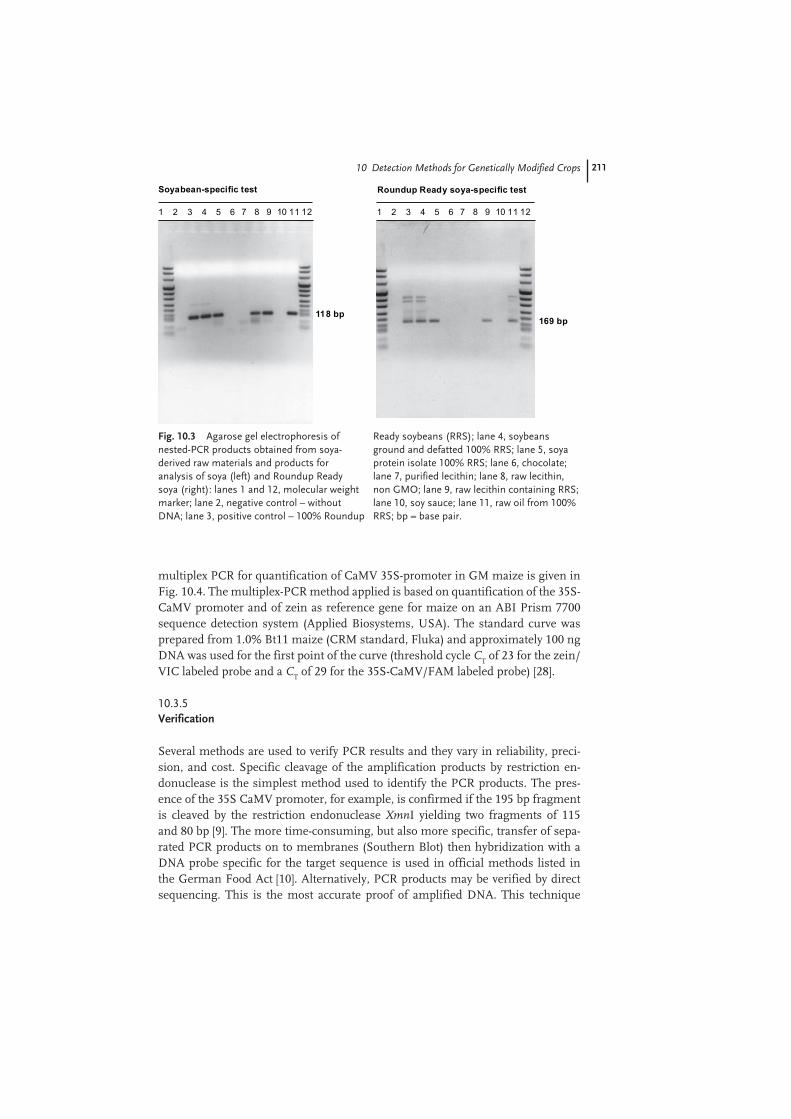
An example of a qualitative approach for detection of transgenic soya is shown in Fig. 10.3. A soybean specific test (nested- PCR for soya lectin gene Le1) is followed by a Roundup Ready soya (RRS)-specific test ( nested-PCR, cross-border sequence: CaMV 35S promoter/CTP sequence/ EPSPS gene) [27]. A band of 118 base pairs (bp) in the nested soya Le1-gene PCR indicates the presence of soya DNA. Because no amplifiable DNA was detectable in the chocolate sample, the purified lecithin and the soy sauce (lanes 6, 7, and 10), it can also be expected that no DNA from GM soya will be present, which is indicated by amplification of a 169-bp product in the RRS-specific test. All RRS reference samples (lanes 3, 4, 5, and 11) must give this signal. With regard to the two raw lecithin samples (lanes 8 and 9) that were positive for soya DNA, one (lane 9) was also found positive for RRS. The test is qualitative, not quantitative. The detection limit is usually less than 0.1% (w/w) RRS but depends on the food matrix, the average size of the soya DNA, and the presence of PCR inhibitors.
10.3.4 Quantification
Real-time PCR methods for quantification of GM soya or GM maize normally rely on amplification of transgenic specific sequences and their quantification relative to an endogenous (plant-specific) reference gene that gives an estimate of the total amount of target DNA in the sample. Quantification is based on standard curves prepared from reference material. An example of standard curves for real-time
10.3 Detection Strategies
nos3 ́terminatorplant DNA plant DNACP4 EPSPS CTP E35S promoter
n amplicons
Event specific Event specificScreening (nos)
Screening (35S-P)
PCR systems indifferent formats(qualitative and
quantitative)
Construct specific
Fig. 10.2 Detection strategies for transgenic soya ( Roundup Ready soybean). Position of primers for screening (35S-CaMV promoter, nos 5�-terminator), construct, and event specific detection methods.
211
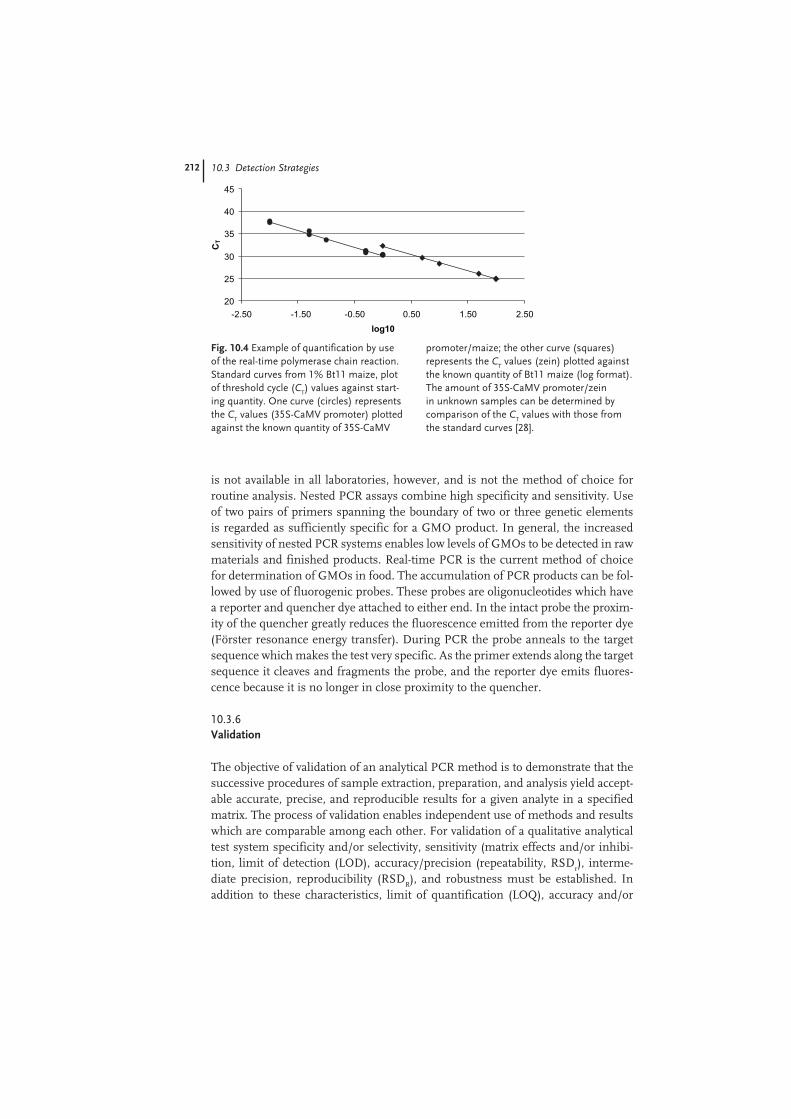
multiplex PCR for quantification of CaMV 35S- promoter in GM maize is given in Fig. 10.4. The multiplex-PCR method applied is based on quantification of the 35S-CaMV promoter and of zein as reference gene for maize on an ABI Prism 7700 sequence detection system (Applied Biosystems, USA). The standard curve was prepared from 1.0% Bt11 maize (CRM standard, Fluka) and approximately 100 ng DNA was used for the first point of the curve (threshold cycle C
T of 23 for the zein/
VIC labeled probe and a CT of 29 for the 35S-CaMV/FAM labeled probe) [28].
10.3.5 Verification
Several methods are used to verify PCR results and they vary in reliability, preci-sion, and cost. Specific cleavage of the amplification products by restriction en-donuclease is the simplest method used to identify the PCR products. The pres-ence of the 35S CaMV promoter, for example, is confirmed if the 195 bp fragment is cleaved by the restriction endonuclease XmnI yielding two fragments of 115 and 80 bp [9]. The more time-consuming, but also more specific, transfer of sepa-rated PCR products on to membranes (Southern Blot) then hybridization with a DNA probe specific for the target sequence is used in official methods listed in the German Food Act [10]. Alternatively, PCR products may be verified by direct sequencing. This is the most accurate proof of amplified DNA. This technique
10 Detection Methods for Genetically Modified Crops
169 bp118 bp
121 2 3 4 5 6 7 8 9 10 11
Soyabean-specific test Roundup Ready soya-specific test
121 2 3 4 5 6 7 8 9 10 11
Fig. 10.3 Agarose gel electrophoresis of nested-PCR products obtained from soya-derived raw materials and products for analysis of soya (left) and Roundup Ready soya (right): lanes 1 and 12, molecular weight marker; lane 2, negative control – without DNA; lane 3, positive control – 100% Roundup
Ready soybeans (RRS); lane 4, soybeans ground and defatted 100% RRS; lane 5, soya protein isolate 100% RRS; lane 6, chocolate; lane 7, purified lecithin; lane 8, raw lecithin, non GMO; lane 9, raw lecithin containing RRS; lane 10, soy sauce; lane 11, raw oil from 100% RRS; bp = base pair.
212
is not available in all laboratories, however, and is not the method of choice for routine analysis. Nested PCR assays combine high specificity and sensitivity. Use of two pairs of primers spanning the boundary of two or three genetic elements is regarded as sufficiently specific for a GMO product. In general, the increased sensitivity of nested PCR systems enables low levels of GMOs to be detected in raw materials and finished products. Real-time PCR is the current method of choice for determination of GMOs in food. The accumulation of PCR products can be fol-lowed by use of fluorogenic probes. These probes are oligonucleotides which have a reporter and quencher dye attached to either end. In the intact probe the proxim-ity of the quencher greatly reduces the fluorescence emitted from the reporter dye ( Förster resonance energy transfer). During PCR the probe anneals to the target sequence which makes the test very specific. As the primer extends along the target sequence it cleaves and fragments the probe, and the reporter dye emits fluores-cence because it is no longer in close proximity to the quencher.
10.3.6 Validation
The objective of validation of an analytical PCR method is to demonstrate that the successive procedures of sample extraction, preparation, and analysis yield accept-able accurate, precise, and reproducible results for a given analyte in a specified matrix. The process of validation enables independent use of methods and results which are comparable among each other. For validation of a qualitative analytical test system specificity and/or selectivity, sensitivity (matrix effects and/or inhibi-tion, limit of detection (LOD), accuracy/precision (repeatability, RSD
r), interme-
diate precision, reproducibility (RSDR), and robustness must be established. In
addition to these characteristics, limit of quantification (LOQ), accuracy and/or
10.3 Detection Strategies
20
25
30
35
40
45
-2.50 -1.50 -0.50 0.50 1.50 2.50
log10
CT
Fig. 10.4 Example of quantification by use of the real-time polymerase chain reaction. Standard curves from 1% Bt11 maize, plot of threshold cycle (C
T) values against start-
ing quantity. One curve (circles) represents the C
T values (35S-CaMV promoter) plotted
against the known quantity of 35S-CaMV
promoter/ maize; the other curve (squares) represents the C
T values (zein) plotted against
the known quantity of Bt11 maize (log format). The amount of 35S-CaMV promoter/zein in unknown samples can be determined by comparison of the C
T values with those from
the standard curves [28].
213
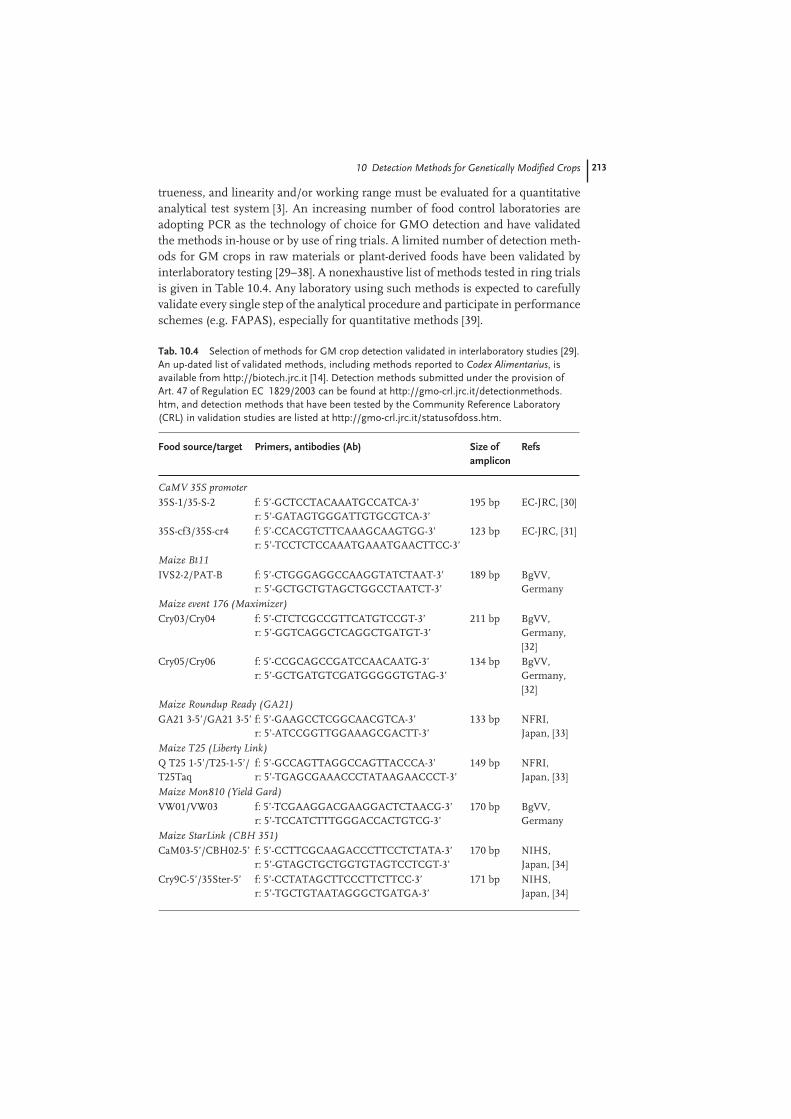
trueness, and linearity and/or working range must be evaluated for a quantitative analytical test system [3]. An increasing number of food control laboratories are adopting PCR as the technology of choice for GMO detection and have validated the methods in-house or by use of ring trials. A limited number of detection meth-ods for GM crops in raw materials or plant-derived foods have been validated by interlaboratory testing [29–38]. A nonexhaustive list of methods tested in ring trials is given in Table 10.4. Any laboratory using such methods is expected to carefully validate every single step of the analytical procedure and participate in performance schemes (e.g. FAPAS), especially for quantitative methods [39].
10 Detection Methods for Genetically Modified Crops
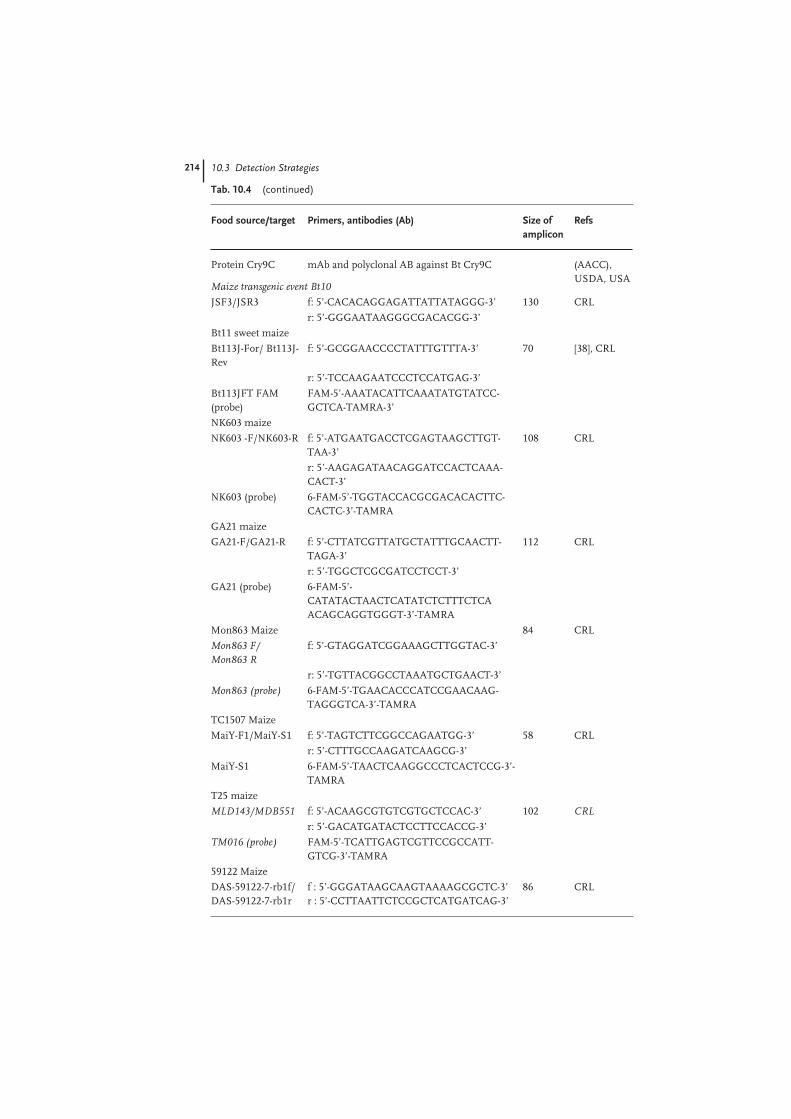
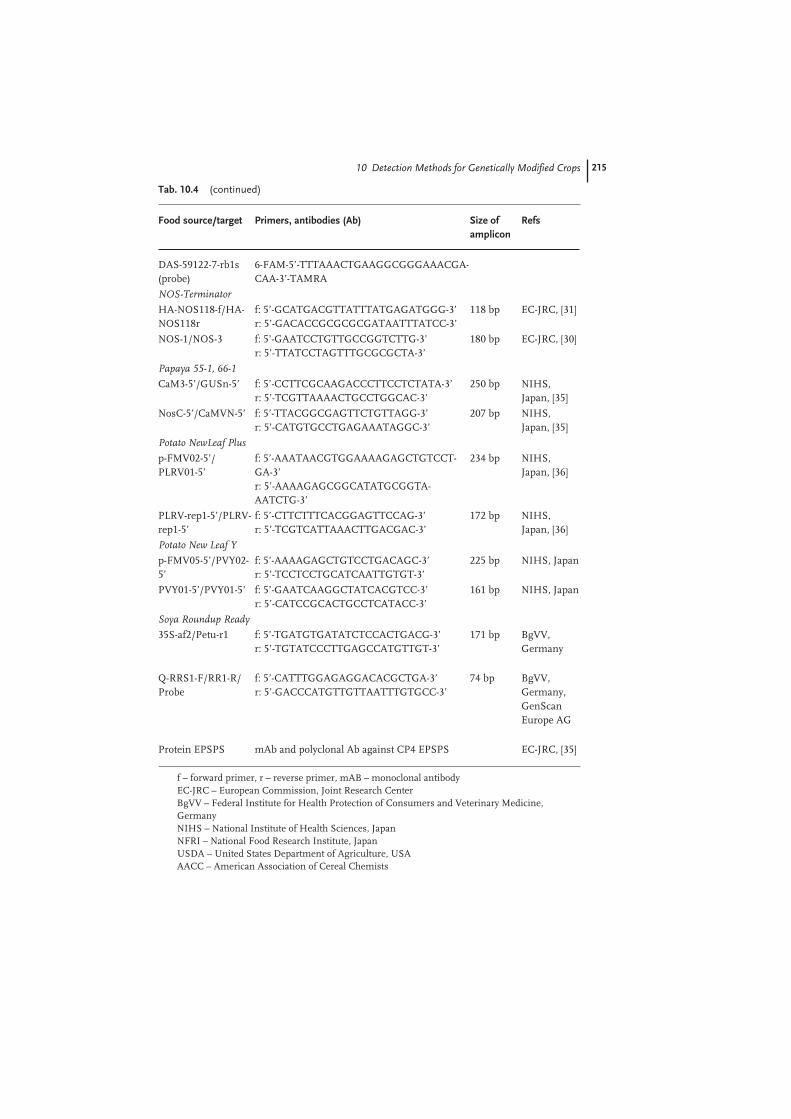
Tab. 10.4 Selection of methods for GM crop detection validated in interlaboratory studies [29]. An up-dated list of validated methods, including methods reported to Codex Alimentarius, is available from http://biotech.jrc.it [14]. Detection methods submitted under the provision of Art. 47 of Regulation EC 1829/2003 can be found at http://gmo-crl.jrc.it/detectionmethods.htm, and detection methods that have been tested by the Community Reference Laboratory (CRL) in validation studies are listed at http://gmo-crl.jrc.it/statusofdoss.htm.
Food source/target Primers, antibodies (Ab) Size of amplicon
Refs
CaMV 35S promoter
35S-1/35-S-2 f: 5’-GCTCCTACAAATGCCATCA-3’r: 5’-GATAGTGGGATTGTGCGTCA-3’
195 bp EC-JRC, [30]
35S-cf3/35S-cr4 f: 5’-CCACGTCTTCAAAGCAAGTGG-3’r: 5’-TCCTCTCCAAATGAAATGAACTTCC-3’
123 bp EC-JRC, [31]
Maize Bt11
IVS2-2/PAT-B f: 5’-CTGGGAGGCCAAGGTATCTAAT-3’r: 5’-GCTGCTGTAGCTGGCCTAATCT-3’
189 bp BgVV, Germany
Maize event 176 (Maximizer)
Cry03/Cry04 f: 5’-CTCTCGCCGTTCATGTCCGT-3’r: 5’-GGTCAGGCTCAGGCTGATGT-3’
211 bp BgVV, Germany, [32]
Cry05/Cry06 f: 5’-CCGCAGCCGATCCAACAATG-3’r: 5’-GCTGATGTCGATGGGGGTGTAG-3’
134 bp BgVV, Germany, [32]
Maize Roundup Ready (GA21)
GA21 3-5’/GA21 3-5’ f: 5’-GAAGCCTCGGCAACGTCA-3’r: 5’-ATCCGGTTGGAAAGCGACTT-3’
133 bp NFRI, Japan, [33]
Maize T25 (Liberty Link)
Q T25 1-5’/ T25-1-5’/T25Taq
f: 5’-GCCAGTTAGGCCAGTTACCCA-3’r: 5’-TGAGCGAAACCCTATAAGAACCCT-3’
149 bp NFRI, Japan, [33]
Maize Mon810 (Yield Gard)
VW01/VW03 f: 5’-TCGAAGGACGAAGGACTCTAACG-3’r: 5’-TCCATCTTTGGGACCACTGTCG-3’
170 bp BgVV, Germany
Maize StarLink (CBH 351)
CaM03-5’/CBH02-5’ f: 5’-CCTTCGCAAGACCCTTCCTCTATA-3’r: 5’-GTAGCTGCTGGTGTAGTCCTCGT-3’
170 bp NIHS, Japan, [34]
Cry9C-5’/35Ster-5’ f: 5’-CCTATAGCTTCCCTTCTTCC-3’r: 5’-TGCTGTAATAGGGCTGATGA-3’
171 bp NIHS, Japan, [34]
214 10.3 Detection Strategies
Protein Cry9C mAb and polyclonal AB against Bt Cry9C (AACC), USDA, USA
Maize transgenic event Bt10
JSF3/JSR3 f: 5’-CACACAGGAGATTATTATAGGG-3’ 130 CRL
r: 5’-GGGAATAAGGGCGACACGG-3’
Bt11 sweet maize
Bt113J-For/ Bt113J-Rev
f: 5’-GCGGAACCCCTATTTGTTTA-3’ 70 [38], CRL
r: 5’-TCCAAGAATCCCTCCATGAG-3’
Bt113JFT FAM (probe)
FAM-5’-AAATACATTCAAATATGTATCC-GCTCA-TAMRA-3’
NK603 maize
NK603 -F/NK603-R f: 5’-ATGAATGACCTCGAGTAAGCTTGT-TAA-3’
108 CRL
r: 5’-AAGAGATAACAGGATCCACTCAAA-CACT-3’
NK603 (probe) 6-FAM-5’-TGGTACCACGCGACACACTTC-CACTC-3’-TAMRA
GA21 maize
GA21-F/GA21-R f: 5’-CTTATCGTTATGCTATTTGCAACTT-TAGA-3’
112 CRL
r: 5’-TGGCTCGCGATCCTCCT-3’
GA21 (probe) 6-FAM-5’-CATATACTAACTCATATCTCTTTCTCAACAGCAGGTGGGT-3’-TAMRA
Mon863 Maize 84 CRL
Mon863 F/Mon863 R
f: 5’-GTAGGATCGGAAAGCTTGGTAC-3’
r: 5’-TGTTACGGCCTAAATGCTGAACT-3’
Mon863 (probe) 6-FAM-5’-TGAACACCCATCCGAACAAG-TAGGGTCA-3’-TAMRA
TC1507 Maize
MaiY-F1/MaiY-S1 f: 5’-TAGTCTTCGGCCAGAATGG-3’ 58 CRL
r: 5’-CTTTGCCAAGATCAAGCG-3’
MaiY-S1 6-FAM-5’-TAACTCAAGGCCCTCACTCCG-3’-TAMRA
T25 maize
MLD143/MDB551 f: 5’-ACAAGCGTGTCGTGCTCCAC-3’ 102 CRL
r: 5’-GACATGATACTCCTTCCACCG-3’
TM016 (probe) FAM-5’-TCATTGAGTCGTTCCGCCATT-GTCG-3’-TAMRA
59122 Maize
DAS-59122-7-rb1f/ DAS-59122-7-rb1r
f : 5’-GGGATAAGCAAGTAAAAGCGCTC-3’r : 5’-CCTTAATTCTCCGCTCATGATCAG-3’
86 CRL
Food source/target Primers, antibodies (Ab) Size of amplicon
Refs
Tab. 10.4 (continued)
21510 Detection Methods for Genetically Modified Crops
DAS-59122-7-rb1s (probe)
6-FAM-5’-TTTAAACTGAAGGCGGGAAACGA-CAA-3’-TAMRA
NOS-Terminator
HA-NOS118-f/HA-NOS118r
f: 5’-GCATGACGTTATTTATGAGATGGG-3’r: 5’-GACACCGCGCGCGATAATTTATCC-3’
118 bp EC-JRC, [31]
NOS-1/NOS-3 f: 5’-GAATCCTGTTGCCGGTCTTG-3’r: 5’-TTATCCTAGTTTGCGCGCTA-3’
180 bp EC-JRC, [30]
Papaya 55-1, 66-1
CaM3-5’/GUSn-5’ f: 5’-CCTTCGCAAGACCCTTCCTCTATA-3’r: 5’-TCGTTAAAACTGCCTGGCAC-3’
250 bp NIHS, Japan, [35]
NosC-5’/CaMVN-5’ f: 5’-TTACGGCGAGTTCTGTTAGG-3’r: 5’-CATGTGCCTGAGAAATAGGC-3’
207 bp NIHS, Japan, [35]
Potato NewLeaf Plus
p-FMV02-5’/PLRV01-5’
f: 5’-AAATAACGTGGAAAAGAGCTGTCCT-GA-3’r: 5’-AAAAGAGCGGCATATGCGGTA-AATCTG-3’
234 bp NIHS, Japan, [36]
PLRV-rep1-5’/PLRV-rep1-5’
f: 5’-CTTCTTTCACGGAGTTCCAG-3’r: 5’-TCGTCATTAAACTTGACGAC-3’
172 bp NIHS, Japan, [36]
Potato New Leaf Y
p-FMV05-5’/PVY02-5’
f: 5’-AAAAGAGCTGTCCTGACAGC-3’r: 5’-TCCTCCTGCATCAATTGTGT-3’
225 bp NIHS, Japan
PVY01-5’/PVY01-5’ f: 5’-GAATCAAGGCTATCACGTCC-3’r: 5’-CATCCGCACTGCCTCATACC-3’
161 bp NIHS, Japan
Soya Roundup Ready
35S-af2/Petu-r1 f: 5’-TGATGTGATATCTCCACTGACG-3’r: 5’-TGTATCCCTTGAGCCATGTTGT-3’
171 bp BgVV, Germany
Q-RRS1-F/RR1-R/Probe
f: 5’-CATTTGGAGAGGACACGCTGA-3’r: 5’-GACCCATGTTGTTAATTTGTGCC-3’
74 bp BgVV, Germany,GenScan Europe AG
Protein EPSPS mAb and polyclonal Ab against CP4 EPSPS EC-JRC, [35]
f – forward primer, r – reverse primer, mAB – monoclonal antibodyEC-JRC – European Commission, Joint Research CenterBgVV – Federal Institute for Health Protection of Consumers and Veterinary Medicine, GermanyNIHS – National Institute of Health Sciences, JapanNFRI – National Food Research Institute, JapanUSDA – United States Department of Agriculture, USAAACC – American Association of Cereal Chemists
Food source/target Primers, antibodies (Ab) Size of amplicon
Refs
Tab. 10.4 (continued)
216
10.4 Outlook, Conclusions
Although one could question the scientific basis of parts of the current and pend-ing EU GMO regulations and whether they will achieve the desired objective of restoring consumer confidence, they are reality in the European Union. Industry must therefore cope with their requirements and find solutions which are both acceptable to consumers and economically feasible. Thresholds and IP play a very important role in finding these solutions. The current threshold has initiated sub-stantial activity along the chain and there are chances that newly proposed regula-tions will not reduce these efforts. In an average industrial setting incoming raw materials will be tested for the presence of (known) GM varieties. Immunoassays can be used for primary materials whereas for each subsequent point of analysis, i.e. after transport, processing steps, etc., PCR methods will be used. ELISA-based techniques were initially used as the method of analysis for determination of GM crops in food ingredients (e.g. soya flour in flour) but these were found to be less appropriate for determination of GMOs in compound foods. If raw materials are analyzed, protein-based methods could be an alternative to DNA-based PCR meth-ods. The latter will be applied for both qualitative and quantitative purposes. Al-though real-time PCR is the method of choice for the quantification of DNA, it is difficult to measure low levels of GM material in processed food.
Although there are still question marks about reliability of the different meth-ods and about the availability of probes for those GMOs that can reasonably be expected to be present in a given lot, the overall experience is that for practical pur-poses the methods are workable. New GM traits of a variety of crops are in develop-ment and will enter the market sooner or later, and existing commercialized GM products will disappear. Continuous monitoring of the level of GM materials and identification of variety genotypes will therefore be prerequisites for verification of non-GMO status in the supply chain, and validated methods are required.
The question that remains is whether the effort devoted to this issue is justified in relation to other issues the agro-food chain is facing.
10.4 Outlook Conclusions
217
1 E. Anklam and D.A. Neumann, J. AOAC Int., 2002, 85, 754–756.
2 G. Van den Eede, S. Kay, E. Anklam, H. Schimmel, J. AOAC Int., 2002, 85, 757–761.
3 E. Anklam, F. Gadani, P. Heinze, H. Pijnenburg, and G. Van den Eede, Eur. Food Res. Technol. 2002, 214, 3–26.
4 R. Meyer, Food Control, 1999, 10, 391–399. 5 ISO 13890: Cereals, pulses and milled
products – sampling of static batches. 6 http://www.gipsa.usda.gov/biotech/sam-
pling_grains_for_biotechnolog.htm 7 Detection of genetically modified organ-
isms and derived products – sampling. CEN/TC 275/WG11. ISO/DIS 21568:2005
8 Commission Recommendation 2004/787/EC of 4 October 2004 on techni-cal guidance for sampling and detection of genetically modified organisms and material produced from genetically modi-fied organisms as or in products in the context of Regulation (EC) No 1830/2003, Official Journal of the European Union L348 from 24.11.2004, p. 18.
9 Swiss Food Manual (2002), chapter 52B, (CD-ROM available from BBL-EDMZ, CH-3030 Bern, Ed. Bundesamt für Ge-sundheit, Facheinheit Lebensmittel und Gebrauchsgegenstände, Bern. E-mail: [email protected].
10 Official Collection of Test Methods (1998) Detection of a genetic modifica-tion of soybeans by amplification of the modified DNA sequence by means of the polymerase chain reaction (PCR) and hybridisation of the PCR product with a DNA probe. German Federal Foodstuffs Act – Food Analysis, article 35, L 23.01.22-1. Beuth, Berlin Köln.
11 K. Meyer, C. Rosa, C. Hischenhuber, R. Meyer, J. AOAC Int., 2001, 84, 89–99.
12 A. Wurz, H. Rüggeberg, P. Brodmann, H.U. Waiblinger, K. Pietsch, Dt. Lebensm. Rundsch., 1998, 94, 159–161.
13 AGBIOS, Agriculture and Biotechnology Strategies Inc., Canada. (http://www.agbios.com).
14 DMIF-GEN (1999) Development of meth-ods to identify foods produced by means of genetic engineering. EU-Project SMT4-
CT96-2072. DMIF-GEN Final Report, 15 December 1999. DMIF-GEN database (http://biotech.jrc.it/documents/GMO-methods-Report-PCR.pdf).
15 R. Meyer, F.Chardonnens, P. Hübner, J. Lüthy, Z. Lebensm. Unters. Forsch. 1996, 203, 339–344.
16 E. Studer, C. Rhyner, J. Lüthy, P. Hübner, Mitt. Gebiete Lebensm. Hyg. 1997, 88, 515–524.
17 B. Ehlers, E. Strauch, M. Goltz, D. Kubsch, H. Wagner, H. Maidhof, B. Bendiek, B. Appel, H.-J. Buhk, Bundesge-sundheitsbl., 1997, 4, 118–121.
18 C. Wolf, P. Hübner, J. Lüthy, Mitt. Gebiete Lebensm. Hyg. 2001, 92, 159–167.
19 M. Hernández, A. Río, T. Esteve, S. Prat, M. Pla, J. Agric. Food Chem., 2001, 49, 3622–3627.
20 C. Wolf and J. Lüthy, Mitt. Lebensm. Hyg. 2000, 91, 352–355.
21 C. Wolf, M. Scherzinger, A. Wurz, U. Pauli, P. Hübner, J. Lüthy, Eur. Food Res. Technol., 2000, 201, 367–372.
22 M. Allmann, U. Candrian, J. Lüthy, Z. Lebensm. Unters. Forsch. 1993, 196, 248–251
23 R. Meyer, Ch. Höfelein, J. Lüthy, U. Can-drian, J. AOAC Int., 1995, 78, 1542–1551.
24 P. Taberlet, L. Gielly, G. Pautou, J. Bou-vet, Plant Mol. Biol. 1991, 17, 1105–1109.
25 G. van Duijn, Chemisch Magazine, 1997, 411–413.
26 M. Hernández, M.-N. Duplan, G. Berthier, M. Vaitilingom, W. Hauser, R. Freyer, M. Pla and Y. Bertheau. J. Agric. Food Chem. 2004, 52, 4632–4637.
27 R. Meyer and E. Jaccaud (1997) Detection of genetically modified soya in processed food products; development and valida-tion of a PCR assay for the specific detec-tion of Glyphosate-Tolerant Soybeans. In: R. Amado, R. Battaglia (eds) Proceed-ings 9th European Conference on Food Chemistry. Authenticity and adulteration of food – the analytical approach, vol. 1. Interlaken, Switzerland 24–26 September 1997, pp 23–28.
28 M. Höhne, C. Rosa Santisi, R. Meyer, Eur Food Res. Technol., 2002, 215, 59–64.
10 Detection Methods for Genetically Modified Crops
References
218
29 Codex Alimentarius Commission. Codex Committee on Methods of Analysis and Sampling, 24th Session, Budapest, Hungary, 18–22 November 2002. (ftp://ftp.fao.org/codex/ccmas24/ma02_08e.pdf)
30 M. Lipp, E. Anklam, P. Brodmann, K. Pietsch, J. Pauwels, Food Control 10, 1999, 379–383.
31 M. Lipp, A. Bluth, F. Eyquem, L. Kruse, H. Schimmel, G. Van den Eede, E. Anklam, 2001, Eur Food Res. Technol, 212, 497–504.
32 C. Hupfer, H. Hotzel, K. Sachse, K.-H. Engel, 1998, Z. Lebensm. Unters. Forsch. 206, 203–207.
33 Y. Shindo, H. Kuribara, T. Matsuoka, S. Futo, C. Sawada, J. Shono, H. Akiyama, Y. Goda, M. Toyoda, A. Hino, 2002, J. AOAC Int., 85, 1119–1126
34 T. Matsuoka, H. Kuribara, S. Suefuji, H. Miura, Y. Kusakabe, H. Akiyama, Y. Goda, K. Isshiki, M. Toyoda, A. Hino, 2001, J. Food Hyg. Doc. Japan, 42, 197–201.
35 Y. Goda, T. Asano, M. Shibuya, A. Hino, M. Toyoda, 2001, J. Food Hyg. Japan 42, 231–236.
36 H. Akiyama, K. Sugimoto, M. Matsumo-to, K. Isuzugawa, M. Shibuya, Y. Goda, M. Toyado, J. Food Hyg. Japan, 2002, 43, 24–29.
37 M. Lipp, E. Anklam, J. AOAC Int., 2000, 83, 919–927.
38 S.B. Rønning, M. Vaïtilingom, K. G. Berdal and A. Holst-Jensen. Eur. Food Res Technol 2003, 216, 347–354.
39 P. Hübner, H.-U. Waiblinger, K. Pietsch, P. Brodmann, J. AOAC Int., 2001, 84, 1855–1864.
References