gender-specific associations between physical functioning, bone quality, and fracture risk in older...
TRANSCRIPT

ORIGINAL RESEARCH
Gender-Specific Associations Between Physical Functioning, BoneQuality, and Fracture Risk in Older People
Regula Furrer • Natasja M. van Schoor •
Arnold de Haan • Paul Lips • Renate T. de Jongh
Received: 26 June 2013 / Accepted: 15 December 2013
� Springer Science+Business Media New York 2014
Abstract The aim of this study was to investigate which
parameters of physical functioning are associated with
bone quality and fracture risk and whether gender-specific
differences exist within these associations. We studied
1,486 participants of the Longitudinal Aging Study
Amsterdam. As measures of physical functioning, handgrip
strength, physical performance, and level of physical
activity were assessed. To assess bone quality, broadband
ultrasound attenuation (BUA) and speed of sound (SOS)
were measured at baseline using quantitative ultrasound
and bone mineral density (BMD) at baseline and after
3 years by dual-energy X-ray absorptiometry. In addition,
fracture incidence over 6 years was assessed. After
adjustment for confounders (age, serum 25[OH]D, smok-
ing, and body weight), in men, physical performance was
positively related to BUA, SOS, and BMD cross-section-
ally and to BMD longitudinally. Using Cox proportional
hazards model, in men higher handgrip strength and
physical performance were associated with reduced
fracture risk after adjustment for confounders (hazard ratio
[HR] 0.96, 95 % confidence interval [CI] 0.92–0.99, and
HR 0.89, 95 % CI 0.80–0.98, respectively). In women, a
moderate level of physical activity was related to reduced
fracture risk (HR 0.57, 95 % CI 0.33–0.99). In conclusion,
in men, higher handgrip strength and physical performance
are related to higher bone quality and reduced fracture risk,
whereas in women, a moderate to high level of physical
activity is associated with reduced fracture risk. These
measurements may contribute to the identification of
individuals at high fracture risk. Both the causality of and
explanations for gender-specific differences in these rela-
tionships remain subject to further studies.
Keywords Osteoporosis � Fracture � Risk factor �Handgrip strength � Physical performance � Physical
activity
Introduction
With increasing age, the prevalence of osteoporosis, char-
acterized by low bone mineral density (BMD), increases.
Low BMD in combination with increased fall incidence
among older people results in higher fracture risk [1]. After
the age of 60, approximately 44 % of women and 25 % of
men will experience at least one fracture [2]. The high
morbidity and mortality related to fractures at old age [3, 4]
underline the necessity to search for indicators to identify
individuals at high fracture risk. These indicators may be
used to select individuals who may benefit from additional
interventions to prevent fractures.
Mechanical loading is an important contributor to bone
quality. It seems likely that measures of physical func-
tioning, such as muscle strength, physical performance, and
The authors have stated that they have no conflict of interest.
R. Furrer � A. de Haan
Faculty of Human Movement Sciences, MOVE Research
Institute Amsterdam, VU University Amsterdam, Amsterdam,
The Netherlands
N. M. van Schoor
Department of Epidemiology and Biostatistics, EMGO Institute
for Health and Care Research, VU University Medical Center
Amsterdam, Amsterdam, The Netherlands
P. Lips � R. T. de Jongh (&)
Department of Internal Medicine and Endocrinology, MOVE
Research Institute Amsterdam, VU University Medical Center
Amsterdam, Amsterdam, The Netherlands
e-mail: [email protected]
123
Calcif Tissue Int
DOI 10.1007/s00223-013-9836-1

physical activity, are important determinants for BMD.
Low handgrip strength and physical performance have
been shown to be associated with lower BMD and higher
fracture risk [5–11]. In addition, differences in handgrip
strength and walking tests were able to discriminate
between fallers with fractures, fallers without fractures, and
nonfallers in older men [12]. These results suggest an
association between parameters of physical functioning,
BMD, and fracture risk in older people. However, it
remains unclear which measures of physical functioning
are related to bone quality both cross-sectionally and lon-
gitudinally and whether this translates into increased frac-
ture risk.
Since postmenopausal women are at highest risk for
osteoporosis and fractures, most studies focus on women
[5, 7, 8, 11, 13]. Since men and women differ in body
composition, hormonal status, and patterns of physical
activity, relationships between measures of physical func-
tioning and bone quality may be gender-specific [14, 15].
Therefore, it is of interest to study gender-specific differ-
ences in these associations.
The aim of the present study was to investigate (1)
which parameters of physical functioning, i.e., handgrip
strength, physical performance tests, or physical activity,
are associated with bone quality as estimated by calcaneal
quantitative ultrasound and X-ray absorptiometry; (2)
which parameters of physical functioning are related to
longitudinal changes in BMD and 6-year fracture risk; and
(3) whether gender-specific differences exist in the afore-
mentioned relationships.
Materials and Methods
Study Sample
For this study, data from the second (1995–1996) and third
(1998–1999) cycles of the Longitudinal Aging Study
Amsterdam (LASA) were analyzed. The LASA is an
ongoing interdisciplinary cohort study on predictors and
consequences of changes in physical, cognitive, emotional,
and social functioning in older people. The sampling and
data collection have been described in detail elsewhere
[16]. Briefly, a random sex- and age-stratified sample of
older men and women was drawn from population registers
of 11 municipalities in three different regions of the
Netherlands. The study was approved by the Medical
Ethics Committee of the VU University Medical Center
Amsterdam, and all participants gave informed consent.
During the medical interview of the second cycle, 1,509
individuals participated. The total population used in the
present study included individuals who participated in the
medical interview of the second LASA cycle and who were
included in at least one of the performed analyses
(n = 1,486).
Measures of Physical Functioning
Handgrip Strength
Maximal handgrip strength was determined using a strain
gauged dynamometer (Takei TKK 5001; Takei Scientific
Instruments, Tokyo, Japan) and recorded to the nearest
kilogram. Participants performed two maximal trials with
the right and left hands. The highest value of the right or
left hand was used for analyses.
Physical Performance
Physical performance was determined using three different
tests: the walking test, as measured by the time taken to walk
3 m, turn around 180�, and walk back 3 m as fast as possible;
the chair-stand test, as measured by the time taken to rise
from a chair and sit down again five times as fast as possible
without using the hands; and the balance test, as measured by
the time one is able to maintain a tandem stance (one foot
directly in front of the other) with a maximum of 10 s. The
time of the walking test and chair stand test was divided into
quartiles of the population giving 1–4 points (4 for the fastest
performance, 1 for the slowest performance, and 0 if the test
could not be finished). The time of the balance test was
divided into three categories: unable (0 points), able to hold
position for 4–9 s (2 points), and able to hold position for
10 s (4 points). Total score for physical performance ranged
0–12 and was calculated by the sum of the scores of the three
different performance tests.
Physical Activity
To assess the level of physical activity, the validated LASA
Physical Activity Questionnaire was used [17]. The ques-
tionnaire addresses the following activities over the past
2 weeks: walking outdoors, bicycling, gardening, light and
heavy household activities, and sports activities. Taking
into account the frequency and duration of these activities,
average time (minutes) spent on physical activity per day
was calculated. Physical activity showed a skewed distri-
bution and was therefore divided into tertiles. As all data
were stratified by gender (due to interaction effects, see
‘‘Results’’), physical activity tertiles were gender-specific.
The cut-off points were for men 65 and 135 min/day and
for women 118 and 193 min/day.
R. Furrer et al.: Physical Functioning, Bone Quality, and Fracture Risk
123
Bone Quality Measurements
Total-hip BMD was measured by dual-energy X-ray
absorptiometry (DXA; Hologic QDR 2000; Hologic,
Waltham, MA, USA). Scans were analyzed using the
software version V4.71A:1. Broadband ultrasound attenu-
ation (BUA in decibels per megahertz) and speed of sound
(SOS in meters per second) were assessed by quantitative
ultrasound (QUS; CUBA Clinical Instrument; McCue
Utrasonics, Winchester, UK) through the calcaneus by
placing two transducers on either side of the heel with
coupling gel. Both heels were measured twice, and mean
values of BUA and SOS of all four measurements were
used for further analyses. All participants were invited to
undergo QUS in participating hospitals or smaller health
centers near the participant’s home. Participants living in
Amsterdam or its vicinity were invited to undergo DXA
measurements at the VU University Medical Center
Amsterdam (study population n = 522). All BMD mea-
surements were performed with the same DXA scanner.
All QUS measurements were performed with CUBA
Clinical Instruments, but as these measurements were
performed in three different regions of the Netherlands,
three different scanners were used. BUA values were not
different between these three regions (70.7 [± 20.1], 71.6
[± 21.0], and 69.6 [± 20.4] dB/MHz, respectively).
However, SOS values were significantly different between
these regions: 1,601.5 (± 39.6), 1,657.7 (± 51.9), and
1,617.2 (± 43.3) m/s. To test whether the scanner used for
the measurements influenced the associations with SOS,
we performed all analyses with additional adjustment for
the scanner used. None of the associations changed after
additional adjustment for scanner and are therefore pre-
sented without the additional adjustment.
Assessment of Fractures
Fractures occurring between 1995–1996 and 1998–1999
were collected prospectively with a fracture calendar.
Participants were asked to mail the calendar with recorded
fractures every 3 months. If the calendar was not returned,
not completed, or completed incorrectly, participants were
contacted by telephone. Proxies were contacted if partici-
pants were not able to respond. Between 1998–1999 and
2001–2002, fracture incidence was assessed during the
medical interview and telephone interview. Once a par-
ticipant reported a fracture, a general practitioner was
requested to verify the fracture and to identify the type,
date, and cause of the fracture. If fractures were not con-
firmed by the general practitioner, original X-rays were
requested and assessed by an experienced medical doctor.
If original X-rays were not available, the participant was
recontacted with the goal of verification.
Potential Effect Modifiers and Confounders
Gender was tested as a potential effect modifier. Variables
that were related to physical functioning as well as bone
quality in previous analyses in the LASA, which could
therefore influence associations between those measures,
were considered potential confounders. Potential con-
founders were age, anthropometric variables (weight, body
mass index, waist circumference, and lean body mass),
physical activity, number of chronic diseases, alcohol use
(number of units per week), smoking (yes/no), medication
use (yes/no), serum 25-hydroxyvitamin D (25[OH]D) lev-
els, and serum levels of inflammatory markers (C-reactive
protein [CRP] and interleukin 6 [IL-6]) [18–20]. Physical
activity, number of chronic diseases, alcohol use, smoking,
and medication use were assessed during an interview
based on self-report.
Prior to blood sample collection, participants were
allowed to have tea and toast but no dairy products. Blood
was centrifuged and serum was stored at -20 �C. Serum
25(OH)D was measured by a competitive protein binding
assay (Nichols Diagnostics, Capistrano, CA, USA). CRP
and IL-6 were determined using sensitive enzyme-linked
immunosorbent assays at Sanquin Research (Amsterdam,
The Netherlands). Lean body mass was calculated from
DXA whole-body scans using software version V5.70A.
Statistical Analysis
Baseline differences between the genders were tested by
independent-samples t-tests for normally distributed data,
Mann–Whitney U tests for skewed data, and Chi squared
tests for categorical variables. Since CRP, IL-6, and alco-
hol use were not normally distributed, data were log-
transformed. Effect modification was defined by a statis-
tically significant interaction term (p \ 0.10). All potential
confounders were tested in regression models and consid-
ered relevant and kept in the model if they induced a
change of the b coefficient of at least 10 %. Multiple linear
regression analyses were performed to study associations
of physical functioning and BMD, BUA, or SOS. In lon-
gitudinal analyses between physical functioning and BMD,
baseline BMD was included in the model. Assumptions of
linear regression analysis were checked by histograms and
normal probability plots of the standardized residuals.
Associations with fracture risk were studied using Cox
proportional hazards regression analyses. The assumption
of a constant hazard rate over time was checked with a log-
minus-log plot. IBM SPSS Statistics 20 (SPSS, Inc.,
R. Furrer et al.: Physical Functioning, Bone Quality, and Fracture Risk
123

Chicago, IL, USA) was used for all statistical analyses.
Significance was reported as p \ 0.05.
Results
Subject Characteristics
Table 1 shows baseline characteristics of the study popu-
lation. Men were heavier but leaner than women. In addi-
tion, compared to women, men had a better physical
performance, higher handgrip strength, BMD, BUA, and
SOS; but they were less active. The higher physical activity
level of women was mainly explained by the greater time
spent on light household tasks.
To measure BMD, participants had to come to the VU
Medical Center in Amsterdam, which may have caused a
selection bias of those able to come to the hospital and those
who were less mobile. We analyzed the characteristics of the
individuals with a BMD measurement at baseline (n = 522)
and those without a BMD measurement (n = 964). Of all
subject characteristics presented in Table 1, the following
characteristics were significantly different between the two
groups (BMD vs. no-BMD): height (167.2 ± 8.8 vs.
165.8 ± 9.5 cm), age (75.2 ± 6.4 vs. 76.2 ± 6.8 years), lean
body mass (45.0 ± 8.8 vs. 36.8 ± 4.7 kg), medication use (72
vs. 78 %), serum 25(OH)D (50 ± 22 vs. 55 ± 25 nmol/L),
serum IL-6 (2.5 [1.6–3.8] vs. 1.6 [0.9–2.6] pg/mL), alcohol use
(4 [0.5–12.5] vs. 2 [0–7] drinks/week), physical activity (129
[81–201] vs. 124 [60–93] min/day), physical performance
(7.8 ± 2.8 vs. 6.8 ± 3.5 points), and SOS (1,603 ± 38 vs.
1,635 ± 53 m/s). These data show that the group with a BMD
measurement were 1 year younger and more fit/active than the
group without a BMD measurement.
Associations Between Physical Functioning and Bone
Quality
Gender was an effect modifier of associations between
handgrip strength and BUA and SOS measures cross-
Table 1 Characteristics of the study population
Men N Women N p value
Study population (%) 48 % 718 52 % 768
Age (years) 75.8 ± 6.6 718 75.8 ± 6.6 768 0.973
Weight (kg) 78.0 ± 11.9 709 71.0 ± 13.0 758 \0.001
Height (cm) 173.0 ± 6.8 707 160.0 ± 6.4 757 \0.001
BMI (kg/m2) 26.0 ± 3.4 706 27.7 ± 4.9 756 \0.001
Waist circumference (cm) 99.3 ± 10.3 685 92.6 ± 11.6 717 \0.001
Lean body mass (kg) 52.1 ± 5.7 255 37.9 ± 4.6 263 \0.001
Number of chronic diseases 2 (1–2) 718 2 (1–3) 768 0.001
Medication use (%) 74 % 532/717 78 % 596/768 0.125
Serum 25(OH)D (nmol/L) 57.9 ± 24.5 643 48.9 ± 24.0 677 \0.001
Serum IL-6 (pg/mL) 1.9 (1.2–3.2) 628 2.0 (1.1–3.15) 657 0.416
Serum CRP (lg/mL) 3.3 (1.6–6.7) 629 3.1 (1.4–6.5) 658 0.393
Current smoker (%) 25 % 183/718 13 % 99/768 \0.001
Alcohol use (drinks/week) 6 (1–21) 717 1 (0–6) 766 \0.001
Physical activity (min/day) 96.4 (51.3–162.9) 689 152.1 (98.6–218.5) 736 \0.001
Total walking time 15.0 (4.3–34.6) 12.9 (1.7–30.0) 0.002
Total bicycle time 0.0 (0.0–14.3) 0.0 (0.0–7.1) \0.001
Light household tasks 42.9 (12.9–75.0) 120.0 (60.0–180.0) \0.001
Heavy household tasks 2.8 (0.0–12.9) 4.3 (0.0–17.1) 0.039
Sports activities 0.0 (0.0–8.6) 0.0 (0.0–8.6) 0.589
Physical performance (0–12) 7.8 ± 3.0 686 6.6 ± 3.4 726 \0.001
Handgrip strength (kg) 36.7 ± 8.5 715 21.8 ± 5.2 763 \0.001
Total hip BMD (g/cm2) 0.916 ± 0.15 259 0.784 ± 0.13 263 \0.001
BUA (dB/MHz) 81.0 ± 18.5 653 61.1 ± 17.2 693 \0.001
SOS (m/s) 1,638 ± 51 653 1,608 ± 46 693 \0.001
Fractures 6-year follow-up (%) 7 % 51/715 10 % 81/762 0.019
Values mean ± SD or median (interquartile range)
BUA broadband ultrasound attenuation, SOS speed of sound, BMD bone mineral density, BMI body mass index, CRP C-reactive protein
R. Furrer et al.: Physical Functioning, Bone Quality, and Fracture Risk
123
sectionally (p = 0.001 and p = 0.034, respectively) as
well as BMD longitudinally (p = 0.043). For comparabil-
ity reasons, data were stratified by gender in all further
analyses. Multiple regression analyses demonstrated that
age, serum 25(OH)D, smoking, and several anthropometric
variables were relevant confounders. Of anthropometric
variables, body weight had the largest effect and was
therefore used as a confounder in regression analyses. For
relationships of physical functioning with fracture risk, of
all potential confounders including baseline BMD, only
age was observed to be a relevant confounder.
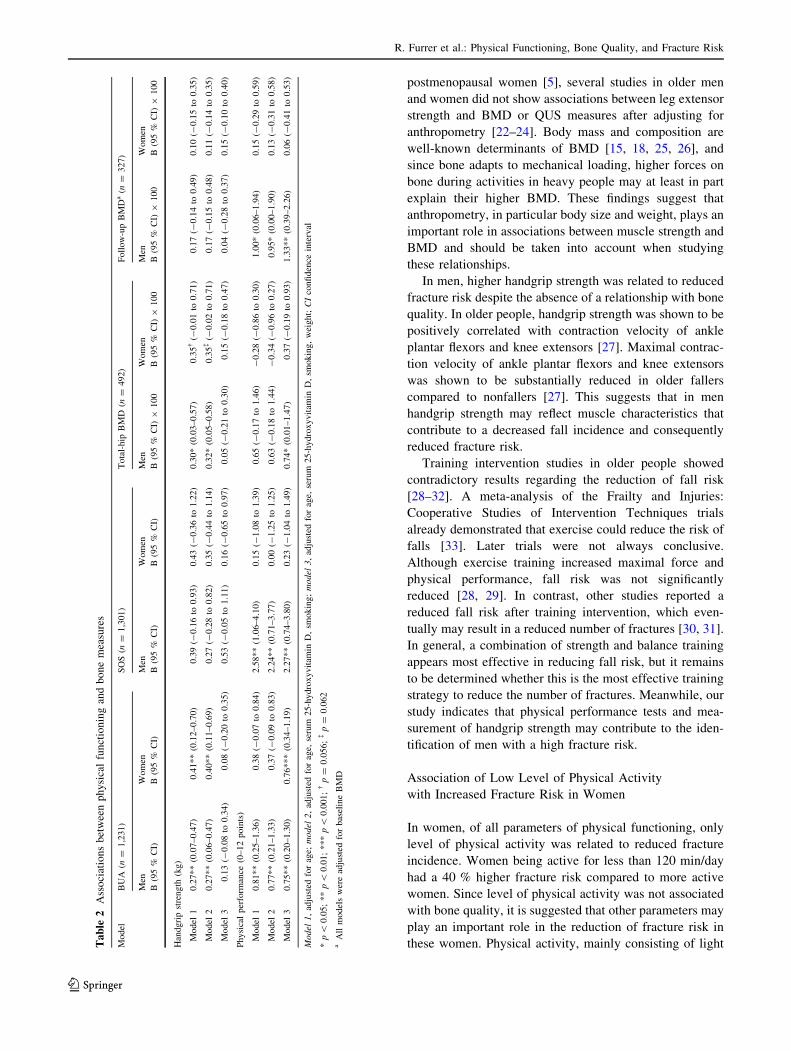
Table 2 shows associations between measures of phys-
ical functioning and estimates of bone quality. After
adjustment for age, serum 25(OH)D, and smoking, higher
handgrip strength was associated with higher BUA and hip
BMD in both genders, although the latter association was
borderline significant in women (p = 0.062). These asso-
ciations were no longer significant after additional adjust-
ment for weight (Table 2, model 3). Higher physical
performance was associated with higher BUA and SOS
after adjustment for age, serum 25(OH)D, and smoking in
men but not in women (Table 2, model 2). After adjust-
ment for all relevant confounders, higher physical perfor-
mance was associated in men with higher BUA, SOS, and
BMD and in women with higher BUA (Table 2, model 3).
In men, for a 1 point higher score on physical performance
tests, BMD, BUA, and SOS were 0.01 g/cm2, 0.75 dB/MHz,
and 2.27 m/s higher, respectively. In women, for a 1 point
higher score on the physical performance tests, BUA score
was 0.76 dB/MHz higher. The individual physical perfor-
mance tests were not associated with BUA, SOS, or BMD.
In neither men nor women, level of physical activity was
associated with BUA, SOS, or BMD.
Associations Between Physical Functioning
and Total-Hip BMD After 3-Year Follow-Up
In men, but not women, higher physical performance was
significantly associated with higher follow-up BMD over
3 years (Table 2). This association remained significant
after correction for all relevant confounders. In men, for a 1
point higher score on the physical performance test, follow-
up BMD was 0.01 g/cm2 higher. In neither men nor
women, handgrip strength and level of physical activity
were associated with follow-up BMD.
Associations Between Physical Functioning and Time
to First Fracture during 6 Years of Follow-Up
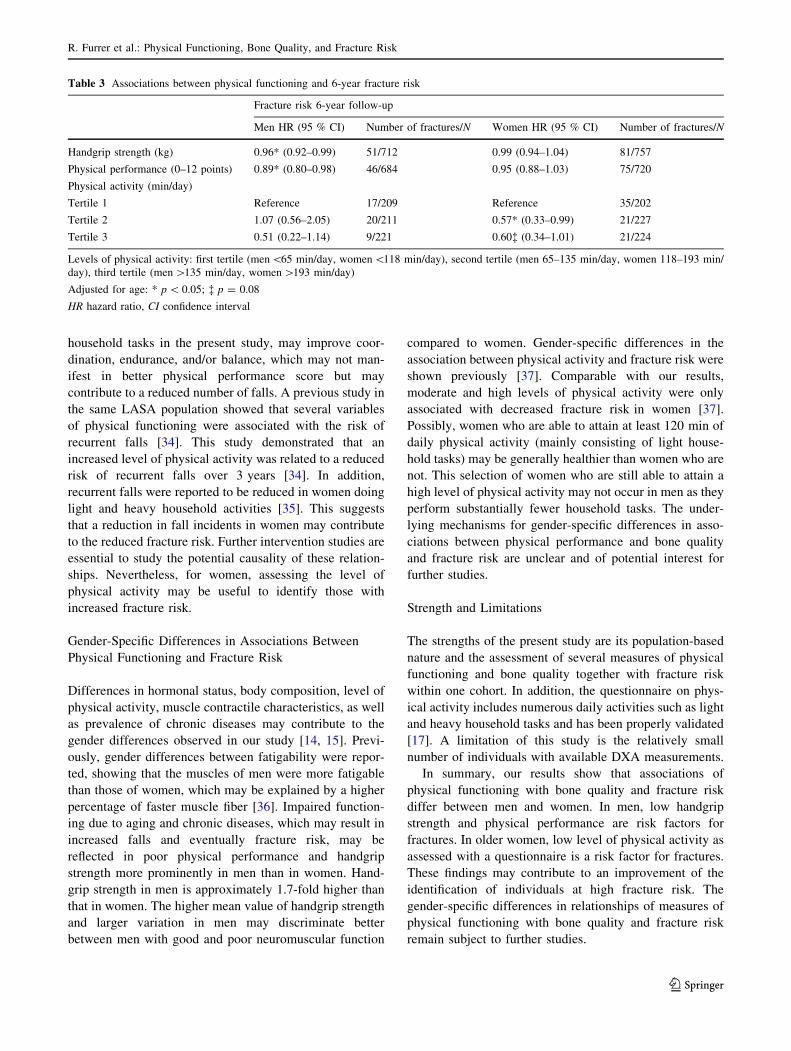
In men, but not women, higher handgrip strength and phys-
ical performance were associated with reduced 6-year frac-
ture incidence independently of age. With 1 kg higher
handgrip strength or 1 point higher score during physical
performance test, the risk of having a fracture in 6 years was
approximately 5 and 10 % lower, respectively (Table 3).
However, in women, but not men, a higher level of physical
activity was associated with reduced 6-year fracture inci-
dence (Table 3). Women in the lowest tertile had a higher
fracture risk compared to women in the second (p = 0.045)
and third (p = 0.080) tertiles. In women, the risk of having a
fracture in 6 years was reduced by approximately 40 %
when activity was more than 118 min/day. To analyze
whether the gender-specific differences observed in the
association between physical activity and fracture risk were
due to the fact that women performed more light household
activities (see Table 1), we performed the same analyses
using a physical activity score that excluded light household
tasks. In contrast to gender-specific tertiles of total physical
activity, gender-specific tertiles of physical activity without
light household tasks were very similar in men and women.
The cut-off points for the tertiles were, for men, 25.8 and
66.0 min/day and, for women, 20.0 and 57.5 min/day. In
both men and women, no association was observed between
level of physical activity (without light household tasks) and
risk of having a fracture in 6 years. This suggests that the
observed association in women between level of total
physical activity and risk of having a fracture can be
explained by a higher level of light household activities.
Discussion
The main findings of this study are (1) in men higher
physical performance score is associated with higher bone
quality cross-sectionally as well as longitudinally, (2) in
men higher handgrip strength and physical performance
score are associated with reduced 6-year fracture risk, and
(3) in women a moderate to high level of physical activity
was associated with reduced 6-year fracture risk.
Association of Reduced Physical Functioning
with Increased Fracture Risk in Men
The importance of physical performance with respect to
BMD and fracture risk has been shown previously [8, 10–
12, 21]. Within the LASA population, physical perfor-
mance was also associated with 3-year fracture risk [10].
Our data suggest that in men, but not women, low physical
performance is a risk factor for lower bone quality and
increased fracture incidence during 6 years. In both gen-
ders, associations of handgrip strength with bone measures
were largely explained by body weight, a proxy for body
size. Within the literature, the relationship between muscle
strength and bone quality is subject to controversy.
Although handgrip strength and leg extension strength have
been reported to be associated with femoral neck BMD in
R. Furrer et al.: Physical Functioning, Bone Quality, and Fracture Risk
123
postmenopausal women [5], several studies in older men
and women did not show associations between leg extensor
strength and BMD or QUS measures after adjusting for
anthropometry [22–24]. Body mass and composition are
well-known determinants of BMD [15, 18, 25, 26], and
since bone adapts to mechanical loading, higher forces on
bone during activities in heavy people may at least in part
explain their higher BMD. These findings suggest that
anthropometry, in particular body size and weight, plays an
important role in associations between muscle strength and
BMD and should be taken into account when studying
these relationships.
In men, higher handgrip strength was related to reduced
fracture risk despite the absence of a relationship with bone
quality. In older people, handgrip strength was shown to be
positively correlated with contraction velocity of ankle
plantar flexors and knee extensors [27]. Maximal contrac-
tion velocity of ankle plantar flexors and knee extensors
was shown to be substantially reduced in older fallers
compared to nonfallers [27]. This suggests that in men
handgrip strength may reflect muscle characteristics that
contribute to a decreased fall incidence and consequently
reduced fracture risk.
Training intervention studies in older people showed
contradictory results regarding the reduction of fall risk
[28–32]. A meta-analysis of the Frailty and Injuries:
Cooperative Studies of Intervention Techniques trials
already demonstrated that exercise could reduce the risk of
falls [33]. Later trials were not always conclusive.
Although exercise training increased maximal force and
physical performance, fall risk was not significantly
reduced [28, 29]. In contrast, other studies reported a
reduced fall risk after training intervention, which even-
tually may result in a reduced number of fractures [30, 31].
In general, a combination of strength and balance training
appears most effective in reducing fall risk, but it remains
to be determined whether this is the most effective training
strategy to reduce the number of fractures. Meanwhile, our
study indicates that physical performance tests and mea-
surement of handgrip strength may contribute to the iden-
tification of men with a high fracture risk.
Association of Low Level of Physical Activity
with Increased Fracture Risk in Women
In women, of all parameters of physical functioning, only
level of physical activity was related to reduced fracture
incidence. Women being active for less than 120 min/day
had a 40 % higher fracture risk compared to more active
women. Since level of physical activity was not associated
with bone quality, it is suggested that other parameters may
play an important role in the reduction of fracture risk in
these women. Physical activity, mainly consisting of lightTa
ble
2A
sso
ciat
ion
sb
etw
een
ph
ysi
cal
fun
ctio
nin
gan
db
on
em
easu
res
Model
BU
A(n
=1,2
31)
SO
S(n
=1,3
01)
Tota
l-hip
BM
D(n
=492)
Foll
ow
-up
BM
Da
(n=
327)
Men
Wom
enM
enW
om
enM
enW
om
enM
enW
om
en
B(9
5%
CI)
B(9
5%
CI)
B(9
5%
CI)
B(9
5%
CI)
B(9
5%
CI)
9100
B(9
5%
CI)
9100
B(9
5%
CI)
9100
B(9
5%
CI)
9100
Han
dgri
pst
rength
(kg)
Model
10.2
7**
(0.0
7–0.4
7)
0.4
1**
(0.1
2–0.7
0)
0.3
9(-
0.1
6to
0.9
3)
0.4
3(-
0.3
6to
1.2
2)
0.3
0*
(0.0
3–0.5
7)
0.3
5�
(-0.0
1to
0.7
1)
0.1
7(-
0.1
4to
0.4
9)
0.1
0(-
0.1
5to
0.3
5)
Model
20.2
7**
(0.0
6–0.4
7)
0.4
0**
(0.1
1–0.6
9)
0.2
7(-
0.2
8to
0.8
2)
0.3
5(-
0.4
4to
1.1
4)
0.3
2*
(0.0
5–0.5
8)
0.3
5�
(-0.0
2to
0.7
1)
0.1
7(-
0.1
5to
0.4
8)
0.1
1(-
0.1
4to
0.3
5)
Model
30.1
3(-
0.0
8to
0.3
4)
0.0
8(-
0.2
0to
0.3
5)
0.5
3(-
0.0
5to
1.1
1)
0.1
6(-
0.6
5to
0.9
7)
0.0
5(-
0.2
1to
0.3
0)
0.1
5(-
0.1
8to
0.4
7)
0.0
4(-
0.2
8to
0.3
7)
0.1
5(-
0.1
0to
0.4
0)
Physi
cal
per
form
ance
(0–12
poin
ts)
Model
10.8
1**
(0.2
5–1.3
6)
0.3
8(-
0.0
7to
0.8
4)
2.5
8**
(1.0
6–4.1
0)
0.1
5(-
1.0
8to
1.3
9)
0.6
5(-
0.1
7to
1.4
6)
-0.2
8(-
0.8
6to
0.3
0)
1.0
0*
(0.0
6–1.9
4)
0.1
5(-
0.2
9to
0.5
9)
Model
20.7
7**
(0.2
1–1.3
3)
0.3
7(-
0.0
9to
0.8
3)
2.2
4**
(0.7
1–3.7
7)
0.0
0(-
1.2
5to
1.2
5)
0.6
3(-
0.1
8to
1.4
4)
-0.3
4(-
0.9
6to
0.2
7)
0.9
5*
(0.0
0–1.9
0)
0.1
3(-
0.3
1to
0.5
8)
Model
30.7
5**
(0.2
0–1.3
0)
0.7
6***
(0.3
4–1.1
9)
2.2
7**
(0.7
4–3.8
0)
0.2
3(-
1.0
4to
1.4
9)
0.7
4*
(0.0
1–1.4
7)
0.3
7(-
0.1
9to
0.9
3)
1.3
3**
(0.3
9–2.2
6)
0.0
6(-
0.4
1to
0.5
3)
Model
1,
adju
sted
for
age;
model
2,
adju
sted
for
age,
seru
m25-h
ydro
xyvit
amin
D,
smokin
g;
model
3,
adju
sted
for
age,
seru
m25-h
ydro
xyvit
amin
D,
smokin
g,
wei
ght;
CI
confi
den
cein
terv
al
*p\
0.0
5;
**
p\
0.0
1;
***
p\
0.0
01;
�p
=0.0
56;
�p
=0.0
62
aA
llm
odel
sw
ere
adju
sted
for
bas
elin
eB
MD
R. Furrer et al.: Physical Functioning, Bone Quality, and Fracture Risk
123
household tasks in the present study, may improve coor-
dination, endurance, and/or balance, which may not man-
ifest in better physical performance score but may
contribute to a reduced number of falls. A previous study in
the same LASA population showed that several variables
of physical functioning were associated with the risk of
recurrent falls [34]. This study demonstrated that an
increased level of physical activity was related to a reduced
risk of recurrent falls over 3 years [34]. In addition,
recurrent falls were reported to be reduced in women doing
light and heavy household activities [35]. This suggests
that a reduction in fall incidents in women may contribute
to the reduced fracture risk. Further intervention studies are
essential to study the potential causality of these relation-
ships. Nevertheless, for women, assessing the level of
physical activity may be useful to identify those with
increased fracture risk.
Gender-Specific Differences in Associations Between
Physical Functioning and Fracture Risk
Differences in hormonal status, body composition, level of
physical activity, muscle contractile characteristics, as well
as prevalence of chronic diseases may contribute to the
gender differences observed in our study [14, 15]. Previ-
ously, gender differences between fatigability were repor-
ted, showing that the muscles of men were more fatigable
than those of women, which may be explained by a higher
percentage of faster muscle fiber [36]. Impaired function-
ing due to aging and chronic diseases, which may result in
increased falls and eventually fracture risk, may be
reflected in poor physical performance and handgrip
strength more prominently in men than in women. Hand-
grip strength in men is approximately 1.7-fold higher than
that in women. The higher mean value of handgrip strength
and larger variation in men may discriminate better
between men with good and poor neuromuscular function
compared to women. Gender-specific differences in the
association between physical activity and fracture risk were
shown previously [37]. Comparable with our results,
moderate and high levels of physical activity were only
associated with decreased fracture risk in women [37].
Possibly, women who are able to attain at least 120 min of
daily physical activity (mainly consisting of light house-
hold tasks) may be generally healthier than women who are
not. This selection of women who are still able to attain a
high level of physical activity may not occur in men as they
perform substantially fewer household tasks. The under-
lying mechanisms for gender-specific differences in asso-
ciations between physical performance and bone quality
and fracture risk are unclear and of potential interest for
further studies.
Strength and Limitations
The strengths of the present study are its population-based
nature and the assessment of several measures of physical
functioning and bone quality together with fracture risk
within one cohort. In addition, the questionnaire on phys-
ical activity includes numerous daily activities such as light
and heavy household tasks and has been properly validated
[17]. A limitation of this study is the relatively small
number of individuals with available DXA measurements.
In summary, our results show that associations of
physical functioning with bone quality and fracture risk
differ between men and women. In men, low handgrip
strength and physical performance are risk factors for
fractures. In older women, low level of physical activity as
assessed with a questionnaire is a risk factor for fractures.
These findings may contribute to an improvement of the
identification of individuals at high fracture risk. The
gender-specific differences in relationships of measures of
physical functioning with bone quality and fracture risk
remain subject to further studies.
Table 3 Associations between physical functioning and 6-year fracture risk
Fracture risk 6-year follow-up
Men HR (95 % CI) Number of fractures/N Women HR (95 % CI) Number of fractures/N
Handgrip strength (kg) 0.96* (0.92–0.99) 51/712 0.99 (0.94–1.04) 81/757
Physical performance (0–12 points) 0.89* (0.80–0.98) 46/684 0.95 (0.88–1.03) 75/720
Physical activity (min/day)
Tertile 1 Reference 17/209 Reference 35/202
Tertile 2 1.07 (0.56–2.05) 20/211 0.57* (0.33–0.99) 21/227
Tertile 3 0.51 (0.22–1.14) 9/221 0.60� (0.34–1.01) 21/224
Levels of physical activity: first tertile (men\65 min/day, women\118 min/day), second tertile (men 65–135 min/day, women 118–193 min/
day), third tertile (men [135 min/day, women [193 min/day)
Adjusted for age: * p \ 0.05; � p = 0.08
HR hazard ratio, CI confidence interval
R. Furrer et al.: Physical Functioning, Bone Quality, and Fracture Risk
123

Acknowledgments The Longitudinal Aging Study Amsterdam is
largely supported by a Grant from the Netherlands Ministry of Health
Welfare and Sports, Directorate of Nursing Care and Older Persons.
References
1. Johnell O, Kanis JA (2006) An estimate of the worldwide prev-
alence and disability associated with osteoporotic fractures. Os-
teoporos Int 17(12):1726–1733
2. Nguyen ND, Ahlborg HG, Center JR, Eisman JA, Nguyen TV
(2007) Residual lifetime risk of fractures in women and men.
J Bone Miner Res 22(6):781–788
3. Johnell O, Kanis J (2005) Epidemiology of osteoporotic fractures.
Osteoporos Int 16(Suppl 2):S3–S7
4. Leboime A, Confavreux CB, Mehsen N, Paccou J, David C, Roux
C (2010) Osteoporosis and mortality. Joint Bone Spine 77(Suppl
2):S107–S112
5. Rikkonen T, Sirola J, Salovaara K, Tuppurainen M, Jurvelin JS,
Honkanen R, Kroger H (2012) Muscle strength and body com-
position are clinical indicators of osteoporosis. Calcif Tissue Int
91(2):131–138
6. Taaffe DR, Simonsick EM, Visser M, Volpato S, Nevitt MC,
Cauley JA, Tylavsky FA, Harris TB (2003) Lower extremity
physical performance and hip bone mineral density in elderly
black and white men and women: cross-sectional associations in
the Health ABC Study. J Gerontol 58(10):M934–M942
7. Karkkainen M, Rikkonen T, Kroger H, Sirola J, Tuppurainen M,
Salovaara K, Arokoski J, Jurvelin J, Honkanen R, Alhava E
(2009) Physical tests for patient selection for bone mineral den-
sity measurements in postmenopausal women. Bone
44(4):660–665
8. Khazzani H, Allali F, Bennani L, Ichchou L, El Mansouri L,
Abourazzak FE, Abouqal R, Hajjaj-Hassouni N (2009) The
relationship between physical performance measures, bone min-
eral density, falls, and the risk of peripheral fracture: a cross-
sectional analysis. BMC Public Health 9:297
9. Cheung CL, Tan KC, Bow CH, Soong CS, Loong CH, Kung AW
(2012) Low handgrip strength is a predictor of osteoporotic
fractures: cross-sectional and prospective evidence from the
Hong Kong Osteoporosis Study. Age 34(5):1239–1248
10. Stel VS, Pluijm SM, Deeg DJ, Smit JH, Bouter LM, Lips P
(2004) Functional limitations and poor physical performance as
independent risk factors for self-reported fractures in older per-
sons. Osteoporos Int 15(9):742–750
11. Zhu K, Devine A, Lewis JR, Dhaliwal SS, Prince RL (2011)
‘‘Timed up and go’’ test and bone mineral density measurement
for fracture prediction. Arch Intern Med 171(18):1655–1661
12. Rosengren BE, Ribom EL, Nilsson JA, Mallmin H, Ljunggren O,
Ohlsson C, Mellstrom D, Lorentzon M, Stefanick M, Lapidus J,
Leung PC, Kwok A, Barrett-Connor E, Orwoll E, Karlsson MK
(2012) Inferior physical performance test results of 10,998 men in
the MrOS Study is associated with high fracture risk. Age Ageing
41(3):339–344
13. Rouzi AA, Al-Sibiani SA, Al-Senani NS, Radaddi RM, Ardawi
MS (2012) Independent predictors of all osteoporosis-related
fractures among healthy Saudi postmenopausal women: the
CEOR Study. Bone 50(3):713–722
14. Murtagh KN, Hubert HB (2004) Gender differences in physical
disability among an elderly cohort. Am J Public Health
94(8):1406–1411
15. Makovey J, Naganathan V, Sambrook P (2005) Gender differ-
ences in relationships between body composition components,
their distribution and bone mineral density: a cross-sectional
opposite sex twin study. Osteoporos Int 16(12):1495–1505
16. Huisman M, Poppelaars J, van der Horst M, Beekman AT, Brug
J, van Tilburg TG, Deeg DJ (2011) Cohort profile: the Longitu-
dinal Aging Study Amsterdam. Int J Epidemiol 40(4):868–876
17. Stel VS, Smit JH, Pluijm SM, Visser M, Deeg DJ, Lips P (2004)
Comparison of the LASA Physical Activity Questionnaire with a
7-day diary and pedometer. J Clin Epidemiol 57(3):252–258
18. Pluijm SM, Visser M, Smit JH, Popp-Snijders C, Roos JC, Lips P
(2001) Determinants of bone mineral density in older men and
women: body composition as mediator. J Bone Miner Res
16(11):2142–2151
19. Sohl E, de Jongh RT, Heijboer AC, Swart KM, Brouwer-Brolsma
EM, Enneman AW, de Groot CP, van der Velde N, Dhonukshe-
Rutten RA, Lips P, van Schoor NM (2013) Vitamin D status is
associated with physical performance: the results of three inde-
pendent cohorts. Osteoporos Int 24(1):187–196
20. Kuchuk NO, Pluijm SM, van Schoor NM, Looman CW, Smit JH,
Lips P (2009) Relationships of serum 25-hydroxyvitamin D to
bone mineral density and serum parathyroid hormone and
markers of bone turnover in older persons. J Clin Endocrinol
Metab 94(4):1244–1250
21. Cawthon PM, Fullman RL, Marshall L, Mackey DC, Fink HA,
Cauley JA, Cummings SR, Orwoll ES, Ensrud KE (2008)
Physical performance and risk of hip fractures in older men.
J Bone Miner Res 23(7):1037–1044
22. Owings TM, Pavol MJ, Grabiner MD (2002) Lower extremity
muscle strength does not independently predict proximal femur
bone mineral density in healthy older adults. Bone 30(3):515–520
23. Ribom E, Olofsson H, Piehl-Aulin K, Mallmin H, Ljunghall S
(1999) Correlations between isometric quadriceps muscle
strength and bone mineral density. J Musculoskelet Res
3(4):275–284
24. Segal NA, Torner JC, Yang M, Curtis JR, Felson DT, Nevitt MC
(2008) Muscle mass is more strongly related to hip bone mineral
density than is quadriceps strength or lower activity level in
adults over age 50 year. J Clin Densitom 11(4):503–510
25. Stewart KJ, Deregis JR, Turner KL, Bacher AC, Sung J, Hees PS,
Tayback M, Ouyang P (2002) Fitness, fatness and activity as
predictors of bone mineral density in older persons. J Intern Med
252(5):381–388
26. Lim S, Joung H, Shin CS, Lee HK, Kim KS, Shin EK, Kim HY,
Lim MK, Cho SI (2004) Body composition changes with age
have gender-specific impacts on bone mineral density. Bone
35(3):792–798
27. Pijnappels M, van der Burg PJ, Reeves ND, van Dieen JH (2008)
Identification of elderly fallers by muscle strength measures. Eur
J Appl Physiol 102(5):585–592
28. Hauer K, Rost B, Rutschle K, Opitz H, Specht N, Bartsch P, Oster
P, Schlierf G (2001) Exercise training for rehabilitation and
secondary prevention of falls in geriatric patients with a history of
injurious falls. J Am Geriatr Soc 49(1):10–20
29. Freiberger E, Haberle L, Spirduso WW, Zijlstra GA (2012) Long-
term effects of three multicomponent exercise interventions on
physical performance and fall-related psychological outcomes in
community-dwelling older adults: a randomized controlled trial.
J Am Geriatr Soc 60(3):437–446
30. Barnett A, Smith B, Lord SR, Williams M, Baumand A (2003)
Community-based group exercise improves balance and reduces
falls in at-risk older people: a randomised controlled trial. Age
Ageing 32(4):407–414
31. Clemson L, Fiatarone Singh MA, Bundy A, Cumming RG, Ma-
nollaras K, O’Loughlin P, Black D (2012) Integration of balance
and strength training into daily life activity to reduce rate of falls
in older people (the LiFE study): randomised parallel trial. BMJ
345:e4547
32. Cadore EL, Rodriguez-Manas L, Sinclair A, Izquierdo M (2013)
Effects of different exercise interventions on risk of falls, gait
R. Furrer et al.: Physical Functioning, Bone Quality, and Fracture Risk
123
ability, and balance in physically frail older adults: a systematic
review. Rejuvenation Res 16(2):105–114
33. Province MA, Hadley EC, Hornbrook MC, Lipsitz LA, Miller JP,
Mulrow CD, Ory MG, Sattin RW, Tinetti ME, Wolf SL (1995)
The effects of exercise on falls in elderly patients. A preplanned
meta-analysis of the FICSIT Trials. Frailty and injuries: cooper-
ative studies of intervention techniques. JAMA 273(17):
1341–1347
34. Stel VS, Smit JH, Pluijm SM, Lips P (2003) Balance and mobility
performance as treatable risk factors for recurrent falling in older
persons. J Clin Epidemiol 56(7):659–668
35. Peeters GM, Verweij LM, van Schoor NM, Pijnappels M, Pluijm
SM, Visser M, Lips P (2010) Which types of activities are
associated with risk of recurrent falling in older persons? J Ger-
ontol 65(7):743–750
36. Wust RC, Morse CI, de Haan A, Jones DA, Degens H (2008) Sex
differences in contractile properties and fatigue resistance of
human skeletal muscle. Exp Physiol 93(7):843–850
37. Hoidrup S, Sorensen TI, Stroger U, Lauritzen JB, Schroll M,
Gronbaek M (2001) Leisure-time physical activity levels and
changes in relation to risk of hip fracture in men and women. Am
J Epidemiol 154(1):60–68
R. Furrer et al.: Physical Functioning, Bone Quality, and Fracture Risk
123