gender parity and human capital - world economic...
TRANSCRIPT

Part 1: Measuring the Global Gender Gap
28 | The Global Gender Gap Report 2016
Women’s participation in the formal economy, or lack thereof, is also a business issue—costing women, companies and, ultimately, entire economies. Female talent remains one of the most under-utilized business resources, either squandered through lack of progression or untapped from the onset. Business leaders and governments increasingly note that tackling barriers to equality can unlock new opportunities for growth. In the World Economic Forum’s Future of Jobs Survey, 42% of business leaders perceived addressing gender parity in their company as a matter of fairness and equality; yet, in addition, more than a fifth of those surveyed also highlighted rationales closer to their core business: reflecting the changing gender composition of their customer base as well as enhancing corporate decision-making and innovation.
The combined impact of growing gender parity, a new middle class in emerging markets and women’s spending priorities is expected to lead to rising household savings rates and shifting spending patterns, affecting sectors such as food, healthcare, education, childcare, apparel, consumer durables and financial services.19 With women controlling 64% of global household spending and US$30 trillion of consumer spending in 2013—a figure that is predicted to rise by almost a third over the five years leading to 201820—there are large potential benefits for companies with employees who can understand diverse customer bases.
Additionally, the global economy is currently in transition to a Fourth Industrial Revolution.21 In such a highly interconnected and rapidly changing world, diversity is critical to informed corporate decision-making and business innovation.22 When it comes to leadership positions, companies with top quartile representation of women in executive committees have been shown
to perform better than companies with no women at the top—by some estimates with as much as a 47% premium on average return on equity.23 Links also exist between having more women directors and corporate sustainability, as well as with economic growth, since more diverse leadership teams can cater to a broader array of stakeholder needs and concerns.24 Unlocking these benefits requires focused action to address the underlying causes of persistent gender gaps in a systemic way.
Gender parity and human capitalThe development and deployment of human capital is a critical element of economic growth and social inclusion in all countries. Two of the Global Gender Gap Index’s four subindexes—Educational Attainment and Economic Participation and Opportunity—relate to the development and deployment of female human capital in particular. The World Economic Forum’s Human Capital Index measures a country’s “distance to an ideal” on learning and employment outcomes, for women and men. In Figure 9 (page 29) we plot the Human Capital Index against a composite measure of educational attainment and economic participation and opportunity from the Global Gender Gap Index. The results show how countries have and have not prioritized gender equality in their quest for optimizing human capital. In the top right are economies that have both high human capital and low gender gaps, indicating an even spread of opportunities. In the top left are countries that have high human capital and large gender gaps. There are few countries in this space—countries cannot have very high human capital if their gender gaps are large because women are one half of the population. In the bottom right are countries where human capital optimization is low but gender gaps are
Source: Global Gender Gap Index 2016 and Human Capital Index 2016.
Human Capital Index score (0–100 scale)
Glo
bal
Gen
der
Gap
Ind
ex
sco
re (0
.0–1
.0 s
cale
) MEAN
ME
AN
0 20 40 60 80 100
0.0
0.2
0.4
0.6
0.8
1.0
South Africa
Iceland
Philippines
Iran, Islamic Rep.
Japan
Rwanda
PakistanSaudi Arabia
Large gender gap,low human capital optimization
Small gender gap,low human capital optimization
Large gender gap,high human capital optimization
Small gender gap,high human capital optimization
Figure 8: Global Gender Gap Index 2016 vs Human Capital Index 2016

The Global Gender Gap Report 2016 | 29
Part 1: Measuring the Global Gender Gap
small, indicating an even spread of opportunities, even if those opportunities are limited overall. In the bottom left are countries where human capital is low and gender gaps are wide, indicating uneven human capital development across gender lines.
This section of the Report takes a deeper look at key outcomes and contextual factors globally within educational attainment for women and men. It also looks at the key outcomes and contextual factors within economic participation of women and men, examining both paid and unpaid work, and the impact of care and demographics.
Educational AttainmentDespite some regional variation, globally today, young women and men entering the labour force have almost identical levels of educational qualifications. There is near parity in primary and secondary education, with remaining gender gaps of 2% and 3%, respectively, and a 7% gap when it comes to participation in tertiary education. Seen another way, in 62 countries primary education gaps have been closed, in 90 countries secondary education gaps have been closed, and in 95 countries tertiary education gaps have been closed. However, women make up a marginally larger proportion of out-of-school children and a much larger proportion of youth not in school or education (23% compared to 15%).
Among women and men over age 25 and already in the workforce, the educational gender gap with regard to level of qualifications held is larger. Global gender gaps in primary, secondary and tertiary educational attainment stand at 11%, 17% and 14% respectively, in the age 25+ cohort. However, these gaps have narrowed significantly in current educational enrolment, which will be reflected in the composition of the future workforce. For example, since
the rate of enrolment in tertiary education of young women currently surpasses that of young men, each year, an extra 4 million young women graduates are beginning to reverse the tertiary education gap of the previous generation at the global level.
As highlighted by our measure of skill diversity, featured in the Report’s Country Profiles, women graduating from tertiary education courses have acquired a similar range of skills and academic subject knowledge to their male colleagues. However, one area in which women continue to remain under-represented is among STEM graduates, for which the global gender gap stands at 47%, with 30% of all male students graduating from STEM subjects, in contrast to 16% of all female students. That gap is commonly attributed to negative stereotypes and lack of role models, lowering girls’ performance and aspirations vis-à-vis science and technology.25 It represents a key emerging issue for gender parity, since STEM careers are projected to be some of the most sought-after in the context of the Fourth Industrial Revolution.
With every yearly edition, the Report has recorded an increasing number of economies reaching parity in educational enrolment, reflecting major investments in educational gender parity paying off in most parts of the world. Since 2006, countries such as Latvia, Botswana, Nicaragua, Slovak Republic, Costa Rica, Canada, United States and Iceland have fully closed their Educational Attainment gender gaps. However, of the 144 countries in this year’s Index, 17 have remaining education gender gaps wider than 10% and eight record gaps wider than 20%. The list of countries underperforming on this subindex is dominated by those from lower-income groups, indicating specific barriers to evenly educating their populations. Still, some low-income countries outperform their more affluent
Source: Global Gender Gap Index 2016 and Human Capital Index 2016.
Gender Gap Talent Composite score (0.0–1.0 scale)
Hum
an C
apita
l Ind
ex
sco
re (0
–100
sca
le)
10
10
40
60
80
100
0.5 0.6 0.7 0.8 0.9 1.0
MEAN
ME
AN
Large gender gap,low human capital optimization
Large gender gap,high human capital optimization
Small gender gap,low human capital optimization
Small gender gap,high human capital optimization
Iran
TunisiaNicaragua
Yemen
Botswana
Burundi
Kenya
Turkey
Norway
Chile
Pakistan
FinlandCanadaAustralia
Saudi Arabia
Japan
IndiaSouth Africa
Nigeria
United StatesPhilippines
Figure 9: Relationship between the Gender Gap Talent Composite and Human Capital Index 2016

Part 1: Measuring the Global Gender Gap
30 | The Global Gender Gap Report 2016
peers. Notably, Nepal, Zimbabwe and Rwanda have closed more than 90% of their education gender gaps, with Nepal closing a significant 18% in the past 11 years.
Most of the 107 countries covered since the inception of the Report have made strong progress on education. India, Pakistan, Ethiopia and Saudi Arabia are among those countries showing strong gains in the 11 years since 2006, with varying starting points. Some of the lowest-ranked countries on this dimension, such as Yemen and Chad, have similarly closed their education gender gaps by 16% and 15%, respectively, over this period, although they continue to lag behind due to their low starting point. In the case of Chad, the country had closed 47% of its education gender gap in 2006 but has now closed almost 60%. The outliers are countries such as Nigeria and Angola which continue to have relatively wide education gender gaps, and have hardly improved for more than a decade.
North America has completely closed its education gender gap. If all things remain equal, Latin America and the Caribbean as well as South Asia are expected to close their education gender gaps in the next five years. Ten years from now, the Middle East and North Africa region should see its education gender gap narrow to a close. East Asia and the Pacific and Sub-Saharan Africa will close their education gender gaps in 21 and 33 years respectively, while Eastern Europe and Central Asia boast a much slower rate of change, projecting the time of education parity to be 87 years. The real concern remains Western Europe, which despite its high performance has seen decline rather than improvement over the past 11 years.
Economic Participation and OpportunityGlobally, 54% of working-age women take part in the in the formal economy, on average, as compared to 81% of men. Women make up a larger proportion of discouraged job seekers and of those outside the labour force; and, on average, women’s unemployment rate is nearly 2% higher globally. Women work three times as often as men as contributing family workers in family enterprises, and are almost twice more likely to work part-time.
Education gains have not always translated into economic gains for women. Even though there is near gender parity in employment for professional and technical workers, reflecting in part the equal education and skills levels among women and men with tertiary education, women hold less than a third of senior roles.
Existing data benchmarking women’s economic leadership roles is uneven in coverage and more should be done to fill existing gaps in knowledge.26 Based on what is currently known, average female representation on boards is 14%, and only in five countries have women broken the 30% participation threshold: Iceland, Norway, France, Latvia and Finland. In addition, only 16 countries have a firm ecosystem in which more than 50% of firms have any female participation in firm ownership. Notable performers
include the Philippines, China, Nicaragua, Bahamas, Botswana, Sweden and Brazil.
There also continues to be a persistent wage gap in paid work. Women’s average earnings are almost half those of men, with average global earned income for women and men estimated at $10,778 and $19,873, respectively. Countries that perform well in this dimension of gender parity span all regional and income groups. Slovenia, Norway and Sweden are some of the most gender-equal economies among high-income countries. Botswana and Thailand exhibit the highest income parity among upper-middle income countries. Vietnam, Lao PDR and Ghana have narrowed their income gender gaps the most among the lower-middle income country group. Mozambique, Tanzania and Rwanda lead among the low-income countries, having closed over 80% of their estimated earned income gender gaps. On the other end of the scale, countries such as Bahrain, United Arab Emirates, Saudi Arabia and Korea, Rep. have high national income, but income gaps of over 50%.
When it comes to executives’ perceptions of wage equality for similar work, no country has reached parity. In only five countries, the remaining gap is less than 20% while in 88 countries the gap is between 20% and 40%. In 35 countries the gap is between 40% and 50% while in five countries—France, Chile, Peru, Hungary and Brazil—executives see the remaining wage gap for similar work to be above 50%.
Exacerbating economic gender gaps is the degree to which women remain at a disadvantage in the ability to accumulate, inherit and manage wealth. Around 1% of countries retain completely restrictive legislation on using financial services, and an additional 35% have somewhat restrictive legislation in place to regulate women’s access to financial services. A similar proportion has somewhat restrictive legal systems when it comes to the ability to inherit assets; however, the number of countries with highly restricted rights of inheritance is much higher, at 18%. Finally, with regard to women’s access to land and non-land assets, 58% and 45% of countries, respectively, have full gender parity in the eyes of the law, while 40% and 53% have achieved partial gender parity. The unequal access to assets is reflected in the gap between women and men holding a bank account—56% compared to 63%, respectively.
Applying the rate of change of the 107 countries covered by the Index since 2006, there is a mixed picture in countries’ ability to deploy their female human capital. On average, the economic gender gap has been closed by 2% over the past 11 eleven years, at an uneven rate of progress, and, at 42% distance from parity globally, it continues to stand at a much lower point than the education gender gap. A number of economies have shown strong improvement; among them, Cameroon, Benin, Guatemala, Nicaragua and Saudi Arabia. No country has yet reached parity on the Economic

The Global Gender Gap Report 2016 | 31
Part 1: Measuring the Global Gender Gap
Participation and Opportunity subindex. Mirroring gains on the Educational Attainment subindex, to date 68 countries out of the 144 covered by the Index this year have achieved gender parity in skilled roles, i.e., women and men employed as professional and technical workers. A number of countries have also achieved the more elusive goal of reaching gender parity in senior roles, namely Barbados, Columbia, Jamaica and the Philippines.
With the current rates of change across world regions, the closing of the economic gender gap ranges from only 47 to 1951 years. The fastest-closing economic gap is in Western Europe, taking 47 years, closely followed by Sub-Saharan Africa and Latin America and the Caribbean, which both can expect an approximate 60-year wait for economic gender parity. Slower rates of change are predicted for Eastern Europe and Central Asia at 93 years, as well as East Asia and the Pacific at 111 years. The economic gender gap rates of change that are most concerning remain those in the Middle East and North Africa as well as South Asia, with predictions of 356 and 1951 years, respectively. The lowest-performing region is now North America, where the economic gender gap has increased by 1% since 2006.
Unpaid Work and CareIn many societies, even as women have entered the labour force, they have also retained primary responsibility for unpaid work such as caregiving and household chores. Gender gaps in paid work thus reflect gender gaps in unpaid work, at least in part. This relationship is clearly visible in Figure 10, which plots the gender gap in unpaid work against the Economic Participation and Opportunity subindex, reflecting the gender gaps in paid work.
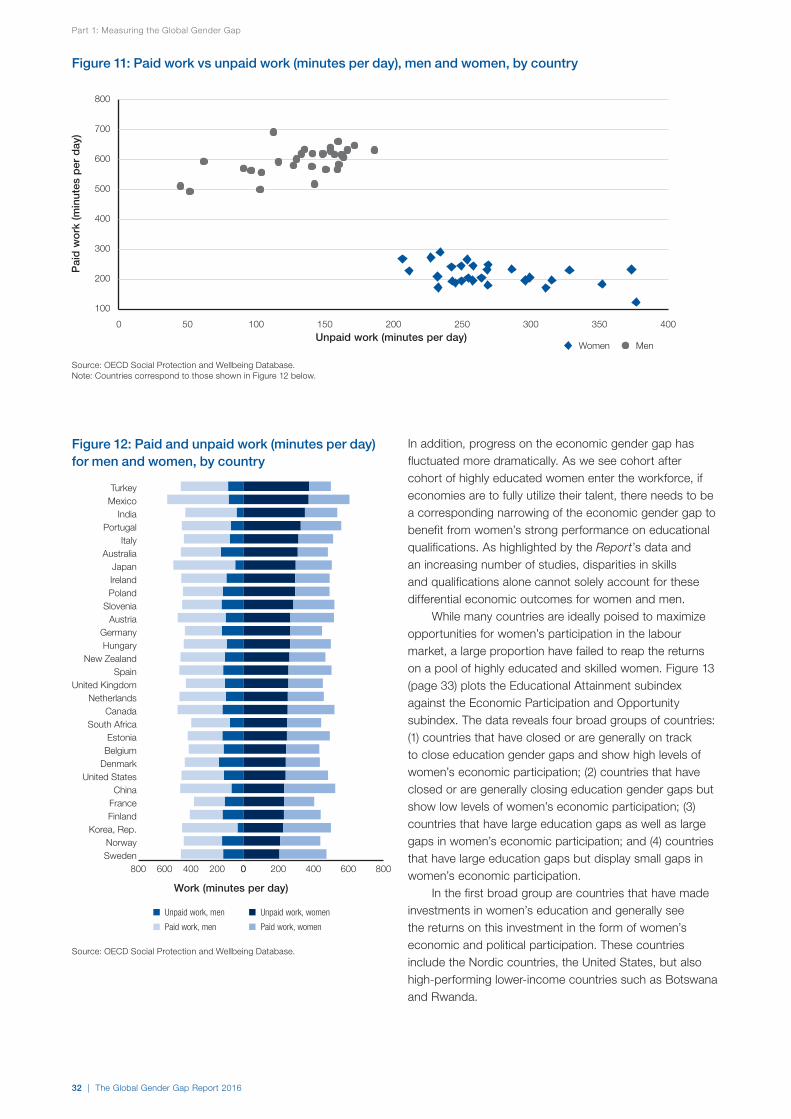
On average men do 34% of the unpaid work that women do.27 Research shows that this imbalance starts early, with girls spending 30% more of their time on unpaid work than boys.28 Figure 11 (page 32) shows the imbalance between paid and unpaid work for both women and men for the thirty countries for which this data is available.
However, the sum total of the time spent by women on work—both paid and unpaid—is higher than for men. Women work on average 50 minutes more a day than men across both paid and unpaid work. Figure 12 (page 32) shows the minutes spent on paid and unpaid work, for both women and men, revealing the strong gender gaps in distribution and the longer time spent by women on all forms of work, across most economies.
Unpaid work conducted by women varies across countries. The largest proportions of unpaid work are routine housework and caregiving, both childcare and care for older people.29 Housework can look different across different economies, often driven by income levels and access to basic infrastructure. Similarly, specific elements of childcare can vary by geography, ranging from physical care, teaching, reading and playing. Demographics as well as income and societal expectations therefore play a strong role in the division of labour between women and men when it comes to paid and unpaid work. See Appendix E for further information on demographics.
Preparing for the FutureBased on the results of this year’s Index, it is evident that, globally, progress on achieving gender parity in education has been comparatively high, while economic gender parity remains elusive: a remaining gender gap of about 5% compared to a remaining gender gap of 41%, respectively.
Source: Global Gender Gap Index 2016 and OECD Social Protection and Wellbeing Database.
Economic Participation and Opportunity subindex score (0.0–1.0 scale)
Rat
io o
f m
ale-
to-f
emal
e un
pai
d w
ork
0.0 0.2 0.4 0.6 0.8 1.0
0.0
0.2
0.4
0.6
0.8
1.0
Norway
Denmark
Japan
Turkey
Slovenia
Portugal
Figure 10: Ratio of male and female unpaid work (men over women) vs Economic Participation and Opportunity subindex 2016
Part 1: Measuring the Global Gender Gap
32 | The Global Gender Gap Report 2016
Source: OECD Social Protection and Wellbeing Database.Note: Countries correspond to those shown in Figure 12 below.
Unpaid work (minutes per day)
Pai
d w
ork
(min
utes
per
day
)
0 50 100 150 200 250 300 350 400
100
200
300
400
500
600
700
800
Figure 11: Paid work vs unpaid work (minutes per day), men and women, by country
Women
Men
Men
In addition, progress on the economic gender gap has fluctuated more dramatically. As we see cohort after cohort of highly educated women enter the workforce, if economies are to fully utilize their talent, there needs to be a corresponding narrowing of the economic gender gap to benefit from women’s strong performance on educational qualifications. As highlighted by the Report’s data and an increasing number of studies, disparities in skills and qualifications alone cannot solely account for these differential economic outcomes for women and men.
While many countries are ideally poised to maximize opportunities for women’s participation in the labour market, a large proportion have failed to reap the returns on a pool of highly educated and skilled women. Figure 13 (page 33) plots the Educational Attainment subindex against the Economic Participation and Opportunity subindex. The data reveals four broad groups of countries: (1) countries that have closed or are generally on track to close education gender gaps and show high levels of women’s economic participation; (2) countries that have closed or are generally closing education gender gaps but show low levels of women’s economic participation; (3) countries that have large education gaps as well as large gaps in women’s economic participation; and (4) countries that have large education gaps but display small gaps in women’s economic participation.
In the first broad group are countries that have made investments in women’s education and generally see the returns on this investment in the form of women’s economic and political participation. These countries include the Nordic countries, the United States, but also high-performing lower-income countries such as Botswana and Rwanda.
0 200 400 600 800800 600 400 200 0SwedenNorway
Korea, Rep.FinlandFranceChina
United StatesDenmarkBelgiumEstonia
South AfricaCanada
NetherlandsUnited Kingdom
SpainNew Zealand
HungaryGermany
AustriaSlovenia
PolandIrelandJapan
AustraliaItaly
PortugalIndia
MexicoTurkey
Figure 12: Paid and unpaid work (minutes per day) for men and women, by country
Work (minutes per day)
n Unpaid work, men n Unpaid work, women
n Paid work, men n Paid work, women
Source: OECD Social Protection and Wellbeing Database.

The Global Gender Gap Report 2016 | 33
Part 1: Measuring the Global Gender Gap
In the second broad group are countries that have made key investments in women’s education but have generally not removed barriers to women’s participation in the workforce and are thus not seeing returns on their investments in terms of development of one half of their nation’s human capital. This group includes Iran, Islamic Rep., the United Arab Emirates, Chile and India. These countries have an educated but untapped talent pool and would have much to gain from women’s greater participation in the workforce.
In the third and fourth groups, the most basic investments in girls’ and women’s education still need to be made, and fundamental rights—including legal frameworks around inheritance, reproductive rights and violence—are often inadequate. The third group contains countries such as Yemen and Pakistan that have large education as well as economic gender gaps. The fourth group contains countries such as Chad and Nigeria, which have large education gender gaps but small economic ones, primarily due to high levels of participation by women in low-skilled work. Compared with the third group, women in these countries have greater access to income and decision-making.
As countries seek to prepare their human capital for the Fourth Industrial Revolution, ensuring that women and men receive equal access to education and work opportunities will be a critical element in safeguarding growth and inclusion. Governments have a range of policy options relating to education, employment and care available to them.
For countries where education gaps still persist, investment in girls and women’s education will be critical for human capital development. A substantial body of literature has shown that investing in girls’ education is one
of the highest-return investments a developing economy can make—and, for these countries, closing education gender gaps will remain an important factor over time. The provision of universal education is critical to increase opportunities for the wider population to participate in the skilled labour market. In countries where public education is not available, low-income families may favour the education of sons over daughters if they have limited resources and must weigh up opportunity costs to paying for their children’s education.
Gender bias in education systems is also a factor in women’s workforce participation. Where direction towards particular subject choices is gendered, and role models and learning materials reinforce gender stereotypes, girls’ educational achievements and possibilities beyond education are limited. Gendered subject choices in education and training are reflected in labour markets with traditionally ‘male’ and ‘female’ jobs. This gap may have an even stronger impact on income inequality in the future, necessitating action by governments today. For example, many forecasts, including our own, predict that future job growth will lie in job families that currently employ few women, such as computer and mathematical roles as well as architecture and engineering.30 This requires deeper investment in closing the STEM education gender gap to prevent future workforce gender gaps.
Deploying women’s human capital will also require strategic focus from countries. Access to financial services and digital access are critical elements for enhancing women’s labour force participation across all economies. For countries that have already made investments in education, it will be important to track the progress of these skilled cohorts of women and ensure that they are able to leverage their skills in the workforce through a
Source: Global Gender Gap Index 2016. Note: The Y-axis has been truncated to enhance readability.
Economic Participation and Opportunity subindex score (0.0–1.0 scale)
Ed
ucat
iona
l Att
ainm
ent
su
bin
dex
sco
re (0
.0–1
.0 s
cale
) MEAN
ME
AN
0.0 0.2 0.4 0.6 0.8 1.0
0.5
0.6
0.7
0.8
0.9
1.0
Large economic gender gap,large education gender gap
United States
Syria
Iran, Islamic Rep.
Egypt
IndiaBangladesh
Turkey
United Arab Emirates
Korea, Rep.
Chile BrazilSouth Africa
ChinaKenya
Ghana
Nigeria
Chad
Yemen
Pakistan
Rwanda
Botswana
Sweden
Saudi ArabiaLarge economic gender gap,small education gender gap
Small economic gender gap,large education gender gap
Small economic gender gap,small education gender gap
Figure 13: Relationship between the Educational Attainment subindex and the Economic Participation and Opportunity subindex, 2016

Part 1: Measuring the Global Gender Gap
34 | The Global Gender Gap Report 2016
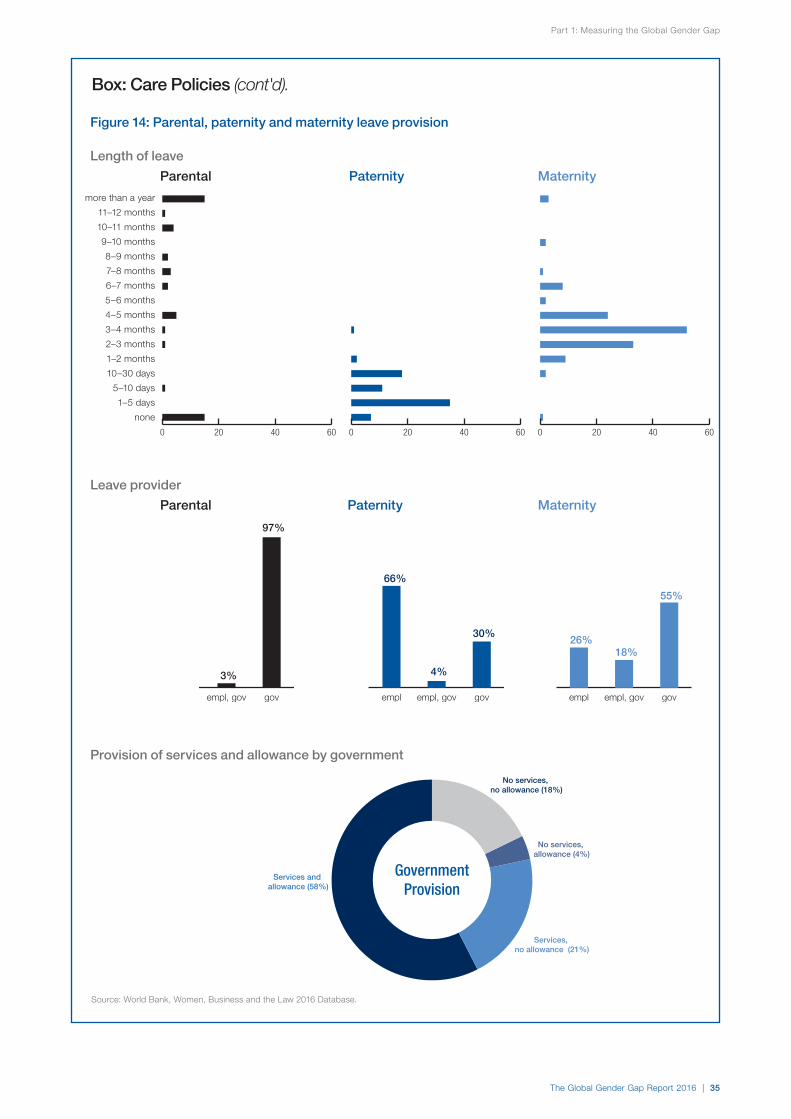
Box: Care Policies
There is a growing demand for concerted action across the public and private sectors to learn from existing policies and innovate in order to facilitate women’s integration into the workforce. Care-related policies are one key element. They tend to span three areas: (1) financial arrangements to facilitate care of children, elderly relatives or others through childcare allowances, family benefits and other subsidies; (2) provisions concerning working conditions to facilitate care such as parental leave, career breaks, remote work, flexible hours and reduction of working time; and (3) direct care services: home care services for older people, nursery places for small children and senior care services. The costs and trade-offs associated with such practices are often long-term investments for countries as they generate societal and economic returns. Below we highlight global trends in family leave and childcare support.
Family LeaveMaternity, paternity and parental leave—or any other type of additional shared leave—are closely associated with women’s economic participation in many parts of the world, and are thus an important element of policies aimed at more efficient use of the country’s human capital pool. Parental benefits enabling mothers, fathers or both to take paid or unpaid time off to care for a child following birth can increase women’s participation in the workforce and foster a more equitable division of childrearing.
Maternity leave currently far exceeds paternity leave around the world. On average, globally, both men and women taking paternity, maternity and parental leave are paid more than 90% of their wages. The weight of responsibility for maternity and paternity leave pay is unevenly distributed across government and employers, with employers bearing the brunt of the cost of paternity leave to a higher degree.
More women participate in the labour force in economies with longer fully-paid maternity and parental leave available for mothers. However, these benefits, above a certain threshold, can undermine women’s labour force participation. For example, in economies where the cumulative duration of paid maternity and parental leave available for mothers exceeds two years, female labour force participation is lower.1
Childcare Support Affordable, good-quality childcare is a key enabling factor, allowing women to reconcile professional and family obligations, since women tend to bear the majority of the caregiving responsibilities in most countries. The cost of childcare also has a significant effect on the financial incentive for women in heterosexual couples with children to work.2 Public or subsidized childcare can increase the participation of women in the workforce; countries that provide public childcare have been reported to have more than twice the percentage of women receiving wages than those that do not.3 Similarly, care for older persons is also an important consideration, as women tend to be the primary caregivers for ageing parents.
Investment in the care economy also produces sizeable spillover effects. The International Trade Union Confederation, for example, recently estimated that if 2% of GDP was invested in a country’s care industry, there would be corresponding increases in overall employment ranging from 2.4% to 6.1%, depending on the country.4 This equates to nearly 13 million new jobs in the United States, 3.5 million in Japan, nearly 2 million in Germany, 1.5 million in the United Kingdom, 1 million in Italy, 600,000 in Australia and nearly 120,000 in Denmark.
Childcare assistance varies by economy and spans public day care, private care and homecare. While 58% of economies have public day care assistance with government allowances or subsidies, 18% have no publicly provided services and no subsidies.
Notes1. See Thévenon, Drivers of Female Labour Force Participation in the OECD.
2. See OECD, Neutrality of tax-benefit systems: Definitions and methodology.
3. See World Bank Group, Women, Business, and the Law 2016.
4. See International Trade Union Confederation, Investing in the Care Economy: A Gender Analysis of Employment Stimulus in Seven OECD Countries.
Box: Care Policies (cont'd).
govempl, govemplgovempl, gov govempl, govempl
The Global Gender Gap Report 2016 | 35
Part 1: Measuring the Global Gender Gap
Length of leave
Leave provider
3%
97%
Parental
66%
4%
30%
Paternity Maternity
26%18%
55%
0 20 40 60
Parental
0 20 40 60
Paternity
0 20 40 60
Maternity
more than a year
11–12 months
10–11 months
9–10 months
8–9 months
7–8 months
6–7 months
5–6 months
4–5 months
3–4 months
2–3 months
1–2 months
10–30 days
5–10 days
1–5 days
none
Provision of services and allowance by government
Services and allowance (58%)
Services, no allowance (21%)
No services, allowance (4%)
No services, no allowance (18%)
GovernmentProvision
Source: World Bank, Women, Business and the Law 2016 Database.
Figure 14: Parental, paternity and maternity leave provision

Part 1: Measuring the Global Gender Gap
36 | The Global Gender Gap Report 2016
range of fiscal and social policy instruments. For example, reducing the tax burden for secondary earners by replacing family taxation with individual taxation, improves women’s participation in the labour force.31 Legislative structures can help prevent gender-biased discrimination in the workplace. Obligatory and voluntary quotas in public and private entities, targeted subsidies to female businesses, and supervisory bodies monitoring the implementation of national policies are also approaches used successfully around the world. Public-private cooperation to close economic participation gaps presents a promising approach. See Appendix G for further details on the Gender Parity Task Force model developed by the World Economic Forum.
One of the most critical pressure points often relates to the care infrastructure, due to the greater portion of unpaid work performed by women. Stronger care-related policies could therefore enhance women’s economic participation and re-balance care roles in the home. See the Box on Care Policies (page 34) for more information on global care policy approaches.
Finally, preparing for the future may also require a deliberate approach to managing upcoming workforce disruptions that may impact women and men differently. For example, our Future of Jobs Report predicted that the disruptions of the Fourth Industrial Revolution will lead to decline in some of the currently most gender equal job families—art, design, entertainment, media, and office and administrative functions. Strategic focus will therefore be needed, by both governments and businesses, to help avoid a deepening of gender divides through re-skilling and up-skilling that takes gender gaps into account.
ConclusionThe Global Gender Gap Report 2016 provides a comprehensive overview of the current state of the global gender gap and of efforts and insights to close it. The Index points to potential role models by revealing those countries that—within their region or their income group—are leaders in having divided resources more equitably between women and men than other countries have, regardless of the overall level of resources available. The Report’s detailed Country Profiles not only allow users to understand how close each country has come to the equality benchmark in each of the four dimensions examined by the Index, but also provide a snapshot of the legal and social framework within which these outcomes are produced.
The magnitude of gender gaps in countries around the world is the combined result of various socio-economic, policy and cultural variables. The Global Gender Gap Index was developed in 2006 partially to address the need for a consistent and comprehensive measure for gender equality that can track a country’s progress over time. The Index does not seek to set priorities for countries but rather to
provide a comprehensive set of data and a clear method for tracking gaps on critical indicators so that countries may set priorities within their own economic, political and cultural contexts.
The Report continues to highlight the strong correlation between a country’s gender gap and its economic performance, and summarizes some of the latest research on the case for gender equality. This year, we also introduced a deeper analysis of the relationship between broader human capital development and deployment and gender parity. The Report highlights the message to policy-makers that countries that want to remain competitive and inclusive will need to make gender equality a critical part of their human capital development. In particular, learning between countries and public-private cooperation within countries will be critical elements of closing the gender gap.
We hope that the information contained in the Global Gender Gap Report series will serve as a basis for continued benchmarking by countries on their progress towards gender equality, help support the case for closing gender gaps and encourage further research on policies and practices that are effective at promoting change.
Notes 1 Following a methodology originally developed by the United Nations
Development Programme (UNDP), the Global Gender Gap Index estimates the average income earned by women, relative to income earned by men, in a calculation that takes into account a country’s GDP per capita (US$), the share of women and men in the labour force, and their mean nominal wages. To account for globally rising income levels, beginning with this year’s edition of the Report, the maximum income value considered in the calculation has been capped at US$75,000 per capita. This follows UNDP’s own adjustment of the methodology in line with findings by Kahneman and Deaton that suggest there is little additional gain in human well-being from annual income beyond US$75,000. In previous editions of the Global Gender Gap Index, this cap was US$40,000. Since 2011, the US$ 40,000 cap had lost some its ability to discern the level of gender-based income disparities among high-income nations such as the Nordics, the United States and the member states of the Gulf Cooperation Council. For a full overview of this year’s methodology change, refer to Appendix D. For a more detailed discussion of the assumptions behind the Estimated earned income indicator, refer to: Kahneman and Deaton, High income improves evaluation of life but not emotional well-being, and Human Development Report 2015, UDNP; Technical Notes and UNDP, “Frequently Asked Questions: Gender Development Index (GDI)”, available at: http://hdr.undp.org/en/faq-page/gender-development-index-gdi (accessed October 2016).
2 This ratio is based on what is considered to be a “normal” sex ratio at birth: 1.06 males for every female born. See: Klasen and Wink, “Missing Women: Revisiting the Debate”.
3 This ratio is based on the standards used in the UNDP’s Gender-Related Development Index, which uses 87.5 years as the maximum age for women and 82.5 years as the maximum age for men.
4 A first attempt to calculate the gender gap was made by the World Economic Forum in 2005; see Lopez-Claros and Zahidi, Women’s Empowerment: Measuring the Global Gender Gap. The 2005 Index, which was attempting to capture women’s empowerment, used a “feminist” scale that rewarded women’s supremacy over men (highest score is assigned to the country with the biggest gap in favour of women).