gender disparity in human capital: going beyond schooling/media/giawb/enterprisesurveys/... ·...
TRANSCRIPT
Gender Disparity in Human Capital: Going Beyond Schooling
Mohammad Amin* and Khrystyna Kushnir** September, 2012
The paper contributes to the literature on gender-based disparity in human capital by extending existing results on educational attainment to the number of years of experience that top female and male managers have. For a sample of 71 developing countries, results show that the number of years of experience for female managers is significantly lower, equaling 83-86 percent that of their male counterparts. This gender-based difference is particularly large among young firms, but small an insignificant among older firms.
Keywords: Gender, Human capital, Managerial experience, Education JEL: J16, J21, K10
_______________________________*Enterprise Analysis Unit, World Bank, Washington DC, 20433. Email: [email protected].** Corresponding author, Enterprise Analysis Unit, World Bank, Washington DC, 20433. Email: [email protected] .
1
1. Introduction
A number of studies have documented lower levels of schooling or formal education in
developing countries among females compared with males. Adverse effects of this inequality or
disparity in education on economic development have also been noted. However, formal
education is only part of human capital and a more holistic approach going beyond schooling is
required to better understand gender-based disparity in human capital. In this paper, we take one
step in this direction by extending gender-based disparity in human capital beyond education to
experience firm managers have working in the industry. In a sample of 71 developing countries,
we find that in majority of countries, female managers have fewer years of experience working
in the industry (figure 1). Quantitatively speaking and on average across all countries under
study, female managers have 2 years less experience (working in the industry) than their male
counterparts (figure 2). As we show below, this gender-based difference is statistically
significant, economically large, and particularly pronounced among younger firms.
The present paper closely relates to the broader findings in the literature on gender-based
inequality along a number of dimensions. Gender-based inequality is neither unique to human
capital nor restricted to a handful of countries. It will be safe to argue that presently there is no
country in the world that has reached equality between women and men in critical areas such as
economic participation, income and wage levels, education, health and political empowerment
(Hausmann et al., 2006). Gender-based inequality in education (or formal schooling) has
received most attention by economists. Some of the studies that highlight gender-based gap in
education and its impact on economic development and growth include for example, Sen (1989),
Klasen (1994, 1999), Barro and Lee (1994), Barro and Sala-i-Martin (1995), Dollar and Gatti
(1999) and Schultz (1993). In addition, a number of micro or household-level studies show how
2
parents prefer boys over girls for the provision of education and the impact that this disparity has
on incomes, overall economic development and the well being of women relative to men.
We depart from the literature discussed above in two important ways. First, we focus on
another dimension of human capital which is the number of years of experience that firm
managers have working in the industry. We check if female managers have less or more years of
experience than their male counterparts. Job experience is an invaluable component of overall
human capital of a country and gender-based difference in job experience can have serious
implications for gender inequality in income levels and employment opportunities. Moreover,
gender-based disparity in experience could also affect firm’s profits. For example, a recent study
of executives in German banks covering 1994-2010 found that teams with more female
executives tend to take more risky decisions (Berger, Kick and Schaeck, 2012). The study
suggests that this finding is most likely due to the fact that female executives have less
experience than the male executives.
A second contribution of the paper lies in using cross-country comparable firm-level
data. One advantage of using firm-level or micro data compared with macro data is that it allows
us to explore heterogeneity in the gender-work experience relationship across firms within a
country. As we show below, while female managers have fewer years of experience compared to
their male colleagues, this gender-based gap is much larger among the relatively younger firms
but non-existent or insignificant among the relatively older firms.
2. Data and main variables
The data we use is a stratified random sample of firms in 71 developing countries. These data
were collected by the World Bank’s Enterprise Surveys between 2006 and 2011. For each
3
country, the sample is stratified by sector, location and firm-size. Sampling weights are provided
to ensure that the sample is representative at the national level. All regression results below are
based on Ordinary Least Squares (OLS) estimation method with Huber-White robust standard
errors and clustered on the country. Significant level is denoted by *** (1 percent), ** (5
percent) and * (10 percent). Summary statistics of the variables used in the regressions are
provided in Table 1.
The dependent variable is the (log of) number of years of experience of firm’s top
manager in the sector (Experience). In our sample, Experience varies (in log values) between 0
and 4.3 with a mean value of 2.6 and standard deviation of 0.79. Across countries, the value of
the dependent variable is highest in Argentina (3.9) and least in Sierra Leone (1.8).
Our main explanatory variable is a dummy variable equal to 1 if the firm has female top
manager and 0 otherwise (Female). In our sample and on average, 18 percent of the firms have a
female top manager. The percentage is highest in Nicaragua (34.3 percent) and least in Yemen
(0.17 percent).
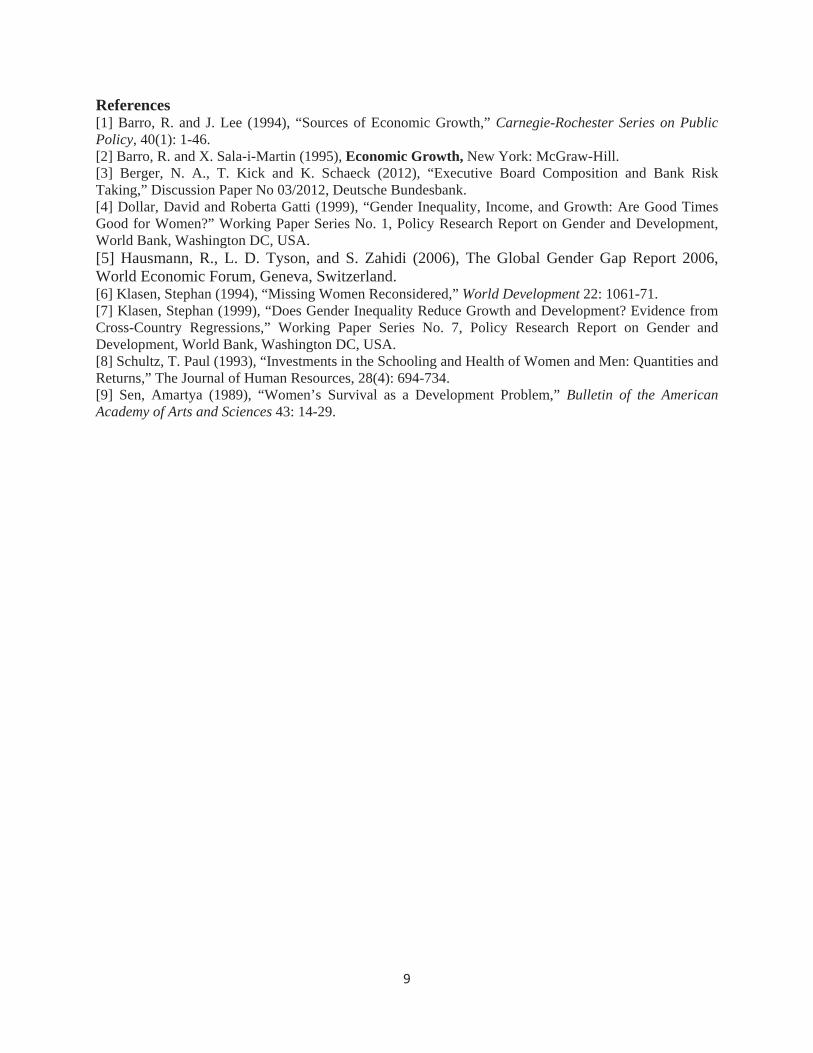
First look at the data confirms that globally the number of years of experience of the top
manager is lower for females than males on average by two years. There are 13 countries, out of
the sample of 71, where female managers have more years of experience than male colleagues.
The range of the difference in the number of years of experience between female and male top
managers is 23 years. The two poles are: Gabon, where female managers have 13 years more
experience, than male managers; and Paraguay, where male managers have 10 years more
experience than female counterparts. This distribution signifies that apart from firm-level
differences in the number of years of experience of top manager, there are also cross-country
differences.
4
It is possible that Experience and Female are both correlated with a third variable. This
may lead to omitted variable bias problem with the estimation of our main results (that is, the
estimated relationship between Experience and Female). To guard against this possibility, we
control for a number of variables which are as follows.
First, we control for all country specific and industry specific factors using country fixed
effects and industry fixed effects.1 These fixed effects or control variables are dummy variables
that indicate the country and the industry to which the firm belongs.
Next, we control for a number of firm-level variables. We begin with the (log of) age of
the firm (Age). If the turnover of managers is not too frequent, older firms are likely to have
managers with more experience. Further, if age of the firms is also systematically correlated with
the gender of the top manager, the omitted variable bias problem is evident. Next, we control for
firm-size measured by the (log of) total number of permanent employees working at the firm at
the end of the fiscal year prior to the survey (Employment). Firm-size is an important firm
attribute and could easily correlate with managerial experience as well as the gender of the
manager. The next set of firm-level controls includes various characteristics that could be
potentially correlated with both the managerial experience and gender of the top manager.
Although theory and previous work in the area provides little guidance as to which controls are
most relevant here, one possibility is that managers with varying experience and female vs. male
managers could have a preference for firms with certain characteristics and this could lead to the
omitted variable bias problem. Hence, we choose a range of important firm characteristics which
are as follows: (i) proportion of the firm that is owned by domestic private individuals,
1 The industries in our sample include Textiles, Garments, Leather, Food, Metals & Machinery, Electronics,Chemicals & Pharmaceuticals, Wood & Furniture, Non Metallic and Plastic Materials, Auto & Auto Components,Other Manufacturing, Retail & Wholesale Trade, Hotels & Restaurants, Other Service, and Construction &Transportation.
5
companies or organizations (Share of private domestic agents); (ii) proportion of firm’s output
that is exported (Export); (iii) dummy variable equal to 1 if the firm uses email or its own
website to communicate with clients and suppliers and 0 otherwise (Internet); (iv) dummy
variable equal to 1 if the firm experienced one or more power outage and 0 otherwise (Outage);
(v) dummy variable equal to 1 if the firm was inspected or visited by tax officials and 0
otherwise (Inspected); (vi) a dummy indicating if the firm is financially constrained or not
(Financially constrained)2; (vii) the severity on a 0 (No obstacle) to 4 (Very severe obstacle)
scale of tax rates perceived as an obstacle to the current operations of the firm (Tax rate as
obstacle) and (viii) the same for corruption (Corruption as obstacle) and (ix) access to finance
(Finance as obstacle).
3. Estimation results
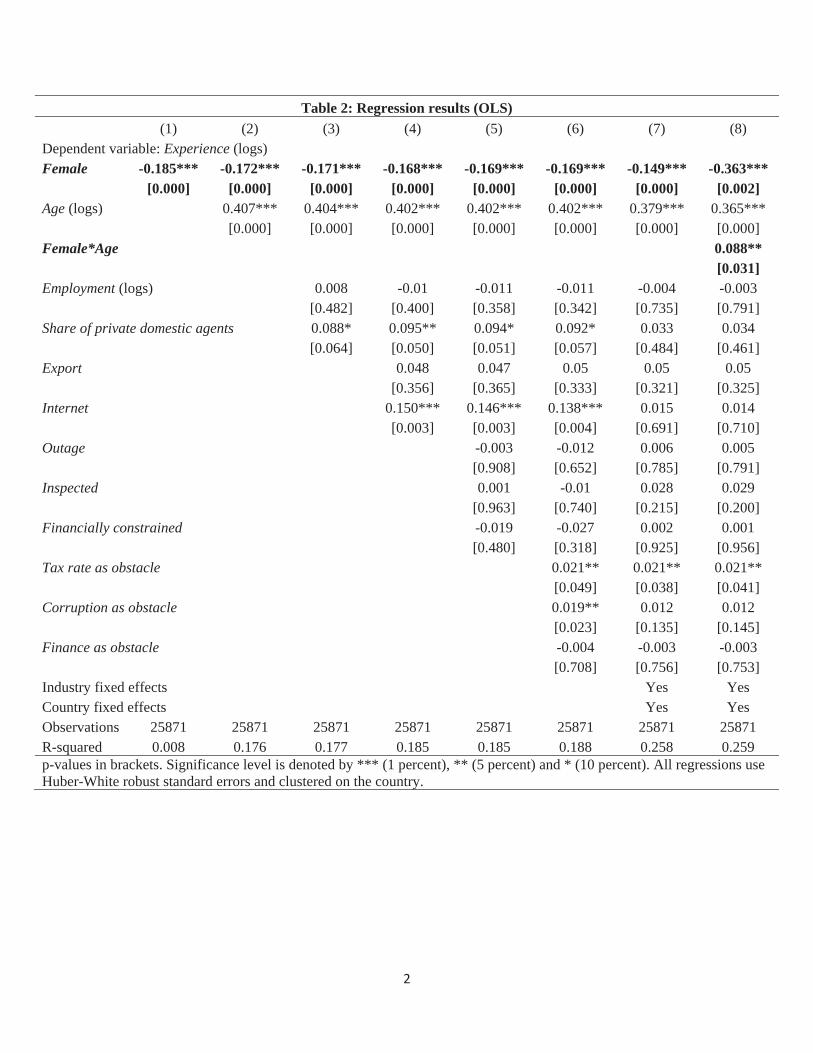
Regression results are provided in Table 2. Without any other controls, moving from a firm with
a male to a firm with a female top manager reduces the value of Experience by .185 log points,
significant at less than the 1 percent level (column 1). This decrease is large in magnitude given
that mean value of Experience is 2.6. In level (i.e., non-log terms), the estimate implies that the
number of years of managerial experience for a female top manager is about 83 percent that of a
male top manager.
Next, adding age of the firm to the specification, we find that the estimated coefficient
value of Female decreases in magnitude, but only marginally from -.185 above to -.172 (column
2) and it is still significant at less than the 1 percent level. Age of the firm is positively correlated
2 A firm is financially constrained if it did not apply for loans or lines of credit in the fiscal year prior to the surveyand the reason for not applying was other than “no need for a loan” as reported by the firm. These other reasonsinclude complex application procedures, unfavorable interest rates, unattainable collateral requirements,insufficient size of loan and maturity, did not think it would be approved and the residual category of otherreasons (except for “no need for a loan”).
6
with the dependent variable and this positive correlation is significant at less than the 1 percent
level in all the specifications we consider.
In column 3, we add controls for firm-size (Employment) and the proportion of the firm
owned by private domestic agents. These controls make almost no difference to the estimated
coefficient value of Female. That is, the coefficient value equals -.171 (column 3) compared with
-.172 above and it remains significant at less than the 1 percent level. We find no significant
correlation between Experience and firm-size; ownership share of domestic agents in the firm
shows a positive correlation with Experience significant at less than the 10 percent level. Next,
we add the proportion of firm’s output that is exported and the dummy variable for the usage of
email and own website to the specification. However, these controls do not affect our main
results much. That is, the estimated coefficient value of Female remains significant at than the 1
percent level and equals -.168 in magnitude (column 4) compared with -.171 above. While
exports are weakly correlated with the dependent variable, email and own website use show a
strong positive correlation with the dependent variable, significant at less than the 1percent level.
There is not much change in the results for the remaining variables in the specification from
above.
In column 5, we add the controls for power outages, inspection by tax officials and the
dummy for financially constrained firms. These controls do not change the estimated coefficient
value of Female much – it changes only marginally from -.168 above to -.169 (column 5) and
remains significant at less than the 1 percent level. None of the new controls in the column show
a significant correlation with the dependent variable. Further, there is no change in the results for
the remaining variables in the regression from above. The three perceived obstacles to firm’s
operations (tax rates, corruption and access to finance) are added to the specification in column
7
6. These controls make no difference to the estimated coefficient value of Female or its
significance level. Tax rate and corruption as obstacles show a strong positive correlation with
the dependent variable, significant at less than the 5 percent level. There is no change from above
in the results for the remaining controls variables in the specification.
Country and industry fixed effects are added to the specification above in column 7. As a
result, the estimated coefficient value of Female decreases somewhat in (absolute) value from -
.169 above (column 6) to -.149 (column 7) and it remains significant at less than the 1 percent
level. There is some change in the results for some of the control variables from above. That is,
the estimated coefficient values of Email and website use variable, proportion of firm owned by
private domestic agents and corruption as an obstacle to firms’ current operations are no longer
significant at the 10 percent level or less. There is no other qualitative change in the results from
above.
We now explore how the relationship between managerial experience and the gender of
the manger varies between young versus old firms. To this end, we interact Female and Age and
add the interaction term (Female*Age) to the specification discussed above with all the controls
in place. Regression results in column 8 show that the estimated coefficient value of the
interaction term is positive, economically large and statistically significant at less than the 5
percent level. For example, the estimated coefficient value of the interaction term in column 8
implies that for the youngest firms in our sample, managerial experience is lower for female
compared with male managers by .363 log points, and this difference is significant at less than
the 1 percent level. In contrast, for the oldest firms in our sample, managerial experience is
actually higher by .108 log points for female compared with male managers. We note that this
difference of .108 log points is statistically insignificant at the 10 percent level or less (p-value of

8
.333). There is no qualitative change in the results from above for the remaining control variables
in the specification.
We also experimented by checking if the size of the gender-based gap in managerial
experience varies between rich vs. poor countries, small vs. large firms and manufacturing vs.
services sectors. However, these checks yielded no significant results.
3. Conclusion
Lower level of education or formal schooling among women relative to men in developing
countries is a well known fact. However, schooling is only one dimension of human capital.
There is substantial contribution of learning on the job or work experience to human capital. The
present paper extends the literature on gender-based gap in education to gender-based gap in the
number of years of experience firm managers have. Our results confirm gender-based disparity
in managerial experience; that is, female managers have on average fewer years of experience
working in the industry than male managers. We also find that this gender-based gap in the
length of the experience of the manager is much larger among the relatively younger firms but
small and insignificant among the relatively older firms.
There is substantial scope for future work along the lines of the present paper. For
example, it will be very useful to understand the consequences as well as determinants of gender-
based gap in manager’s experience level. Comparing the impact of gender-based gap in formal
education with the gap in manager’s experience can shed important light on how to prioritize
policies aimed at bridging the gender-based gap in income level and job opportunities.
9
References [1] Barro, R. and J. Lee (1994), “Sources of Economic Growth,” Carnegie-Rochester Series on Public Policy, 40(1): 1-46. [2] Barro, R. and X. Sala-i-Martin (1995), Economic Growth, New York: McGraw-Hill. [3] Berger, N. A., T. Kick and K. Schaeck (2012), “Executive Board Composition and Bank Risk Taking,” Discussion Paper No 03/2012, Deutsche Bundesbank. [4] Dollar, David and Roberta Gatti (1999), “Gender Inequality, Income, and Growth: Are Good Times Good for Women?” Working Paper Series No. 1, Policy Research Report on Gender and Development, World Bank, Washington DC, USA. [5] Hausmann, R., L. D. Tyson, and S. Zahidi (2006), The Global Gender Gap Report 2006, World Economic Forum, Geneva, Switzerland. [6] Klasen, Stephan (1994), “Missing Women Reconsidered,” World Development 22: 1061-71. [7] Klasen, Stephan (1999), “Does Gender Inequality Reduce Growth and Development? Evidence from Cross-Country Regressions,” Working Paper Series No. 7, Policy Research Report on Gender and Development, World Bank, Washington DC, USA. [8] Schultz, T. Paul (1993), “Investments in the Schooling and Health of Women and Men: Quantities and Returns,” The Journal of Human Resources, 28(4): 694-734. [9] Sen, Amartya (1989), “Women’s Survival as a Development Problem,” Bulletin of the American Academy of Arts and Sciences 43: 14-29.
10
Figure 1: Length of Managers’ Experience by Gender.
Source: Enterprise Surveys (http://www.enterprisesurveys.org), The World Bank.
53 countries75%
5 countries7%
13 countries18% Male managers have more years of
experience than femaleconterparts
Male and female managers haveequal number of years ofexperience
Female managers have more yearsexperience than male counterparts
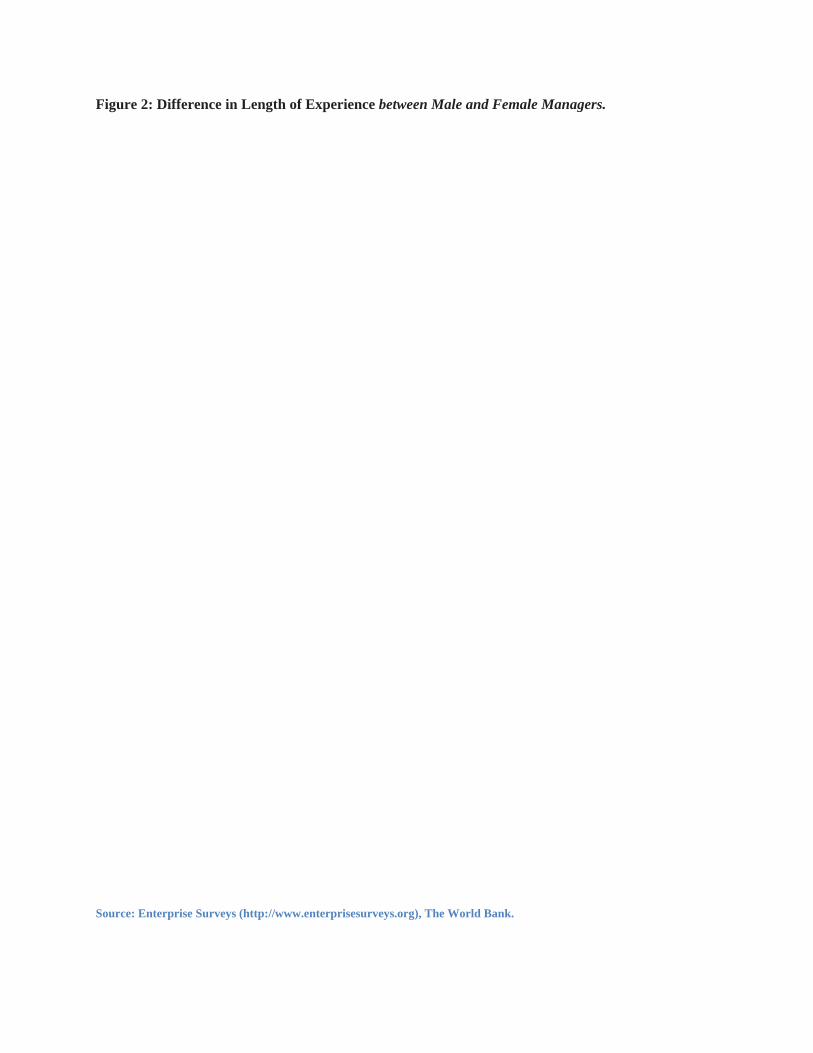
Figure 2: Difference in Length of Experience between Male and Female Managers.
Source: Enterprise Surveys (http://www.enterprisesurveys.org), The World Bank.
1
Table 1: Summary statistics Mean Standard deviation Minimum Maximum Observations
Experience (logs) 2.57 0.79 0 4.3 25871 Female 0.18 0.38 0 1 25871 Age (logs) 2.45 0.79 0 5.3 25871 Employment (logs) 2.78 1.20 0 11.5 25871 Share of private domestic agents 0.87 0.31 0 1 25871 Export 0.07 0.22 0 1.1 25871 Internet (email and website usage) 0.69 0.46 0 1 25871 Outage 0.58 0.49 0 1 25871 Inspected (by tax officials) 0.60 0.49 0 1 25871 Financially constrained 0.27 0.45 0 1 25871 Tax rate as obstacle 1.89 1.31 0 4 25871 Corruption as obstacle 1.92 1.51 0 4 25871 Finance as obstacle 1.69 1.36 0 4 25871
2
Table 2: Regression results (OLS) (1) (2) (3) (4) (5) (6) (7) (8)
Dependent variable: Experience (logs) Female -0.185*** -0.172*** -0.171*** -0.168*** -0.169*** -0.169*** -0.149*** -0.363***
[0.000] [0.000] [0.000] [0.000] [0.000] [0.000] [0.000] [0.002] Age (logs) 0.407*** 0.404*** 0.402*** 0.402*** 0.402*** 0.379*** 0.365***
[0.000] [0.000] [0.000] [0.000] [0.000] [0.000] [0.000] Female*Age 0.088**
[0.031] Employment (logs) 0.008 -0.01 -0.011 -0.011 -0.004 -0.003
[0.482] [0.400] [0.358] [0.342] [0.735] [0.791] Share of private domestic agents 0.088* 0.095** 0.094* 0.092* 0.033 0.034
[0.064] [0.050] [0.051] [0.057] [0.484] [0.461] Export 0.048 0.047 0.05 0.05 0.05
[0.356] [0.365] [0.333] [0.321] [0.325] Internet 0.150*** 0.146*** 0.138*** 0.015 0.014
[0.003] [0.003] [0.004] [0.691] [0.710] Outage -0.003 -0.012 0.006 0.005
[0.908] [0.652] [0.785] [0.791] Inspected 0.001 -0.01 0.028 0.029
[0.963] [0.740] [0.215] [0.200] Financially constrained -0.019 -0.027 0.002 0.001
[0.480] [0.318] [0.925] [0.956] Tax rate as obstacle 0.021** 0.021** 0.021**
[0.049] [0.038] [0.041] Corruption as obstacle 0.019** 0.012 0.012
[0.023] [0.135] [0.145] Finance as obstacle -0.004 -0.003 -0.003
[0.708] [0.756] [0.753] Industry fixed effects Yes Yes Country fixed effects Yes Yes Observations 25871 25871 25871 25871 25871 25871 25871 25871 R-squared 0.008 0.176 0.177 0.185 0.185 0.188 0.258 0.259 p-values in brackets. Significance level is denoted by *** (1 percent), ** (5 percent) and * (10 percent). All regressions use Huber-White robust standard errors and clustered on the country.