gender assessment of ict access and usage in africa · pdf fileinternational development...
TRANSCRIPT
Towards Evidence-based ICT Policy and Regulation
Gender Assessment of ICT Access and Usage in Africa
Volume One 2010 Policy Paper 5
Alison Gillwald, Anne Milek & Christoph Stork
With focus group studies led by Robertine Tankeu, Woldekedian Amde, Norah Mulira, Mbombo Malema, Ike Mowete
Research ICT Africa fills a strategic gap in the development of a sustainable information society and network knowledge economy by building the ICT policy and regulatory research capacity needed to inform effective ICT governance in Africa. The network was launched with seed funding from the IDRC and seeks to extend its activities through national, regional and continental partnerships. The establishment of the Research ICT Africa (RIA) network emanates from the growing demand for data and analysis necessary for the appropriate and visionary policy required to catapult the continent into the information age. Through network development RIA seeks to build an African knowledge base in support of ICT policy and regulatory design processes, and to monitor and review policy and regulatory developments on the continent. The research arising from a public interest agenda is made available in the public domain, and individuals and entities from the public and private sector and civil society are encouraged to use it for teaching, further research or to enable them to participate more effectively in national, regional and global ICT policy formulation and governance. This research is made possible by the significant funding received from the International Development Research Centre (IDRC) Ottawa, Canada. The network members express their gratitude to the IDRC for its support. The network is under the directorship of Alison Gillwald.
This policy paper draws on a rich data set arising from the household and individual access and usage survey conducted across 17 African countries under the project leadership of Dr Christoph Stork and, at the country level: Dr. Augustin Chabossou (Benin), Dr. Sebusang Sebusang (Botswana), Dr. Pam Zahonogo (Burkina Faso), Dr. Olivier Nana Nzèpa (Cameroon), Prof. Dr. Arsene Kouadio (Cote d'Ivoire), Dr. Lishan Adam (Ethiopia), Dr. Godfred Frempong (Ghana), Dr. Tim Waema (Kenya), Francisco Mabila (Mozambique), Dr. Christoph Stork (Namibia and South Africa), Prof. Dr. Ike Mowete (Nigeria), Albert Nsengiyumva (Rwanda), Prof. Dr Abdoulaye Diagne (Senegal), Dr. Ray Mfungahema (Tanzania), Dr. F. F. Tusubira and Dr. Nora Mulira (Uganda), Sikaaba Mulavu (Zambia).
Series Editor: Dr. Alison Gillwald
Assistant-to-the-Editor: Enrico Calandro
Research ICT Africa
Information Communication Technologies (ICTs) are widely seen as having the potential to contribute positively to economic growth and development and to improve the livelihoods and quality of life of individuals and households. Several studies have sought to demonstrate the correlations between economic growth and the penetration of telephones and now Internet. Although this is acknowledged to be something that starts in the high end of the market, the speed with which new, rapidly deployable wireless technologies have diffused across even developing countries, has been their most distinguishing characteristic.
What is clear from the Research ICT Africa (RIA) Household and Individual Access and Usage Survey is that the diffusion of ICT is highly uneven concentrating in urban areas and leaving some rural areas almost untouched. Access to these technologies is constrained by income as is usage, and as they become more complex, they are increasingly constrained by literacy and education. This analysis explores the inequities of access and usage further, by viewing them through a gender lens.
Of the limited demand-side data on Africa that exists, very little is disaggregated on gender lines. This study provides a descriptive statistical overview of access to ICTs by women and men and their usage of them. This is supported by focus groups that were undertaken in five of the 17 countries surveyed in East, Central, South and West Africa.
The survey reveals some surprising instances where more women than men own mobile phones, such as in South Africa and Mozambique, or where women have greater knowledge of the Internet such as in Cameroon. More generally however, the study confirms the differences in access by men and women to ICTs especially where they depend on public access.
With regard to mobile access, if factors other than gender are held constant no significant gender effect for mobile phone ownership can be found. This means that women with similar income, education and employment status are as likely as men to own a mobile phone. But, as women generally have less access to employment, education and other factors that increase the likelihood of ownership; access to mobile phones is clearly not equal between men and women. The survey also found that although men spend more on mobile phones in absolute terms, women spend a greater share of their monthly income on mobile usage.
The radio is the most commonly used electronic communication device, but even access to it is influenced by financial considerations due to absence of power in rural areas and the high cost of batteries. For some, however, particularly because of the absence of power and the income play a significant role. There are significant differences across countries around radio access by men and women and differences in their favourite programmes. Although women may be at home more they tend to listen to the radio less than men, even though they might have a similar education and income. This is often due to the nature of their work or to not having access to a radio or not being able to select which programmes to listen to if male members of the household are present.
Both the quantitative data and the focus groups highlight some issues pertinent to gender differences in ICT access and usage that are similar to findings in early studies and literature. It is clear from the evidence that although there is gender inequity, poorer men and women may have more in common when it comes to ICT access and usage than women and men across income, and urban and rural divides. This study highlights once more the necessity of communication irrespective of ones income level, gender or location. People devised multiple strategies to communicate – from using neighbours’ and friends’ phones, to owning SIMS only where they cannot afford a phone, to the use of public access centres or ‘please call me’ or ‘beeping’ to alert the other party. Interestingly, a large number of social norms and behaviour towards gender have spilled over into the ICT world.
The cost of communications remains a major challenge to Africa and in all the focus groups conducted men and women across the board have highlighted call costs as a constraint on communication. Women who have fewer opportunities for personal contact as a result of being housewives, doing unpaid work or generally earning less than their male counterparts, seem particularly disadvantaged by the high cost of communication. This has an impact on their capacity to access and use ICTs. To get around the issue of financial constraints, many women have relied on others to get their mobile phones or SIMs, or to cover their mobile expenses, and economise on calls by making missed calls. The situation is worse for low-income rural woman than it is for urban women, who tend to be employed more, even if only informally. Due to differences in mobility and access to income, rural women are more likely to be deprived of access to any ICTs than rural men.
From this evidence we conclude that, to a large extent, gender inequities in access to and usage of ICTs cannot be addressed through ICT policies per se. They require policy interventions in other areas that would allow women and girls to enjoy the benefits of ICTs equally. This would include policies and programmes that incentivise the education of girls – and particularly their participation in mathematics, science and engineering if they are to work in this sector in the same numbers as men. Increased educational opportunities are likely to address some of the issues relating to their relatively low levels of employment. This in turn will increase the income that women have to spend on ICT services allowing them to participate more effectively in society and the economy. Many of the barriers for women, however, relate to cultural norms and practices that are difficult to legislate away.
As large number of women are among those most marginalised from ICTs they are likely to benefit from any more general sectoral interventions that extend services to lower income groups through low-cost business models or targeted universal service fund allocations or effective price regulation. For Internet services to catch up with other developing regions African governments will need to undertake specific demand stimulation efforts and this is another area where they could actively pursue inclusion of women and girls through targeted stimulation programmes.
Executive Summary
Introduction 1Background 2Methodology 6Mobile Phone 12Internet 18Radio & TV 23Conclusion 29References 30Appendix 32Focus group discussions 32Probit Results Internet 33Probit Results Radio & TV 38
Table of Contents
IntroductionThe greatest challenge facing developing countries is the development of the human capital required to operate a modern economy and society effectively. Harnessing all their human potential, from both men and women, is the only route to meeting the developmental needs of countries, and ensuring their competitiveness in the global economy. Benchmarking participation and use of ICT in the sector, almost absent until recently across Africa, is critical to establishing the status and progress of ICT access and usage and ultimately the success and failure of ICT policies aimed at promoting ICT uptake.
That ICTs play an important role in African development is now well documented. The use of wider access to telephone services to enable social inclusion through employment generation and improvements in social services, and in fishing and farming practices has been documented (de Silva, Ratnadiwakara and Soysa 2009, Jensen 2007). Evidence can be found that access to ICTs (such as telephones) can break down the isolation of individuals, enhance their chance of economic inclusion and thus ‘provide diverse avenues for women’s social, political and economic empowerment’ (UNDAW 2003). Also widely studied is the uneven nature of the benefits that accrue to men and women from social engagement and economic participation, particularly to those living in remote rural areas in developing countries (Mottin-Sylla, 2005). This information has tended often to be anecdotal or amongst smaller communities. The gender disaggregated, nationally representative data on ICT access and usage presented in this paper is extremely limited but essential to verifying or challenging underlying assumptions about ICTs, gender equity and development. Most of the studies in recent years on women’s access to and usage of ICTs argue that there is a significant gender divide in ICT access and usage, particularly in developing countries. A study carried out in 2005 by the Gender and ICT Network (Reseau Genre et TIC), reveals that, globally, women’s chances to benefit from the advantages of the information society are one third less than men’s (Mottin-Sylla 2005).
A project that has specifically targeted women such as the now renowned Grameen Telephone Scheme in Bangladesh has demonstrated how ICTs can be deployed to improve their lives. In 2003, Grameen Phone and MTN Uganda introduced the scheme in Uganda, the first successful replication outside Bangladesh.
The approach adopted in this paper therefore assumes that ICTs have the potential to improve the social and economic well-being of the poor; however, this also depends on a range of other equity measures aimed at those currently marginalised. It also draws on a wide range of global indices and evidence that indicate that, for a range of factors, those marginalised from the economy and society are to different degrees in different counties, disproportionately women.1 There is also considerable evidence to support the view, that women’s ability to contribute to their own development and to that of their children, communities and the wider economy is dependent on the achievement of more equitable power relations in society; and that current inequities inhibit the development of nations and the potential of women to deploy ICTs towards these ends (Todaro and Smith 2007).
This paper aims to provide the kind of disaggregated data required to identify areas of inequity in access to ICTs between men and women and any differences in their usage at the national level and comparatively across countries. This should provide a basis for policy makers to develop interventions aimed at ensuring greater gender equity in relation to access and usage of ICTs. The analysis of the data also reveals other, perhaps overriding, inequities that point to the fact that poor women may have more in common with poor men in their own and other countries than with less marginalised women in their own and other countries. The paper is based on the Research ICT Africa (RIA) Household and Individual Access and Usage survey conducted in 17 African countries during 2007 and 2008, and on focus group studies that were conducted across five African countries to gain a greater qualitative understanding of access to and usage of ICTs from a gender perspective. The papers start with a review of the existing evidence and theory on the topic of ICT and gender. Next, the methodology and dataset on which the paper is based is introduced. The third section will discuss the results for general descriptive sample findings on the different ICTs – mobile phones, Internet, radio and TV. The paper concludes with a consolidated analysis of the findings and draws practical implications for policy and decision making.
1
1 The United Nations World Development Report has over decades demonstrated the unequal access of women to education, employment, loans and other developmental indicators.
BackgroundThere is a wide body of theoretical literature focusing on ICTs in the context of various development debates. Within the context of modernisation debates the focus on women emerged in what is now known as the women in development (WID) debate followed by the women and development debates (WAD) which challenged the notion of women as automatic beneficiaries of economic development as assumed in WID discourse. This was followed by the gender and development (GAD) debate which acknowledged the common suffering of poor men and of other marginalised people, not just of women. In terms of its proposed strategies for change, the latter argues for widespread social and economic transformation that will result in equitable and sustainable development, and this view resonates with the findings and resulting recommendations of this research. There is also a body of literature, not specifically within the development debate, which focuses on women and technology. This is concerned with the problems faced by women at work as a result of new technologies and the dominance of men in the ICT design professions. Over time this has shifted to ‘gender in technology’ which acknowledges the more fluid nature of the relationship between gender and technology (Sorensen 2002). For a long time the empirical scope of these debates was largely anecdotal and focused on small groups or individual accounts.
With the global debates on measuring the information society within the context of the World Summits on the Information Society (WSIS), in recent years there have been more serious attempts to quantify the digital divide. Paragraph 28a of the WSIS Geneva Plan of Action calls for performance evaluation and benchmarking, including gender analysis.2 As a result there have been a number of efforts to include gender dimensions to such initiatives.3 Most notable of these are the ITU ICT-Opportunity Index4 which measures the digital divide by revealing the relative difference in ICT opportunity levels among economies and over time. The different sub-indices allow countries to further identify their specific weaknesses and strengths.
The Digital Opportunity Index is an e-index which seeks to measure the digital divide and compare ICT performance within and across countries by benchmarking countries based on a set of internationally agreed ICT indicators.5 But as Jensen and Mahan (2007) point out: ‘Gendered indicators ostensibly continue to be at the top of everyone’s agendas.’6 But, as Huyer and Hafkin emphasise, none of the major ICT or science and technology frameworks disaggregates data and indicators on grounds of gender. Likewise, none of the major gender equality indexes incorporate ICT and science and technology (2007).
So within these studies there is very little disaggregation of either access or usage on the basis of gender. This is largely because fixed line or home phones are assumed to be equally accessible to different members of the household, which the 2008 RIA demand side survey does not unequivocally confirm. Secondly, supply side fixed and mobile subscriber numbers are generally unable to provide accurate gender breakdowns in the way the demand side surveys can.
Available indices suggest that, although there is a gender gap in all countries, with the significant growth in access to and usage of ICTs, most particularly mobile phones, the relative difference between men and women is diminishing (Sorenson 2002).
Zainudeen et al. (2008) conducted studies on mobile phone usage at the bottom of the income pyramid in Asia and concluded that, while there is a gender divide in access to ICTs in Pakistan and India, there is less of a divide in Sri Lanka, and none in the Philippines and Thailand, where mobiles are most pervasive. The Zainudeen et al. (2008) study
22
2 ITU Resolutions on Gender <http://www.itu.int/ITU-D/gender/background/>:
Plenipotentiary Conference of the International Telecommunication Union - Resolution 70 (Rev.
Antalya 2006) - Gender mainstreaming in ITU and promotion of gender.3 The OECD’s Working Party on the Information Economy (WPIE) provides an overview of the gender distribution of ICT and ICT-related employment in OECD countries, and compares these to the gender distribution of total employment. Participation in ICT related education and training, and differences in ICT access and use by gender are also investigated (www.oecd.org/sti/ICT-employment). (http://www.itu.int/ITU-D/ict/doi/index.html).4 http://www.itu.int/ITU-D/ict/publications/ict-oi/2007/index.html5 (http://www.itu.int/ITU-D/ict/doi/index.html)6 Toward a Single ICT Index - Recommendations on the Formulation of a Flagship.
supports the view that there is a link between the magnitude of the gender divide and overall penetration levels. They assert that ‘the gender divide, as with the digital divide, has been found to be especially large in low income countries, where ICT penetration levels are also low’. It is intuitive, they argue, that as income and development improve, overall penetration levels increase. As income increases, households will be able to afford more phones, providing more women with access. Chabossou et al. (2008) have already shown that higher personal income results in higher probability of having a mobile phone.
Contradicting this assumption, however, Zainudeen and Iqbal (2007) make the important comment that there is evidence of a digital divide of the same magnitude in high socio-economic groups in the countries surveyed, which show an overall disparity between male and female access, and their paper identifies the need for policy intervention to remedy this. Specifically, the authors state in a footnote that women’s rate of Internet access does not increase in tandem with increases in national rates of Internet penetration.7
Other research has even more fundamentally challenged the notion that access to ICTs will lead to the empowerment of women, the poor or the marginalised. Casal de Vela and Ofreneo (2007) argue that despite the lack of data to support the contribution of ICTs to the development of women, an ‘ICT-centric development framework’ has emerged that privileges new ICTs over traditional communication tools.
Prior analyses of the RIA e-Access & Usage Household Survey data conducted by Schmidt & Stork (2009) for instance revealed that in 9 out of 17 countries, being female negatively affected the probability of someone having e-skills. These results support the findings that men and women may differ in their usage of ICTs, especially since the model used to analyse the relationship between gender and e-skills controlled for other relevant factors such as level of education and income.
A number of studies in recent years have sought to understand gender similarities and differences in access and usage. Gender and technology studies have found that men and women adopt and use technology differently (Gefen & Straub, 1997; Venkatesh & Morris, 2000). Men’s decisions to use technology are more strongly influenced by their perception of usefulness, while women’s decisions are based more on perceptions of the technology’s ease of use (Venkatesh & Morris, 2000). Further, men and women may view the same mode of communication differently.8
Women are said to use the phone mainly for social reasons like maintaining relationships while men use it for maintaining employment contacts, professional and other work related issues. More pertinent to this study is the usage of and access to phones in developing countries. A study by Souter et al., (2005) conducted in rural Gujarat, India on the impact of ICTs on rural livelihoods, found that men used mobile phones, both personal and kiosks, more frequently than women. This is likely to be a function of social norms and financial considerations that correlate with unequal gendered access, though the study by Zainudeen and Iqbal (2007) found little difference in the purposes for which phones were used.
Another dimension to gendered access that was found in a study by the Gender and ICT Network (Regentic) in West Africa9 was that women faced other issues, like crime and security in accessing public kiosks and were often intimidated by the technology itself. This is confirmed by the BOP mobile studies in Asia: ‘Interestingly, men frequently felt threatened by women’s use of cell phones and the Internet; the new freedoms afforded to women were perceived as destabilizing to relationships. In many cases men monitored the cell phone and Internet use of their partners.’ (Huyer, et al. 2006)
Sophia Huyer and Nancy Hafkin (2007) state: ‘A range of socio-economic and political factors affect and frame the gender divide, including social and cultural barriers to technology use; education and skills levels; employment and income trends; media and content; privacy and security and location/mode of access’ (2007:1).
3
7 Zainudeen and Iqbal’s findings (2007) that suggest exceptions to the link between the size of the gender divide and overall penetration levels in a country could not be addressed in this cross-sectional study. Further research using time-series data is needed to confirm this hypothesis. 8 See Gefen & Straub (1997); Ono (2003)9 Gender digital divide in six African countries, as part of a wider study, Gender digital divide in Francophone Africa: data and indicators.
From this perspective Huyer & Hafkin (2007, 2008) seek to identify policy interventions to improve gender equity. They provide a framework for policy makers to determine what sectors of the economy and society are the most strategically significant to achieving women’s development goals. While they have sought to measure women’s participation in the knowledge society using a wider set of indicators than traditional digital divide measures – which focus primarily on access to ICTs – they go beyond by including other indicators. They include wider factors that affect the participation of women in the knowledge economy such as health, social and economic status; access to resources such as housing, electricity and loans; the percentage of women in parliaments and ministries, professional associations and NGOs; engendering of policy, women in science and technology.
Their report assumes that if women are able to contribute actively to the knowledge society, societies will better be able to fulfill their full potential. Yet little is known about current rates of participation in the knowledge society and economy. As Huyer and Hafkin point out without this information it is impossible to set national targets.
As access to ICTs is so closely linked to economic activity and social and cultural factors, it is difficult to ascertain changes in access to ICTs as a direct result of policy. Despite this challenge research should address the linkage between access to and usage of ICTs and other connected factors (e.g. gender, age) to deepen the understanding of underlying mechanisms.
The RIA 2007 household survey takes this into consideration and specifically addresses the issue of disaggregation by integrating gender splits into the design of the study and methodology to allow for analysis by gender. Thus, it presents one of the few bodies of work with disaggregated data on African ICT access and use on the individual and household level.
Conceptually, digital divide gender studies are concerned with the differential exclusion and inclusion of women and men from the world of information and communication technology. Yet, exclusion is conceptualised far more extensively than inclusion. In fact inclusion is generally only operationalised in terms of exclusion mechanisms, making it an epiphenomenon as Sorensen (2002) points out. Excluding processes seem to be apparent especially in advanced technologies. Computer design, technology science or engineering are male dominated professions less taken by women. Girls are already seriously lagging behind boys when it comes to computer skills. But as Sorenson (2002) asked: ‘Why are women seemingly less interested in the technology, and why do many exemplars of new ICT artifacts seem to reflect masculine rather than feminine interests?’
To approach an answer to that question and develop strategies to include women into ICT the relationship between technology and gender has to be (empirically) explored. Sorenson describes the relationship between gender and ICT ‘as an issue of their mutual shaping or co-construction’ (2002). For our study we also adopt this perspective: It is not assumed that gender has a causal influence on ICT or vice versa, but rather the dynamic interplay between them becomes the matter of interest.
Generally quantitative studies of gender are more optimistic about the palliative effects of ICT on gender inequity while qualitative research on the subject tends to be pessimistic, pointing to the more intractable dimensions of gender inequity that underlie inequitable access to and usage of ICTs. Sorenson (2002) states that inclusion into ICT is most commonly understood as a process of diffusion with Rogers (1995) inimitable S-curve as its standard outcome. But as she points out, this overlooks a range of other factors than access to ICT that influence the differential uptake between men and women. Factors like income, level of education and ethnicity (Oost, 2002; Faulkner, 2002, MacKeogh, 2002; Fortunati & Manganelli, 2002) that verifiably affect the relationship between gender and ICT also need to be taken into account to provide a better insight into exclusion and inclusion processes. Studies support that age also interacts with gender and the access to and use of ICT. Although there is a gender gap reported in most of the studies concerning ICT, evidence can be found that cross-cultural differences need to be considered as well (e.g. Schnitzel 1999; Hersh, 2000; Fortunati & Manganelli, 2002).
44
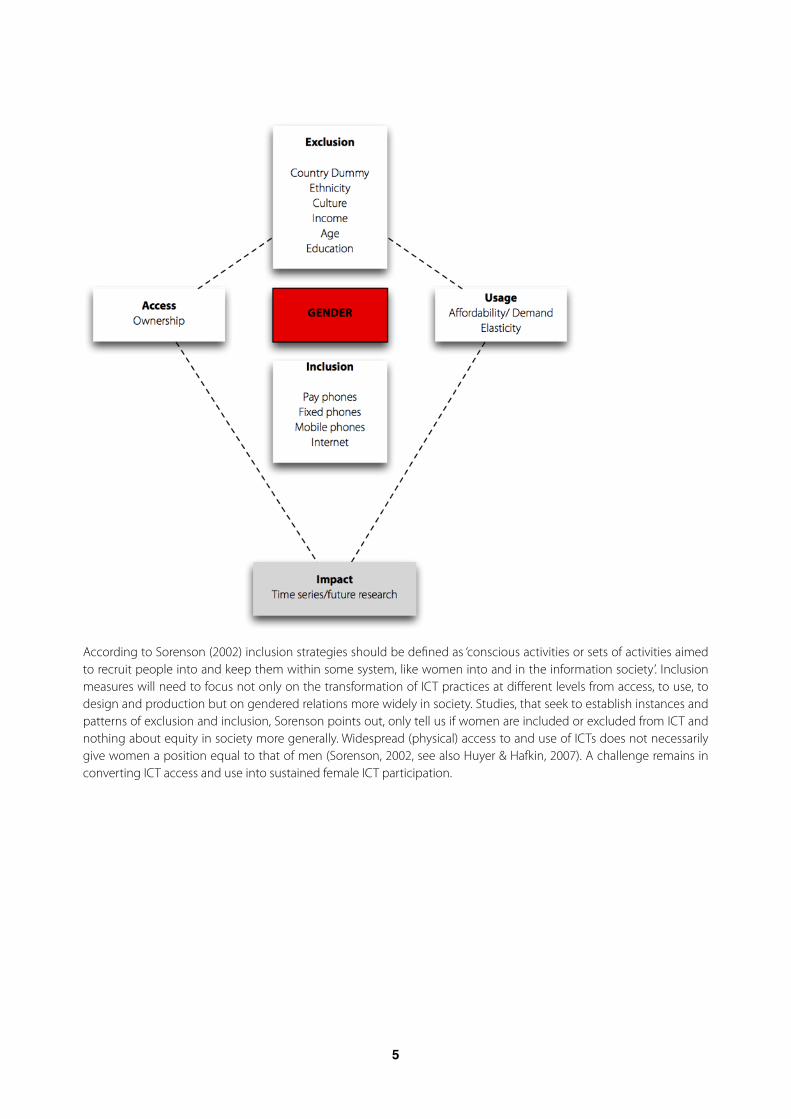
According to Sorenson (2002) inclusion strategies should be defined as ‘conscious activities or sets of activities aimed to recruit people into and keep them within some system, like women into and in the information society’. Inclusion measures will need to focus not only on the transformation of ICT practices at different levels from access, to use, to design and production but on gendered relations more widely in society. Studies, that seek to establish instances and patterns of exclusion and inclusion, Sorenson points out, only tell us if women are included or excluded from ICT and nothing about equity in society more generally. Widespread (physical) access to and use of ICTs does not necessarily give women a position equal to that of men (Sorenson, 2002, see also Huyer & Hafkin, 2007). A challenge remains in converting ICT access and use into sustained female ICT participation.
5
MethodologyThis study contributes to the debates discussed above by providing an empirical basis for assessing gender dimensions of access and usage across 17 African countries – Benin, Botswana, Burkina Faso, Cameroon, Cote d’Ivoire, Ethiopia, Ghana, Kenya, Mozambique, Namibia, Nigeria, Rwanda, Senegal, South Africa, Tanzania, Uganda and Zambia. The data that is used for analysis stems from surveys conducted by Research ICT Africa (RIA) from late in 2007 to the beginning of 2008. The data is nationally representative on a household level10 and for individuals 16 years or older. It builds on the 2004 RIA Household Survey of 10 African countries. The 2007/8 survey allows for a far more focused examination of areas of difference and similarity among men and women. The questionnaire, administered across the 17 African countries, was developed in a way that enables the disaggregation of data across a number of cross-cutting variables such as age, income, education and access to a range of ICTs. It therefore will enable the verification of certain assumptions in the literature about ICT and development in relation to gender.
The survey was stratified into metropolitan, other urban and rural areas. Enumerator areas (EAs) were sampled for each stratum using probability proportional to size (PPS) from the national census sample frame. for each country EA sample frames were constructed through listing all households within an EA. Households were then sampled using simple random sampling. The individual to be selected for each household was randomly selected from all household members and visitors that stayed at the home on the night the household was visited and that were 16 years of age or older.
The RIA questionnaire was divided in three sections. The first part, the household roster, collected information about all household members. The second part collected household related information. The head of the household or someone that manages the household answered part one and two. The third part, the individual section, was answered by a randomly selected individual 16 years of age or older that slept in the house the night of the interview and included household members and visitors.
The statistical analysis of the gender variances within the data collected quantitatively in the household survey suggested a number of areas of statistical significance. Quantitative data, however, provides limited in-depth evidence of any gender differences. Therefore, focus groups were conducted in five countries – Nigeria, South Africa, Cameroon, Uganda and Ethiopia in addition to the survey to provide in-depth understanding of gender differences in the usage, ownership and experience of ICTs in these five countries. The purpose of the focus groups was to determine some of the factors influencing ICT access and usage that cannot be determined by quantitative analysis and hopefully, shed some light on some of the results of the household survey related to gender. For the breakdown of numbers of focus groups and composition see Appendix A.
This study will provide an evidential platform for further research that will need to determine under what conditions exclusion and inclusion from ICT networks translates into better opportunities or greater inequality.
Consolidating research findings on different ICTs (radio, TV, internet, mobile phone) we expected the gender differences identified in the table below, holding those factors11 constant that are assumed by the literature to be predictive for ICT access and usage.
66
10 Except for Zambia and Nigeria, which are not nationally representative as a result of the way sampling was undertaken, here data are extrapolations to the national level but are not nationally representative.11 As Sorenson (2002) points out there is still a shortage of studies analysing gender and ICT in relation to work. We try to address this by including employment status (students, housewife, part time employed, full time employed, unemployed, other e.g. occasionally working) as a reference category in the general models.
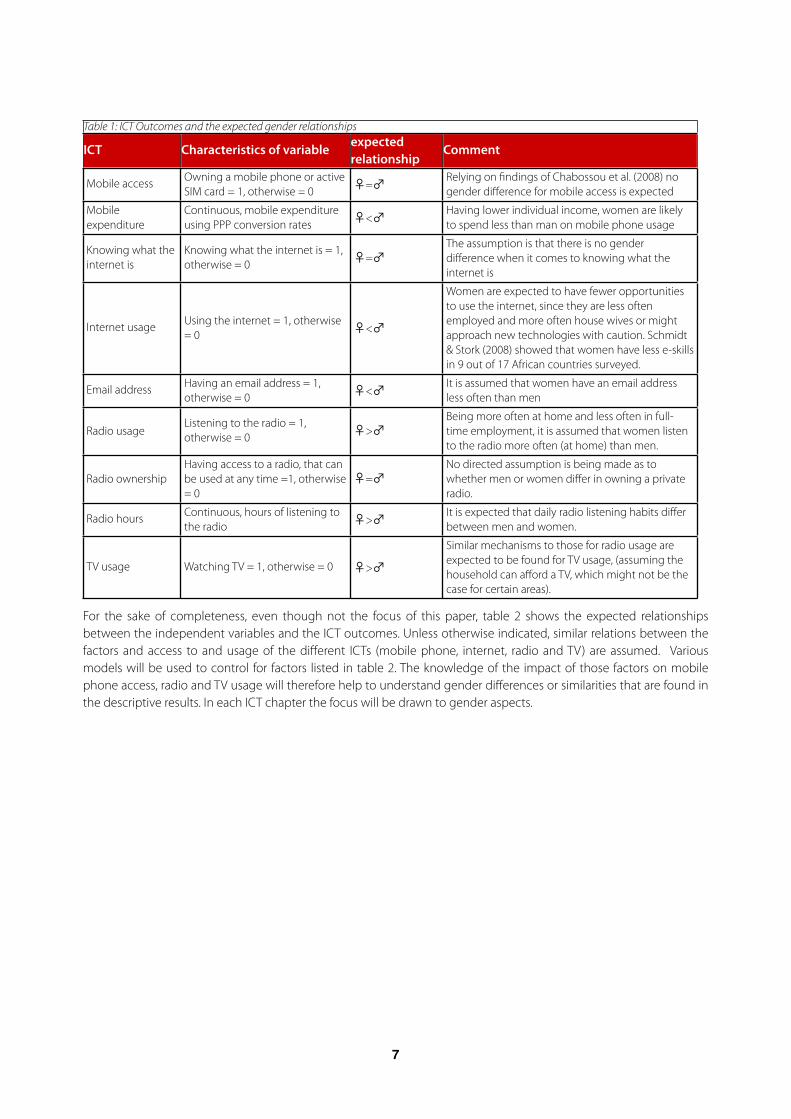
Table 1: ICT Outcomes and the expected gender relationshipsTable 1: ICT Outcomes and the expected gender relationshipsTable 1: ICT Outcomes and the expected gender relationshipsTable 1: ICT Outcomes and the expected gender relationships
ICT Characteristics of variable expected relationship
Comment
Mobile access Owning a mobile phone or active SIM card = 1, otherwise = 0 ♀=♂ Relying on findings of Chabossou et al. (2008) no
gender difference for mobile access is expected
Mobile expenditure
Continuous, mobile expenditure using PPP conversion rates ♀<♂ Having lower individual income, women are likely
to spend less than man on mobile phone usage
Knowing what the internet is
Knowing what the internet is = 1, otherwise = 0 ♀=♂
The assumption is that there is no gender difference when it comes to knowing what the internet is
Internet usage Using the internet = 1, otherwise = 0 ♀<♂
Women are expected to have fewer opportunities to use the internet, since they are less often employed and more often house wives or might approach new technologies with caution. Schmidt & Stork (2008) showed that women have less e-skills in 9 out of 17 African countries surveyed.
Email address Having an email address = 1, otherwise = 0 ♀<♂ It is assumed that women have an email address
less often than men
Radio usageListening to the radio = 1, otherwise = 0 ♀>♂
Being more often at home and less often in full-time employment, it is assumed that women listen to the radio more often (at home) than men.
Radio ownershipHaving access to a radio, that can be used at any time =1, otherwise = 0
♀=♂No directed assumption is being made as to whether men or women differ in owning a private radio.
Radio hours Continuous, hours of listening to the radio ♀>♂ It is expected that daily radio listening habits differ
between men and women.
TV usage Watching TV = 1, otherwise = 0 ♀>♂Similar mechanisms to those for radio usage are expected to be found for TV usage, (assuming the household can afford a TV, which might not be the case for certain areas).
For the sake of completeness, even though not the focus of this paper, table 2 shows the expected relationships between the independent variables and the ICT outcomes. Unless otherwise indicated, similar relations between the factors and access to and usage of the different ICTs (mobile phone, internet, radio and TV) are assumed. Various models will be used to control for factors listed in table 2. The knowledge of the impact of those factors on mobile phone access, radio and TV usage will therefore help to understand gender differences or similarities that are found in the descriptive results. In each ICT chapter the focus will be drawn to gender aspects.
7
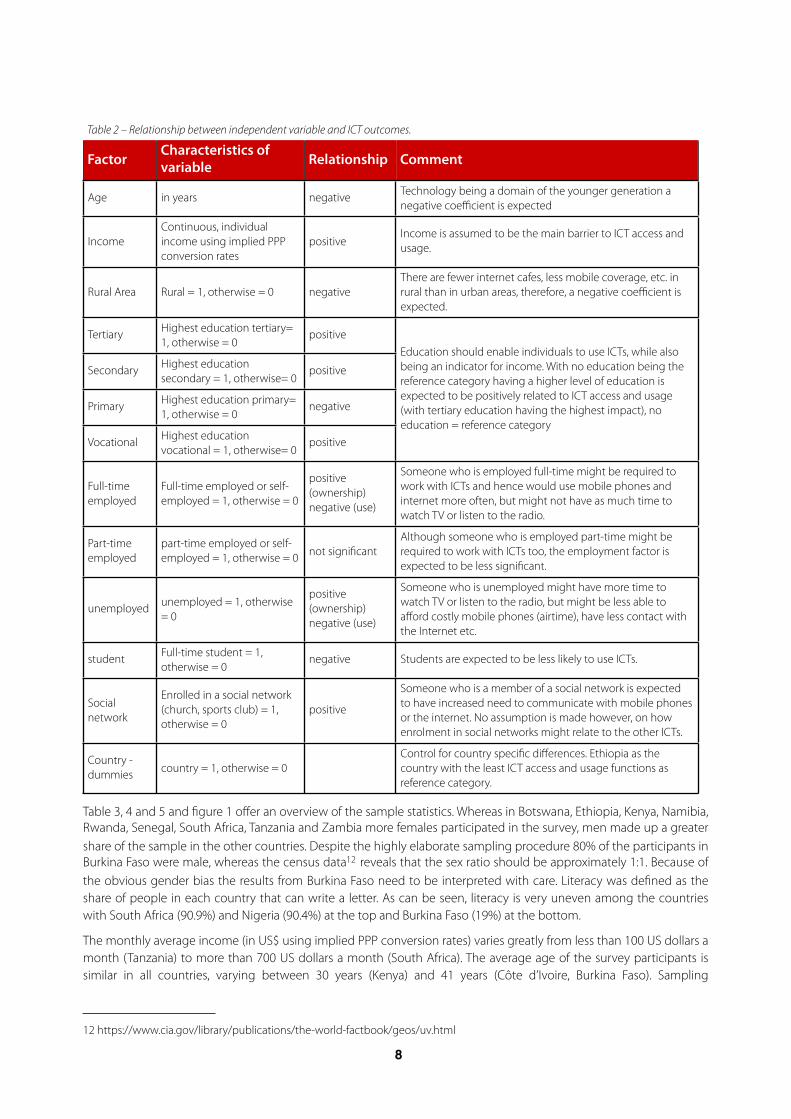
Table 2 – Relationship between independent variable and ICT outcomes.Table 2 – Relationship between independent variable and ICT outcomes.Table 2 – Relationship between independent variable and ICT outcomes.Table 2 – Relationship between independent variable and ICT outcomes.
FactorCharacteristics of variable Relationship Comment
Age in years negative Technology being a domain of the younger generation a negative coefficient is expected
IncomeContinuous, individual income using implied PPP conversion rates
positiveIncome is assumed to be the main barrier to ICT access and usage.
Rural Area Rural = 1, otherwise = 0 negativeThere are fewer internet cafes, less mobile coverage, etc. in rural than in urban areas, therefore, a negative coefficient is expected.
Tertiary Highest education tertiary= 1, otherwise = 0
positiveEducation should enable individuals to use ICTs, while also being an indicator for income. With no education being the reference category having a higher level of education is expected to be positively related to ICT access and usage (with tertiary education having the highest impact), no education = reference category
Secondary Highest education secondary = 1, otherwise= 0
positive
Education should enable individuals to use ICTs, while also being an indicator for income. With no education being the reference category having a higher level of education is expected to be positively related to ICT access and usage (with tertiary education having the highest impact), no education = reference category
Primary Highest education primary= 1, otherwise = 0
negative
Education should enable individuals to use ICTs, while also being an indicator for income. With no education being the reference category having a higher level of education is expected to be positively related to ICT access and usage (with tertiary education having the highest impact), no education = reference category
Vocational Highest education vocational = 1, otherwise= 0
positive
Education should enable individuals to use ICTs, while also being an indicator for income. With no education being the reference category having a higher level of education is expected to be positively related to ICT access and usage (with tertiary education having the highest impact), no education = reference category
Full-time employed
Full-time employed or self-employed = 1, otherwise = 0
positive (ownership) negative (use)
Someone who is employed full-time might be required to work with ICTs and hence would use mobile phones and internet more often, but might not have as much time to watch TV or listen to the radio.
Part-timeemployed
part-time employed or self-employed = 1, otherwise = 0 not significant
Although someone who is employed part-time might be required to work with ICTs too, the employment factor is expected to be less significant.
unemployed unemployed = 1, otherwise = 0
positive (ownership) negative (use)
Someone who is unemployed might have more time to watch TV or listen to the radio, but might be less able to afford costly mobile phones (airtime), have less contact with the Internet etc.
student Full-time student = 1, otherwise = 0
negative Students are expected to be less likely to use ICTs.
Social network
Enrolled in a social network (church, sports club) = 1, otherwise = 0
positive
Someone who is a member of a social network is expected to have increased need to communicate with mobile phones or the internet. No assumption is made however, on how enrolment in social networks might relate to the other ICTs.
Country - dummies country = 1, otherwise = 0
Control for country specific differences. Ethiopia as the country with the least ICT access and usage functions as reference category.
Table 3, 4 and 5 and figure 1 offer an overview of the sample statistics. Whereas in Botswana, Ethiopia, Kenya, Namibia, Rwanda, Senegal, South Africa, Tanzania and Zambia more females participated in the survey, men made up a greater share of the sample in the other countries. Despite the highly elaborate sampling procedure 80% of the participants in Burkina Faso were male, whereas the census data12 reveals that the sex ratio should be approximately 1:1. Because of the obvious gender bias the results from Burkina Faso need to be interpreted with care. Literacy was defined as the share of people in each country that can write a letter. As can be seen, literacy is very uneven among the countries with South Africa (90.9%) and Nigeria (90.4%) at the top and Burkina Faso (19%) at the bottom.
The monthly average income (in US$ using implied PPP conversion rates) varies greatly from less than 100 US dollars a month (Tanzania) to more than 700 US dollars a month (South Africa). The average age of the survey participants is similar in all countries, varying between 30 years (Kenya) and 41 years (Côte d’Ivoire, Burkina Faso). Sampling
88
12 https://www.cia.gov/library/publications/the-world-factbook/geos/uv.html
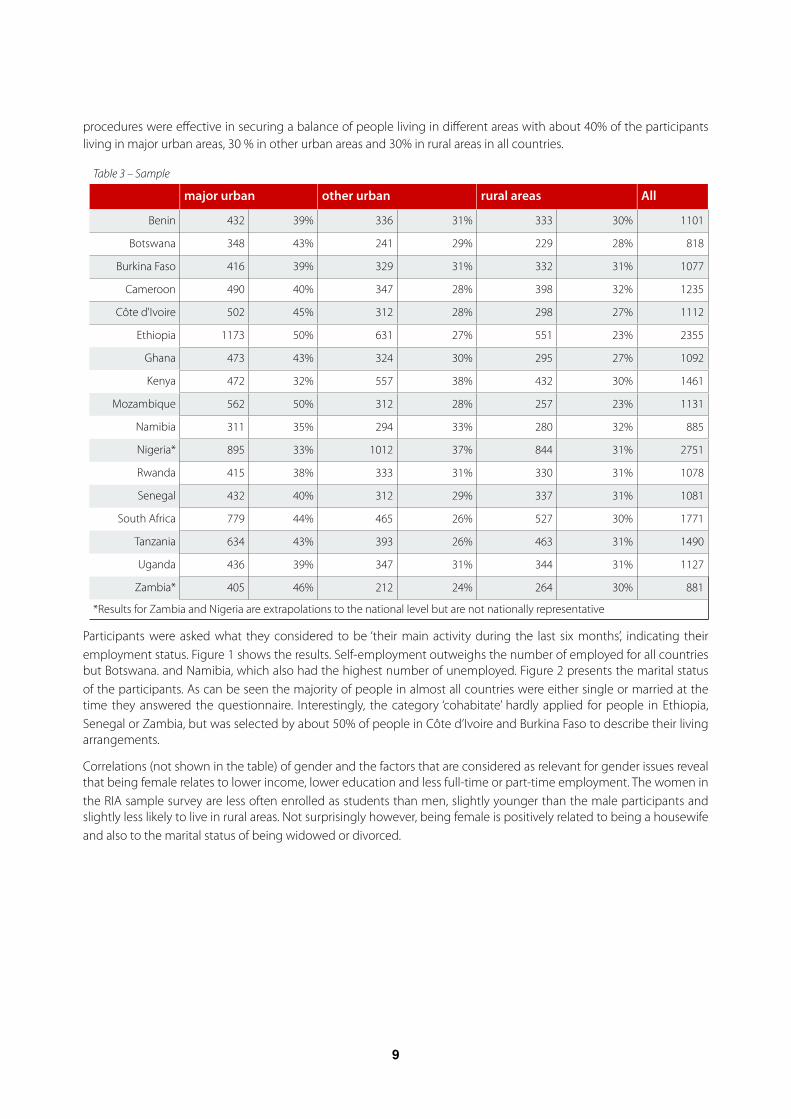
procedures were effective in securing a balance of people living in different areas with about 40% of the participants living in major urban areas, 30 % in other urban areas and 30% in rural areas in all countries.
Table 3 – SampleTable 3 – SampleTable 3 – SampleTable 3 – SampleTable 3 – SampleTable 3 – SampleTable 3 – SampleTable 3 – Sample
major urbanmajor urban other urbanother urban rural areasrural areas All
Benin 432 39% 336 31% 333 30% 1101
Botswana 348 43% 241 29% 229 28% 818
Burkina Faso 416 39% 329 31% 332 31% 1077
Cameroon 490 40% 347 28% 398 32% 1235
Côte d'Ivoire 502 45% 312 28% 298 27% 1112
Ethiopia 1173 50% 631 27% 551 23% 2355
Ghana 473 43% 324 30% 295 27% 1092
Kenya 472 32% 557 38% 432 30% 1461
Mozambique 562 50% 312 28% 257 23% 1131
Namibia 311 35% 294 33% 280 32% 885
Nigeria* 895 33% 1012 37% 844 31% 2751
Rwanda 415 38% 333 31% 330 31% 1078
Senegal 432 40% 312 29% 337 31% 1081
South Africa 779 44% 465 26% 527 30% 1771
Tanzania 634 43% 393 26% 463 31% 1490
Uganda 436 39% 347 31% 344 31% 1127
Zambia* 405 46% 212 24% 264 30% 881
*Results for Zambia and Nigeria are extrapolations to the national level but are not nationally representative*Results for Zambia and Nigeria are extrapolations to the national level but are not nationally representative*Results for Zambia and Nigeria are extrapolations to the national level but are not nationally representative*Results for Zambia and Nigeria are extrapolations to the national level but are not nationally representative*Results for Zambia and Nigeria are extrapolations to the national level but are not nationally representative*Results for Zambia and Nigeria are extrapolations to the national level but are not nationally representative*Results for Zambia and Nigeria are extrapolations to the national level but are not nationally representative*Results for Zambia and Nigeria are extrapolations to the national level but are not nationally representative
Participants were asked what they considered to be ‘their main activity during the last six months’, indicating their employment status. Figure 1 shows the results. Self-employment outweighs the number of employed for all countries but Botswana. and Namibia, which also had the highest number of unemployed. Figure 2 presents the marital status of the participants. As can be seen the majority of people in almost all countries were either single or married at the time they answered the questionnaire. Interestingly, the category ‘cohabitate’ hardly applied for people in Ethiopia, Senegal or Zambia, but was selected by about 50% of people in Côte d’Ivoire and Burkina Faso to describe their living arrangements.
Correlations (not shown in the table) of gender and the factors that are considered as relevant for gender issues reveal that being female relates to lower income, lower education and less full-time or part-time employment. The women in the RIA sample survey are less often enrolled as students than men, slightly younger than the male participants and slightly less likely to live in rural areas. Not surprisingly however, being female is positively related to being a housewife and also to the marital status of being widowed or divorced.
9
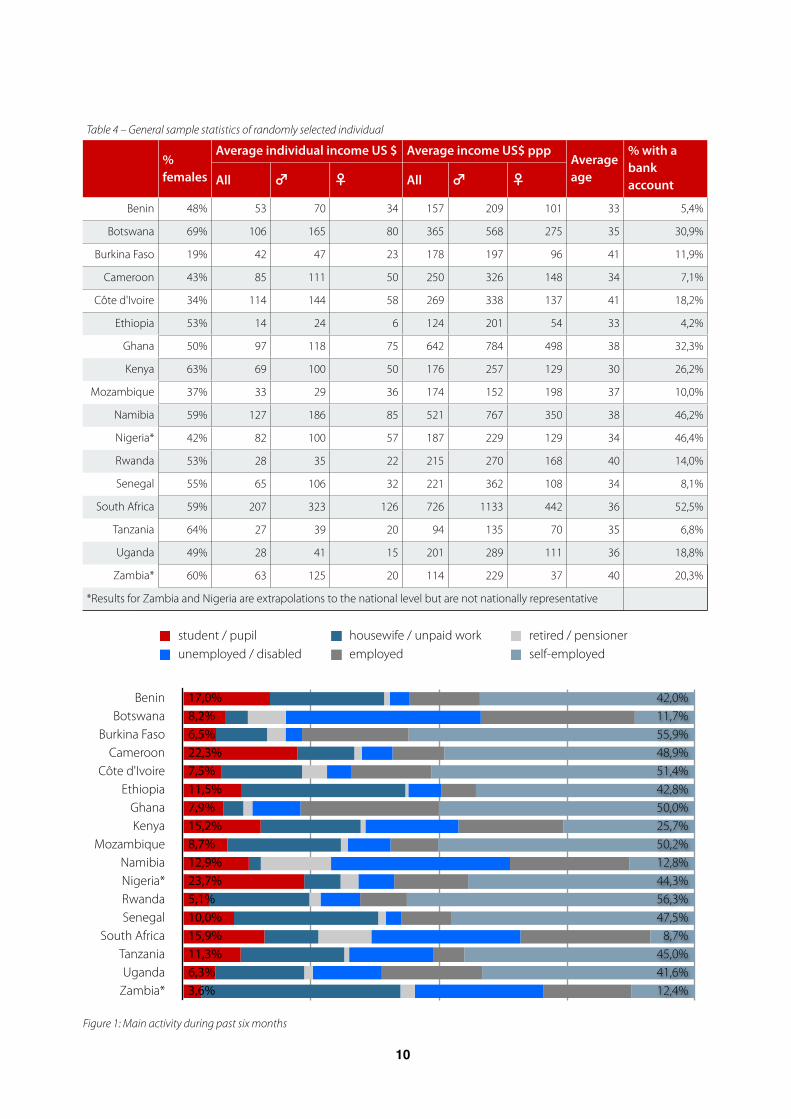
Table 4 – General sample statistics of randomly selected individualTable 4 – General sample statistics of randomly selected individualTable 4 – General sample statistics of randomly selected individualTable 4 – General sample statistics of randomly selected individualTable 4 – General sample statistics of randomly selected individualTable 4 – General sample statistics of randomly selected individualTable 4 – General sample statistics of randomly selected individualTable 4 – General sample statistics of randomly selected individualTable 4 – General sample statistics of randomly selected individualTable 4 – General sample statistics of randomly selected individual
% females
Average individual income US $Average individual income US $Average individual income US $ Average income US$ pppAverage income US$ pppAverage income US$ pppAverage age
% with a bank account
% females All ♂ ♀ All ♂ ♀
Average age
% with a bank account
Benin 48% 53 70 34 157 209 101 33 5,4%
Botswana 69% 106 165 80 365 568 275 35 30,9%
Burkina Faso 19% 42 47 23 178 197 96 41 11,9%
Cameroon 43% 85 111 50 250 326 148 34 7,1%
Côte d'Ivoire 34% 114 144 58 269 338 137 41 18,2%
Ethiopia 53% 14 24 6 124 201 54 33 4,2%
Ghana 50% 97 118 75 642 784 498 38 32,3%
Kenya 63% 69 100 50 176 257 129 30 26,2%
Mozambique 37% 33 29 36 174 152 198 37 10,0%
Namibia 59% 127 186 85 521 767 350 38 46,2%
Nigeria* 42% 82 100 57 187 229 129 34 46,4%
Rwanda 53% 28 35 22 215 270 168 40 14,0%
Senegal 55% 65 106 32 221 362 108 34 8,1%
South Africa 59% 207 323 126 726 1133 442 36 52,5%
Tanzania 64% 27 39 20 94 135 70 35 6,8%
Uganda 49% 28 41 15 201 289 111 36 18,8%
Zambia* 60% 63 125 20 114 229 37 40 20,3%
*Results for Zambia and Nigeria are extrapolations to the national level but are not nationally representative*Results for Zambia and Nigeria are extrapolations to the national level but are not nationally representative*Results for Zambia and Nigeria are extrapolations to the national level but are not nationally representative*Results for Zambia and Nigeria are extrapolations to the national level but are not nationally representative*Results for Zambia and Nigeria are extrapolations to the national level but are not nationally representative*Results for Zambia and Nigeria are extrapolations to the national level but are not nationally representative*Results for Zambia and Nigeria are extrapolations to the national level but are not nationally representative*Results for Zambia and Nigeria are extrapolations to the national level but are not nationally representative*Results for Zambia and Nigeria are extrapolations to the national level but are not nationally representative
Figure 1: Main activity during past six months
student / pupil housewife / unpaid work retired / pensionerunemployed / disabled employed self-employed
BeninBotswana
Burkina FasoCameroon
Côte d'IvoireEthiopia
GhanaKenya
MozambiqueNamibiaNigeria*RwandaSenegal
South AfricaTanzaniaUganda
Zambia* 12,4%41,6%45,0%
8,7%47,5%56,3%44,3%12,8%50,2%25,7%50,0%42,8%51,4%48,9%55,9%11,7%42,0%
3,6%6,3%11,3%15,9%10,0%5,1%23,7%12,9%8,7%15,2%7,9%11,5%7,5%22,3%6,5%8,2%17,0%
1010
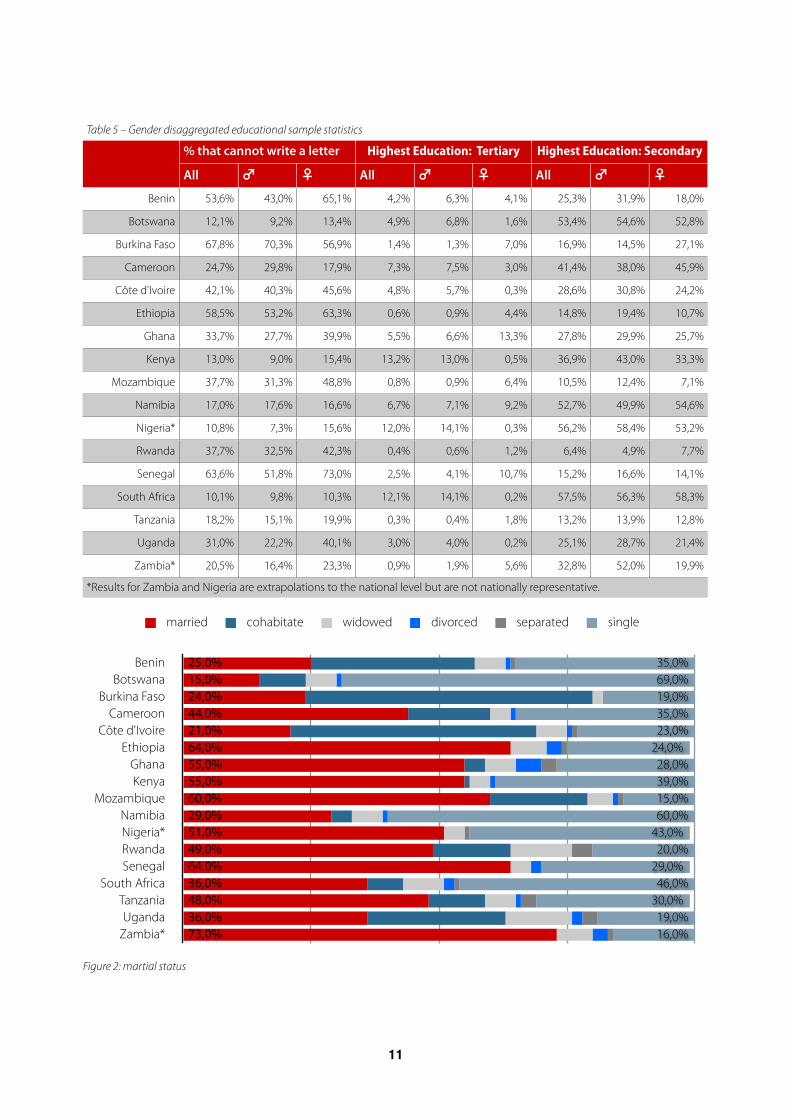
Table 5 – Gender disaggregated educational sample statisticsTable 5 – Gender disaggregated educational sample statisticsTable 5 – Gender disaggregated educational sample statisticsTable 5 – Gender disaggregated educational sample statisticsTable 5 – Gender disaggregated educational sample statisticsTable 5 – Gender disaggregated educational sample statisticsTable 5 – Gender disaggregated educational sample statisticsTable 5 – Gender disaggregated educational sample statisticsTable 5 – Gender disaggregated educational sample statisticsTable 5 – Gender disaggregated educational sample statistics
% that cannot write a letter% that cannot write a letter% that cannot write a letter Highest Education: TertiaryHighest Education: TertiaryHighest Education: Tertiary Highest Education: SecondaryHighest Education: SecondaryHighest Education: Secondary
All ♂ ♀ All ♂ ♀ All ♂ ♀Benin 53,6% 43,0% 65,1% 4,2% 6,3% 4,1% 25,3% 31,9% 18,0%
Botswana 12,1% 9,2% 13,4% 4,9% 6,8% 1,6% 53,4% 54,6% 52,8%
Burkina Faso 67,8% 70,3% 56,9% 1,4% 1,3% 7,0% 16,9% 14,5% 27,1%
Cameroon 24,7% 29,8% 17,9% 7,3% 7,5% 3,0% 41,4% 38,0% 45,9%
Côte d'Ivoire 42,1% 40,3% 45,6% 4,8% 5,7% 0,3% 28,6% 30,8% 24,2%
Ethiopia 58,5% 53,2% 63,3% 0,6% 0,9% 4,4% 14,8% 19,4% 10,7%
Ghana 33,7% 27,7% 39,9% 5,5% 6,6% 13,3% 27,8% 29,9% 25,7%
Kenya 13,0% 9,0% 15,4% 13,2% 13,0% 0,5% 36,9% 43,0% 33,3%
Mozambique 37,7% 31,3% 48,8% 0,8% 0,9% 6,4% 10,5% 12,4% 7,1%
Namibia 17,0% 17,6% 16,6% 6,7% 7,1% 9,2% 52,7% 49,9% 54,6%
Nigeria* 10,8% 7,3% 15,6% 12,0% 14,1% 0,3% 56,2% 58,4% 53,2%
Rwanda 37,7% 32,5% 42,3% 0,4% 0,6% 1,2% 6,4% 4,9% 7,7%
Senegal 63,6% 51,8% 73,0% 2,5% 4,1% 10,7% 15,2% 16,6% 14,1%
South Africa 10,1% 9,8% 10,3% 12,1% 14,1% 0,2% 57,5% 56,3% 58,3%
Tanzania 18,2% 15,1% 19,9% 0,3% 0,4% 1,8% 13,2% 13,9% 12,8%
Uganda 31,0% 22,2% 40,1% 3,0% 4,0% 0,2% 25,1% 28,7% 21,4%
Zambia* 20,5% 16,4% 23,3% 0,9% 1,9% 5,6% 32,8% 52,0% 19,9%
*Results for Zambia and Nigeria are extrapolations to the national level but are not nationally representative.*Results for Zambia and Nigeria are extrapolations to the national level but are not nationally representative.*Results for Zambia and Nigeria are extrapolations to the national level but are not nationally representative.*Results for Zambia and Nigeria are extrapolations to the national level but are not nationally representative.*Results for Zambia and Nigeria are extrapolations to the national level but are not nationally representative.*Results for Zambia and Nigeria are extrapolations to the national level but are not nationally representative.*Results for Zambia and Nigeria are extrapolations to the national level but are not nationally representative.*Results for Zambia and Nigeria are extrapolations to the national level but are not nationally representative.*Results for Zambia and Nigeria are extrapolations to the national level but are not nationally representative.*Results for Zambia and Nigeria are extrapolations to the national level but are not nationally representative.
Figure 2: martial status
married cohabitate widowed divorced separated single
BeninBotswana
Burkina FasoCameroon
Côte d'IvoireEthiopia
GhanaKenya
MozambiqueNamibiaNigeria*RwandaSenegal
South AfricaTanzaniaUganda
Zambia* 16,0%19,0%
30,0%46,0%
29,0%20,0%
43,0%60,0%15,0%39,0%28,0%
24,0%23,0%35,0%19,0%69,0%35,0%
73,0%36,0%48,0%36,0%64,0%49,0%51,0%29,0%60,0%55,0%55,0%64,0%21,0%44,0%24,0%15,0%25,0%
11
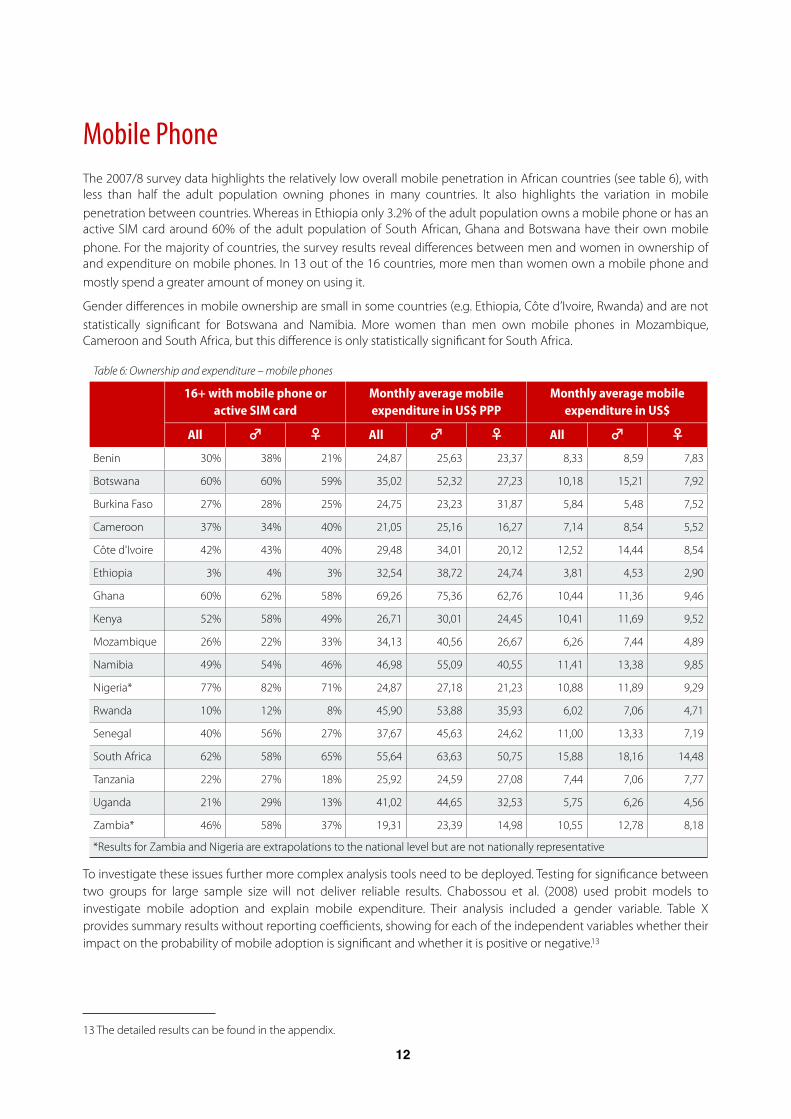
Mobile Phone The 2007/8 survey data highlights the relatively low overall mobile penetration in African countries (see table 6), with less than half the adult population owning phones in many countries. It also highlights the variation in mobile penetration between countries. Whereas in Ethiopia only 3.2% of the adult population owns a mobile phone or has an active SIM card around 60% of the adult population of South African, Ghana and Botswana have their own mobile phone. For the majority of countries, the survey results reveal differences between men and women in ownership of and expenditure on mobile phones. In 13 out of the 16 countries, more men than women own a mobile phone and mostly spend a greater amount of money on using it.
Gender differences in mobile ownership are small in some countries (e.g. Ethiopia, Côte d’Ivoire, Rwanda) and are not statistically significant for Botswana and Namibia. More women than men own mobile phones in Mozambique, Cameroon and South Africa, but this difference is only statistically significant for South Africa.
Table 6: Ownership and expenditure – mobile phonesTable 6: Ownership and expenditure – mobile phonesTable 6: Ownership and expenditure – mobile phonesTable 6: Ownership and expenditure – mobile phonesTable 6: Ownership and expenditure – mobile phonesTable 6: Ownership and expenditure – mobile phonesTable 6: Ownership and expenditure – mobile phonesTable 6: Ownership and expenditure – mobile phonesTable 6: Ownership and expenditure – mobile phonesTable 6: Ownership and expenditure – mobile phones
16+ with mobile phone or active SIM card
16+ with mobile phone or active SIM card
16+ with mobile phone or active SIM card
Monthly average mobile expenditure in US$ PPPMonthly average mobile expenditure in US$ PPPMonthly average mobile expenditure in US$ PPP
Monthly average mobile expenditure in US$
Monthly average mobile expenditure in US$
Monthly average mobile expenditure in US$
All ♂ ♀ All ♂ ♀ All ♂ ♀Benin 30% 38% 21% 24,87 25,63 23,37 8,33 8,59 7,83
Botswana 60% 60% 59% 35,02 52,32 27,23 10,18 15,21 7,92
Burkina Faso 27% 28% 25% 24,75 23,23 31,87 5,84 5,48 7,52
Cameroon 37% 34% 40% 21,05 25,16 16,27 7,14 8,54 5,52
Côte d'Ivoire 42% 43% 40% 29,48 34,01 20,12 12,52 14,44 8,54
Ethiopia 3% 4% 3% 32,54 38,72 24,74 3,81 4,53 2,90
Ghana 60% 62% 58% 69,26 75,36 62,76 10,44 11,36 9,46
Kenya 52% 58% 49% 26,71 30,01 24,45 10,41 11,69 9,52
Mozambique 26% 22% 33% 34,13 40,56 26,67 6,26 7,44 4,89
Namibia 49% 54% 46% 46,98 55,09 40,55 11,41 13,38 9,85
Nigeria* 77% 82% 71% 24,87 27,18 21,23 10,88 11,89 9,29
Rwanda 10% 12% 8% 45,90 53,88 35,93 6,02 7,06 4,71
Senegal 40% 56% 27% 37,67 45,63 24,62 11,00 13,33 7,19
South Africa 62% 58% 65% 55,64 63,63 50,75 15,88 18,16 14,48
Tanzania 22% 27% 18% 25,92 24,59 27,08 7,44 7,06 7,77
Uganda 21% 29% 13% 41,02 44,65 32,53 5,75 6,26 4,56
Zambia* 46% 58% 37% 19,31 23,39 14,98 10,55 12,78 8,18
*Results for Zambia and Nigeria are extrapolations to the national level but are not nationally representative*Results for Zambia and Nigeria are extrapolations to the national level but are not nationally representative*Results for Zambia and Nigeria are extrapolations to the national level but are not nationally representative*Results for Zambia and Nigeria are extrapolations to the national level but are not nationally representative*Results for Zambia and Nigeria are extrapolations to the national level but are not nationally representative*Results for Zambia and Nigeria are extrapolations to the national level but are not nationally representative*Results for Zambia and Nigeria are extrapolations to the national level but are not nationally representative*Results for Zambia and Nigeria are extrapolations to the national level but are not nationally representative*Results for Zambia and Nigeria are extrapolations to the national level but are not nationally representative*Results for Zambia and Nigeria are extrapolations to the national level but are not nationally representative
To investigate these issues further more complex analysis tools need to be deployed. Testing for significance between two groups for large sample size will not deliver reliable results. Chabossou et al. (2008) used probit models to investigate mobile adoption and explain mobile expenditure. Their analysis included a gender variable. Table X provides summary results without reporting coefficients, showing for each of the independent variables whether their impact on the probability of mobile adoption is significant and whether it is positive or negative.13
1212
13 The detailed results can be found in the appendix.
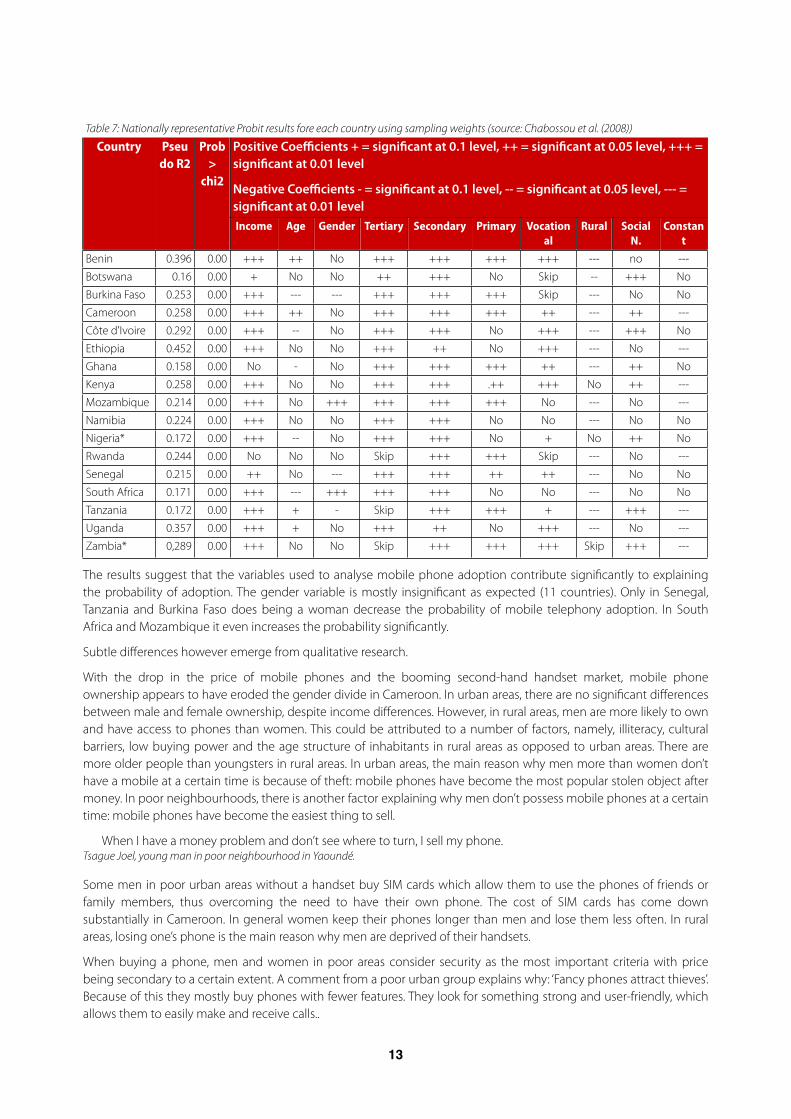
Table 7: Nationally representative Probit results fore each country using sampling weights (source: Chabossou et al. (2008))Table 7: Nationally representative Probit results fore each country using sampling weights (source: Chabossou et al. (2008))Table 7: Nationally representative Probit results fore each country using sampling weights (source: Chabossou et al. (2008))Table 7: Nationally representative Probit results fore each country using sampling weights (source: Chabossou et al. (2008))Table 7: Nationally representative Probit results fore each country using sampling weights (source: Chabossou et al. (2008))Table 7: Nationally representative Probit results fore each country using sampling weights (source: Chabossou et al. (2008))Table 7: Nationally representative Probit results fore each country using sampling weights (source: Chabossou et al. (2008))Table 7: Nationally representative Probit results fore each country using sampling weights (source: Chabossou et al. (2008))Table 7: Nationally representative Probit results fore each country using sampling weights (source: Chabossou et al. (2008))Table 7: Nationally representative Probit results fore each country using sampling weights (source: Chabossou et al. (2008))Table 7: Nationally representative Probit results fore each country using sampling weights (source: Chabossou et al. (2008))Table 7: Nationally representative Probit results fore each country using sampling weights (source: Chabossou et al. (2008))Table 7: Nationally representative Probit results fore each country using sampling weights (source: Chabossou et al. (2008))
Country Pseudo R2
Prob >
chi2
Positive Coefficients + = significant at 0.1 level, ++ = significant at 0.05 level, +++ = significant at 0.01 level
Negative Coefficients - = significant at 0.1 level, -- = significant at 0.05 level, --- = significant at 0.01 level
Positive Coefficients + = significant at 0.1 level, ++ = significant at 0.05 level, +++ = significant at 0.01 level
Negative Coefficients - = significant at 0.1 level, -- = significant at 0.05 level, --- = significant at 0.01 level
Positive Coefficients + = significant at 0.1 level, ++ = significant at 0.05 level, +++ = significant at 0.01 level
Negative Coefficients - = significant at 0.1 level, -- = significant at 0.05 level, --- = significant at 0.01 level
Positive Coefficients + = significant at 0.1 level, ++ = significant at 0.05 level, +++ = significant at 0.01 level
Negative Coefficients - = significant at 0.1 level, -- = significant at 0.05 level, --- = significant at 0.01 level
Positive Coefficients + = significant at 0.1 level, ++ = significant at 0.05 level, +++ = significant at 0.01 level
Negative Coefficients - = significant at 0.1 level, -- = significant at 0.05 level, --- = significant at 0.01 level
Positive Coefficients + = significant at 0.1 level, ++ = significant at 0.05 level, +++ = significant at 0.01 level
Negative Coefficients - = significant at 0.1 level, -- = significant at 0.05 level, --- = significant at 0.01 level
Positive Coefficients + = significant at 0.1 level, ++ = significant at 0.05 level, +++ = significant at 0.01 level
Negative Coefficients - = significant at 0.1 level, -- = significant at 0.05 level, --- = significant at 0.01 level
Positive Coefficients + = significant at 0.1 level, ++ = significant at 0.05 level, +++ = significant at 0.01 level
Negative Coefficients - = significant at 0.1 level, -- = significant at 0.05 level, --- = significant at 0.01 level
Positive Coefficients + = significant at 0.1 level, ++ = significant at 0.05 level, +++ = significant at 0.01 level
Negative Coefficients - = significant at 0.1 level, -- = significant at 0.05 level, --- = significant at 0.01 level
Positive Coefficients + = significant at 0.1 level, ++ = significant at 0.05 level, +++ = significant at 0.01 level
Negative Coefficients - = significant at 0.1 level, -- = significant at 0.05 level, --- = significant at 0.01 level
Country Pseudo R2
Prob >
chi2
Income Age Gender Tertiary Secondary Primary Vocational
Rural Social N.
Constant
Benin 0.396 0.00 +++ ++ No +++ +++ +++ +++ --- no ---
Botswana 0.16 0.00 + No No ++ +++ No Skip -- +++ No
Burkina Faso 0.253 0.00 +++ --- --- +++ +++ +++ Skip --- No No
Cameroon 0.258 0.00 +++ ++ No +++ +++ +++ ++ --- ++ ---
Côte d'Ivoire 0.292 0.00 +++ -- No +++ +++ No +++ --- +++ No
Ethiopia 0.452 0.00 +++ No No +++ ++ No +++ --- No ---
Ghana 0.158 0.00 No - No +++ +++ +++ ++ --- ++ No
Kenya 0.258 0.00 +++ No No +++ +++ .++ +++ No ++ ---
Mozambique 0.214 0.00 +++ No +++ +++ +++ +++ No --- No ---
Namibia 0.224 0.00 +++ No No +++ +++ No No --- No No
Nigeria* 0.172 0.00 +++ -- No +++ +++ No + No ++ No
Rwanda 0.244 0.00 No No No Skip +++ +++ Skip --- No ---
Senegal 0.215 0.00 ++ No --- +++ +++ ++ ++ --- No No
South Africa 0.171 0.00 +++ --- +++ +++ +++ No No --- No No
Tanzania 0.172 0.00 +++ + - Skip +++ +++ + --- +++ ---
Uganda 0.357 0.00 +++ + No +++ ++ No +++ --- No ---
Zambia* 0,289 0.00 +++ No No Skip +++ +++ +++ Skip +++ ---
The results suggest that the variables used to analyse mobile phone adoption contribute significantly to explaining the probability of adoption. The gender variable is mostly insignificant as expected (11 countries). Only in Senegal, Tanzania and Burkina Faso does being a woman decrease the probability of mobile telephony adoption. In South Africa and Mozambique it even increases the probability significantly.
Subtle differences however emerge from qualitative research.
With the drop in the price of mobile phones and the booming second-hand handset market, mobile phone ownership appears to have eroded the gender divide in Cameroon. In urban areas, there are no significant differences between male and female ownership, despite income differences. However, in rural areas, men are more likely to own and have access to phones than women. This could be attributed to a number of factors, namely, illiteracy, cultural barriers, low buying power and the age structure of inhabitants in rural areas as opposed to urban areas. There are more older people than youngsters in rural areas. In urban areas, the main reason why men more than women don’t have a mobile at a certain time is because of theft: mobile phones have become the most popular stolen object after money. In poor neighbourhoods, there is another factor explaining why men don’t possess mobile phones at a certain time: mobile phones have become the easiest thing to sell.
When I have a money problem and don’t see where to turn, I sell my phone.Tsague Joel, young man in poor neighbourhood in Yaoundé.
Some men in poor urban areas without a handset buy SIM cards which allow them to use the phones of friends or family members, thus overcoming the need to have their own phone. The cost of SIM cards has come down substantially in Cameroon. In general women keep their phones longer than men and lose them less often. In rural areas, losing one’s phone is the main reason why men are deprived of their handsets.
When buying a phone, men and women in poor areas consider security as the most important criteria with price being secondary to a certain extent. A comment from a poor urban group explains why: ‘Fancy phones attract thieves’. Because of this they mostly buy phones with fewer features. They look for something strong and user-friendly, which allows them to easily make and receive calls..
13
I can’t anymore buy a fancy phone. It’s a very risky business. The last time I had one, I wasn’t careful enough to phone at a safe place. One of those thugs we call ‘proprietor’ came close to me, rose his hand and just say: ‘put it here once you will finish’. I had no choice than doing his will. It’s was the second fancy handset putting my life at risk, and probably the last.
Djomo Honore Patrick, young man in poor neighbourhood in Yaoundé, Cameroon.
In middle to high income urban areas, women have the same attitude to phones as people in poor areas while men consider technology first. In rural areas, the trend is quite different. Older men consider price to be the determining criteria while young men look for features and sophistication. Young women, prefer fancy phones while older women share the same attitude as older men.
For phone owners, the difference between men and women lies in the method of acquisition. In general, men buy their own phones, either new or second hand, while women in many cases receive their phones as a gift. Most young, single women in the focus groups in Cameroon, received their phones as gifts from their lovers. Other women, generally received their phones from a family member. Phones are donated as gifts without any particular conditions of usage.
What means offering you a phone or air time and telling you how to use it. We are not kids. If this happens, I will tell the person to take back the phone.
Foko Juliette, young woman in poor neighbourhood in Yaoundé, Cameroon.
Poor men prefer second hand handsets, while poor women prefer new handsets as they do not want to risk purchasing a stolen handset by accident. However, women in middle to high income neighbourhoods prefer new phones because of their reliability. In this social category, there is no noticeable gender gap as far as quality is concerned (old versus new); women and men equally prefer new to old phones. The divide surfaces when it comes to the type of phone however. For women the decision making process is driven by the ease of use of the phone: whether it is user friendly, for making and receiving calls. Most men tend to look for sophisticated features such as 3rd generation (3G), multimedia messaging service (MMS), general packet radio service (GPRS) and Internet as the phone has become a status symbol.
In rural areas, gender stereotypes observed in society, are reflected in mobile phone ownership. The majority of female owners received their phone as a gift from their family.
I can’t buy a new phone anymore. The last time I did, the phone didn’t last. With old ones, at least I am assured people have already tested it.
Ebolo David, a man in a rural area of Cameroon.
Men in middle to high income urban areas tend to own more than one mobile handset while in rural areas, owning one phone is enough. However, women think that owning two phones is cumbersome. The reason for having two mobiles is network reliability, mobile prices of different operators, interconnection costs and to take advantage of operator specials. In order to make sure you are reachable at any time, you need to subscribe to at least two operators.
In Ethiopia about half of the participants from low income male and female groups and all the participants from the rural male and female groups did not have mobile phones.
Those without mobile phones attributed this to lack of finance, to the irrelevance of mobile phones considering their employment situation or lack of mobility, or to the presence of other telephone alternatives. The excerpts below from focus group participants illustrate the reasons and dynamics that influence individuals’ decision to own a mobile phone or SIM in Ethiopia.
I want to have (a) mobile phone but I can’t afford it.Low income female focus group participant.
I am an old woman. What do I need (a) mobile for? Besides, I have a fixed phone at home.Low income female focus group participant.
I don’t have a mobile because I don’t find it necessary to have because I have a fixed phone where I work and which I can use to make and receive calls.
Low income male focus group participant.
1414
In Uganda among low and middle-income earners in the focus groups, men and women tended to have equal access to phones. Among people with low income levels, men and women appeared to be equally divided between those who bought brand-new handsets and those who bought second-hand ones. Some homes had mobiles which were only used by the husband. There were few instances where couples shared a mobile, and in instances where one partner had a phone the other partner had limited or controlled access to it. This could probably be explained by the private nature of mobile phones, which made most participants feel they needed to keep call information private. Instances of men putting restrictions on how females used phones they had bought for them occurred among both rural and urban dwellers, as well as among those with low levels of education and those who had reached higher levels of education, including tertiary. Where they existed, these restrictions were not necessarily spelt out by the buyer of the handset, but they expected the recipient to be aware of what not to use the phones for. In a number of cases the type of handsets that participants owned was related to levels of income and education, with those who had a higher level of income or education tending to have phones with greater functionality.
In South Africa, those women who did not have phones used public phones or more often received calls at their neighbours’ homes. The issue of privacy was raised with regard to public phones however. A woman from a rural focus group said:
Yes….but sometimes when you have R5 you would rather buy airtime because you want to discuss private matters which cannot be discussed on a public phone.
They would only use their neighbour’s mobile or public phone when really necessary, as they were aware their neighbour’s were equally poor or only marginally better off. Some phone owners charged those who used their phone between R5 and R7 a call.
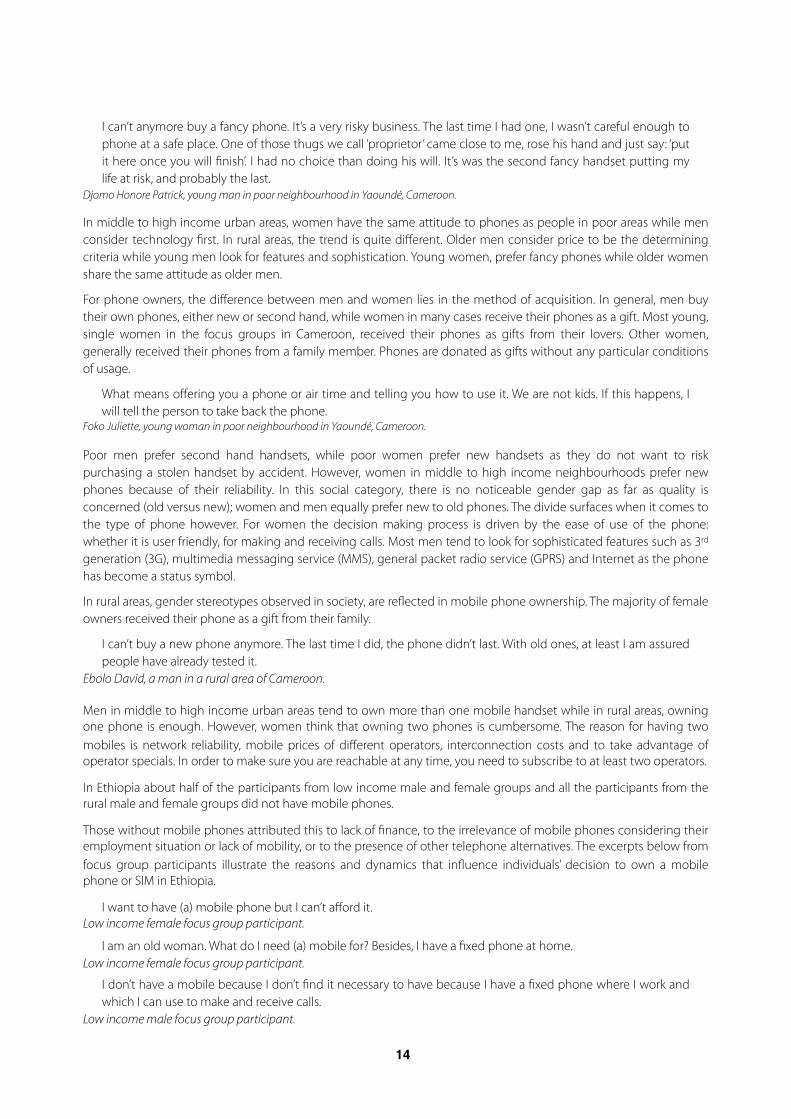
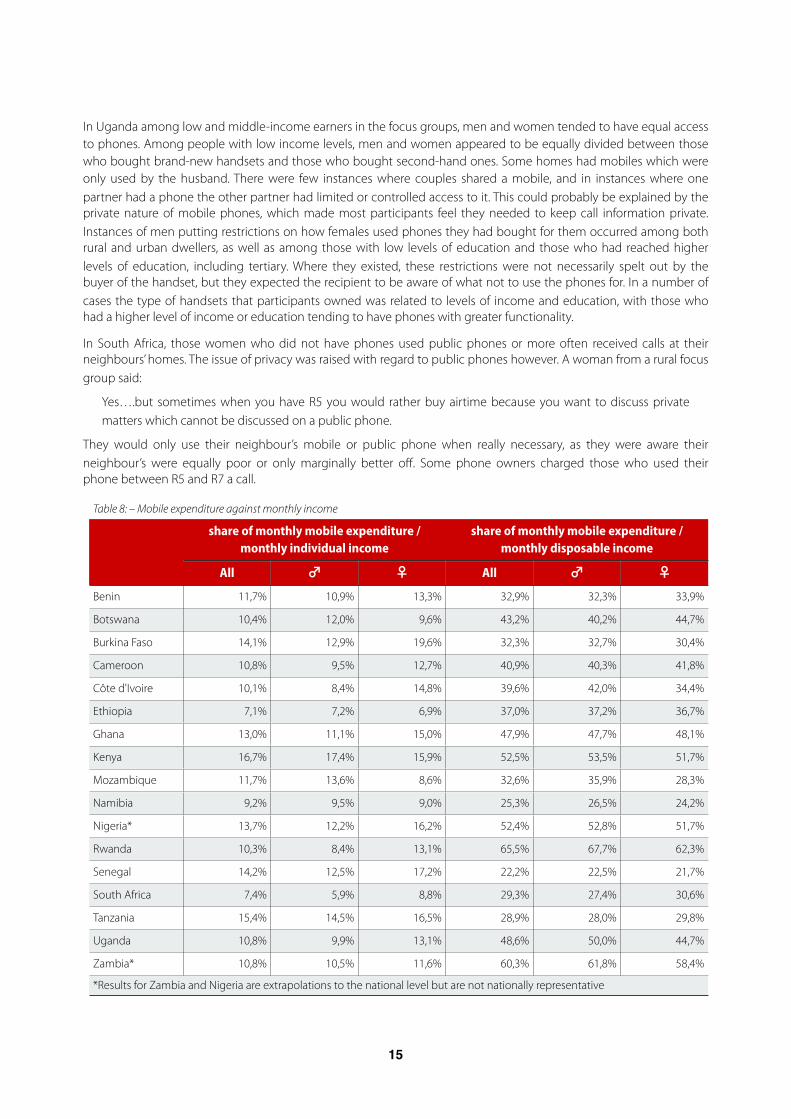
Table 8: – Mobile expenditure against monthly incomeTable 8: – Mobile expenditure against monthly incomeTable 8: – Mobile expenditure against monthly incomeTable 8: – Mobile expenditure against monthly incomeTable 8: – Mobile expenditure against monthly incomeTable 8: – Mobile expenditure against monthly incomeTable 8: – Mobile expenditure against monthly income
share of monthly mobile expenditure / monthly individual income
share of monthly mobile expenditure / monthly individual income
share of monthly mobile expenditure / monthly individual income
share of monthly mobile expenditure / monthly disposable income
share of monthly mobile expenditure / monthly disposable income
share of monthly mobile expenditure / monthly disposable income
All ♂ ♀ All ♂ ♀Benin 11,7% 10,9% 13,3% 32,9% 32,3% 33,9%
Botswana 10,4% 12,0% 9,6% 43,2% 40,2% 44,7%
Burkina Faso 14,1% 12,9% 19,6% 32,3% 32,7% 30,4%
Cameroon 10,8% 9,5% 12,7% 40,9% 40,3% 41,8%
Côte d'Ivoire 10,1% 8,4% 14,8% 39,6% 42,0% 34,4%
Ethiopia 7,1% 7,2% 6,9% 37,0% 37,2% 36,7%
Ghana 13,0% 11,1% 15,0% 47,9% 47,7% 48,1%
Kenya 16,7% 17,4% 15,9% 52,5% 53,5% 51,7%
Mozambique 11,7% 13,6% 8,6% 32,6% 35,9% 28,3%
Namibia 9,2% 9,5% 9,0% 25,3% 26,5% 24,2%
Nigeria* 13,7% 12,2% 16,2% 52,4% 52,8% 51,7%
Rwanda 10,3% 8,4% 13,1% 65,5% 67,7% 62,3%
Senegal 14,2% 12,5% 17,2% 22,2% 22,5% 21,7%
South Africa 7,4% 5,9% 8,8% 29,3% 27,4% 30,6%
Tanzania 15,4% 14,5% 16,5% 28,9% 28,0% 29,8%
Uganda 10,8% 9,9% 13,1% 48,6% 50,0% 44,7%
Zambia* 10,8% 10,5% 11,6% 60,3% 61,8% 58,4%
*Results for Zambia and Nigeria are extrapolations to the national level but are not nationally representative*Results for Zambia and Nigeria are extrapolations to the national level but are not nationally representative*Results for Zambia and Nigeria are extrapolations to the national level but are not nationally representative*Results for Zambia and Nigeria are extrapolations to the national level but are not nationally representative*Results for Zambia and Nigeria are extrapolations to the national level but are not nationally representative*Results for Zambia and Nigeria are extrapolations to the national level but are not nationally representative*Results for Zambia and Nigeria are extrapolations to the national level but are not nationally representative
15
In most of the countries surveyed, men spend more money than women on their mobile phones. Although the numbers suggest that in Tanzania, woman spend more than men, the difference is not statistically significant.
However, expenditure patterns are different when they are viewed as a percentage of monthly individual income. While the expenditure patterns above illustrated differences between genders, table 7 reveals that most women are spending a similar amount to men as a percentage of their monthly individual income, and hardly differ in the share of their monthly disposable income devoted to mobile expenditure. In Rwanda, Senegal and Tanzania, countries with very low (female) average income, women spent more of their monthly individual income on mobile phones than men. Interestingly, Ghana also falls into this group although it is at the top end of female income.
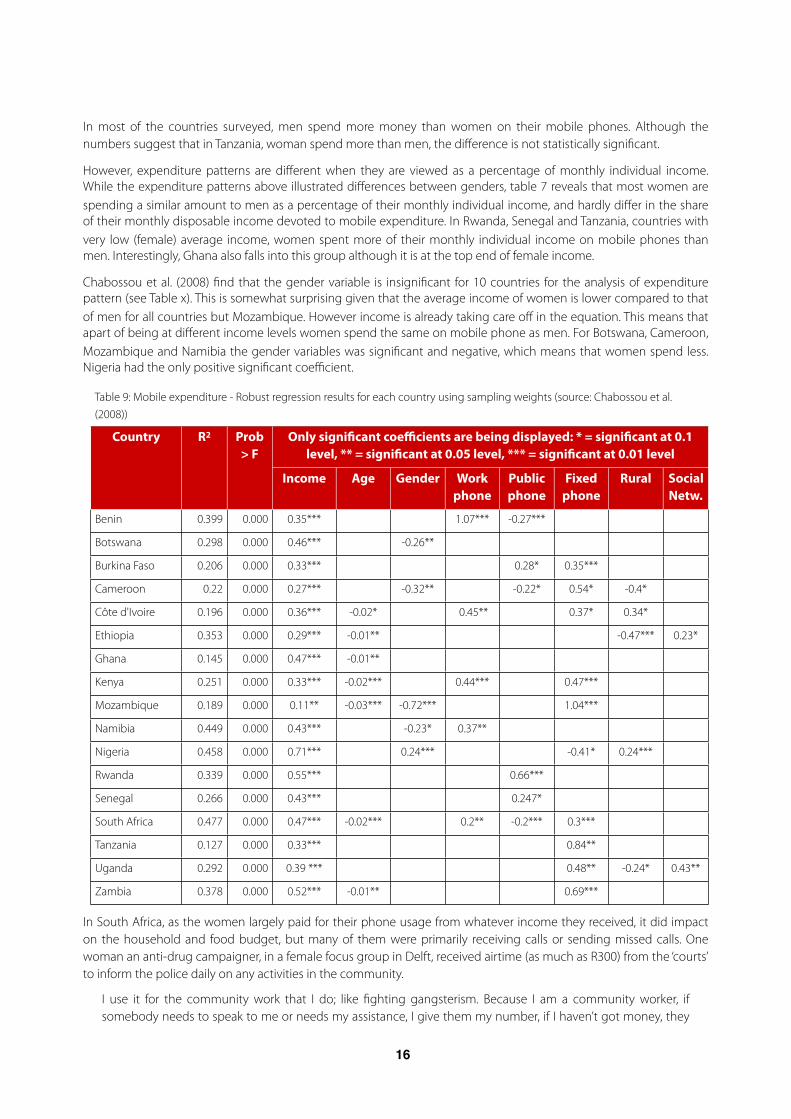
Chabossou et al. (2008) find that the gender variable is insignificant for 10 countries for the analysis of expenditure pattern (see Table x). This is somewhat surprising given that the average income of women is lower compared to that of men for all countries but Mozambique. However income is already taking care off in the equation. This means that apart of being at different income levels women spend the same on mobile phone as men. For Botswana, Cameroon, Mozambique and Namibia the gender variables was significant and negative, which means that women spend less. Nigeria had the only positive significant coefficient.
Table 9: Mobile expenditure - Robust regression results for each country using sampling weights (source: Chabossou et al. (2008))Table 9: Mobile expenditure - Robust regression results for each country using sampling weights (source: Chabossou et al. (2008))Table 9: Mobile expenditure - Robust regression results for each country using sampling weights (source: Chabossou et al. (2008))Table 9: Mobile expenditure - Robust regression results for each country using sampling weights (source: Chabossou et al. (2008))Table 9: Mobile expenditure - Robust regression results for each country using sampling weights (source: Chabossou et al. (2008))Table 9: Mobile expenditure - Robust regression results for each country using sampling weights (source: Chabossou et al. (2008))Table 9: Mobile expenditure - Robust regression results for each country using sampling weights (source: Chabossou et al. (2008))Table 9: Mobile expenditure - Robust regression results for each country using sampling weights (source: Chabossou et al. (2008))Table 9: Mobile expenditure - Robust regression results for each country using sampling weights (source: Chabossou et al. (2008))Table 9: Mobile expenditure - Robust regression results for each country using sampling weights (source: Chabossou et al. (2008))Table 9: Mobile expenditure - Robust regression results for each country using sampling weights (source: Chabossou et al. (2008))
Country R2 Prob > F
Only significant coefficients are being displayed: * = significant at 0.1 level, ** = significant at 0.05 level, *** = significant at 0.01 level
Only significant coefficients are being displayed: * = significant at 0.1 level, ** = significant at 0.05 level, *** = significant at 0.01 level
Only significant coefficients are being displayed: * = significant at 0.1 level, ** = significant at 0.05 level, *** = significant at 0.01 level
Only significant coefficients are being displayed: * = significant at 0.1 level, ** = significant at 0.05 level, *** = significant at 0.01 level
Only significant coefficients are being displayed: * = significant at 0.1 level, ** = significant at 0.05 level, *** = significant at 0.01 level
Only significant coefficients are being displayed: * = significant at 0.1 level, ** = significant at 0.05 level, *** = significant at 0.01 level
Only significant coefficients are being displayed: * = significant at 0.1 level, ** = significant at 0.05 level, *** = significant at 0.01 level
Only significant coefficients are being displayed: * = significant at 0.1 level, ** = significant at 0.05 level, *** = significant at 0.01 level
Country R2 Prob > F
Income Age Gender Work phone
Public phone
Fixed phone
Rural Social Netw.
Benin 0.399 0.000 0.35*** 1.07*** -0.27***
Botswana 0.298 0.000 0.46*** -0.26**
Burkina Faso 0.206 0.000 0.33*** 0.28* 0.35***
Cameroon 0.22 0.000 0.27*** -0.32** -0.22* 0.54* -0.4*
Côte d'Ivoire 0.196 0.000 0.36*** -0.02* 0.45** 0.37* 0.34*
Ethiopia 0.353 0.000 0.29*** -0.01** -0.47*** 0.23*
Ghana 0.145 0.000 0.47*** -0.01**
Kenya 0.251 0.000 0.33*** -0.02*** 0.44*** 0.47***
Mozambique 0.189 0.000 0.11** -0.03*** -0.72*** 1.04***
Namibia 0.449 0.000 0.43*** -0.23* 0.37**
Nigeria 0.458 0.000 0.71*** 0.24*** -0.41* 0.24***
Rwanda 0.339 0.000 0.55*** 0.66***
Senegal 0.266 0.000 0.43*** 0.247*
South Africa 0.477 0.000 0.47*** -0.02*** 0.2** -0.2*** 0.3***
Tanzania 0.127 0.000 0.33*** 0.84**
Uganda 0.292 0.000 0.39 *** 0.48** -0.24* 0.43**
Zambia 0.378 0.000 0.52*** -0.01** 0.69***
In South Africa, as the women largely paid for their phone usage from whatever income they received, it did impact on the household and food budget, but many of them were primarily receiving calls or sending missed calls. One woman an anti-drug campaigner, in a female focus group in Delft, received airtime (as much as R300) from the ‘courts’ to inform the police daily on any activities in the community.
I use it for the community work that I do; like fighting gangsterism. Because I am a community worker, if somebody needs to speak to me or needs my assistance, I give them my number, if I haven’t got money, they
1616
can call me; and I also use it to call emergency numbers, as I work with the police. So, if I have money I will buy airtime or else they would give me money for airtime… It is important for us to have cell phones and to be able to call the police. We cannot call Delft police; we need to call police outside our area, as the police in the area are corrupt…
The cost of calls limited phone usage for men and women. As a result many of the women were primarily receivers of calls, some of which they would initiate either with a missed call or a ‘please call me’. For a number of women this was their primary form of mobile communication. Generally they would call people whom they were confident would call back, such as more well-off family members. Sometimes they just hoped that people in a similar position would have airtime when they did not, and call them back. As women in the poor urban and rural groups were largely indigent only a few of them regularly received please call me messages from any particular group such as their children. In some instances they preferred to send please call me messages to older children who worked. Some women had younger children with phones, sometimes acquired illegally, but they were responsible for their own accounts. A woman who was at home with her children would get her grandparents to call her as they were pensioners and had some income.
Few men were primarily call receivers but all used missed call and please call me messages when they ran out of airtime. Those who perceived others, particularly family members to be better off or knew they had contracts would use these methods to contact family even if they had some airtime. They would contact their siblings, or children who were employed, in this manner. The responses they received varied but they were sufficiently positive for people to continue to pursue this option.
Despite the complaints about the high costs of calls, several of the male participants indicated they were spending more on the lottery than on communications. One participant indicated that he spent about R300 on the lottery as opposed to about R150 on his mobile phone. Both men and women were topping up their airtime regularly with small amounts rather than larger single amounts and did not always seem to keep a clear record of their accumulated expenditure.
Any control over the use of their phones and constraints on whom women called could not be well assessed in the rural and poor urban focus groups due to the preponderance of single women headed households. The absence of men in many households meant women acquired their phones themselves and determined their use largely on the basis of available funds, buying airtime in the smallest quantities available. There were only two women in the group with husbands, one with no phone at all and the other with both pre-paid fixed and mobile phones. All the women but the youngest one in the group had children. One of the young women had received her phone from her boyfriend who paid the account which she used very little as she generally sent him please call me messages if she wished to speak to him or generally he called her. Another woman had received her phone from her daughter. It was the second phone she had received from her daughter as her son had stolen the first one to buy ‘tik’, the local name for a widely used drug.
Most women said the primary reason for ‘needing’ a phone was for security. Even within their homes they were not safe and needed phones to contact family or friends in case of an incident. Although this was overwhelmingly given as the reason for having a phone, the focus group revealed that phones were primarily used for social calls. Usage was limited by the fact that few of the group members had regular incomes and most depended on the goodwill of others.
The men who had cell phones also prioritised security as the reason for having a phone but regarded it as more of a convenience and vital to other aspects of everyday life. They also pointed out that a phone could also make one a target of crime. One indicated that it was important to have a mobile phone to remain in touch with one’s family in an emergency or just to receive information timeously when at work, as they were often not given messages left for them with their supervisors using the company’s fixed line. The men who were self-employed used their mobile phones, all pre-paid, for work related matters. Depending on the nature of their communication they might make a call or meet someone face to face if phoning would not solve a problem. A fixed or mobile phone was seldom used for municipal or government enquiries as it was known that it would be too expensive considering the lack of responsiveness and inefficiency in government.
17
Although some of the men used SMSs and the children used Mix It, a low cost chat service, both men and women largely used their phones for voice calls. The older men in particular indicated their inability or desire to use their phone for anything other than basic voice calls. They were unable to check if their phones had been misused by family members and had to get their younger children to perform certain functions for them. None of them used their phones for email though some of the younger men, without phones were aware of this facility.
None of the women in the poor urban group used the phone for anything other than voice calls – not even for sending SMSs. Women were aware that SMSs were cheaper but did not see them as a substitute for voice calls. Some women are illiterate or the person they wanted to contact was illiterate:
…we know SMS is cheaper but now you must remember if you have to speak to your grandpa or if your grandpa phones, it’s a little different. He doesn’t know how to read the messages, and with a please call me; it’s just confusing to him.
In response to questions about their willingness to use their cellphones for banking, many seemed not to have banking accounts but even for those who did it seemed a strange concept. Some not only expressed distrust of the cellphone system for banking but also of the banking system itself, which they regarded as untrustworthy, making the combination an unlikely prospect. Some of the better off women said they might use it but saw it as too complicated. When it was pointed out that by definition it could not be more complicated than using a phone, they seemed interested. Others argued that even if they knew how to use their cell phones for banking, airtime was so expensive it would not be worthwhile. However, there are no banks in Delft and people have to pay about R10 to travel to a bank. They pointed out, however, that they usually combined other shopping or social activities with the trip to the bank.
Holding influencing factors constant no significant gender effect for mobile phone ownership can be found; meaning that women with similar income, education, employment status etc. will be as likely to have a mobile phone as men. However, these influencing factors differ for women and therefore mobile phone usage is not equally accessible. Even though men spend more on mobile phones in total, women spend as much relative to their monthly income, or in many cases even more than men on mobile phone usage.
InternetThe Research ICT Africa survey results show that Internet usage is not common in Africa. Only about 26% of the interviewees know what the Internet is and less than 10% use it. Table 7 lists the country and gender disaggregated results In South Africa, Senegal and Zambia almost every second person knows what the internet is. Even so, only 15% at most (in South Africa, Kenya) access the Internet, with twice as many men using it as women. In Mozambique, Rwanda, Uganda, Ethiopia and Tanzania less than 10% of people know what the Internet is and less than five percent use it. Accordingly, only a small share of men and women have an email address in those countries. For most of the countries, the numbers for Internet access and email usage are similar, indicating that almost everybody who uses the Internet has an email address.
Gender differences turn out to be statistically significant for almost all the countries where analyses were conducted, although difference effect sizes are small. More men than women claim to know what the Internet is, with Cameroon being the only exception. In Cameroon significantly more women than men know what the Internet is and there is equity in email and Internet usage. The numbers for Rwanda and Zambia do not reach a level of statistical significance. As expected, however, in most countries men are more likely to use the Internet or have an email address. Interestingly, Tanzania and Rwanda show reverse patterns, although with only slightly more women than men using the Internet and generally very low Internet usage.
Only a minor share of about 8% of the participants in the RIA survey claimed to use the Internet, therefore, the following results on different aspects of Internet usage will not be reported separately for each country. No country specific conclusions can be drawn, however, the results still point out overall trends. As table 8 shows, both women and men with email addresses use email mainly for social communication with friends and family. Although significantly more in the case of men than women, almost every second person with an email address also uses email for communicating with colleagues or for work purposes, with every fifth man using it for business. There is parity in the proportion of men and women who claimed to use email for communication with fellow students and for study
1818
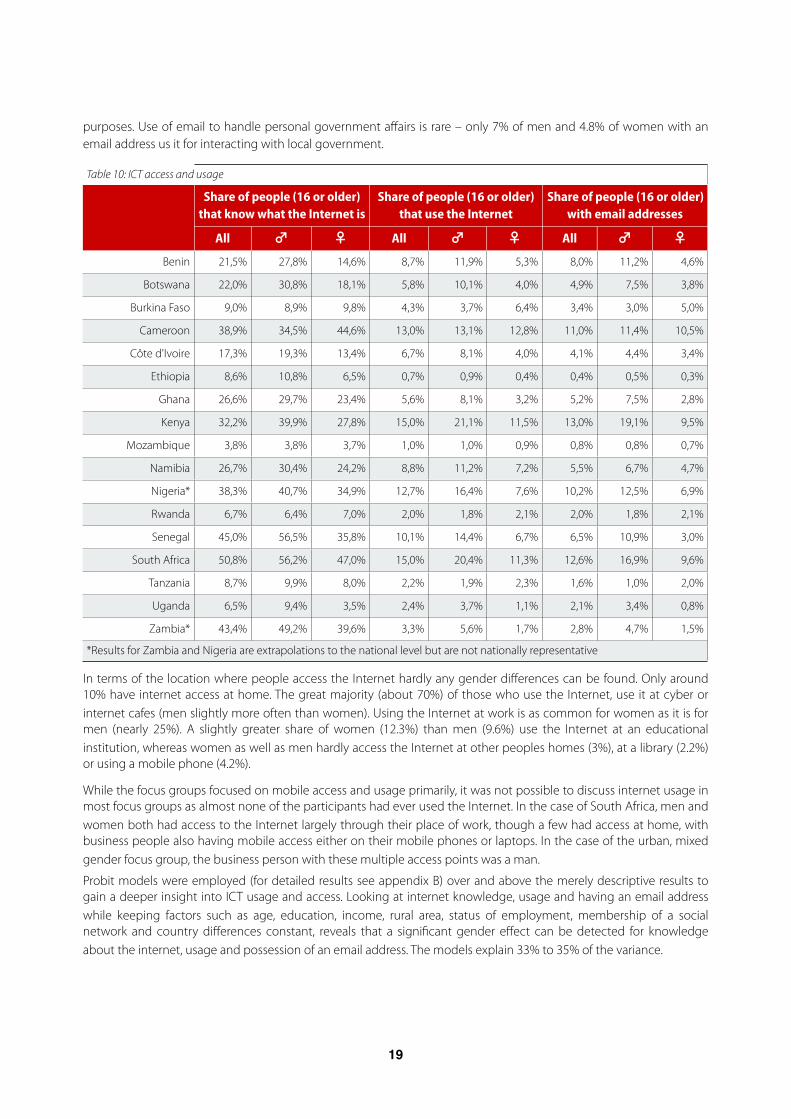
purposes. Use of email to handle personal government affairs is rare – only 7% of men and 4.8% of women with an email address us it for interacting with local government.
Table 10: ICT access and usageTable 10: ICT access and usageTable 10: ICT access and usageTable 10: ICT access and usageTable 10: ICT access and usageTable 10: ICT access and usageTable 10: ICT access and usageTable 10: ICT access and usageTable 10: ICT access and usageTable 10: ICT access and usage
Share of people (16 or older) that know what the Internet isShare of people (16 or older)
that know what the Internet isShare of people (16 or older)
that know what the Internet isShare of people (16 or older)
that use the InternetShare of people (16 or older)
that use the InternetShare of people (16 or older)
that use the InternetShare of people (16 or older)
with email addressesShare of people (16 or older)
with email addressesShare of people (16 or older)
with email addresses
All ♂ ♀ All ♂ ♀ All ♂ ♀Benin 21,5% 27,8% 14,6% 8,7% 11,9% 5,3% 8,0% 11,2% 4,6%
Botswana 22,0% 30,8% 18,1% 5,8% 10,1% 4,0% 4,9% 7,5% 3,8%
Burkina Faso 9,0% 8,9% 9,8% 4,3% 3,7% 6,4% 3,4% 3,0% 5,0%
Cameroon 38,9% 34,5% 44,6% 13,0% 13,1% 12,8% 11,0% 11,4% 10,5%
Côte d'Ivoire 17,3% 19,3% 13,4% 6,7% 8,1% 4,0% 4,1% 4,4% 3,4%
Ethiopia 8,6% 10,8% 6,5% 0,7% 0,9% 0,4% 0,4% 0,5% 0,3%
Ghana 26,6% 29,7% 23,4% 5,6% 8,1% 3,2% 5,2% 7,5% 2,8%
Kenya 32,2% 39,9% 27,8% 15,0% 21,1% 11,5% 13,0% 19,1% 9,5%
Mozambique 3,8% 3,8% 3,7% 1,0% 1,0% 0,9% 0,8% 0,8% 0,7%
Namibia 26,7% 30,4% 24,2% 8,8% 11,2% 7,2% 5,5% 6,7% 4,7%
Nigeria* 38,3% 40,7% 34,9% 12,7% 16,4% 7,6% 10,2% 12,5% 6,9%
Rwanda 6,7% 6,4% 7,0% 2,0% 1,8% 2,1% 2,0% 1,8% 2,1%
Senegal 45,0% 56,5% 35,8% 10,1% 14,4% 6,7% 6,5% 10,9% 3,0%
South Africa 50,8% 56,2% 47,0% 15,0% 20,4% 11,3% 12,6% 16,9% 9,6%
Tanzania 8,7% 9,9% 8,0% 2,2% 1,9% 2,3% 1,6% 1,0% 2,0%
Uganda 6,5% 9,4% 3,5% 2,4% 3,7% 1,1% 2,1% 3,4% 0,8%
Zambia* 43,4% 49,2% 39,6% 3,3% 5,6% 1,7% 2,8% 4,7% 1,5%
*Results for Zambia and Nigeria are extrapolations to the national level but are not nationally representative*Results for Zambia and Nigeria are extrapolations to the national level but are not nationally representative*Results for Zambia and Nigeria are extrapolations to the national level but are not nationally representative*Results for Zambia and Nigeria are extrapolations to the national level but are not nationally representative*Results for Zambia and Nigeria are extrapolations to the national level but are not nationally representative*Results for Zambia and Nigeria are extrapolations to the national level but are not nationally representative*Results for Zambia and Nigeria are extrapolations to the national level but are not nationally representative*Results for Zambia and Nigeria are extrapolations to the national level but are not nationally representative*Results for Zambia and Nigeria are extrapolations to the national level but are not nationally representative*Results for Zambia and Nigeria are extrapolations to the national level but are not nationally representative
In terms of the location where people access the Internet hardly any gender differences can be found. Only around 10% have internet access at home. The great majority (about 70%) of those who use the Internet, use it at cyber or internet cafes (men slightly more often than women). Using the Internet at work is as common for women as it is for men (nearly 25%). A slightly greater share of women (12.3%) than men (9.6%) use the Internet at an educational institution, whereas women as well as men hardly access the Internet at other peoples homes (3%), at a library (2.2%) or using a mobile phone (4.2%).
While the focus groups focused on mobile access and usage primarily, it was not possible to discuss internet usage in most focus groups as almost none of the participants had ever used the Internet. In the case of South Africa, men and women both had access to the Internet largely through their place of work, though a few had access at home, with business people also having mobile access either on their mobile phones or laptops. In the case of the urban, mixed gender focus group, the business person with these multiple access points was a man.
Probit models were employed (for detailed results see appendix B) over and above the merely descriptive results to gain a deeper insight into ICT usage and access. Looking at internet knowledge, usage and having an email address while keeping factors such as age, education, income, rural area, status of employment, membership of a social network and country differences constant, reveals that a significant gender effect can be detected for knowledge about the internet, usage and possession of an email address. The models explain 33% to 35% of the variance.
19
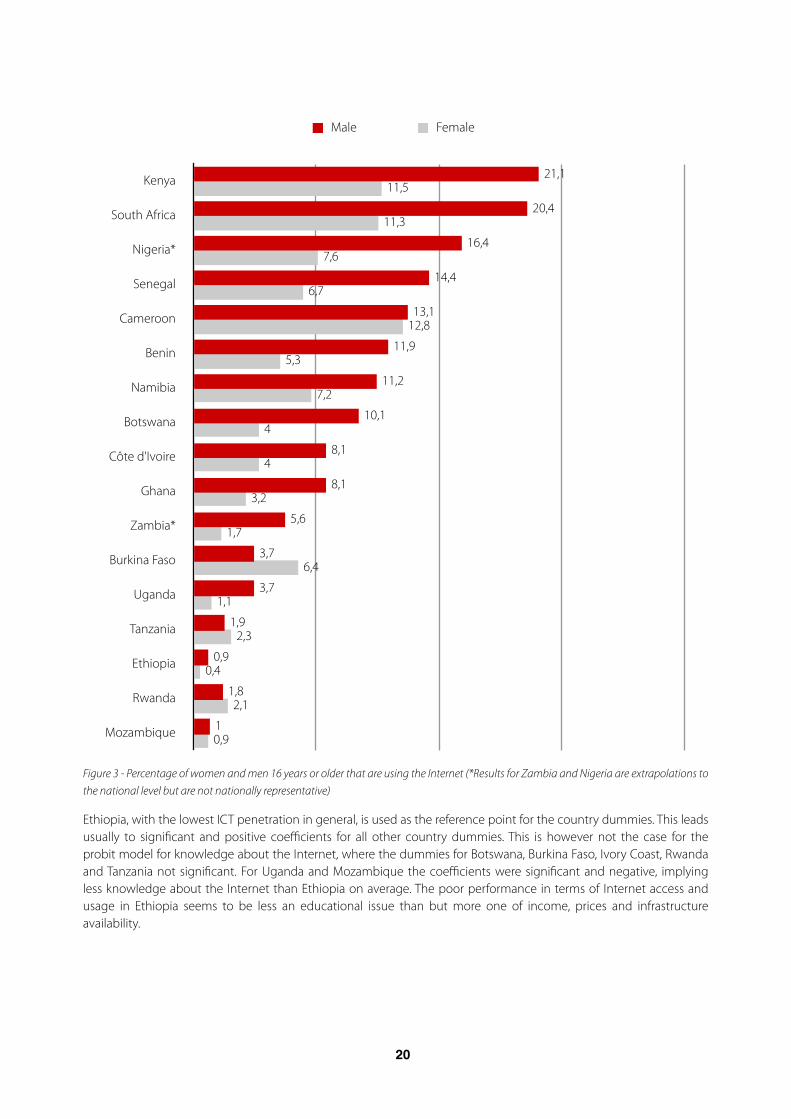
Figure 3 - Percentage of women and men 16 years or older that are using the Internet (*Results for Zambia and Nigeria are extrapolations to the national level but are not nationally representative)
Ethiopia, with the lowest ICT penetration in general, is used as the reference point for the country dummies. This leads usually to significant and positive coefficients for all other country dummies. This is however not the case for the probit model for knowledge about the Internet, where the dummies for Botswana, Burkina Faso, Ivory Coast, Rwanda and Tanzania not significant. For Uganda and Mozambique the coefficients were significant and negative, implying less knowledge about the Internet than Ethiopia on average. The poor performance in terms of Internet access and usage in Ethiopia seems to be less an educational issue than but more one of income, prices and infrastructure availability.
Male Female
Kenya
South Africa
Nigeria*
Senegal
Cameroon
Benin
Namibia
Botswana
Côte d'Ivoire
Ghana
Zambia*
Burkina Faso
Uganda
Tanzania
Ethiopia
Rwanda
Mozambique 0,9
2,1
0,4
2,3
1,1
6,4
1,7
3,2
4
4
7,2
5,3
12,8
6,7
7,6
11,3
11,5
1
1,8
0,9
1,9
3,7
3,7
5,6
8,1
8,1
10,1
11,2
11,9
13,1
14,4
16,4
20,4
21,1
2020

Figure 4: Purpose of email use in Percent of 16+ across 17 Countries
Figure 5: Share of 16+ (of those who use the internet) that use it (across 17 Countries)
Being female reduced the probability for knowing what the Internet is, using the Internet and having an email address significantly. Being full-time employed or being a student are better predictors for Internet knowledge and use than income14 , which was not significant for Internet use and having an email address. This supports the theory that most Africans access the Internet through school, work or public access and less through private household level access due to income constraints and cost of access.
Age reduces the probability of knowledge and use of the Internet, while being part of a sports club increases it. This points towards the youth a key adopters but may also indicate sport as a key driver. The Internet is the key information source when it comes to international spots and foreign leagues.
When splitting the analysis and running the models for rural and urban areas separately, gender becomes insignificant for predicting knowing what the Internet is for rural areas. For urban areas gender remains significant and women are less likely to know what the Internet is. Internet use and having an email address could not be run separately due to the limited use in rural areas. This indicates that gender differences only emerge beyond a certain income and general technology access threshold.
Male Female
socially communicate with friends & family
communicate with colleagues for work purposes
communicate with fellow students for study purposes
other
business purposes
interacting with local government 6%
13%
21%
24%
35%
76%
6%
16%
25%
26%
43%
71%
Male Female
Internet Café
work
educational institution
home
using a mobile phone
another persons home
library 3%
3%
5%
9%
13%
18%
71%
1%
2%
4%
8%
11%
15%
76%
21
14 Dropping the employment status variables would lead to income entering the model with a positive significant coefficient.
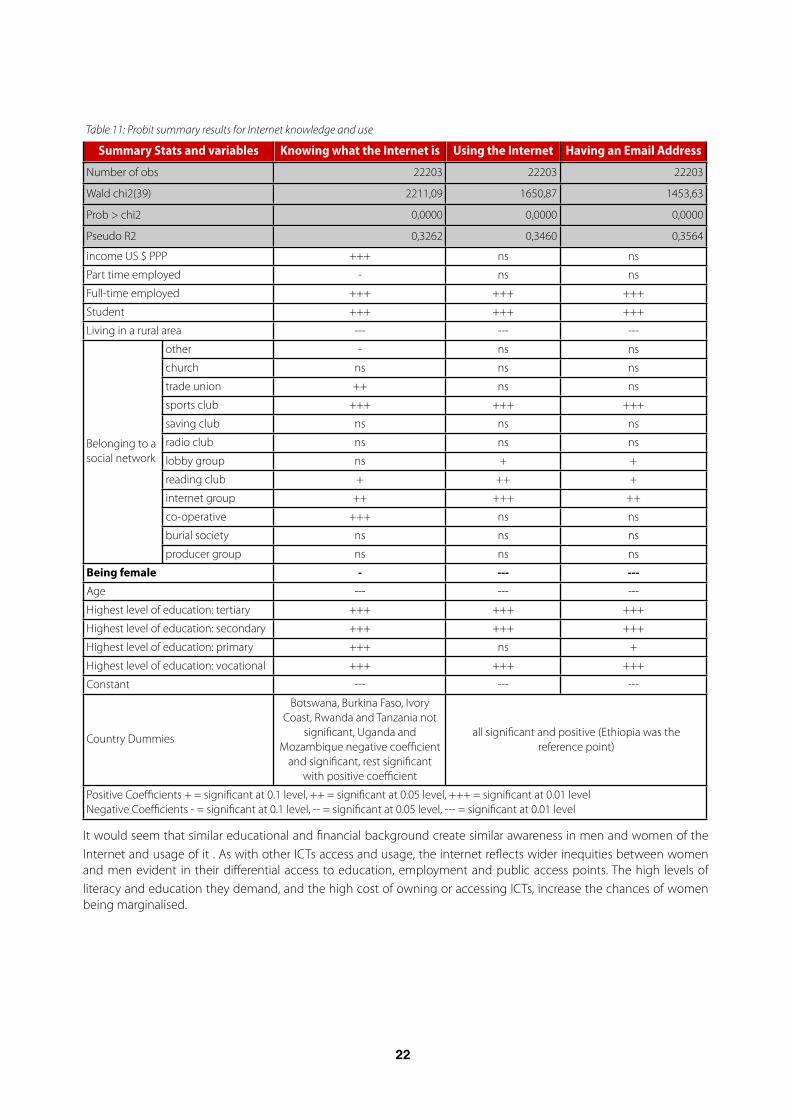
Table 11: Probit summary results for Internet knowledge and useTable 11: Probit summary results for Internet knowledge and useTable 11: Probit summary results for Internet knowledge and useTable 11: Probit summary results for Internet knowledge and useTable 11: Probit summary results for Internet knowledge and use
Summary Stats and variablesSummary Stats and variables Knowing what the Internet is Using the Internet Having an Email Address
Number of obsNumber of obs 22203 22203 22203
Wald chi2(39)Wald chi2(39) 2211,09 1650,87 1453,63
Prob > chi2Prob > chi2 0,0000 0,0000 0,0000
Pseudo R2Pseudo R2 0,3262 0,3460 0,3564
income US $ PPPincome US $ PPP +++ ns ns
Part time employedPart time employed - ns ns
Full-time employedFull-time employed +++ +++ +++
StudentStudent +++ +++ +++
Living in a rural areaLiving in a rural area --- --- ---
Belonging to a social network
other - ns ns
Belonging to a social network
church ns ns ns
Belonging to a social network
trade union ++ ns ns
Belonging to a social network
sports club +++ +++ +++
Belonging to a social network
saving club ns ns ns
Belonging to a social network
radio club ns ns nsBelonging to a social network lobby group ns + +Belonging to a social network
reading club + ++ +
Belonging to a social network
internet group ++ +++ ++
Belonging to a social network
co-operative +++ ns ns
Belonging to a social network
burial society ns ns ns
Belonging to a social network
producer group ns ns ns
Being femaleBeing female - --- ---
AgeAge --- --- ---
Highest level of education: tertiaryHighest level of education: tertiary +++ +++ +++
Highest level of education: secondaryHighest level of education: secondary +++ +++ +++
Highest level of education: primaryHighest level of education: primary +++ ns +
Highest level of education: vocationalHighest level of education: vocational +++ +++ +++
ConstantConstant --- --- ---
Country DummiesCountry Dummies
Botswana, Burkina Faso, Ivory Coast, Rwanda and Tanzania not
significant, Uganda and Mozambique negative coefficient
and significant, rest significant with positive coefficient
all significant and positive (Ethiopia was the reference point)
all significant and positive (Ethiopia was the reference point)
Positive Coefficients + = significant at 0.1 level, ++ = significant at 0.05 level, +++ = significant at 0.01 levelNegative Coefficients - = significant at 0.1 level, -- = significant at 0.05 level, --- = significant at 0.01 levelPositive Coefficients + = significant at 0.1 level, ++ = significant at 0.05 level, +++ = significant at 0.01 levelNegative Coefficients - = significant at 0.1 level, -- = significant at 0.05 level, --- = significant at 0.01 levelPositive Coefficients + = significant at 0.1 level, ++ = significant at 0.05 level, +++ = significant at 0.01 levelNegative Coefficients - = significant at 0.1 level, -- = significant at 0.05 level, --- = significant at 0.01 levelPositive Coefficients + = significant at 0.1 level, ++ = significant at 0.05 level, +++ = significant at 0.01 levelNegative Coefficients - = significant at 0.1 level, -- = significant at 0.05 level, --- = significant at 0.01 levelPositive Coefficients + = significant at 0.1 level, ++ = significant at 0.05 level, +++ = significant at 0.01 levelNegative Coefficients - = significant at 0.1 level, -- = significant at 0.05 level, --- = significant at 0.01 level
It would seem that similar educational and financial background create similar awareness in men and women of the Internet and usage of it . As with other ICTs access and usage, the internet reflects wider inequities between women and men evident in their differential access to education, employment and public access points. The high levels of literacy and education they demand, and the high cost of owning or accessing ICTs, increase the chances of women being marginalised.
2222
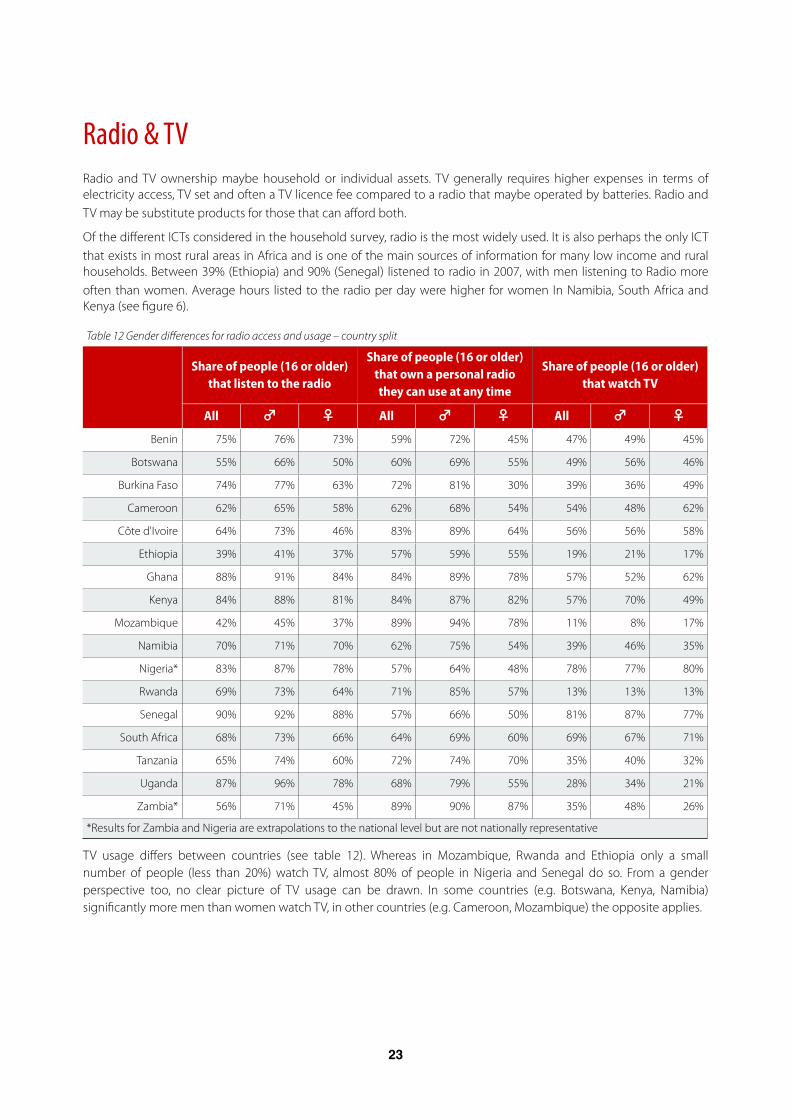
Radio & TVRadio and TV ownership maybe household or individual assets. TV generally requires higher expenses in terms of electricity access, TV set and often a TV licence fee compared to a radio that maybe operated by batteries. Radio and TV may be substitute products for those that can afford both.
Of the different ICTs considered in the household survey, radio is the most widely used. It is also perhaps the only ICT that exists in most rural areas in Africa and is one of the main sources of information for many low income and rural households. Between 39% (Ethiopia) and 90% (Senegal) listened to radio in 2007, with men listening to Radio more often than women. Average hours listed to the radio per day were higher for women In Namibia, South Africa and Kenya (see figure 6).
Table 12 Gender differences for radio access and usage – country splitTable 12 Gender differences for radio access and usage – country splitTable 12 Gender differences for radio access and usage – country splitTable 12 Gender differences for radio access and usage – country splitTable 12 Gender differences for radio access and usage – country splitTable 12 Gender differences for radio access and usage – country splitTable 12 Gender differences for radio access and usage – country splitTable 12 Gender differences for radio access and usage – country splitTable 12 Gender differences for radio access and usage – country splitTable 12 Gender differences for radio access and usage – country split
Share of people (16 or older) that listen to the radio
Share of people (16 or older) that listen to the radio
Share of people (16 or older) that listen to the radio
Share of people (16 or older) that own a personal radio they can use at any time
Share of people (16 or older) that own a personal radio they can use at any time
Share of people (16 or older) that own a personal radio they can use at any time
Share of people (16 or older) that watch TV
Share of people (16 or older) that watch TV
Share of people (16 or older) that watch TV
All ♂ ♀ All ♂ ♀ All ♂ ♀Benin 75% 76% 73% 59% 72% 45% 47% 49% 45%
Botswana 55% 66% 50% 60% 69% 55% 49% 56% 46%
Burkina Faso 74% 77% 63% 72% 81% 30% 39% 36% 49%
Cameroon 62% 65% 58% 62% 68% 54% 54% 48% 62%
Côte d'Ivoire 64% 73% 46% 83% 89% 64% 56% 56% 58%
Ethiopia 39% 41% 37% 57% 59% 55% 19% 21% 17%
Ghana 88% 91% 84% 84% 89% 78% 57% 52% 62%
Kenya 84% 88% 81% 84% 87% 82% 57% 70% 49%
Mozambique 42% 45% 37% 89% 94% 78% 11% 8% 17%
Namibia 70% 71% 70% 62% 75% 54% 39% 46% 35%
Nigeria* 83% 87% 78% 57% 64% 48% 78% 77% 80%
Rwanda 69% 73% 64% 71% 85% 57% 13% 13% 13%
Senegal 90% 92% 88% 57% 66% 50% 81% 87% 77%
South Africa 68% 73% 66% 64% 69% 60% 69% 67% 71%
Tanzania 65% 74% 60% 72% 74% 70% 35% 40% 32%
Uganda 87% 96% 78% 68% 79% 55% 28% 34% 21%
Zambia* 56% 71% 45% 89% 90% 87% 35% 48% 26%
*Results for Zambia and Nigeria are extrapolations to the national level but are not nationally representative*Results for Zambia and Nigeria are extrapolations to the national level but are not nationally representative*Results for Zambia and Nigeria are extrapolations to the national level but are not nationally representative*Results for Zambia and Nigeria are extrapolations to the national level but are not nationally representative*Results for Zambia and Nigeria are extrapolations to the national level but are not nationally representative*Results for Zambia and Nigeria are extrapolations to the national level but are not nationally representative*Results for Zambia and Nigeria are extrapolations to the national level but are not nationally representative*Results for Zambia and Nigeria are extrapolations to the national level but are not nationally representative*Results for Zambia and Nigeria are extrapolations to the national level but are not nationally representative*Results for Zambia and Nigeria are extrapolations to the national level but are not nationally representative
TV usage differs between countries (see table 12). Whereas in Mozambique, Rwanda and Ethiopia only a small number of people (less than 20%) watch TV, almost 80% of people in Nigeria and Senegal do so. From a gender perspective too, no clear picture of TV usage can be drawn. In some countries (e.g. Botswana, Kenya, Namibia) significantly more men than women watch TV, in other countries (e.g. Cameroon, Mozambique) the opposite applies.
23
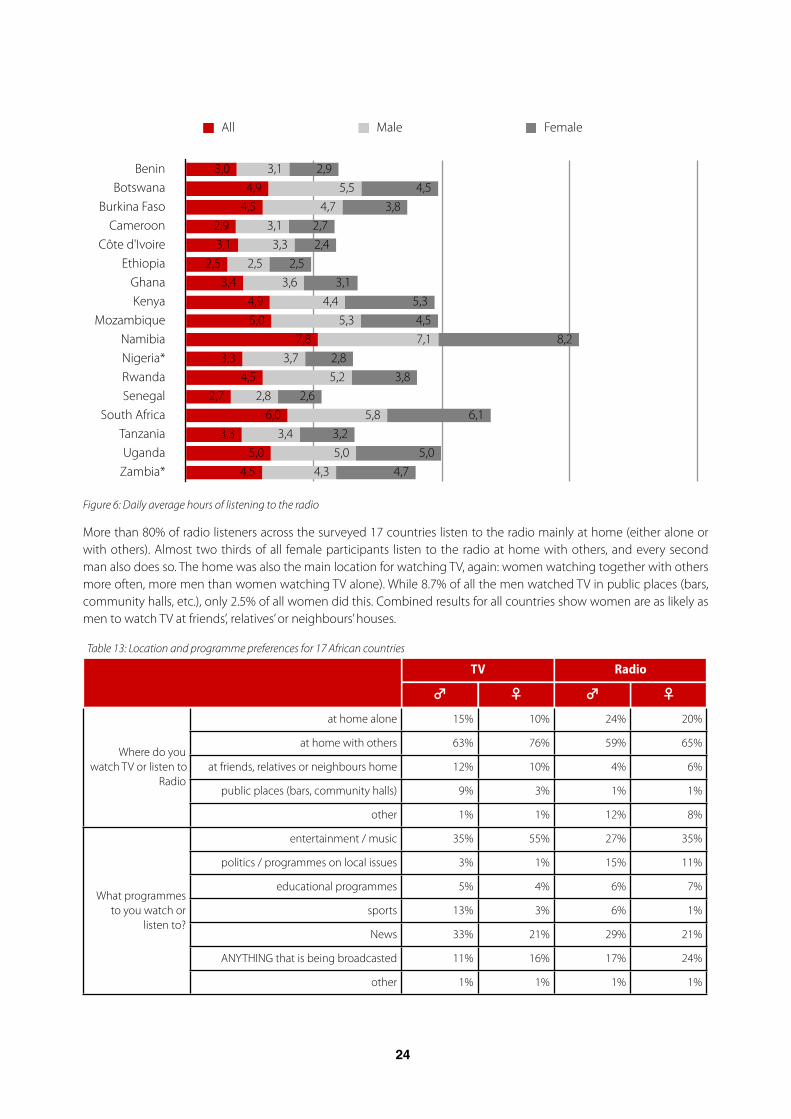
Figure 6: Daily average hours of listening to the radio
More than 80% of radio listeners across the surveyed 17 countries listen to the radio mainly at home (either alone or with others). Almost two thirds of all female participants listen to the radio at home with others, and every second man also does so. The home was also the main location for watching TV, again: women watching together with others more often, more men than women watching TV alone). While 8.7% of all the men watched TV in public places (bars, community halls, etc.), only 2.5% of all women did this. Combined results for all countries show women are as likely as men to watch TV at friends’, relatives’ or neighbours’ houses.
Table 13: Location and programme preferences for 17 African countriesTable 13: Location and programme preferences for 17 African countriesTable 13: Location and programme preferences for 17 African countriesTable 13: Location and programme preferences for 17 African countriesTable 13: Location and programme preferences for 17 African countriesTable 13: Location and programme preferences for 17 African countries
TVTV RadioRadio
♂ ♀ ♂ ♀
Where do you watch TV or listen to
Radio
at home alone 15% 10% 24% 20%
Where do you watch TV or listen to
Radio
at home with others 63% 76% 59% 65%Where do you
watch TV or listen to Radio
at friends, relatives or neighbours home 12% 10% 4% 6%Where do you
watch TV or listen to Radio
public places (bars, community halls) 9% 3% 1% 1%
Where do you watch TV or listen to
Radio
other 1% 1% 12% 8%
What programmes to you watch or
listen to?
entertainment / music 35% 55% 27% 35%
What programmes to you watch or
listen to?
politics / programmes on local issues 3% 1% 15% 11%
What programmes to you watch or
listen to?
educational programmes 5% 4% 6% 7%What programmes
to you watch or listen to?
sports 13% 3% 6% 1%What programmes
to you watch or listen to?
News 33% 21% 29% 21%
What programmes to you watch or
listen to?
ANYTHING that is being broadcasted 11% 16% 17% 24%
What programmes to you watch or
listen to?
other 1% 1% 1% 1%
All Male Female
Benin Botswana
Burkina Faso Cameroon
Côte d'Ivoire Ethiopia
Ghana Kenya
Mozambique Namibia Nigeria* Rwanda Senegal
South Africa Tanzania Uganda
Zambia* 4,75,0
3,26,1
2,63,8
2,88,2
4,55,3
3,12,5
2,42,7
3,84,5
2,9
4,35,0
3,45,8
2,85,2
3,77,1
5,34,4
3,62,5
3,33,1
4,75,5
3,1
4,55,0
3,36,0
2,74,5
3,37,8
5,04,9
3,42,5
3,12,9
4,54,9
3,0
2424
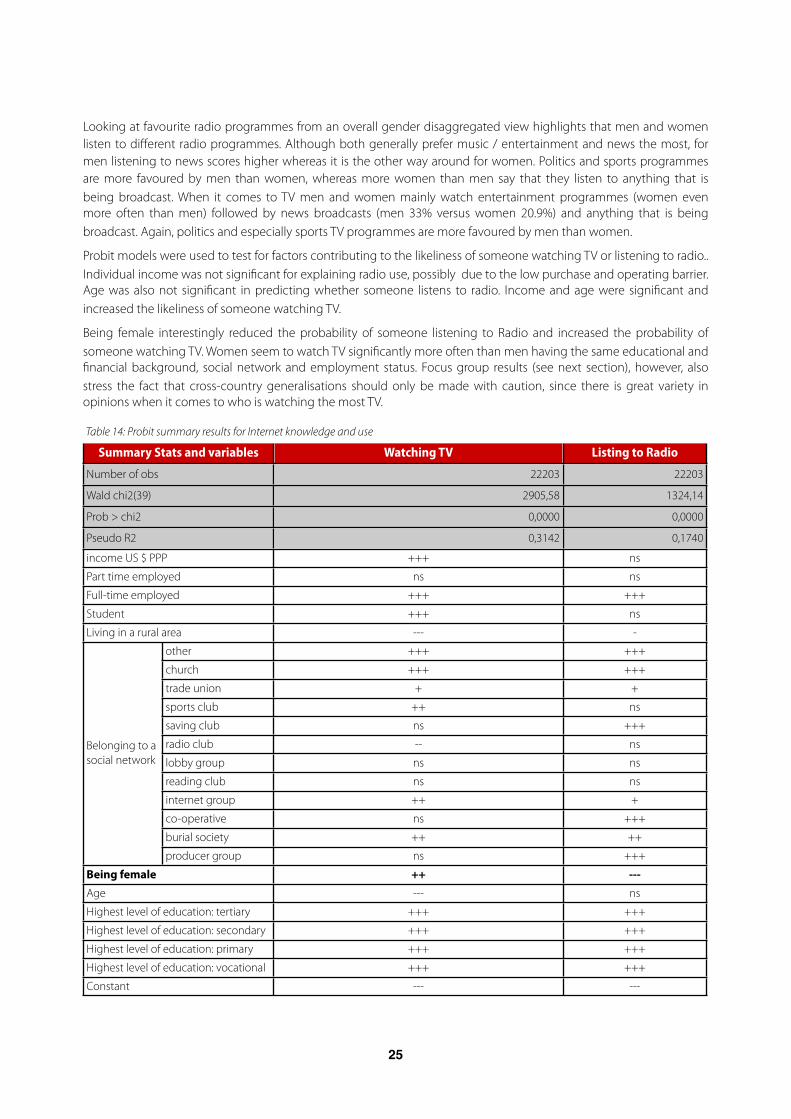
Looking at favourite radio programmes from an overall gender disaggregated view highlights that men and women listen to different radio programmes. Although both generally prefer music / entertainment and news the most, for men listening to news scores higher whereas it is the other way around for women. Politics and sports programmes are more favoured by men than women, whereas more women than men say that they listen to anything that is being broadcast. When it comes to TV men and women mainly watch entertainment programmes (women even more often than men) followed by news broadcasts (men 33% versus women 20.9%) and anything that is being broadcast. Again, politics and especially sports TV programmes are more favoured by men than women.
Probit models were used to test for factors contributing to the likeliness of someone watching TV or listening to radio.. Individual income was not significant for explaining radio use, possibly due to the low purchase and operating barrier. Age was also not significant in predicting whether someone listens to radio. Income and age were significant and increased the likeliness of someone watching TV.
Being female interestingly reduced the probability of someone listening to Radio and increased the probability of someone watching TV. Women seem to watch TV significantly more often than men having the same educational and financial background, social network and employment status. Focus group results (see next section), however, also stress the fact that cross-country generalisations should only be made with caution, since there is great variety in opinions when it comes to who is watching the most TV.
Table 14: Probit summary results for Internet knowledge and useTable 14: Probit summary results for Internet knowledge and useTable 14: Probit summary results for Internet knowledge and useTable 14: Probit summary results for Internet knowledge and use
Summary Stats and variablesSummary Stats and variables Watching TV Listing to Radio
Number of obsNumber of obs 22203 22203
Wald chi2(39)Wald chi2(39) 2905,58 1324,14
Prob > chi2Prob > chi2 0,0000 0,0000
Pseudo R2Pseudo R2 0,3142 0,1740
income US $ PPPincome US $ PPP +++ ns
Part time employedPart time employed ns ns
Full-time employedFull-time employed +++ +++
StudentStudent +++ ns
Living in a rural areaLiving in a rural area --- -
Belonging to a social network
other +++ +++
Belonging to a social network
church +++ +++
Belonging to a social network
trade union + +
Belonging to a social network
sports club ++ ns
Belonging to a social network
saving club ns +++
Belonging to a social network
radio club -- nsBelonging to a social network lobby group ns nsBelonging to a social network
reading club ns ns
Belonging to a social network
internet group ++ +
Belonging to a social network
co-operative ns +++
Belonging to a social network
burial society ++ ++
Belonging to a social network
producer group ns +++
Being femaleBeing female ++ ---
AgeAge --- ns
Highest level of education: tertiaryHighest level of education: tertiary +++ +++
Highest level of education: secondaryHighest level of education: secondary +++ +++
Highest level of education: primaryHighest level of education: primary +++ +++
Highest level of education: vocationalHighest level of education: vocational +++ +++
ConstantConstant --- ---
25
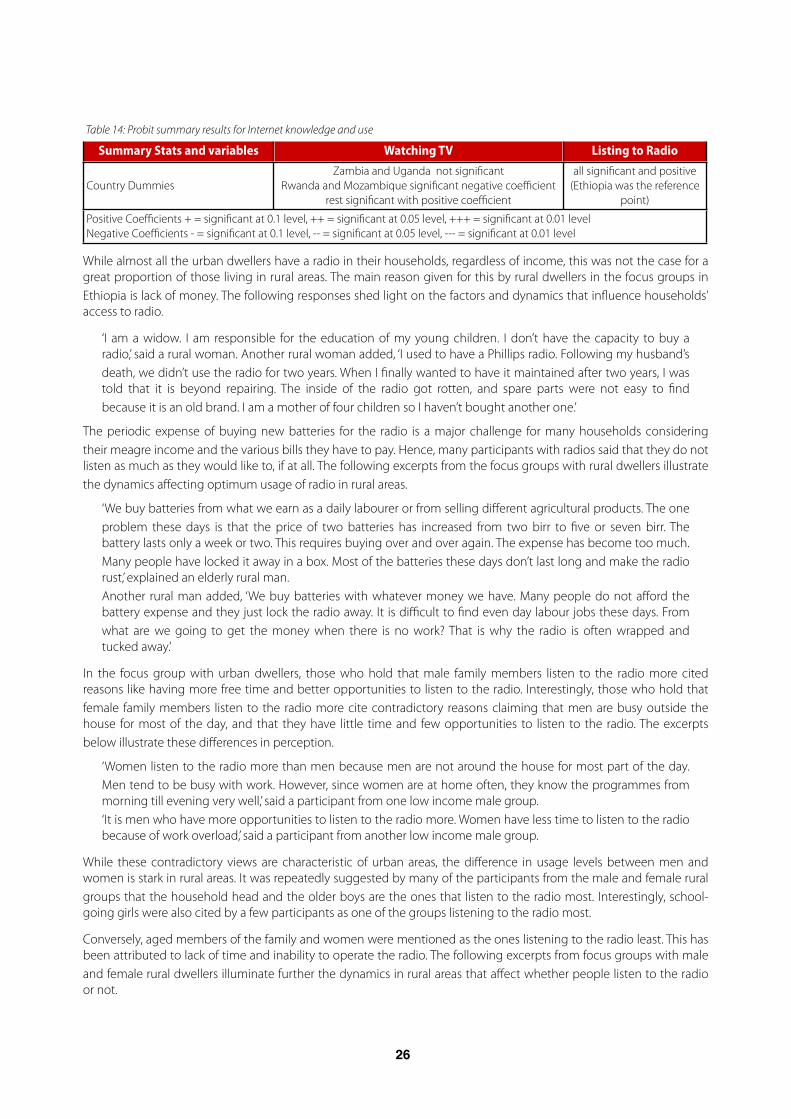
Table 14: Probit summary results for Internet knowledge and useTable 14: Probit summary results for Internet knowledge and useTable 14: Probit summary results for Internet knowledge and useTable 14: Probit summary results for Internet knowledge and use
Summary Stats and variablesSummary Stats and variables Watching TV Listing to Radio
Country DummiesCountry DummiesZambia and Uganda not significant
Rwanda and Mozambique significant negative coefficientrest significant with positive coefficient
all significant and positive (Ethiopia was the reference
point)
Positive Coefficients + = significant at 0.1 level, ++ = significant at 0.05 level, +++ = significant at 0.01 levelNegative Coefficients - = significant at 0.1 level, -- = significant at 0.05 level, --- = significant at 0.01 levelPositive Coefficients + = significant at 0.1 level, ++ = significant at 0.05 level, +++ = significant at 0.01 levelNegative Coefficients - = significant at 0.1 level, -- = significant at 0.05 level, --- = significant at 0.01 levelPositive Coefficients + = significant at 0.1 level, ++ = significant at 0.05 level, +++ = significant at 0.01 levelNegative Coefficients - = significant at 0.1 level, -- = significant at 0.05 level, --- = significant at 0.01 levelPositive Coefficients + = significant at 0.1 level, ++ = significant at 0.05 level, +++ = significant at 0.01 levelNegative Coefficients - = significant at 0.1 level, -- = significant at 0.05 level, --- = significant at 0.01 level
While almost all the urban dwellers have a radio in their households, regardless of income, this was not the case for a great proportion of those living in rural areas. The main reason given for this by rural dwellers in the focus groups in Ethiopia is lack of money. The following responses shed light on the factors and dynamics that influence households’ access to radio.
‘I am a widow. I am responsible for the education of my young children. I don’t have the capacity to buy a radio,’ said a rural woman. Another rural woman added, ‘I used to have a Phillips radio. Following my husband’s death, we didn’t use the radio for two years. When I finally wanted to have it maintained after two years, I was told that it is beyond repairing. The inside of the radio got rotten, and spare parts were not easy to find because it is an old brand. I am a mother of four children so I haven’t bought another one.’
The periodic expense of buying new batteries for the radio is a major challenge for many households considering their meagre income and the various bills they have to pay. Hence, many participants with radios said that they do not listen as much as they would like to, if at all. The following excerpts from the focus groups with rural dwellers illustrate the dynamics affecting optimum usage of radio in rural areas.
‘We buy batteries from what we earn as a daily labourer or from selling different agricultural products. The one problem these days is that the price of two batteries has increased from two birr to five or seven birr. The battery lasts only a week or two. This requires buying over and over again. The expense has become too much. Many people have locked it away in a box. Most of the batteries these days don’t last long and make the radio rust,’ explained an elderly rural man. Another rural man added, ‘We buy batteries with whatever money we have. Many people do not afford the battery expense and they just lock the radio away. It is difficult to find even day labour jobs these days. From what are we going to get the money when there is no work? That is why the radio is often wrapped and tucked away.’
In the focus group with urban dwellers, those who hold that male family members listen to the radio more cited reasons like having more free time and better opportunities to listen to the radio. Interestingly, those who hold that female family members listen to the radio more cite contradictory reasons claiming that men are busy outside the house for most of the day, and that they have little time and few opportunities to listen to the radio. The excerpts below illustrate these differences in perception.
‘Women listen to the radio more than men because men are not around the house for most part of the day. Men tend to be busy with work. However, since women are at home often, they know the programmes from morning till evening very well,’ said a participant from one low income male group. ‘It is men who have more opportunities to listen to the radio more. Women have less time to listen to the radio because of work overload,’ said a participant from another low income male group.
While these contradictory views are characteristic of urban areas, the difference in usage levels between men and women is stark in rural areas. It was repeatedly suggested by many of the participants from the male and female rural groups that the household head and the older boys are the ones that listen to the radio most. Interestingly, school-going girls were also cited by a few participants as one of the groups listening to the radio most.
Conversely, aged members of the family and women were mentioned as the ones listening to the radio least. This has been attributed to lack of time and inability to operate the radio. The following excerpts from focus groups with male and female rural dwellers illuminate further the dynamics in rural areas that affect whether people listen to the radio or not.
2626
‘I have a radio. I listen to useful programmes. But it is my husband who listens to the radio most. He listens to programmes in local as well as foreign languages. I like to listen to different programmes but as I am very busy with different work at home, I don’t listen much,’ said a participant from the focus group with rural women.‘The old don’t use it [radio] because they don’t know how to operate it. But they listen when others turn it on. The women are busy with different work. So they also listen less. It is often older boys and girls who listen to the radio. The young also buy the batteries from what they earn selling agricultural products,’ said a participant from the focus group with rural men.‘There is only one radio in the house and if everyone wants to listen, boys get priority on choice of programmes. The girls may have as much interest to listen to the radio as the boys but the boys have a sense of ownership to the radio,’ said another participant from the focus group with rural men.
• Although radio is the most commonly used ICT, financial resources to buy batteries play a great part in determining whether a person can afford to listen to the radio or not.
• Although women may be at home more they tend to listen to the radio less than men, even though they might have a similar education and income. This is often due to their work or not having access to a radio or not being able to select which programmes to listen to if male members of the household are present.
• Cultural differences – men having the right to regulate whether and what is being listened to on the radio
• People mainly listen to the radio at home, not while travelling as happens in economies where people mainly use private transport and have access to television at home.
Just as is the case with radio, the focus group discussions revealed differences between men and women in the manner and intensity of TV usage. There was no agreement among urban dwellers on who watches TV most, as there were contrasting assertions on whether male or female family members watch more TV. The one consensus reached was that when it comes to watching TV at home, women have more time and opportunities than men. The following excerpts illuminate some of the assertions made to this effect:
‘Although I have a TV at home, I have little time to watch because of work overload. I may have watched briefly at night,’ said a participant from the low income male group. ‘At home, women might watch the TV more than the men, even in her effort to make the home lively,’ said another participant from the low income male group. (Ethiopia)
Conversely, there was a consensus that when it comes to watching TV outside the home men have more access and opportunities for doing so. Respondents also attributed the low access and inclination among women to watch TV outside the home to a range of cultural and social barriers including harassment, work overload, and socialisation or lack of interest. The excerpts below illuminate the dynamics affecting whether women watch TV outside the home.
‘I am very interested in soccer and want to watch games. It is not affordable to watch such games (to have DSTV) at home. To go and watch outside like the men, you start wondering what people would say, and you would abandon the idea. Although I want to be out there and follow the game with the men, comments like “why won’t she stay at home,” by people is what makes me prefer to stay home,’ said a participant from the middle–high income female group.‘When it comes to watching TV outside the house, to watch news or soccer, men have more opportunities than women. It is not common for women to hang out in crowded places to watch something interesting,’ said another participant from the low income male group.‘Just as it is uncommon for a woman to propose (marriage) to a man, a woman also does not dare enter a house (a public place) to watch TV,’ said another participant from the low income male group.‘I watch whatever programme there is (on TV) with my family. Men tend to like the crowd and noise in bars and public places, and hence prefer to watch outside. … Women watch TV at home. For instance, the culture won’t let me to go out, order a drink and watch TV. There is also sentiment about what other people would say,’ said a participant from the middle–high income female group. ‘Women watch TV outside home less because of our culture. The culture puts particular pressure on women,’ said a participant from the middle–high income male group. (Ethiopia)
ICT usage, particularly media consumption is intrinsically tied to cultural norms and standards. Thus, it is difficult to analyse gender issues without the background and context of the larger societal gender issues.
27
Issues of harassment were highlighted and women were afraid of watching TV in public places for fear of harassment.
‘When women dare go out to watch TV, they face all kinds of bantering. This in turn will discourage women from going out,’ said a participant from the middle–high income male group.‘I think it is part of the cultural pressure against women. If a woman sits in a café by herself and is relaxing, other people will think of many things. They might even comment, “What? He stood you up?” as if the man I am waiting for didn’t show up. So instead of facing such comments, I prefer to sit home,’ said a participant from the middle–high income female group. ‘There is a lot of sentiment and fear for a woman to have fun outside by herself. She could be subjected to many things. The fear is that she will be in the middle of men and there could be a quarrel and she could face many problems,’ said a participant from the middle–high income female group. (Ethiopia)
It emerged from the discussion that there was a difference in socialisation between men and women. Women were expected to stay at home for various reasons, including personal safety, while men socialised in public spaces outside the home.
‘I have a son. He watches soccer outside. The rest of the family (the mother and two daughters) watch TV at home. I bought a TV so that my kids will not leave home. I don’t allow my daughters to leave home to watch TV because the situation out there is very bad. I don’t mind if the boy wants to watch TV outside the house. He often returns home early unless he is watching soccer during which he might come at 1 or 2 in the evening,’ said a participant from the low income female group. (Ethiopia)
There were responses contesting this view and indicating that, in contrast to past practice, more and more women watch TV outside the home. The following excerpt illuminates this changing trend.
‘Previously just when satellite TV was started, women were not used to watching TV outside. These days especially in Addis Ababa many women are seen watching DSTV. Previously there was cultural pressure and pressure from parents. It (watching TV outside home) is becoming common these days, and many women are breaking free of this pressure. There is a lot of change in this regard,’ said a participant from the low income female group (Ethiopia).
In rural areas, due to lack of electricity, there is no access to TV. Rural dwellers, however, get to watch TV when they visit the nearby town. All the same, there is a difference in TV usage between men and women for reasons similar to the ones cited in urban areas. The excerpts presented below shed light on the difference in TV usage between rural men and women. A participant from the rural female focus group said:
‘The men use whatever they earn to watch soccer on TV while having bread or tea. But if we (women) have 50 cents, we spend it on buying goods such as onion or salt for the household. We are concerned about our household problems.’‘There is no TV in this area. It is only found in the town. When we go to the town, we watch TV while having a drink,’ said a participant from the rural male focus group.‘Only older boys and men can watch TV in town and return late. This is not something for the old or the women,’ said another participant from the rural male focus group (Ethiopia).
There are significant differences across countries around radio access by men and women and differences in the favourite programmes men and women listen to (large country differences). There are also a number of social dynamics, norms and customs that come into play when determining access to and usage of media like radio and TV. Some of these, such as determining what to watch, usage in public spaces and time available mirror the gender issues encountered with mobile phone use.
• In many countries and particularly in rural areas, television is not widely available, highlighting the issues of public viewing and particularly the constraints on access by women.
• Social dynamics, norms and customs influence TV usage.
• Generalisations across countries should be made with caution when analysing viewing patterns, penetration, electricity costs, public programmes offered and social rules.
2828
ConclusionThe limited access to the full range of ICTs by women in Africa and their constrained usage, mostly due to the high costs of services or equipment, highlight the sub-optimal use of ICTs on the continent. It is evident that access to and usage of ICTs with the potential to improve the well-being of individuals and the livelihoods of households, and with the associated developmental benefits, is highly uneven and relatively untapped. While radio is the most widely used medium, and mobile phone usage is extensive across all countries, only miniscule numbers (often statistically insignificant) of men and women own computers and have Internet connections at home. Only relatively small numbers are able to access the Internet at public access points and large numbers remain unaware of it entirely. In a few exceptional cases women are more aware of the Internet such as in Cameroon, and have nearly equal access to Internet and mobile communications.
This descriptive, gender-disaggregated overview indicates that women are not equally able to access and use ICTs. Important factors such as income, education and social position play a major role in explaining ICT access and usage. When men and women share similar backgrounds (data is controlled for factors such as education and income.) the differences in access to ICTs and their use are less. However, due to unequal access to the factors that appear to enhance ICT access and usage – such as income and education – women generally have less access to ICTs and this increases as the technologies and services become more sophisticated and expensive, requiring greater levels of income and education to access and to operate.
For these reasons women in lower income groups or rural areas may have more in common with men in similar situations with regard to access and usage of ICTs than with women who are more educated or from higher income groups. While mobile phones are increasingly pervasive, their usage is limited by the high cost of communications. Even so both men and women spend significant portions of their salaries on, mostly mobile, phone services. While men tend to spend more than women, the portion of women’s generally lower income spent on mobile phone usage is greater than that of men.
Besides the high cost of PC ownership, the lack of computer skills is one of the main factors hindering men and women from using the Internet. Apart from slow connections, people are also deterred by the high cost of being online. In addition, the importance of setting up locally relevant sites and using local languages to increase the number of users cannot be overemphasised from the point of policy intervention.
As a reflection of the gender disparity in educational attainment, women are less likely than men to have the necessary e-skills to use different technologies optimally. This is partly responsible for affecting their confidence in using these technologies. Efforts aimed at ensuring equal inclusion and involvement of women in the use of ICTs need to focus on primary government school training in basic computer literacy but in addition, as other RIA e-literacy studies have shown, optimal use of PCs and the Internet requires high school and tertiary training. Further, to increase the participation of women as employees, managers and owners of ICT enterprises, programmes that target women and incentivise their training in traditionally male terrains of mathematics, science and engineering will be required on a significant scale across the continent.
The most intractable limitations to equitable access and use of ICTs however lie in the cultural and social dimensions of what are considered by many as normal social practices, but which discriminate against women and girls in key enablers of ICT access and usage such as education and employment. Specifically however, various cultural barriers also limit the opportunities for women to access ICTs, including harassment in public spaces, work overload and gendered perceptions in relation to the use of certain ICTs. Hence, in addition to economic empowerment, it is important from a policy point of view to create a legal environment that ensures equal rights for women and men, which safeguards them from discriminatory practices and which fosters equitable participation in society and the economy more widely by both women and men.
29
ReferencesCasal de Vela, T. and Ofreneo, M.A. (2007) (eds.) How Grassroots Women View Communication Tools and Empowerment in the Philippines in People’s Communication for Development.
Chabossou, A., Stork, C., Stork, M. & Zahonogo, P. (2008) Mobile Telephony Access and Usage in Africa, The Southern African Journal of Information and Communication, Issue 9, pages 17–41, ISSN 1607-2235.
de Silva, H., Ratnadiwakara,D. & Soysa,S. (2009) Mobile phones to significantly reduce information-related transaction costs for small- holder farmers.
Faulkner, W. (2002). Women, gender in/and ICT: Evidence and reflections from the UK. SIGIS report.
Fortunati, L. & Manganelli, A. (2002) A review of the literature on gender and ICT in Italy. SIGIS report.
Gefen, D &, Straub, D.W. (1997) Gender difference in the perception and use of email: an extension to the technology acceptance model. MIS Quarterly, 21,4 389-400.
Hersh, M. (2000). The changing position of women in engineering world-wide. IEEE Transactions of Engineering Management, 47, 345-359.
Huyer, S (2008) Gender and the Core ICT Indicators, Presentation at the 2008 Global Event on Measuring the Information Society, Geneva, 27-29 May.
Huyer, S., & Hafkin, N. (2006) Cinderella or Cyberella? Empowering women in the knowledge society. Bloomsfield: Kumarian Press, ISBN:1565492196.
Huyer, S., & Hafkin, N. (2007) Engendering the knowledge society: Measuring women’s participation. Montreal: Orbicom, NRC Press.
Jensen, M. & Mahan, A. (2007) Toward a single ICT Index: Consideration for the formulation of a single ICT index for the ITU. Available: http://lirne.net/test/wp-content/uploads/2008/05/itusingleindex2008.pdf (accessed 26 January 2010).
Jensen, R. (2007) The Digital Provide: Information (technology), market performance and welfare in the South Indian fisheries sector, The Quarterly Journal of Economics, Vol. CXXII, August, Issue 3.
Long, S. & Freese, J (2006). Regression Models for Categorical Dependent Variables Using Stata, Stata Press, ISBN1-59718-011-4.
MacKeogh, C. (2002) Literature review and statistical data relating to gender in the production and consumption of ICT in Ireland. SIGIS report.
Mottin-Sylla, M.H. (2005) The gender digital divide in Francophone Africa: A harsh reality. Dakar: ENDA Third World. ISBN 92-95049-11.
Ono, H. (2003). Gender and Internet. Social Science Quarterly, 84, 111-121.
Oost, E. (2002). Gender and ICT in the Netherlands. Review of statistics and literature. SIGIS report.
Ramila, C. (2008) Gender Issues and Tools for SME and ICT. APC.
Rogers, E.M. (1995). Diffusion of innovations. (4th ed.) New York: Free Press.
Rural Livelihoods and Poverty Reduction: a study of rural communities in India (Gujarat), Mozambique and Tanzania, Report of DFID KaR Project 8347.
Schmidt, J. P., & Stork, C. (2008). Towards evidence-based ICT policy and regulation: E-Skills, Volume 1, Policy Paper 3, Research ICT Africa, ISSN 2073-0845.
Sorenson, K. H. (2002). Love, duty and the S-curve: An overview of some current literature on gender and ICT.
Souter, D. et al., (2005) The Economic Impact of Telecommunications on
Taefnout, A. & Timjerdinge, A. (2005). Using ICTs to act on hope and commitment: The fight against gender violence in Morocco. In: Ineke Buskens & Anne Webb (eds.) African women and ICTs - Investigating technology, gender and empowerment (pp. 88-96). London, New York: Zed Books.
Todaro, M. & Smith, S. (2007) Economic Development, Pearson Education Inc. Addison-Wesley, NJ.
3030

UNDAW (United Nations Division for the Advancement of Women). (2003). Information and communication technologies and their impact on and use as an instrument for the advancement and empowerment of women. New York: UNDAW. Available: http://www.un.org/womenwatch/daw/egm/ict2002/index.html (accessed 26 January 2010).
Venkatesh, V. & Morris, M.G. (2000) Why don’t men ever stop to ask for directions? Gender, social influence and their role in technology acceptance and usage behaviour. MIS Quarterly, 24, 115-139.
Zainudeen, A. & Iqbal, T. (2007)The gendered aspects of telecom access and use at the bottom of the pyramid in Emerging Asia. Paper presented at CPRsouth2: Empowering rural communities through ICT policy and research. Chennai, India, December.
Zainudeen, A., Iqbal, T., Samarajiva, R. & Ratnadiwakara, D. (2008) Who’s got the phone? Gender and the use of the telephone at the bottom of the pyramid. Paper presented at 2008 International Communications Association conference, Montreal, Canada, 26 May 2008.
31
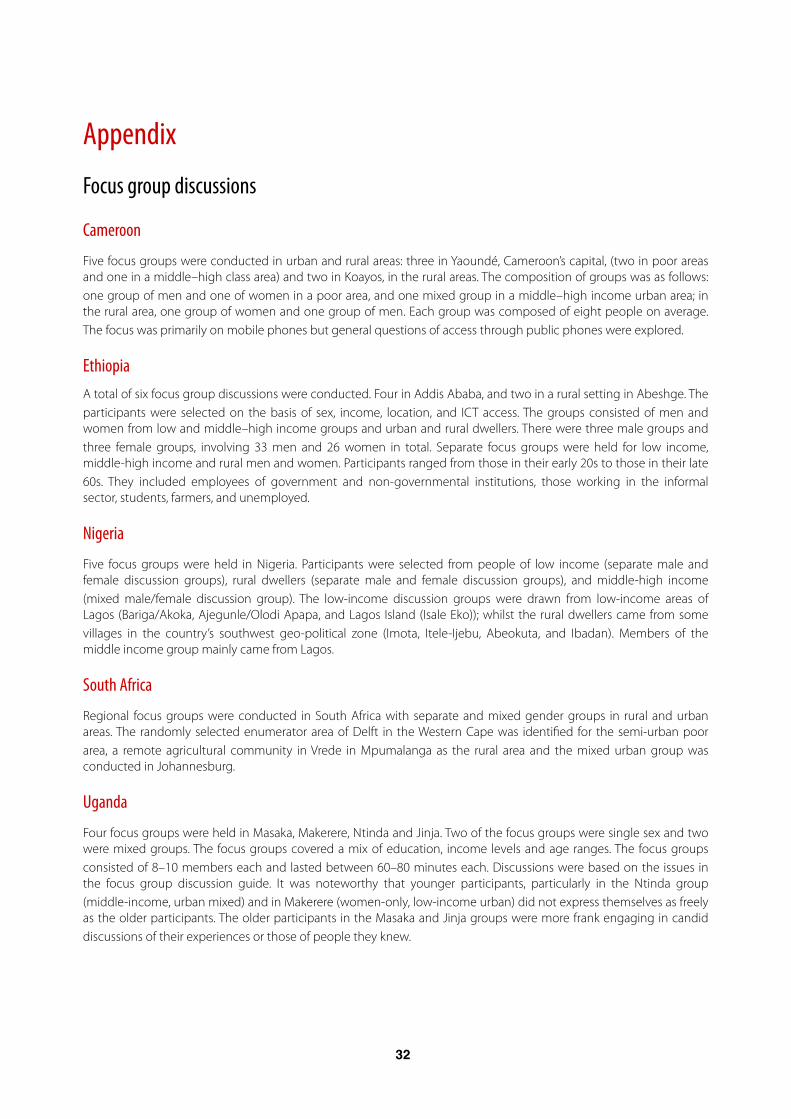
Appendix
Focus group discussions
Cameroon
Five focus groups were conducted in urban and rural areas: three in Yaoundé, Cameroon’s capital, (two in poor areas and one in a middle–high class area) and two in Koayos, in the rural areas. The composition of groups was as follows: one group of men and one of women in a poor area, and one mixed group in a middle–high income urban area; in the rural area, one group of women and one group of men. Each group was composed of eight people on average. The focus was primarily on mobile phones but general questions of access through public phones were explored.
EthiopiaA total of six focus group discussions were conducted. Four in Addis Ababa, and two in a rural setting in Abeshge. The participants were selected on the basis of sex, income, location, and ICT access. The groups consisted of men and women from low and middle–high income groups and urban and rural dwellers. There were three male groups and three female groups, involving 33 men and 26 women in total. Separate focus groups were held for low income, middle-high income and rural men and women. Participants ranged from those in their early 20s to those in their late 60s. They included employees of government and non-governmental institutions, those working in the informal sector, students, farmers, and unemployed.
Nigeria
Five focus groups were held in Nigeria. Participants were selected from people of low income (separate male and female discussion groups), rural dwellers (separate male and female discussion groups), and middle-high income (mixed male/female discussion group). The low-income discussion groups were drawn from low-income areas of Lagos (Bariga/Akoka, Ajegunle/Olodi Apapa, and Lagos Island (Isale Eko)); whilst the rural dwellers came from some villages in the country’s southwest geo-political zone (Imota, Itele-Ijebu, Abeokuta, and Ibadan). Members of the middle income group mainly came from Lagos.
South Africa
Regional focus groups were conducted in South Africa with separate and mixed gender groups in rural and urban areas. The randomly selected enumerator area of Delft in the Western Cape was identified for the semi-urban poor area, a remote agricultural community in Vrede in Mpumalanga as the rural area and the mixed urban group was conducted in Johannesburg.
Uganda
Four focus groups were held in Masaka, Makerere, Ntinda and Jinja. Two of the focus groups were single sex and two were mixed groups. The focus groups covered a mix of education, income levels and age ranges. The focus groups consisted of 8–10 members each and lasted between 60–80 minutes each. Discussions were based on the issues in the focus group discussion guide. It was noteworthy that younger participants, particularly in the Ntinda group (middle-income, urban mixed) and in Makerere (women-only, low-income urban) did not express themselves as freely as the older participants. The older participants in the Masaka and Jinja groups were more frank engaging in candid discussions of their experiences or those of people they knew.
3232
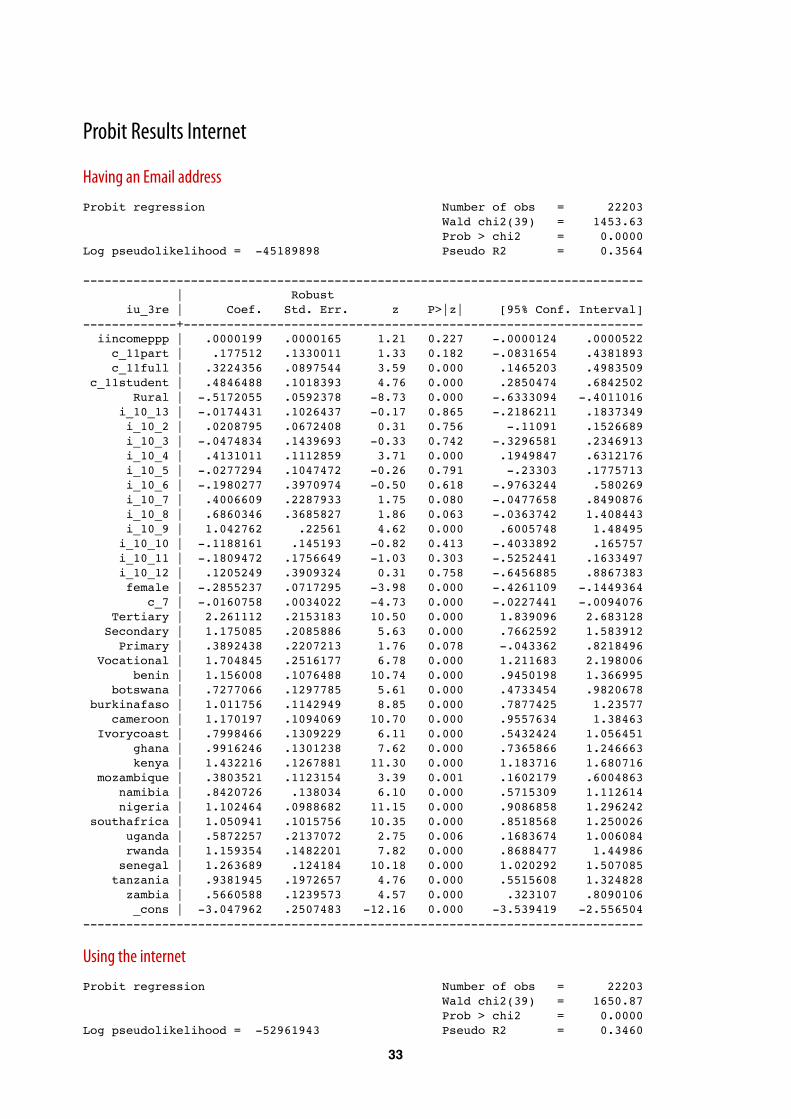
Probit Results Internet
Having an Email address
Probit regression Number of obs = 22203 Wald chi2(39) = 1453.63 Prob > chi2 = 0.0000Log pseudolikelihood = -45189898 Pseudo R2 = 0.3564
------------------------------------------------------------------------------ | Robust iu_3re | Coef. Std. Err. z P>|z| [95% Conf. Interval]-------------+---------------------------------------------------------------- iincomeppp | .0000199 .0000165 1.21 0.227 -.0000124 .0000522 c_11part | .177512 .1330011 1.33 0.182 -.0831654 .4381893 c_11full | .3224356 .0897544 3.59 0.000 .1465203 .4983509 c_11student | .4846488 .1018393 4.76 0.000 .2850474 .6842502 Rural | -.5172055 .0592378 -8.73 0.000 -.6333094 -.4011016 i_10_13 | -.0174431 .1026437 -0.17 0.865 -.2186211 .1837349 i_10_2 | .0208795 .0672408 0.31 0.756 -.11091 .1526689 i_10_3 | -.0474834 .1439693 -0.33 0.742 -.3296581 .2346913 i_10_4 | .4131011 .1112859 3.71 0.000 .1949847 .6312176 i_10_5 | -.0277294 .1047472 -0.26 0.791 -.23303 .1775713 i_10_6 | -.1980277 .3970974 -0.50 0.618 -.9763244 .580269 i_10_7 | .4006609 .2287933 1.75 0.080 -.0477658 .8490876 i_10_8 | .6860346 .3685827 1.86 0.063 -.0363742 1.408443 i_10_9 | 1.042762 .22561 4.62 0.000 .6005748 1.48495 i_10_10 | -.1188161 .145193 -0.82 0.413 -.4033892 .165757 i_10_11 | -.1809472 .1756649 -1.03 0.303 -.5252441 .1633497 i_10_12 | .1205249 .3909324 0.31 0.758 -.6456885 .8867383 female | -.2855237 .0717295 -3.98 0.000 -.4261109 -.1449364 c_7 | -.0160758 .0034022 -4.73 0.000 -.0227441 -.0094076 Tertiary | 2.261112 .2153183 10.50 0.000 1.839096 2.683128 Secondary | 1.175085 .2085886 5.63 0.000 .7662592 1.583912 Primary | .3892438 .2207213 1.76 0.078 -.043362 .8218496 Vocational | 1.704845 .2516177 6.78 0.000 1.211683 2.198006 benin | 1.156008 .1076488 10.74 0.000 .9450198 1.366995 botswana | .7277066 .1297785 5.61 0.000 .4733454 .9820678 burkinafaso | 1.011756 .1142949 8.85 0.000 .7877425 1.23577 cameroon | 1.170197 .1094069 10.70 0.000 .9557634 1.38463 Ivorycoast | .7998466 .1309229 6.11 0.000 .5432424 1.056451 ghana | .9916246 .1301238 7.62 0.000 .7365866 1.246663 kenya | 1.432216 .1267881 11.30 0.000 1.183716 1.680716 mozambique | .3803521 .1123154 3.39 0.001 .1602179 .6004863 namibia | .8420726 .138034 6.10 0.000 .5715309 1.112614 nigeria | 1.102464 .0988682 11.15 0.000 .9086858 1.296242 southafrica | 1.050941 .1015756 10.35 0.000 .8518568 1.250026 uganda | .5872257 .2137072 2.75 0.006 .1683674 1.006084 rwanda | 1.159354 .1482201 7.82 0.000 .8688477 1.44986 senegal | 1.263689 .124184 10.18 0.000 1.020292 1.507085 tanzania | .9381945 .1972657 4.76 0.000 .5515608 1.324828 zambia | .5660588 .1239573 4.57 0.000 .323107 .8090106 _cons | -3.047962 .2507483 -12.16 0.000 -3.539419 -2.556504------------------------------------------------------------------------------
Using the internet
Probit regression Number of obs = 22203 Wald chi2(39) = 1650.87 Prob > chi2 = 0.0000Log pseudolikelihood = -52961943 Pseudo R2 = 0.3460
33
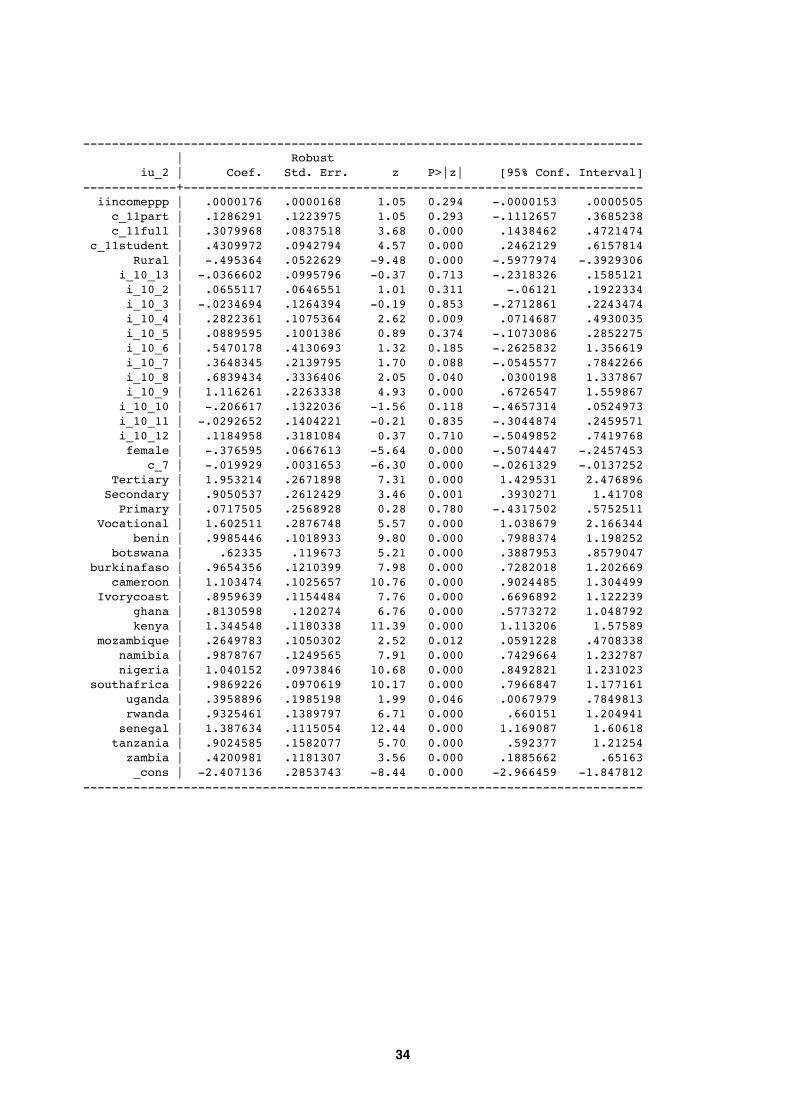
------------------------------------------------------------------------------ | Robust iu_2 | Coef. Std. Err. z P>|z| [95% Conf. Interval]-------------+---------------------------------------------------------------- iincomeppp | .0000176 .0000168 1.05 0.294 -.0000153 .0000505 c_11part | .1286291 .1223975 1.05 0.293 -.1112657 .3685238 c_11full | .3079968 .0837518 3.68 0.000 .1438462 .4721474 c_11student | .4309972 .0942794 4.57 0.000 .2462129 .6157814 Rural | -.495364 .0522629 -9.48 0.000 -.5977974 -.3929306 i_10_13 | -.0366602 .0995796 -0.37 0.713 -.2318326 .1585121 i_10_2 | .0655117 .0646551 1.01 0.311 -.06121 .1922334 i_10_3 | -.0234694 .1264394 -0.19 0.853 -.2712861 .2243474 i_10_4 | .2822361 .1075364 2.62 0.009 .0714687 .4930035 i_10_5 | .0889595 .1001386 0.89 0.374 -.1073086 .2852275 i_10_6 | .5470178 .4130693 1.32 0.185 -.2625832 1.356619 i_10_7 | .3648345 .2139795 1.70 0.088 -.0545577 .7842266 i_10_8 | .6839434 .3336406 2.05 0.040 .0300198 1.337867 i_10_9 | 1.116261 .2263338 4.93 0.000 .6726547 1.559867 i_10_10 | -.206617 .1322036 -1.56 0.118 -.4657314 .0524973 i_10_11 | -.0292652 .1404221 -0.21 0.835 -.3044874 .2459571 i_10_12 | .1184958 .3181084 0.37 0.710 -.5049852 .7419768 female | -.376595 .0667613 -5.64 0.000 -.5074447 -.2457453 c_7 | -.019929 .0031653 -6.30 0.000 -.0261329 -.0137252 Tertiary | 1.953214 .2671898 7.31 0.000 1.429531 2.476896 Secondary | .9050537 .2612429 3.46 0.001 .3930271 1.41708 Primary | .0717505 .2568928 0.28 0.780 -.4317502 .5752511 Vocational | 1.602511 .2876748 5.57 0.000 1.038679 2.166344 benin | .9985446 .1018933 9.80 0.000 .7988374 1.198252 botswana | .62335 .119673 5.21 0.000 .3887953 .8579047 burkinafaso | .9654356 .1210399 7.98 0.000 .7282018 1.202669 cameroon | 1.103474 .1025657 10.76 0.000 .9024485 1.304499 Ivorycoast | .8959639 .1154484 7.76 0.000 .6696892 1.122239 ghana | .8130598 .120274 6.76 0.000 .5773272 1.048792 kenya | 1.344548 .1180338 11.39 0.000 1.113206 1.57589 mozambique | .2649783 .1050302 2.52 0.012 .0591228 .4708338 namibia | .9878767 .1249565 7.91 0.000 .7429664 1.232787 nigeria | 1.040152 .0973846 10.68 0.000 .8492821 1.231023 southafrica | .9869226 .0970619 10.17 0.000 .7966847 1.177161 uganda | .3958896 .1985198 1.99 0.046 .0067979 .7849813 rwanda | .9325461 .1389797 6.71 0.000 .660151 1.204941 senegal | 1.387634 .1115054 12.44 0.000 1.169087 1.60618 tanzania | .9024585 .1582077 5.70 0.000 .592377 1.21254 zambia | .4200981 .1181307 3.56 0.000 .1885662 .65163 _cons | -2.407136 .2853743 -8.44 0.000 -2.966459 -1.847812------------------------------------------------------------------------------
3434
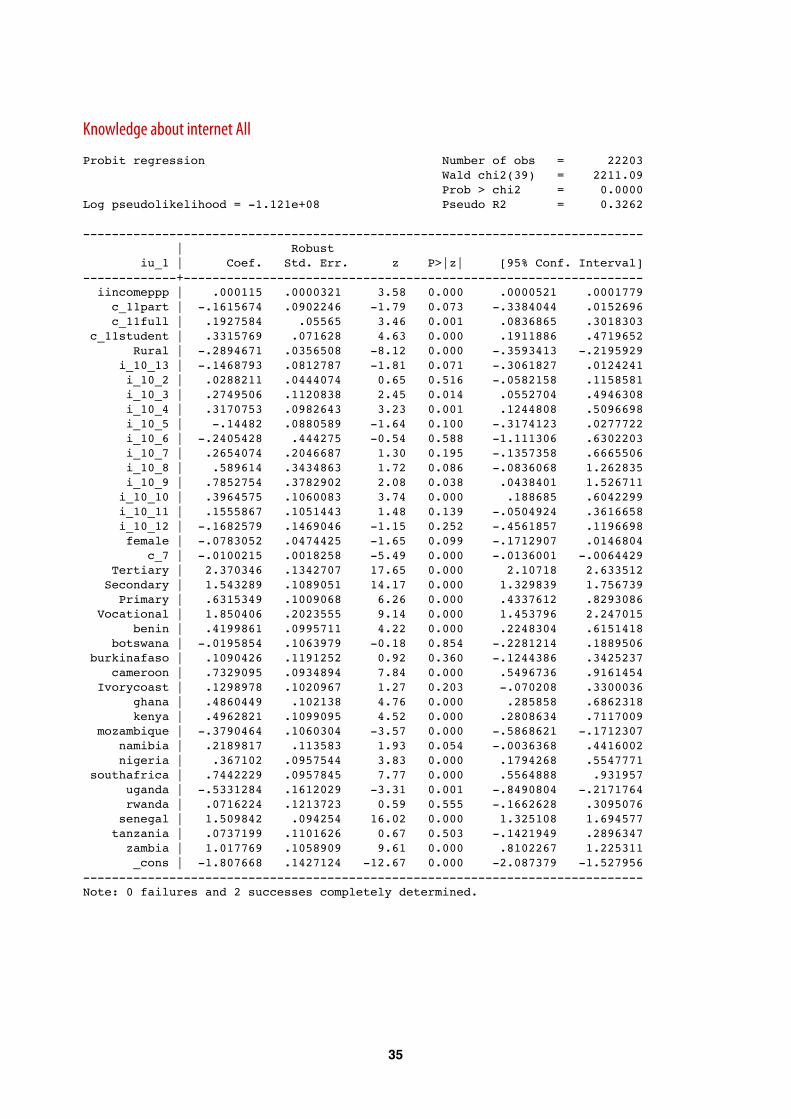
Knowledge about internet All
Probit regression Number of obs = 22203 Wald chi2(39) = 2211.09 Prob > chi2 = 0.0000Log pseudolikelihood = -1.121e+08 Pseudo R2 = 0.3262
------------------------------------------------------------------------------ | Robust iu_1 | Coef. Std. Err. z P>|z| [95% Conf. Interval]-------------+---------------------------------------------------------------- iincomeppp | .000115 .0000321 3.58 0.000 .0000521 .0001779 c_11part | -.1615674 .0902246 -1.79 0.073 -.3384044 .0152696 c_11full | .1927584 .05565 3.46 0.001 .0836865 .3018303 c_11student | .3315769 .071628 4.63 0.000 .1911886 .4719652 Rural | -.2894671 .0356508 -8.12 0.000 -.3593413 -.2195929 i_10_13 | -.1468793 .0812787 -1.81 0.071 -.3061827 .0124241 i_10_2 | .0288211 .0444074 0.65 0.516 -.0582158 .1158581 i_10_3 | .2749506 .1120838 2.45 0.014 .0552704 .4946308 i_10_4 | .3170753 .0982643 3.23 0.001 .1244808 .5096698 i_10_5 | -.14482 .0880589 -1.64 0.100 -.3174123 .0277722 i_10_6 | -.2405428 .444275 -0.54 0.588 -1.111306 .6302203 i_10_7 | .2654074 .2046687 1.30 0.195 -.1357358 .6665506 i_10_8 | .589614 .3434863 1.72 0.086 -.0836068 1.262835 i_10_9 | .7852754 .3782902 2.08 0.038 .0438401 1.526711 i_10_10 | .3964575 .1060083 3.74 0.000 .188685 .6042299 i_10_11 | .1555867 .1051443 1.48 0.139 -.0504924 .3616658 i_10_12 | -.1682579 .1469046 -1.15 0.252 -.4561857 .1196698 female | -.0783052 .0474425 -1.65 0.099 -.1712907 .0146804 c_7 | -.0100215 .0018258 -5.49 0.000 -.0136001 -.0064429 Tertiary | 2.370346 .1342707 17.65 0.000 2.10718 2.633512 Secondary | 1.543289 .1089051 14.17 0.000 1.329839 1.756739 Primary | .6315349 .1009068 6.26 0.000 .4337612 .8293086 Vocational | 1.850406 .2023555 9.14 0.000 1.453796 2.247015 benin | .4199861 .0995711 4.22 0.000 .2248304 .6151418 botswana | -.0195854 .1063979 -0.18 0.854 -.2281214 .1889506 burkinafaso | .1090426 .1191252 0.92 0.360 -.1244386 .3425237 cameroon | .7329095 .0934894 7.84 0.000 .5496736 .9161454 Ivorycoast | .1298978 .1020967 1.27 0.203 -.070208 .3300036 ghana | .4860449 .102138 4.76 0.000 .285858 .6862318 kenya | .4962821 .1099095 4.52 0.000 .2808634 .7117009 mozambique | -.3790464 .1060304 -3.57 0.000 -.5868621 -.1712307 namibia | .2189817 .113583 1.93 0.054 -.0036368 .4416002 nigeria | .367102 .0957544 3.83 0.000 .1794268 .5547771 southafrica | .7442229 .0957845 7.77 0.000 .5564888 .931957 uganda | -.5331284 .1612029 -3.31 0.001 -.8490804 -.2171764 rwanda | .0716224 .1213723 0.59 0.555 -.1662628 .3095076 senegal | 1.509842 .094254 16.02 0.000 1.325108 1.694577 tanzania | .0737199 .1101626 0.67 0.503 -.1421949 .2896347 zambia | 1.017769 .1058909 9.61 0.000 .8102267 1.225311 _cons | -1.807668 .1427124 -12.67 0.000 -2.087379 -1.527956------------------------------------------------------------------------------Note: 0 failures and 2 successes completely determined.
35
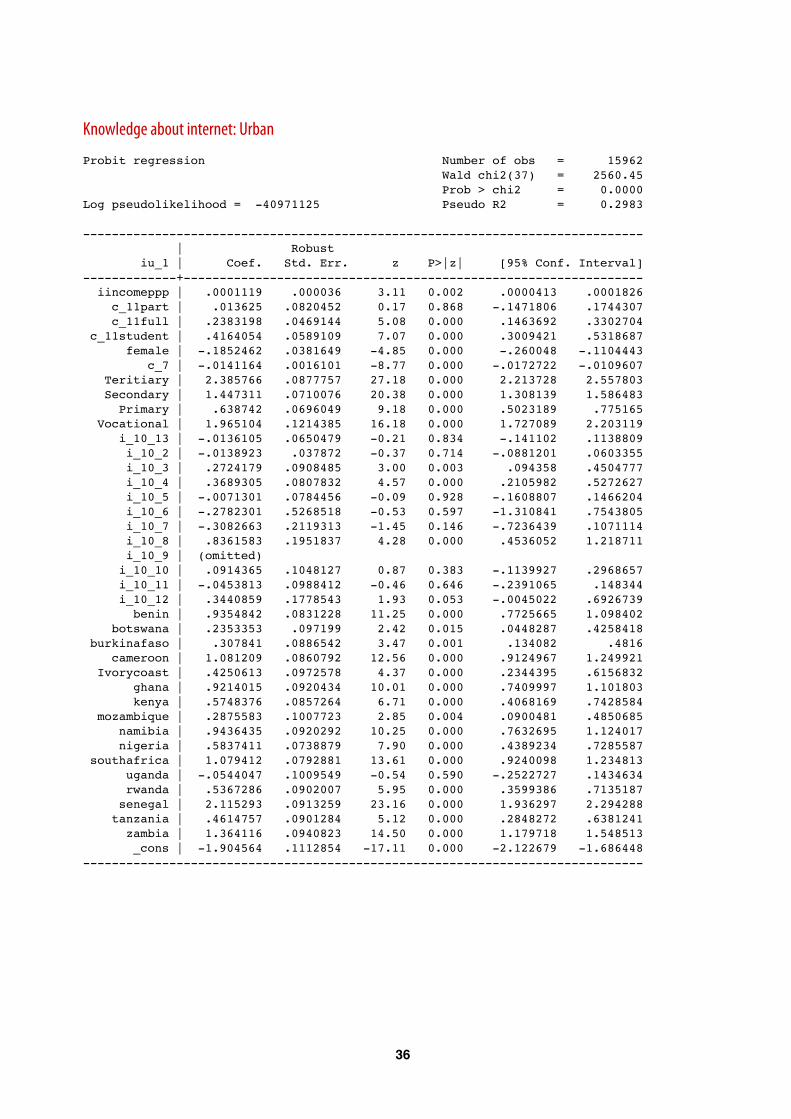
Knowledge about internet: Urban
Probit regression Number of obs = 15962 Wald chi2(37) = 2560.45 Prob > chi2 = 0.0000Log pseudolikelihood = -40971125 Pseudo R2 = 0.2983
------------------------------------------------------------------------------ | Robust iu_1 | Coef. Std. Err. z P>|z| [95% Conf. Interval]-------------+---------------------------------------------------------------- iincomeppp | .0001119 .000036 3.11 0.002 .0000413 .0001826 c_11part | .013625 .0820452 0.17 0.868 -.1471806 .1744307 c_11full | .2383198 .0469144 5.08 0.000 .1463692 .3302704 c_11student | .4164054 .0589109 7.07 0.000 .3009421 .5318687 female | -.1852462 .0381649 -4.85 0.000 -.260048 -.1104443 c_7 | -.0141164 .0016101 -8.77 0.000 -.0172722 -.0109607 Teritiary | 2.385766 .0877757 27.18 0.000 2.213728 2.557803 Secondary | 1.447311 .0710076 20.38 0.000 1.308139 1.586483 Primary | .638742 .0696049 9.18 0.000 .5023189 .775165 Vocational | 1.965104 .1214385 16.18 0.000 1.727089 2.203119 i_10_13 | -.0136105 .0650479 -0.21 0.834 -.141102 .1138809 i_10_2 | -.0138923 .037872 -0.37 0.714 -.0881201 .0603355 i_10_3 | .2724179 .0908485 3.00 0.003 .094358 .4504777 i_10_4 | .3689305 .0807832 4.57 0.000 .2105982 .5272627 i_10_5 | -.0071301 .0784456 -0.09 0.928 -.1608807 .1466204 i_10_6 | -.2782301 .5268518 -0.53 0.597 -1.310841 .7543805 i_10_7 | -.3082663 .2119313 -1.45 0.146 -.7236439 .1071114 i_10_8 | .8361583 .1951837 4.28 0.000 .4536052 1.218711 i_10_9 | (omitted) i_10_10 | .0914365 .1048127 0.87 0.383 -.1139927 .2968657 i_10_11 | -.0453813 .0988412 -0.46 0.646 -.2391065 .148344 i_10_12 | .3440859 .1778543 1.93 0.053 -.0045022 .6926739 benin | .9354842 .0831228 11.25 0.000 .7725665 1.098402 botswana | .2353353 .097199 2.42 0.015 .0448287 .4258418 burkinafaso | .307841 .0886542 3.47 0.001 .134082 .4816 cameroon | 1.081209 .0860792 12.56 0.000 .9124967 1.249921 Ivorycoast | .4250613 .0972578 4.37 0.000 .2344395 .6156832 ghana | .9214015 .0920434 10.01 0.000 .7409997 1.101803 kenya | .5748376 .0857264 6.71 0.000 .4068169 .7428584 mozambique | .2875583 .1007723 2.85 0.004 .0900481 .4850685 namibia | .9436435 .0920292 10.25 0.000 .7632695 1.124017 nigeria | .5837411 .0738879 7.90 0.000 .4389234 .7285587 southafrica | 1.079412 .0792881 13.61 0.000 .9240098 1.234813 uganda | -.0544047 .1009549 -0.54 0.590 -.2522727 .1434634 rwanda | .5367286 .0902007 5.95 0.000 .3599386 .7135187 senegal | 2.115293 .0913259 23.16 0.000 1.936297 2.294288 tanzania | .4614757 .0901284 5.12 0.000 .2848272 .6381241 zambia | 1.364116 .0940823 14.50 0.000 1.179718 1.548513 _cons | -1.904564 .1112854 -17.11 0.000 -2.122679 -1.686448------------------------------------------------------------------------------
3636
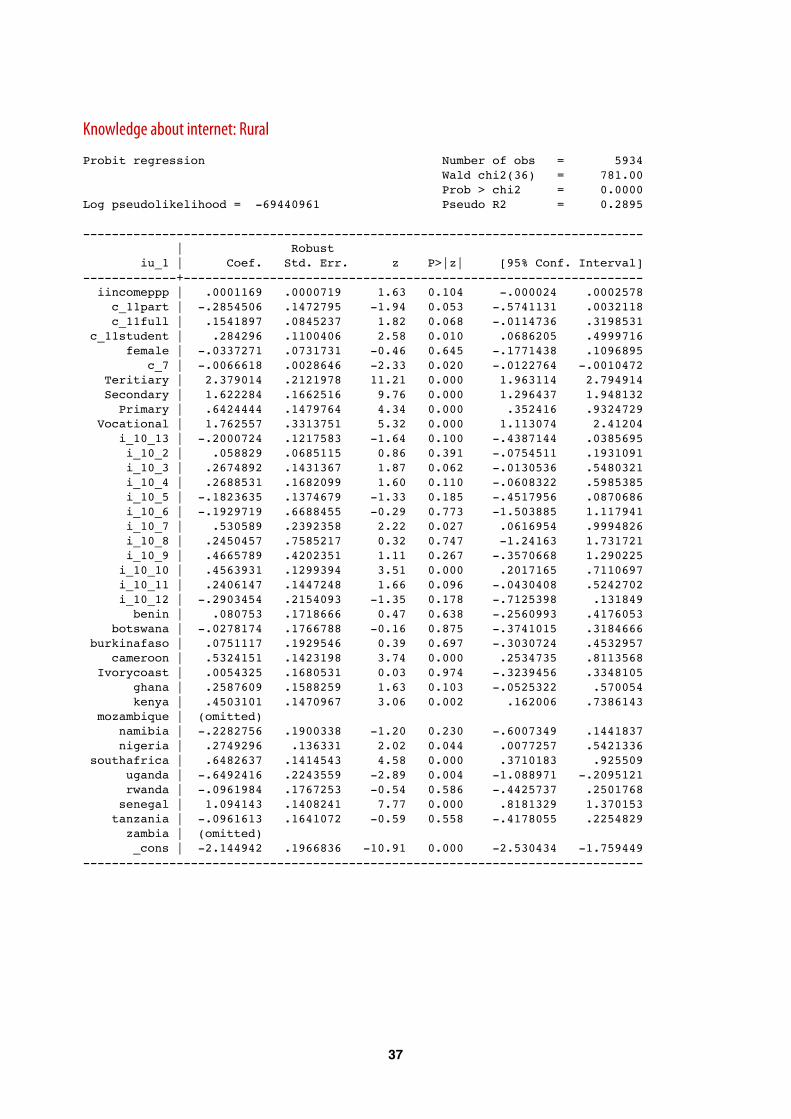
Knowledge about internet: Rural
Probit regression Number of obs = 5934 Wald chi2(36) = 781.00 Prob > chi2 = 0.0000Log pseudolikelihood = -69440961 Pseudo R2 = 0.2895
------------------------------------------------------------------------------ | Robust iu_1 | Coef. Std. Err. z P>|z| [95% Conf. Interval]-------------+---------------------------------------------------------------- iincomeppp | .0001169 .0000719 1.63 0.104 -.000024 .0002578 c_11part | -.2854506 .1472795 -1.94 0.053 -.5741131 .0032118 c_11full | .1541897 .0845237 1.82 0.068 -.0114736 .3198531 c_11student | .284296 .1100406 2.58 0.010 .0686205 .4999716 female | -.0337271 .0731731 -0.46 0.645 -.1771438 .1096895 c_7 | -.0066618 .0028646 -2.33 0.020 -.0122764 -.0010472 Teritiary | 2.379014 .2121978 11.21 0.000 1.963114 2.794914 Secondary | 1.622284 .1662516 9.76 0.000 1.296437 1.948132 Primary | .6424444 .1479764 4.34 0.000 .352416 .9324729 Vocational | 1.762557 .3313751 5.32 0.000 1.113074 2.41204 i_10_13 | -.2000724 .1217583 -1.64 0.100 -.4387144 .0385695 i_10_2 | .058829 .0685115 0.86 0.391 -.0754511 .1931091 i_10_3 | .2674892 .1431367 1.87 0.062 -.0130536 .5480321 i_10_4 | .2688531 .1682099 1.60 0.110 -.0608322 .5985385 i_10_5 | -.1823635 .1374679 -1.33 0.185 -.4517956 .0870686 i_10_6 | -.1929719 .6688455 -0.29 0.773 -1.503885 1.117941 i_10_7 | .530589 .2392358 2.22 0.027 .0616954 .9994826 i_10_8 | .2450457 .7585217 0.32 0.747 -1.24163 1.731721 i_10_9 | .4665789 .4202351 1.11 0.267 -.3570668 1.290225 i_10_10 | .4563931 .1299394 3.51 0.000 .2017165 .7110697 i_10_11 | .2406147 .1447248 1.66 0.096 -.0430408 .5242702 i_10_12 | -.2903454 .2154093 -1.35 0.178 -.7125398 .131849 benin | .080753 .1718666 0.47 0.638 -.2560993 .4176053 botswana | -.0278174 .1766788 -0.16 0.875 -.3741015 .3184666 burkinafaso | .0751117 .1929546 0.39 0.697 -.3030724 .4532957 cameroon | .5324151 .1423198 3.74 0.000 .2534735 .8113568 Ivorycoast | .0054325 .1680531 0.03 0.974 -.3239456 .3348105 ghana | .2587609 .1588259 1.63 0.103 -.0525322 .570054 kenya | .4503101 .1470967 3.06 0.002 .162006 .7386143 mozambique | (omitted) namibia | -.2282756 .1900338 -1.20 0.230 -.6007349 .1441837 nigeria | .2749296 .136331 2.02 0.044 .0077257 .5421336 southafrica | .6482637 .1414543 4.58 0.000 .3710183 .925509 uganda | -.6492416 .2243559 -2.89 0.004 -1.088971 -.2095121 rwanda | -.0961984 .1767253 -0.54 0.586 -.4425737 .2501768 senegal | 1.094143 .1408241 7.77 0.000 .8181329 1.370153 tanzania | -.0961613 .1641072 -0.59 0.558 -.4178055 .2254829 zambia | (omitted) _cons | -2.144942 .1966836 -10.91 0.000 -2.530434 -1.759449------------------------------------------------------------------------------
37
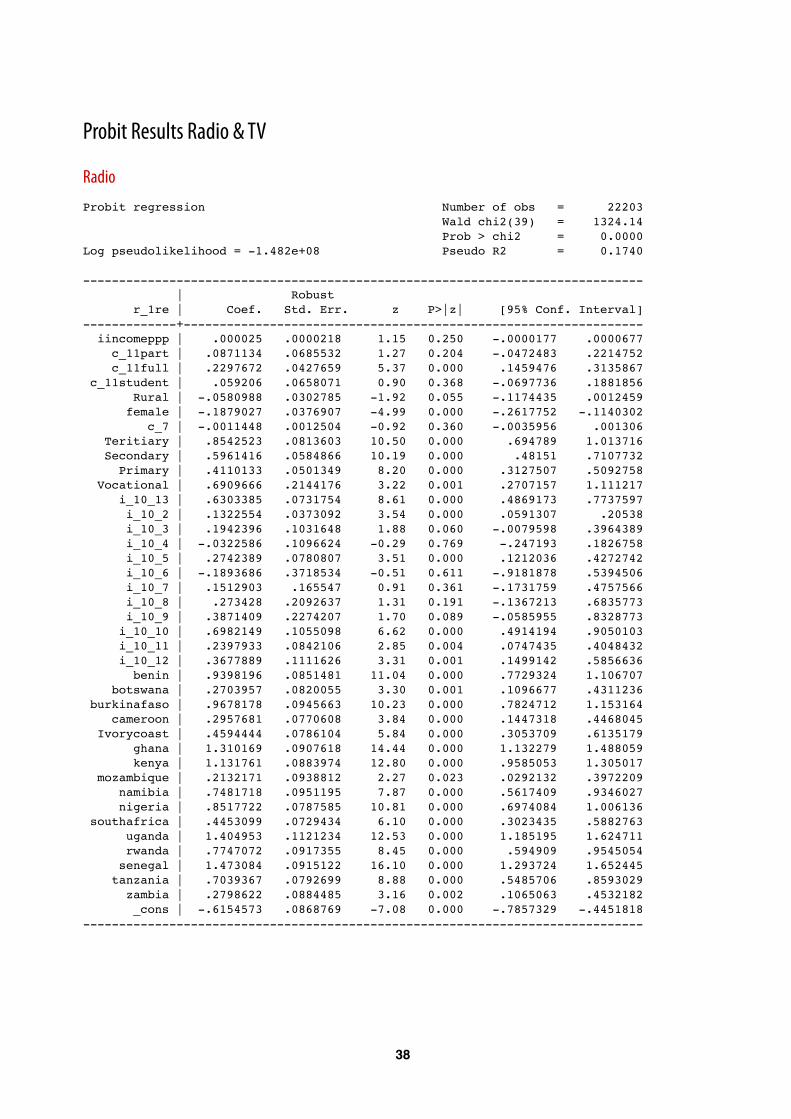
Probit Results Radio & TV
Radio
Probit regression Number of obs = 22203 Wald chi2(39) = 1324.14 Prob > chi2 = 0.0000Log pseudolikelihood = -1.482e+08 Pseudo R2 = 0.1740
------------------------------------------------------------------------------ | Robust r_1re | Coef. Std. Err. z P>|z| [95% Conf. Interval]-------------+---------------------------------------------------------------- iincomeppp | .000025 .0000218 1.15 0.250 -.0000177 .0000677 c_11part | .0871134 .0685532 1.27 0.204 -.0472483 .2214752 c_11full | .2297672 .0427659 5.37 0.000 .1459476 .3135867 c_11student | .059206 .0658071 0.90 0.368 -.0697736 .1881856 Rural | -.0580988 .0302785 -1.92 0.055 -.1174435 .0012459 female | -.1879027 .0376907 -4.99 0.000 -.2617752 -.1140302 c_7 | -.0011448 .0012504 -0.92 0.360 -.0035956 .001306 Teritiary | .8542523 .0813603 10.50 0.000 .694789 1.013716 Secondary | .5961416 .0584866 10.19 0.000 .48151 .7107732 Primary | .4110133 .0501349 8.20 0.000 .3127507 .5092758 Vocational | .6909666 .2144176 3.22 0.001 .2707157 1.111217 i_10_13 | .6303385 .0731754 8.61 0.000 .4869173 .7737597 i_10_2 | .1322554 .0373092 3.54 0.000 .0591307 .20538 i_10_3 | .1942396 .1031648 1.88 0.060 -.0079598 .3964389 i_10_4 | -.0322586 .1096624 -0.29 0.769 -.247193 .1826758 i_10_5 | .2742389 .0780807 3.51 0.000 .1212036 .4272742 i_10_6 | -.1893686 .3718534 -0.51 0.611 -.9181878 .5394506 i_10_7 | .1512903 .165547 0.91 0.361 -.1731759 .4757566 i_10_8 | .273428 .2092637 1.31 0.191 -.1367213 .6835773 i_10_9 | .3871409 .2274207 1.70 0.089 -.0585955 .8328773 i_10_10 | .6982149 .1055098 6.62 0.000 .4914194 .9050103 i_10_11 | .2397933 .0842106 2.85 0.004 .0747435 .4048432 i_10_12 | .3677889 .1111626 3.31 0.001 .1499142 .5856636 benin | .9398196 .0851481 11.04 0.000 .7729324 1.106707 botswana | .2703957 .0820055 3.30 0.001 .1096677 .4311236 burkinafaso | .9678178 .0945663 10.23 0.000 .7824712 1.153164 cameroon | .2957681 .0770608 3.84 0.000 .1447318 .4468045 Ivorycoast | .4594444 .0786104 5.84 0.000 .3053709 .6135179 ghana | 1.310169 .0907618 14.44 0.000 1.132279 1.488059 kenya | 1.131761 .0883974 12.80 0.000 .9585053 1.305017 mozambique | .2132171 .0938812 2.27 0.023 .0292132 .3972209 namibia | .7481718 .0951195 7.87 0.000 .5617409 .9346027 nigeria | .8517722 .0787585 10.81 0.000 .6974084 1.006136 southafrica | .4453099 .0729434 6.10 0.000 .3023435 .5882763 uganda | 1.404953 .1121234 12.53 0.000 1.185195 1.624711 rwanda | .7747072 .0917355 8.45 0.000 .594909 .9545054 senegal | 1.473084 .0915122 16.10 0.000 1.293724 1.652445 tanzania | .7039367 .0792699 8.88 0.000 .5485706 .8593029 zambia | .2798622 .0884485 3.16 0.002 .1065063 .4532182 _cons | -.6154573 .0868769 -7.08 0.000 -.7857329 -.4451818------------------------------------------------------------------------------
3838
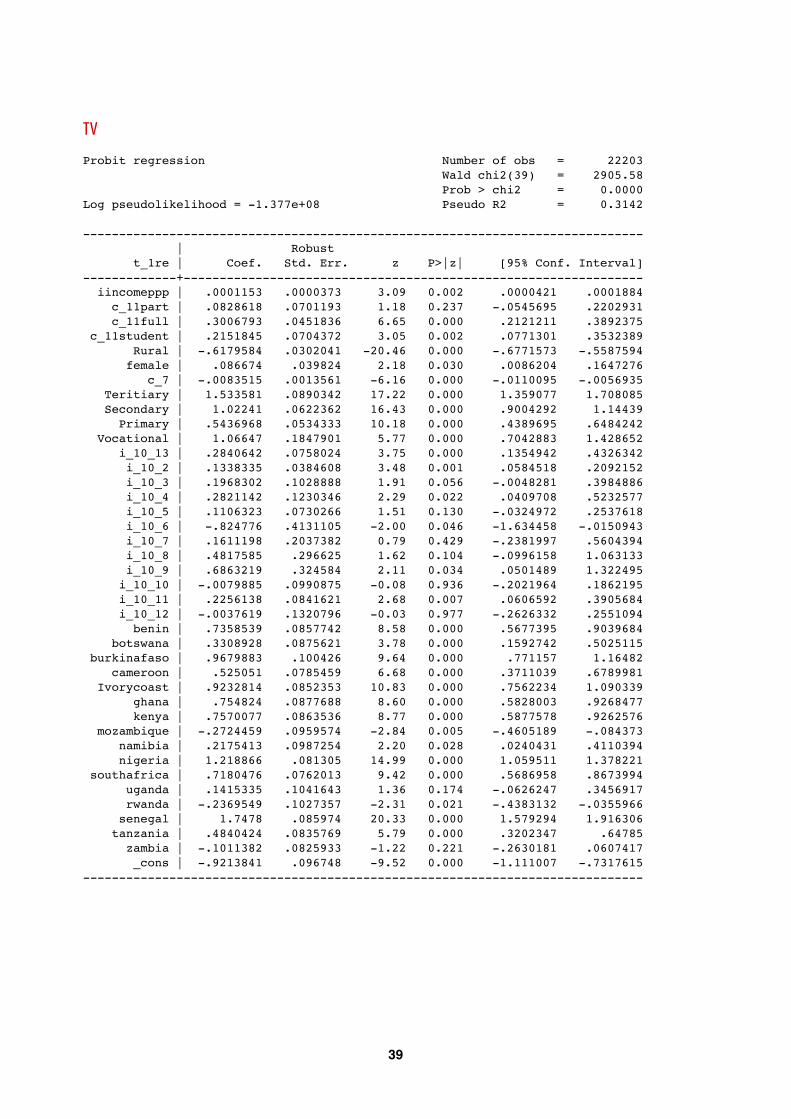
TV
Probit regression Number of obs = 22203 Wald chi2(39) = 2905.58 Prob > chi2 = 0.0000Log pseudolikelihood = -1.377e+08 Pseudo R2 = 0.3142
------------------------------------------------------------------------------ | Robust t_1re | Coef. Std. Err. z P>|z| [95% Conf. Interval]-------------+---------------------------------------------------------------- iincomeppp | .0001153 .0000373 3.09 0.002 .0000421 .0001884 c_11part | .0828618 .0701193 1.18 0.237 -.0545695 .2202931 c_11full | .3006793 .0451836 6.65 0.000 .2121211 .3892375 c_11student | .2151845 .0704372 3.05 0.002 .0771301 .3532389 Rural | -.6179584 .0302041 -20.46 0.000 -.6771573 -.5587594 female | .086674 .039824 2.18 0.030 .0086204 .1647276 c_7 | -.0083515 .0013561 -6.16 0.000 -.0110095 -.0056935 Teritiary | 1.533581 .0890342 17.22 0.000 1.359077 1.708085 Secondary | 1.02241 .0622362 16.43 0.000 .9004292 1.14439 Primary | .5436968 .0534333 10.18 0.000 .4389695 .6484242 Vocational | 1.06647 .1847901 5.77 0.000 .7042883 1.428652 i_10_13 | .2840642 .0758024 3.75 0.000 .1354942 .4326342 i_10_2 | .1338335 .0384608 3.48 0.001 .0584518 .2092152 i_10_3 | .1968302 .1028888 1.91 0.056 -.0048281 .3984886 i_10_4 | .2821142 .1230346 2.29 0.022 .0409708 .5232577 i_10_5 | .1106323 .0730266 1.51 0.130 -.0324972 .2537618 i_10_6 | -.824776 .4131105 -2.00 0.046 -1.634458 -.0150943 i_10_7 | .1611198 .2037382 0.79 0.429 -.2381997 .5604394 i_10_8 | .4817585 .296625 1.62 0.104 -.0996158 1.063133 i_10_9 | .6863219 .324584 2.11 0.034 .0501489 1.322495 i_10_10 | -.0079885 .0990875 -0.08 0.936 -.2021964 .1862195 i_10_11 | .2256138 .0841621 2.68 0.007 .0606592 .3905684 i_10_12 | -.0037619 .1320796 -0.03 0.977 -.2626332 .2551094 benin | .7358539 .0857742 8.58 0.000 .5677395 .9039684 botswana | .3308928 .0875621 3.78 0.000 .1592742 .5025115 burkinafaso | .9679883 .100426 9.64 0.000 .771157 1.16482 cameroon | .525051 .0785459 6.68 0.000 .3711039 .6789981 Ivorycoast | .9232814 .0852353 10.83 0.000 .7562234 1.090339 ghana | .754824 .0877688 8.60 0.000 .5828003 .9268477 kenya | .7570077 .0863536 8.77 0.000 .5877578 .9262576 mozambique | -.2724459 .0959574 -2.84 0.005 -.4605189 -.084373 namibia | .2175413 .0987254 2.20 0.028 .0240431 .4110394 nigeria | 1.218866 .081305 14.99 0.000 1.059511 1.378221 southafrica | .7180476 .0762013 9.42 0.000 .5686958 .8673994 uganda | .1415335 .1041643 1.36 0.174 -.0626247 .3456917 rwanda | -.2369549 .1027357 -2.31 0.021 -.4383132 -.0355966 senegal | 1.7478 .085974 20.33 0.000 1.579294 1.916306 tanzania | .4840424 .0835769 5.79 0.000 .3202347 .64785 zambia | -.1011382 .0825933 -1.22 0.221 -.2630181 .0607417 _cons | -.9213841 .096748 -9.52 0.000 -1.111007 -.7317615------------------------------------------------------------------------------
39

ISSN: 2073-0845