gek terna – company update - axia ventures · gek terna – company update axia research page 2...
TRANSCRIPT
Gek Terna – Company Update
AXIA Research Page 1
GEK TERNA S.A. Construction / Greece
Reuters/Bloomberg: HMrr.AT / GEKTERNA GA
May 12 , 2017
Rebuilding Greece
Rating Buy vs. previous rating Buy
Gek Terna’s performance in 2016 confirmed the excellent momentum in the group’s construction and
renewable activities but importantly signaled the end of a prolonged period of bottom line losses. The
future looks even more promising. Following a 26% GDP contraction between 2008-16 Greece is now
expected to finally enter into a strong growth cycle supported by infrastructure investments mostly financed
by the EU. With the construction activity in Greece having hit its trough in 2010-16, the next period could be
the start of a multi-year recovery for Greece’s construction in our view. Gek Terna having a healthy balance
sheet and a leading position in the market offers one of the most interesting investment stories among
Greek equities. The launch of a series of long awaited infrastructure investments and strong cash flow
streams form the RES subsidiary will be a key catalyst for the name.
We raise our Target Price to EUR 4.70/sh (vs. EUR 3.40/sh previously), pointing to a 40.3% upside. Note that on
our valuation we assume only a fraction of the projects that the company could book in the coming years (the
Kasteli concession that Gek Terna is the sole bidder, would add about EUR 1.5 per share) and no further RES
expansion after 2018. Our estimates call for a FCF yield of 19-26% for 2018-19 vs. a sector average of 7.0-
8.0%. At current levels the stock trades at 4.4x-4.1x EV/EBITDA for 2017-18 and 7.7x-7.4x P/E, representing a
c50% discount to peers across both metrics.
Rebuilding Greece
Greece has remained underinvested for a long period of timing, effectively undermining its growth potentials.
We calculate the investment gap of about EUR 90bn created since the burst of the crisis. In the effort to
spearhead economic growth, construction activities that carry a multiplier of 1.8x will be a key catalyst. With
EU funds of about EUR 20bn in 2014-20 targeting mainly infrastructure investments in Greece and increasing
construction appetite on the private side, we believe we could be in the dawn of a multi-year recovery in
Greek construction.
Leading the market with solid financials
Gek Terna has grown significantly over the years, navigating through the crisis and booking record high
revenues and EBITDA in 2016. The company has a current backlog of EUR 2.5bn and another EUR 800m of
projects to be signed. At the same time its RES subsidiary (Terna Energy-TP EUR 4.50/sh) is about to hit the
1.0GW mark of wind installed capacity with its EBITDA increasing 12.7% CAGR in 2016-19. Additionally the
company’s EUR 175m investment in concession is going to start paying cash dividends as of early 2H17, which
we estimate at about EUR 15-20m per year. The group sits at net cash position (excluding the project related
net debt of EUR 485m of the RES division) while following the completion of RES investment cycle in 2017 FCF
generation is estimated at about EUR 60-80m per year.
Updated estimates
Following the revision of our estimates for the key divisions of construction and wind parks, we adjust our
group forecasts accordingly. We raise our 2017-18 group EBITDA estimates by 15%-20%, driving our EPS
figures sharply higher (+87% in 2017, +47.9% in 2018). All in all we see 2017 EBITDA at EUR 213.8m and net
income at EUR 43.2m, while for 2018 we forecast an EBITDA and net of EUR 228.1m and EUR 45.1m. Strong
FCF generations should be more than adequate to put leverage a declining trend, while we expect dividend
distribution to start in 2018.
EUR m 2015 2016 2017E 2018F 2019F
Revenues 971.8 1,163.5 1,119.4 1,148.1 1,057.8
EBITDA 145.2 246.1 213.8 228.1 217.1
Net Income (14.5) 34.6 43.2 45.1 38.3
EPS (0.14) 0.34 0.42 0.44 0.37
Net Debt/(Cash) 416.6 403.1 610.4 596.3 517.4
Net Debt/EDITDA (x) 2.9 x 1.6 x 2.9 x 2.6 x 2.4 x
P/E (x) n.m. 6.6 x 7.7 x 7.4 x 8.7 x
EV/EBITDA (x) 3.9 x 2.6 x 4.4 x 4.1 x 3.9 x
P/BV 0.3 x 0.4 x 0.5 x 0.5 x 0.4 x Source: AXIA Research, The Company
Target Price (EUR) 4.70
Previous TP 3.40
Current Share Price* (EUR) 3.35
*11 /05/ 2017
Stock Data
Market Cap (EUR m) 331.7
Free Float 75%
EV (EUR m) 944
Num. of Shares (m) 99m (ex-treasury)
Performance 1m 3m 12m
Absolute (%) 27.9 45.7 86.1
ASE General (Abs) 10.7 23.4 24.5
Day avg. no traded shr (k-12m) 92 Price high-12 m (EUR) 3.39
Price low-12m (EUR) 1.62
GEK TERNA is the parent company of the group that is active in construction, renewable energy, thermal energy, real estate and concessions. The Renewable energy activity falls under Terna Energy (39%). The thermal energy division includes 50% and 25% ownership in the plants HERON I and HERON II. The group holds one of the leading positions in their area of activities in Greece and also has established a strong position in key markets in South East Europe in Energy, real estate and construction
Shareholders: York Global Finance 17.35%, Peristeris Giorgos 14.1%, Kampas Nikolaos 10% Argyrios Gkonis - Analyst [email protected] +30 210 7424462 Constantinos Zouzoulas – Head of Research [email protected] +30 210 7424460
-
200,000
400,000
600,000
800,000
1,000,000
1,200,000
1,400,000
1,600,000
0.0
0.5
1.0
1.5
2.0
2.5
3.0
3.5
4.0
Daily Volume Traded
GEK TERNA HOLDING, REAL ESTATE, CONSTRUCTION S.A.
ATHEX Composite Index (Rebased)

Gek Terna – Company Update
AXIA Research Page 2
Investment thesis Get Terna’s performance in 2016 confirmed the excellent momentum in the group’s construction
and renewable activities but importantly signaled the end of a prolonged period of bottom line
losses. With the construction activity in Greece having hit its trough in 2015-16, the next period
could be the start of a multi-year recovery in Greece’s construction in our view. With a healthy
balance sheet and a leading position in the market, Gek Terna offers one of the most interesting
investment stories among Greek equities. Improving macro momentum and a series of long
awaited investments are the key catalysts for the name.
We raise our Target Price to EUR 4.70/sh (vs. EUR 3.40/sh previously), pointing to a 40.3% upside.
Our estimates call for a FCF yield of 19-26% for 2018-19 vs. a sector average of 7.0-8.0%.
Greece has remained underinvested for a long period of time affected by the deep recession. Gross
fixed capital formation for the whole economy during the period 2010-16 averaged about EUR 25bn
per year, 44% below the EUR 46bn per year average of the 2000-10 period. As construction projects
carry an economic multiplier of about 1.8x on the economic activity, the rebuilding of the country
will start from construction. The country with the support of EU Cohesion funds and private sector
participation is expected to significantly boost infrastructure investments. According to EU
Commission estimates in 2017-18 fixed capital investments are expected to increase by 17% per
year during this period, driven by a 25% spending increase from the private economy. At the same
time the regional character and the particularities of the Greek market continue to be a hurdle for
the active involvement of international construction companies thus allowing more space for the
few large local players.
The deep recession that brought the country’s GDP down by about 26% since 2008, has taken a
significant toll on Greek contractors. With a number of contractors effectively out of business or
facing significant financial problems, the number of active domestic players has significantly
narrowed. During the period Gek Terna with a focused strategy has managed to take advantage of
the market conditions and drive its construction revenues up 7.0% CAGR during 2008-16 to reach
the historical high of EUR 954m in 2016, while it’s EBITDA touched EUR 150m last year vs. EUR 36m
in 2008 (+19.3% CAGR). With a current signed backlog of EUR 2.5bn and another EUR 800m of
projects pending to be signed, Gek Terna’s construction activity is expected to be the group’s
profitability driver.
Gek’s wind park subsidiary (40%), Terna Energy, the largest RES producer in the country (TENERGY
GA, TP EUR 4.50/sh), is on course to hit the mark of about 1.0GW of wind installed capacity before
the end of 2018. Currently there are 48MW in Greece in advanced construction while another
155MW in the US and 44MW in Greece are under construction. Upon the completion of these parks
(we estimate 2H2018) Terna Energy shall hold a wind installed capacity of 984MW (57% in Greece,
27% in the US and 13.6% in Eastern Europe) and a total installed capacity of 1.01GW. Upon having
met the 1.0GW mark Terna Energy would have the financial capacity to selectively expand taking
advantage of its strong operational cash flows, focusing mainly in the US market. At the same time
sector M&A activity adds scarcity value to the name that is not currently priced in our view. Find
more details on Terna Energy on our dedicated note Approaching Elysium.
Gek Terna has invested about EUR 175m of equity in three highways concession roads in Greece,
with the final payments made in 2016. Gek Terna holds a 56% stake in Ionia Odos and 50% in Central
Greece highway (E-65) and a minority 17% in Olympia Odos. Upon the long awaited completion of
the projects in early 2H17, the concession with be eligible to distribute cash dividends to
shareholders. With a tenor of up to 2038, Gek is estimated to cumulatively collect about EUR 450m
during the lifetime of the concession that translates to about EUR 20m per year in cash streams
starting in late 2017 based on our estimations. Additionally, the company has been the sole bidder
for the 40 year construction and operating concession of a new airport in Kasteli Crete. Gek is
expected to invest EUR 120m upon awarding of the concession, holding a 60% stake in the project
that we estimate can yield a high digit IRR. Note that concession income is consolidated under the
equity method (income from associates).
Rebuilding Greece
Leading position in the sector
Wind park business at 1.0GW mark
Concessions sweetening the deal.

Gek Terna – Company Update
AXIA Research Page 3
Valuation
Following the revision of our assumptions on the key divisions of construction and renewable, we
revise our SOTP valuation for the Group. We raise our target price to EUR 4.70 per share (from
EUR 3.40/sh previously) looking to a 40.3% upside from current levels.
Based on our estimates the stock currently trades at a 50% discount to our selected contractors
peer universe on P/E and EV/EBITDA terms, while we estimate a strong FCF yield of 18%-26% in
2018-19 vs. a sector average of about 7.5%.
Key themes of our valuation exercise include:
Construction: In terms of projects we include the current signed backlog (EUR 2.5bn) and
additional about EUR 300m of wins per annum during 2018-22 (vs. an average win of EUR
750m during the recessionary 2008-16). Profitability is also cautiously reverted to
historical average levels. Our WACC is now set at 12% (vs. 15% previously) following the
significant spreads decline, while we assume an exit EBITDA multiple of 4.5x. We do not
account for Kasteli project that would add another EUR 0.4-05/sh to our division’s
valuation.
Renewables (Terna Energy): Our DCF valuation takes into account the additions in 2017-
18, with the respective capex deployment and a terminal wind capacity of 984MW, while
we make explicit forecasts up to 2026 (10 year) using an exit EV/EBITDA multiple of 5.5x.
Our WACC is now adjusted lower vs. previously to 9.5% (vs. 11% before) accounting for a
lower risk free rate following the GGB’s performance.
We value concessions at their book value, not including Kasteli project that would add
another EUR 1.0 per share
We account for a 15% holding discount due to group’s structure.
Table 1. Gek Terna SOTP valuation
Division
Method Equity Value
(EUR m) Gek Terna stake
Stake's Equity Value (EUR m)
Value per
Share (€/sh)
Construction DCF 301.1 100% 301.1 3.0
RES DCF 470.5 40.0% 188.2 1.9
Real Estate BV 43.3 100% 43.3 0.4
Industry-Mines BV 27.0 100% 27.0 0.3
Concessions
Ionia BV
57% 109.0 1.1
Olympia BV
17% 34.0 0.3
Central BV
50% 32.0 0.3
Thermal Energy DDM
50% Heron I / 25% Heron II 20.0 0.2
Total 754.6 7.6
(-) Other Net Debt (end-2016)
204.5 -2.1
o/w Concessions
148.5 -1.5
o/w Holding-Mines
56.0 -0.6
NAV 550.1 5.5
Holding Co. Discount
15%
Estimated NAV 467.6
Num of Shares(1)
99.0
Target Price
4.70
Current price 3.35
Upside (%)
40.3%
(1) Excluding treasury shares Source: AXIA Research

Gek Terna – Company Update
AXIA Research Page 4
Table 2. AXIA Research international contractors peers valuation sheet
Company
P/E
EV/EBITDA
P/BV
Div. Yield Net Debt/EBITDA FCF yield
FY2017 FY2018 FY2019 FY2017 FY2018 FY2019 FY2017 FY2018 FY2019 FY2017 FY2018 FY2019 FY2017 FY2018 FY2019 FY2017 FY2018 FY2019
Balfour Beatty plc 22.0 14.0 11.8 12.6 9.0 7.8 2.3 2.1 1.8 1.4% 2.2% 3.1% -0.3 -0.5 -0.9 0.9% 7.4%
Costain Group plc 14.0 13.1 12.6 6.7 6.3 5.9 4.4 3.9 3.5 3.1% 3.4% 3.7% -2.0 -2.0 -1.9 -4.5% 5.5% 5.1%
Sacyr, S.A. 7.0 5.7 4.5 15.1 13.6 13.1 0.6 0.6 1.2% 1.5% 2.5% 8.0 8.0 7.3 5.4% 6.2%
Skanska AB (publ) 16.0 16.7 16.2 9.4 9.5 8.7 3.1 2.9 2.8 3.9% 3.7% 4.3% -0.8 -0.8 -0.7 6.3% 6.8% 3.8%
Eiffage SA 15.9 13.8 12.3 8.0 7.7 7.4 1.8 1.7 1.5 2.2% 2.5% 3.1% 4.4 4.1 3.7 8.9% 11.0% 13.1%
Compagnie de Saint-Gobain S.A. 17.2 15.1 13.6 7.8 7.3 6.8 1.4 1.3 1.3 2.6% 2.7% 3.2% 1.2 0.9 0.7 4.8% 5.3% 5.8%
HOCHTIEF Aktiengesellschaft 25.5 23.4 21.6 9.6 9.0 8.5 5.6 4.8 4.4 1.9% 2.1% 2.4% -1.0 -1.0 -1.1 8.4% 4.6% 5.2%
VINCI SA 16.7 15.5 14.6 9.1 8.8 8.3 2.5 2.3 2.1 3.0% 3.2% 3.4% 2.0 1.6 1.3 7.5% 7.8% 8.8%
Ferrovial, S.A. 32.7 32.2 27.1 20.2 20.2 18.9 2.6 2.5 2.4 3.9% 4.0% 4.1% 4.5 4.6 4.6 2.6% 3.2% 4.7%
ACS 14.1 13.5 12.8 6.5 6.2 6.0 2.7 2.4 2.2 3.5% 3.7% 4.1% 0.4 0.4 8.1% 8.9% 9.9%
Fomento de Construcciones 22.1 19.0 16.7 8.4 8.1 7.9 3.0 2.6 0.0% 0.3% 1.1% 4.2 4.1 3.3 9.3% 5.6% 3.2%
Strabag SE 13.9 13.4 12.6 3.7 3.6 3.7 1.1 1.1 2.9% 3.2% 3.3% -0.8 -1.0 4.7% 7.1% 8.0%
Mota-Engil, SGPS, S.A. 13.4 8.6 8.3 5.6 5.1 5.0 1.3 1.1 3.1% 5.4% 5.1% 3.0 2.6 2.5 16.9% 12.8% 16.4%
Astaldi S.p.A. 5.8 5.3 4.7 5.8 5.9 5.3 0.7 0.7 0.6 3.7% 4.0% 4.1% 2.7 2.8 2.3 22.5% 4.7% 12.0%
Average 16.9 15.0 13.5 9.2 8.6 8.1 2.4 2.1 2.3 2.6% 3.0% 3.4% 1.8 1.7 1.7 7.3% 6.9% 8.0%
Gek Terna S.A. 7.7 7.4 8.7 4.4 4.1 3.9 0.5 0.5 0.4 0.0% 2.4% 2.3% 2.9 2.6 2.4 -48.4% 18.8% 26.2% Source: Capital IQ, AXIA Research
Table 3. AXIA Research global wind sector peers
Mcap
P/E
EV/EBITDA
P/BV
Net Debt/EBITDA
Div. Yield
Company Country (EUR) FY2017 FY2018 FY2019 FY2017 FY2018 FY2019 FY2017 FY2018 FY2019 FY2017 FY2018 FY2019 FY2017 FY2018 FY2019
El.Tech.Anemos* Greece 100.9 10.8 6.7 6.7 7.4 6.0 6.0 0.7 0.6 0.6 4.5 3.2 2.6
Albioma France 536.7 17.0 12.2 12.2 8.6 7.3 7.0 1.4 1.3 1.1 4.8 4.1 4.0 3.3% 4.1% 4.5%
Voltalia SA France 459.3 42.2 20.0 11.3 11.2 7.2 5.0 1.2 1.2 1.1 6.2 6.3 5.1 0.4% 0.9% 2.4%
Falck Renewables S.p.A. Italy 336.9 33.9 29.2 16.0 6.9 6.6 5.9 0.8 0.8 0.8 4.6 4.1 3.8 4.6% 5.0% 5.3%
Saeta Yield, S.A. Spain 745.0 18.3 17.8 17.3 8.8 9.3 9.3 1.4 1.6 1.6 5.1 5.0 4.6 8.5% 9.0% 9.0%
EDP Renováveis, S.A.* Spain 6,125.3 32.1 28.6 23.9 8.4 7.9 7.4 1.1 1.0 0.9 3.0 2.9 2.9 0.9% 1.0% 1.2%
Energiekontor AG Germany 277.3 18.8 18.8 15.2 6.1 5.7 4.9 3.7 3.5 3.2 2.2 2.8 3.9 4.1% 4.2%
CHORUS Clean Energy AG Germany 360.7 15.5 15.1
9.4 9.3
1.3 1.1
4.7 3.8
3.2% 3.3%
Atlantica Yield plc United Kingdom 1,859.3 16.9 22.5 12.1 9.7 9.2 8.7 1.2 1.1 1.0 7.0 6.6 6.7 6.8% 9.4% 10.5%
Arise AB (publ) Sweden 54.2
10.4 9.0 8.4 6.2 5.6 0.5 0.5 0.5 7.3 4.9 3.8
24.6%
NextEra Energy Partners, LP United States 1,679.2 21.9 19.7 13.2 7.3 6.0 5.0 2.4 2.5 2.3 5.3 4.8 4.3 4.9% 5.6% 6.5%
Pattern Energy Group Inc. United States 1,747.3
39.6 29.2 11.7 10.0 8.6 2.1 1.2 1.9 5.4 4.7 4.5 8.5% 9.1% 9.8%
TransAlta Renewables Inc. Canada 2,302.4 17.5 14.5 13.1 10.3 9.6 10.0 1.7 1.6 1.8 2.3 2.1 2.5 8.8% 9.2% 9.5%
Average
22.3 19.6 14.9 8.8 7.7 7.0 1.5 1.4 1.4 4.8 4.3 4.1 4.9% 7.1% 6.5%
Terna Energy S.A. Greece 344.5 12.8 10.0 8.7 7.8 6.6 5.9 0.9 0.8 0.8 5.2 4.4 3.8 4.1% 5.0% 6.9%
*AXIA Research estimates Source: Capital IQ, AXIA Research

Gek Terna – Company Update
AXIA Research Page 5
Estimates Update
Following the revision of our estimates for the key divisions of construction and wind parks, we
adjust our group forecasts accordingly. We raise our 2017-18 group EBITDA estimates by 15%-20%
vs. previous, driving our EPS figures sharply higher (+87% in 2017, +47.9% in 2018).
Key themes driving our revisions include:
Significantly enhanced construction outlook both in terms of projects as well as
profitability. Current signed backlog at EUR 2.5bn, with additional EUR 800m of projects in
the near term pipeline.
Adjustment of RES division estimates to the updated installation pattern, now including
the 155MW wind park in the US and accounting for a terminal wind capacity of 980MW
(total 1.01GW).
Concession dividend streams of about EUR 15-20m per annum following the completion
of the highways projects by early 2H17.
Higher leverage to support RES expansion.
Table 4. Gek Terna estimates revision
EUR m 2016 2017E 2018F
New Old New-vs-old New Old New-vs-old
Group Revenues 1,163.5 1,119.4 862 29.9% 1,148.1 845.5 35.8%
Construction 954.9 900.0 670 34.3% 900.0 650.0 38.5%
RES 151.0 173.6 167.9 3.4% 200.7 168.5 19.1%
Group EBITDA 252.8 213.8 185.4 15.3% 228.1 190.1 20.0%
Construction 149.8 86.0 49.6 73.4% 77.0 53.0 45.3%
RES 109.0 132.8 131 1.4% 156.1 131.5 18.7%
Net 34.6 43.2 23.1 87.1% 45.1 29.6 52.3% Source: AXIA Research, The Company
Overall we are now looking for group revenues of EUR 1,119m in 2017 (-3.8% y-o-y) mainly on a
5.7% y-o-y decline in construction revenues from the historical highs of 2016. On the EBITDA line,
we expect group EBITDA in 2017 to settle at EUR 213.8m (-15.4% y-o-y), following the normalization
on construction profitability vs. the exceptionally strong 2016 that included the accelerated
execution of the Greek highways projects. Note that RES EBITDA contribution to the total rises by
21.8% on increased effective capacity. On the bottom line we call for a 24.8% y-o-y rise in profits to
EUR 43.2m driven by profitability improvements. Note that 2016 EBT included a provision of cEUR
20m for the settlement with the Competition Authority petition (expected to be settled in cash in
2017).
Looking in 2018, we model for a 2.6% y-o-y hike in revenues to EUR 1,148m based on increased RES
output amid stable construction activity contribution. Group EBITDA is seen advancing by 6.7% y-o-y
to EUR 228.1m courtesy of the 17.5% y-o-y increase in RES EBITDA. Below that we expect a
contribution of EUR 15m from highways concessions, to push bottom line at EUR 43.8m (+4.3% y-o-
y), despite the higher depreciation charges due to increased RES assets.
In respect of depreciation note that currently the RES subsidiary, Terna Energy uses a 20y average lifetime assumption for its wind parks. Extensive industry studies have allowed major wind park developers over the last couple of years to extend the average estimated lifetime of their wind parks by 5 years. If Terna Energy was to proceed with a similar 5 year extension, we estimate that depreciation charge would decline by about EUR 10m per annum, moving our bottom line assumptions for the group higher by about 5-6%.
Gek Terna – Company Update
AXIA Research Page 6
Table 5. Gek Terna Group forecasts
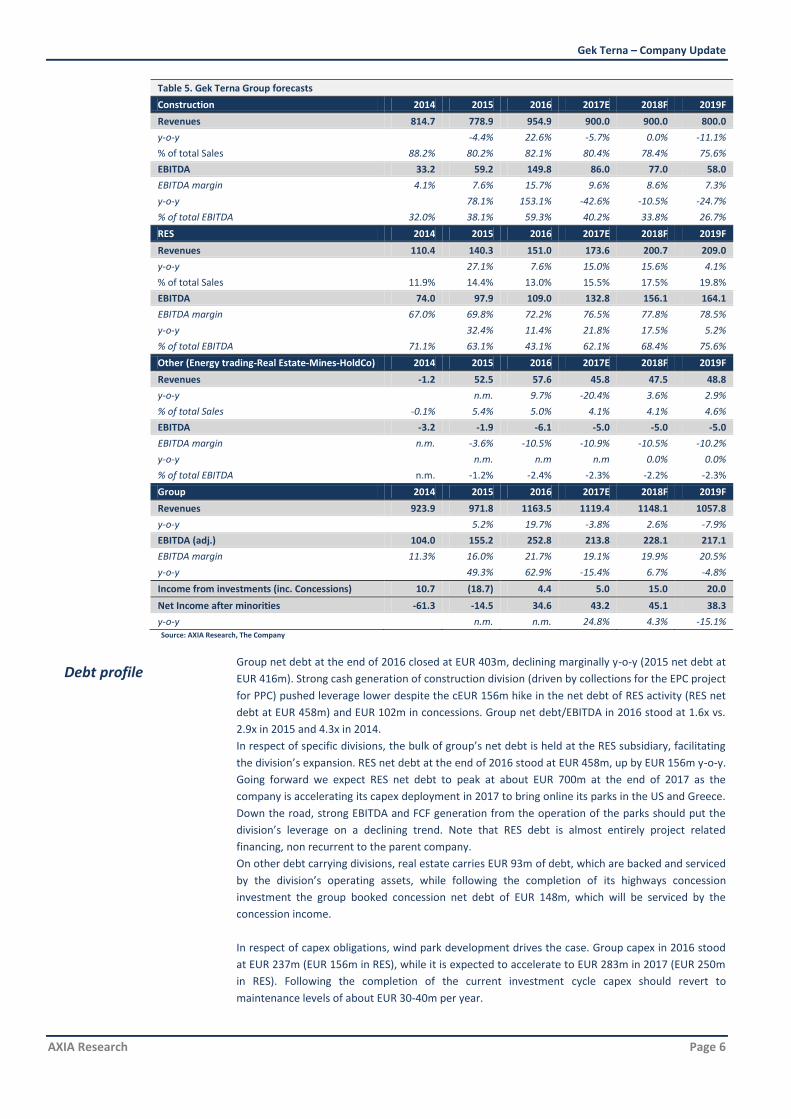
Construction 2014 2015 2016 2017E 2018F 2019F
Revenues 814.7 778.9 954.9 900.0 900.0 800.0
y-o-y -4.4% 22.6% -5.7% 0.0% -11.1%
% of total Sales 88.2% 80.2% 82.1% 80.4% 78.4% 75.6%
EBITDA 33.2 59.2 149.8 86.0 77.0 58.0
EBITDA margin 4.1% 7.6% 15.7% 9.6% 8.6% 7.3%
y-o-y 78.1% 153.1% -42.6% -10.5% -24.7%
% of total EBITDA 32.0% 38.1% 59.3% 40.2% 33.8% 26.7%
RES 2014 2015 2016 2017E 2018F 2019F
Revenues 110.4 140.3 151.0 173.6 200.7 209.0
y-o-y 27.1% 7.6% 15.0% 15.6% 4.1%
% of total Sales 11.9% 14.4% 13.0% 15.5% 17.5% 19.8%
EBITDA 74.0 97.9 109.0 132.8 156.1 164.1
EBITDA margin 67.0% 69.8% 72.2% 76.5% 77.8% 78.5%
y-o-y 32.4% 11.4% 21.8% 17.5% 5.2%
% of total EBITDA 71.1% 63.1% 43.1% 62.1% 68.4% 75.6%
Other (Energy trading-Real Estate-Mines-HoldCo) 2014 2015 2016 2017E 2018F 2019F
Revenues -1.2 52.5 57.6 45.8 47.5 48.8
y-o-y n.m. 9.7% -20.4% 3.6% 2.9%
% of total Sales -0.1% 5.4% 5.0% 4.1% 4.1% 4.6%
EBITDA -3.2 -1.9 -6.1 -5.0 -5.0 -5.0
EBITDA margin n.m. -3.6% -10.5% -10.9% -10.5% -10.2%
y-o-y n.m. n.m n.m 0.0% 0.0%
% of total EBITDA n.m. -1.2% -2.4% -2.3% -2.2% -2.3%
Group 2014 2015 2016 2017E 2018F 2019F
Revenues 923.9 971.8 1163.5 1119.4 1148.1 1057.8
y-o-y 5.2% 19.7% -3.8% 2.6% -7.9%
EBITDA (adj.) 104.0 155.2 252.8 213.8 228.1 217.1
EBITDA margin 11.3% 16.0% 21.7% 19.1% 19.9% 20.5%
y-o-y 49.3% 62.9% -15.4% 6.7% -4.8%
Income from investments (inc. Concessions) 10.7 (18.7) 4.4 5.0 15.0 20.0
Net Income after minorities -61.3 -14.5 34.6 43.2 45.1 38.3
y-o-y n.m. n.m. 24.8% 4.3% -15.1% Source: AXIA Research, The Company
Group net debt at the end of 2016 closed at EUR 403m, declining marginally y-o-y (2015 net debt at
EUR 416m). Strong cash generation of construction division (driven by collections for the EPC project
for PPC) pushed leverage lower despite the cEUR 156m hike in the net debt of RES activity (RES net
debt at EUR 458m) and EUR 102m in concessions. Group net debt/EBITDA in 2016 stood at 1.6x vs.
2.9x in 2015 and 4.3x in 2014.
In respect of specific divisions, the bulk of group’s net debt is held at the RES subsidiary, facilitating
the division’s expansion. RES net debt at the end of 2016 stood at EUR 458m, up by EUR 156m y-o-y.
Going forward we expect RES net debt to peak at about EUR 700m at the end of 2017 as the
company is accelerating its capex deployment in 2017 to bring online its parks in the US and Greece.
Down the road, strong EBITDA and FCF generation from the operation of the parks should put the
division’s leverage on a declining trend. Note that RES debt is almost entirely project related
financing, non recurrent to the parent company.
On other debt carrying divisions, real estate carries EUR 93m of debt, which are backed and serviced
by the division’s operating assets, while following the completion of its highways concession
investment the group booked concession net debt of EUR 148m, which will be serviced by the
concession income.
In respect of capex obligations, wind park development drives the case. Group capex in 2016 stood
at EUR 237m (EUR 156m in RES), while it is expected to accelerate to EUR 283m in 2017 (EUR 250m
in RES). Following the completion of the current investment cycle capex should revert to
maintenance levels of about EUR 30-40m per year.
Debt profile

Gek Terna – Company Update
AXIA Research Page 7
Given the contained debt servicing needs and strong FCF generation after 2017 (we expect FCF of
about EUR 60-80m in 2018-19); we would expect the group to start distributing dividend from 2018
onwards. We model for a total dividend of about EUR 8.0m p.a. starting in 2018.
Table 6. Gek Terna Group net debt breakdown
EUR m 2014 2015 2016 2017E 2018F 2019F
Construction -30.8 -108.3 -380.3 -390.9 -403.3 -423.7
RES 254.5 328.7 485.4 697.8 690.1 626.7
Real Estate 80.8 82.8 93.7 93.8 93.8 93.8
Mine/Industrial 21.4 31.8 38.2 40.3 55.3 70.3
Concessions 41.5 46.5 148.5 150.0 150.0 150.0
Thermal Energy -1.1 -1.3 0.0 0.0 0.0 0.0
Holding 13.3 36.4 17.8 20.0 20.0 20.0
Total 379.7 416.6 403.2 611.0 605.8 537.1
Net Debt/EBITDA (x) 4.3 2.9 1.6 2.9 2.7 2.5
EBIT/Interest expense (x) 0.4 1.5 3.1 2.3 2.4 2.2 Source: AXIA Research, The Company

Gek Terna – Company Update
AXIA Research Page 8
Rebuilding Greece
We believe Greece currently finds itself in what could be the beginning of a multi-year recovery
for its construction activity. With the country lagging both Euro area average and its own recent
historical performance, we calculate that there is an investment gap of about EUR 90bn
accumulated over the last 7 years that should be covered in the medium to longer term. EU
subsidy funds, traditionally geared towards the underdeveloped economies of the union, as well
as private sector participation and the improving State fiscal environment should facilitate the
country’s efforts to bridge the investment gap.
The economic recession that hit the country and striped of 26% of its GDP since 2008 has also taken
a significant toll in the country’s infrastructure. Gross fixed capital formation as % of GDP in Greece
during 2010-16 averaged 13.2% which is almost half of the Euro area (20%) and significantly lower
vs. the 2000-10 average of 23.2% in Greece. This has resulted in a major underinvestment in key
parts of the economy, with Greece currently ranking 26th
among EU countries in terms of
infrastructure quality cording to IMF’s Global Competiveness report.
Chart 1a. Fixed Capital Formation % of GDP (Total Economy) Chart 1b. Quality of infrastructure Index
Source: AMECO, IMF Global Competitiveness report
Chart 2a. Production Index in Industry Chart 2b. Cement consumption in Greece
Source: ELSTAT, Hellenic Cement Industry Association
To this end private sector that accounted for about 80% of the capital investments in Greece in the
last decade, has significantly slowed down its investments that averaged 9.8% of GDP in 2010-16 vs.
18% in 2000-10. In absolute terms fixed capital private sector investments averaged EUR 19m per
year in 2010-16 vs. EUR 35.5bn in 2000-10 (-46%), with the private sector now accounting for c65%
of the capital investments vs. 80% in the last decade and 85% OF THE Euro area average.
Official sector (general government level) investments declined from EUR 10.3bn a year in 2000-10
(5.2% of GDP) by 38.1% to stand at EUR 6.4bn (3.4% of GDP), while they increased their significance
to the economy as they account for 35% of the total investments vs. 25% in the previous decade and
13% of the Euro area. State investments have been significantly supported by EU cohesion funds
(Co-financed projects) that accounted in 2016 for 89% of the total public investment program vs.
66% in 2000-10.
-10.0%
0.0%
10.0%
20.0%
30.0%
Greece - GFCF EU - GFCF EU - Net Fixed Capital Formation GR - Net Fixed Capital Formation
6.1 6
5.9 5.7
5.6 5.6
5.5 5.5
5.2 5.2
5.1 5.1
4.7 4.7
4.6 4.5 4.5
4.4 4.4 4.4
4.3 Greece, 4.2 4.2 4.2
3.9 3.4
4.9
Finaland
Denmark Aurtsria
Luxemburg
Spian
Esthonia
Belgium
Ireland
Slovenia
Hungary
Latvia
Italy
Malta
Bulgaria
Average
0
50
100
150
200
1Q 2Q 3Q 4Q 1Q 2Q 3Q 4Q 1Q 2Q 3Q 4Q 1Q 2Q 3Q 4Q 1Q 2Q 3Q 4Q 1Q 2Q 3Q 4Q 1Q 2Q 3Q 4Q 1Q 2Q 3Q 4Q 1Q 2Q 3Q 4Q
2008 2009 2010 2011 2012 2013 2014 2015 2016
Private sector investments declined…
…with official sector trying to fill in
Gek Terna – Company Update
AXIA Research Page 9
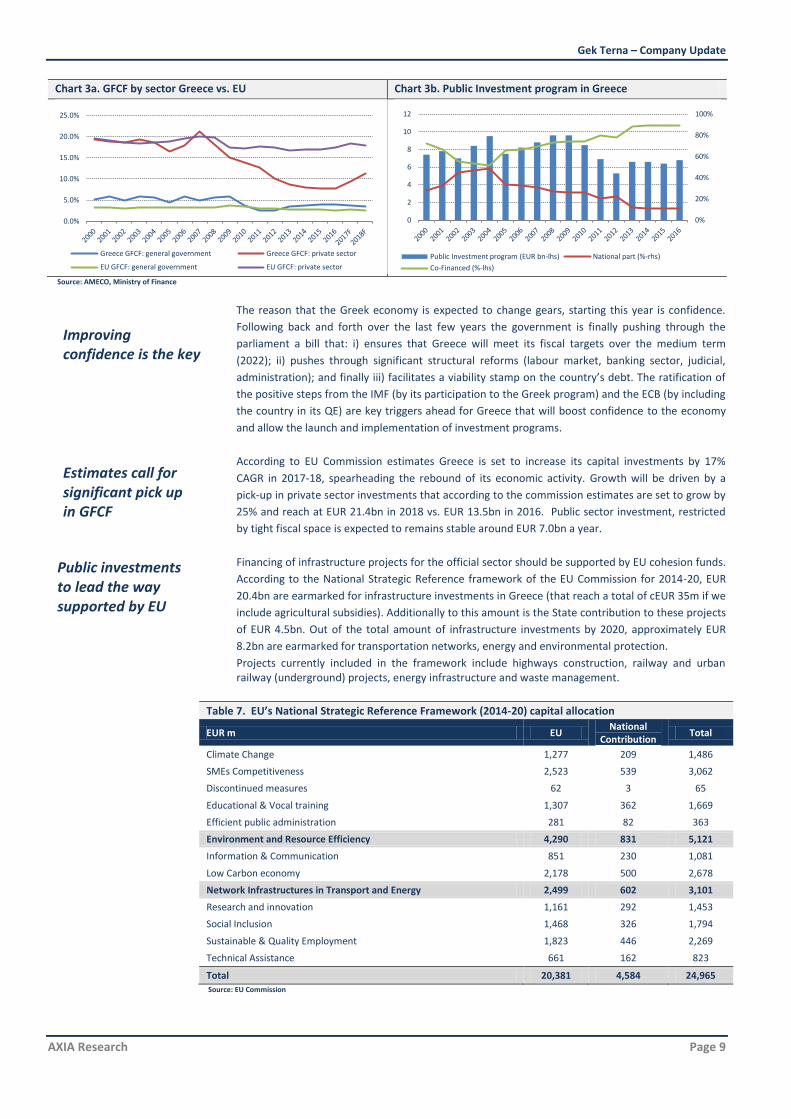
Chart 3a. GFCF by sector Greece vs. EU Chart 3b. Public Investment program in Greece
Source: AMECO, Ministry of Finance
The reason that the Greek economy is expected to change gears, starting this year is confidence.
Following back and forth over the last few years the government is finally pushing through the
parliament a bill that: i) ensures that Greece will meet its fiscal targets over the medium term
(2022); ii) pushes through significant structural reforms (labour market, banking sector, judicial,
administration); and finally iii) facilitates a viability stamp on the country’s debt. The ratification of
the positive steps from the IMF (by its participation to the Greek program) and the ECB (by including
the country in its QE) are key triggers ahead for Greece that will boost confidence to the economy
and allow the launch and implementation of investment programs.
According to EU Commission estimates Greece is set to increase its capital investments by 17%
CAGR in 2017-18, spearheading the rebound of its economic activity. Growth will be driven by a
pick-up in private sector investments that according to the commission estimates are set to grow by
25% and reach at EUR 21.4bn in 2018 vs. EUR 13.5bn in 2016. Public sector investment, restricted
by tight fiscal space is expected to remains stable around EUR 7.0bn a year.
Financing of infrastructure projects for the official sector should be supported by EU cohesion funds.
According to the National Strategic Reference framework of the EU Commission for 2014-20, EUR
20.4bn are earmarked for infrastructure investments in Greece (that reach a total of cEUR 35m if we
include agricultural subsidies). Additionally to this amount is the State contribution to these projects
of EUR 4.5bn. Out of the total amount of infrastructure investments by 2020, approximately EUR
8.2bn are earmarked for transportation networks, energy and environmental protection.
Projects currently included in the framework include highways construction, railway and urban railway (underground) projects, energy infrastructure and waste management.
Table 7. EU’s National Strategic Reference Framework (2014-20) capital allocation
EUR m EU National
Contribution Total
Climate Change 1,277 209 1,486
SMEs Competitiveness 2,523 539 3,062
Discontinued measures 62 3 65
Educational & Vocal training 1,307 362 1,669
Efficient public administration 281 82 363
Environment and Resource Efficiency 4,290 831 5,121
Information & Communication 851 230 1,081
Low Carbon economy 2,178 500 2,678
Network Infrastructures in Transport and Energy 2,499 602 3,101
Research and innovation 1,161 292 1,453
Social Inclusion 1,468 326 1,794
Sustainable & Quality Employment 1,823 446 2,269
Technical Assistance 661 162 823
Total 20,381 4,584 24,965 Source: EU Commission
0.0%
5.0%
10.0%
15.0%
20.0%
25.0%
Greece GFCF: general government Greece GFCF: private sector
EU GFCF: general government EU GFCF: private sector
0%
20%
40%
60%
80%
100%
0
2
4
6
8
10
12
Public Investment program (EUR bn-lhs) National part (%-rhs)
Co-Financed (%-lhs)
Public investments to lead the way supported by EU
Estimates call for significant pick up in GFCF
Improving confidence is the key

Gek Terna – Company Update
AXIA Research Page 10
On the private side, we would expect significant investments to be realized on the tourism and real
estate sectors that are attracting significant interest as well as on projects related to privatization.
Projects should include both greenfield development following the fast tracking of relevant
framework agreements as well as investments towards improving and upgrading existing facilities.
Hellinikon development, a EUR 8.0bn mega investment project on the location of the former Athens
international airport in Athens seafront course is an illustrative case. We would expect construction
works to start in 2018-19, with a big part of the civil engineering projects completed within the first
five years. The plan foresees the development of residences, mall, hotels as well as an urban
recreation park.
On a similar note there are currently on-going a numerous of greenfield hotel projects around the
country’s hospitality industry as well as long awaited revamps. Greek hoteliers are looking to expand
the momentum of the strong tourism demand by up scaling their supply standards and attracting
higher net-worth travelers while extending the tourism season.
On the real estate sector, we note the interest for the greenfield investments that have been
postponed for a period due to the volatile macro environment. At the same time, with real estate
prices showing stabilization signs after a prolonged period, revamping existing facilities would allow
owners to attract interest.
Finally, a sizable backlog is expected from the country’s ambitious privatization program (apart from
Hellinikon). The concession of regional airports to a Fraport led consortium and the sale of Greece’s
railway company to Italian railways, kick-started an investment cycle that is expected to be followed
by port facilities upgrades, logistics facilities and marinas upgrades.
Private sector to follow
Gek Terna – Company Update
AXIA Research Page 11
Construction
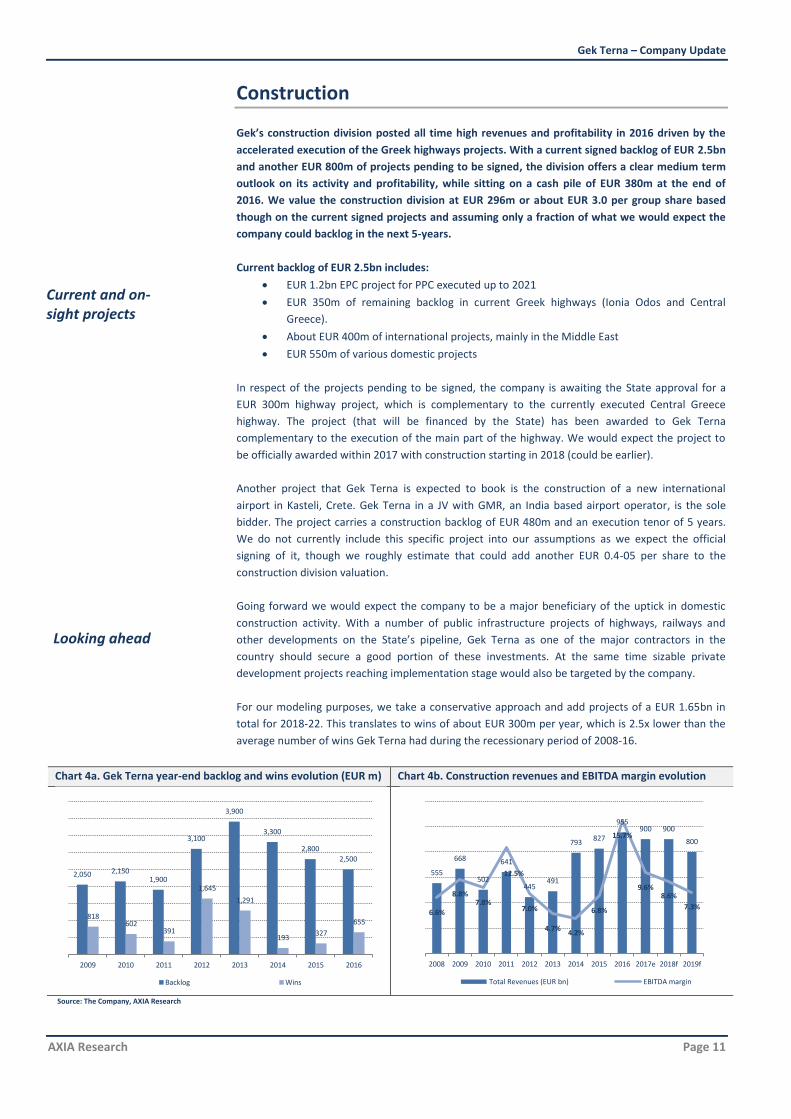
Gek’s construction division posted all time high revenues and profitability in 2016 driven by the
accelerated execution of the Greek highways projects. With a current signed backlog of EUR 2.5bn
and another EUR 800m of projects pending to be signed, the division offers a clear medium term
outlook on its activity and profitability, while sitting on a cash pile of EUR 380m at the end of
2016. We value the construction division at EUR 296m or about EUR 3.0 per group share based
though on the current signed projects and assuming only a fraction of what we would expect the
company could backlog in the next 5-years.
Current backlog of EUR 2.5bn includes:
EUR 1.2bn EPC project for PPC executed up to 2021
EUR 350m of remaining backlog in current Greek highways (Ionia Odos and Central
Greece).
About EUR 400m of international projects, mainly in the Middle East
EUR 550m of various domestic projects
In respect of the projects pending to be signed, the company is awaiting the State approval for a
EUR 300m highway project, which is complementary to the currently executed Central Greece
highway. The project (that will be financed by the State) has been awarded to Gek Terna
complementary to the execution of the main part of the highway. We would expect the project to
be officially awarded within 2017 with construction starting in 2018 (could be earlier).
Another project that Gek Terna is expected to book is the construction of a new international
airport in Kasteli, Crete. Gek Terna in a JV with GMR, an India based airport operator, is the sole
bidder. The project carries a construction backlog of EUR 480m and an execution tenor of 5 years.
We do not currently include this specific project into our assumptions as we expect the official
signing of it, though we roughly estimate that could add another EUR 0.4-05 per share to the
construction division valuation.
Going forward we would expect the company to be a major beneficiary of the uptick in domestic
construction activity. With a number of public infrastructure projects of highways, railways and
other developments on the State’s pipeline, Gek Terna as one of the major contractors in the
country should secure a good portion of these investments. At the same time sizable private
development projects reaching implementation stage would also be targeted by the company.
For our modeling purposes, we take a conservative approach and add projects of a EUR 1.65bn in
total for 2018-22. This translates to wins of about EUR 300m per year, which is 2.5x lower than the
average number of wins Gek Terna had during the recessionary period of 2008-16.
Chart 4a. Gek Terna year-end backlog and wins evolution (EUR m) Chart 4b. Construction revenues and EBITDA margin evolution
Source: The Company, AXIA Research
2,050 2,150 1,900
3,100
3,900
3,300
2,800
2,500
818 602
391
1,645
1,291
193 327
655
2009 2010 2011 2012 2013 2014 2015 2016
Backlog Wins
555
668
502
641
445 491
793 827
955 900 900
800
6.6%
8.8% 7.8%
12.5%
7.0%
4.7% 4.2%
6.8%
15.7%
9.6% 8.6%
7.3%
0.0%
2.0%
4.0%
6.0%
8.0%
10.0%
12.0%
14.0%
16.0%
18.0%
0
200
400
600
800
1000
1200
2008 2009 2010 2011 2012 2013 2014 2015 2016 2017e 2018f 2019f
Total Revenues (EUR bn) EBITDA margin
Current and on-sight projects
Looking ahead
Gek Terna – Company Update
AXIA Research Page 12
In respect of profitability, 2016 yielded a whopping 15.7% construction EBITDA margin, vs. 6.8% in
2015, and an average of 7.3% in 2008-15. We understand that the hike in profitability is mainly
attributed to the accelerated execution of the Greek highways projects. Recall that following a
slowdown of the execution pace during the volatile 1H15 the construction works were accelerated
in order to be completed by the end of the deadline at the end of 1Q17 while the contractors were
offered financial incentives.
We expect the EBITDA margin to gradually revert to normalized levels following the completion of
the highways projects in 1H17. Regarding the new projects bidding, we pencil in that they will come
at a margin close to the division’s historical average, signaling though as an upside risk for
profitability the fact that due to its leading market position in the sector and healthy financials Gek
Terna could achieve improved pricing terms.
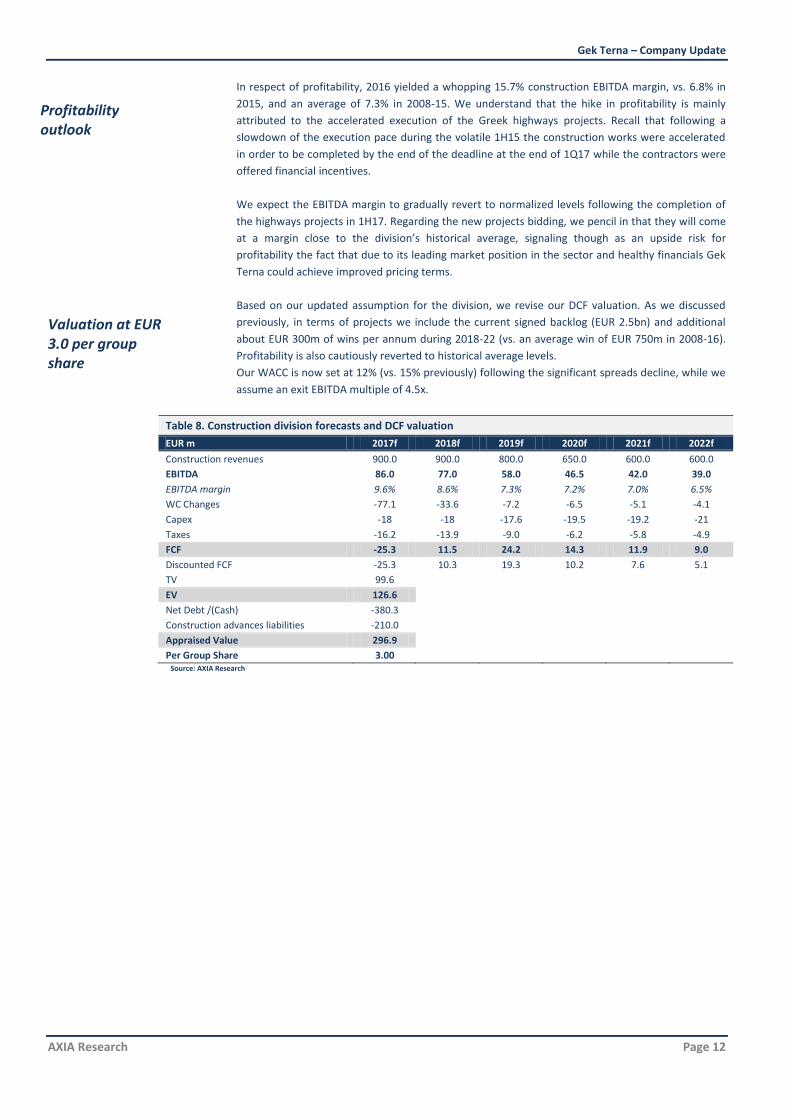
Based on our updated assumption for the division, we revise our DCF valuation. As we discussed
previously, in terms of projects we include the current signed backlog (EUR 2.5bn) and additional
about EUR 300m of wins per annum during 2018-22 (vs. an average win of EUR 750m in 2008-16).
Profitability is also cautiously reverted to historical average levels.
Our WACC is now set at 12% (vs. 15% previously) following the significant spreads decline, while we
assume an exit EBITDA multiple of 4.5x.
Table 8. Construction division forecasts and DCF valuation
EUR m 2017f 2018f 2019f 2020f 2021f 2022f
Construction revenues 900.0 900.0 800.0 650.0 600.0 600.0
EBITDA 86.0 77.0 58.0 46.5 42.0 39.0
EBITDA margin 9.6% 8.6% 7.3% 7.2% 7.0% 6.5%
WC Changes -77.1 -33.6 -7.2 -6.5 -5.1 -4.1
Capex -18 -18 -17.6 -19.5 -19.2 -21
Taxes -16.2 -13.9 -9.0 -6.2 -5.8 -4.9
FCF -25.3 11.5 24.2 14.3 11.9 9.0
Discounted FCF -25.3 10.3 19.3 10.2 7.6 5.1
TV 99.6
EV 126.6
Net Debt /(Cash) -380.3
Construction advances liabilities -210.0
Appraised Value 296.9
Per Group Share 3.00
Source: AXIA Research
Valuation at EUR 3.0 per group share
Profitability outlook

Gek Terna – Company Update
AXIA Research Page 13
Wind parks (Terna Energy)-Approaching Elysium
Gek’s wind park subsidiary (40% owned by the group), Terna Energy, is speeding up its capacity
additions, planning to bring online at least 246MW in 2017-18 (of which 155MW in the US), to
reach a total installed wind capacity of 984MW (total installed 1,010MW including 26.5MW of
operating small hydro and solar). The new additions, accompanied with the full operation of Agios
Georgios hybrid park in Greece (73MW) in 2017, are expected to drive the division’s EBITDA up by
12.7% CAGR in 2016-19 to reach EUR 165m in 2019 from EUR 116m in 2016.
Terna Energy screens attractively vs. peers, trading at EV/MW of 0.83x for end-2017 capacity vs. a
sector average of 1.4x. Based on our profitability assumptions, Terna Energy trades at a 50%
discount to peers on P/E terms and 15% discount on EV/EBITDA.
We update our DCF for Terna Energy now estimating a value of EUR 470m for the total company,
or EUR 1.8 per Gek Terna share.
In respect of installations in Greece, the company is in the last construction stages of 48MW in
Greece’s mainland (Dervenoxoria), while according to management some of this capacity is already
in operation. We model this park to come online in 2H17.
At the same time another park of 44MW has started construction in Northern Greece (Vermio).
According to the management this park should be commissioned in early 2018.
The capex for these parks amounts to approximately EUR 120m and is spilt in 2016-17. In respect of
financing structure, the company’s equity contribution will cover about 30% of the total investment,
with the remaining covered by bank debt on a project basis.
By the end of 2017 Terna Energy is planning to bring online its new 155MW Fluvana I park in the US
in Scurry County, Texas. Note that this is the second park for the company is the US as it operates a
138MW wind park in Elmore County, Idaho as of 2012.
The park upon its operation is expected to generate about EUR 17m of EBITDA per annum, taking
advantage of the very strong wind dynamics in the area (load factor at 45%). The total investment
for the park stands at USD 250m. Part of the designated capex was spent in 2016, with the larger
portion though invested in 2017.
Fluvanna I is owned and will be operated by Terna Energy. Copenhagen Infrastructure Partners (CIP-
PensionDanmark) is investing USD 61m to the project, while subject to satisfaction of certain
conditions precedent Goldman Sachs will make an equity investment in the holding company that
owns the project following the commencement of commercial operations of the project. Financing
during construction will be covered, through loans by a group of banks.
Moreover Terna Energy has acknowledged that CIP has also expressed interest to invest in Fluvanna
II (130MW wind) under a similar financing structure. It is to our understanding that upon the final
decision for the implementation of the project (capex at about USD 250m again), the construction
could be completed in a very short time (6-months). We do not include this project to our model at
this point. We estimate that if the project goes ahead it will generate about EUR 15m of EBITDA per
annum.
Chart 5a. Terna Energy Wind Installed Capacity Evolution (MW) Chart 5b. Financial performance (EUR m)
Source: The Company, AXIA Research
263 394
559 56
102
102
30
30
30 138
293.4
349
664
984.4
2011 2015 2018F
Greece Poland Bulgaria US
46.5
140.3
200.7
32.6
102.8
157.6
70.1%
73.3%
78.5%
64.0%
66.0%
68.0%
70.0%
72.0%
74.0%
76.0%
78.0%
80.0%
0.0
50.0
100.0
150.0
200.0
250.0
2011 2015 2018F
RES Revenues EBITDA EBITDA margin
1.0GW on sight
Focus turning to US

Gek Terna – Company Update
AXIA Research Page 14
Upon having met the 1.0GW mark Terna Energy will have the financial capacity to selectively
expand taking advantage of its strong operational cash flows. Specifically we expect the focus to
remain in US opportunities taking advantage of the organic FCF generation of EUR 90m per annum
that according to our estimates should allow for capacity growth of about 10% per annum in the
medium to longer term.
We would expect the company to keep its radar open for greenfield investment opportunities in the
US market building upon its existing presence and know how. Although the major renewable energy
producers in the US have accumulated a significant part of the capacity, Terna Energy could focus on
regional medium and small sized projects building upon its presence in the country. As the
management has indicated the company would be looking into projects in the US market with an
IRR of about 13%.
In respect of the RES market in Greece, following the completion of the current under construction
wind parks in 2017-18, we would not expect any other additions in the short term. Following the
framework change (we discuss this in the following section of the report), that effectively calls for
tenders for new capacity based on a feed in premium Terna Energy as the largest player in the
market could selectively target attractive projects, having the financial capacity to proceed to their
implementation.
Taking a more quantitative look on the company’s financial capacity to go after new investments in
Greece and abroad, based on our estimates for the company’s organic FCF in the medium term we
believe Terna Energy could be able to invest about EUR 30-40m of equity per annum into new
projects. This amount, leveraged with the customary terms would allow the company to finance
investments of about 80-100MW per annum, while safely meeting its debt service needs and
allowing for a solid return to the shareholders.
Chart 6. FCF* (EUR m)
*FCF excluding expansion capex Source: AXIA Research, The Company
Wind installed capacity in the country at the end of 2016 reached 2.37GW, increased by 219MW y-
o-y, with the bulk of the new installation located in the mainland. Wind parks in 2016 generated
5.1GWh (+6.5% y-o-y), covering 8.7% of the total demand of the country and accounting for 51% of
the total RES production. The higher output was driven mainly by the new capacity that came online
as stable wind dynamics kept load factor practically unchanged y-o-y at 25.5%.
In respect of market participants, Terna Energy remains the largest producer with wind installed
capacity in the country reaching 460MW (20% of total), followed by Iberdrola (250.8MW), El.Tech.
Anemos (238.6MW) and EDF (238.2MW). It is worth noting that the five biggest wind producers
account for just 50% of the total wind installed capacity in the country.
(40.0)
(20.0)
-
20.0
40.0
60.0
80.0
100.0
120.0
2014 2015 2016 2017e 2018f 2019f 2020f
Looking ahead…
Greek wind market overview

Gek Terna – Company Update
AXIA Research Page 15
4,139 3,688
4,620 5,145
26.77% 22.62%
25.79% 25.47%
6.9% 6.5% 7.9% 8.7%
48.1% 44.3%
49.4% 51.6%
5.00%
25.00%
45.00%
65.00%
-
2,000
4,000
6,000
2013 2014 2015 2016
Output (GWh) Load factor % of total demand % of RES Production
Chart 7a. Wind producers installed capacity (MW) Chart 7b. Wind park generation dynamics
Source: LAGIE, Eletaen, AXIA Research
In respect of market economics, the deficit of the dedicated account for renewable producers at the
end of 2016 stood at about EUR 200m, vs. EUR 84.28m at the end of 2015 and EUR 200m at the end
of 2014. This resulted in a cash conversion cycle of about 7-8 months for RES producers (vs. 5-6
months before). Key factors that drove the deficit higher were the increased RES output and the
decline in SMP that were not followed by increases in the fee paid by the consumers (ETMEAR) by
the Ministry of Energy to bridge the gap. That resulted in delays in the payment of RES producers
that are currently being paid by a delay of about 6-7 months vs. 4-5 months approximately in 2014-
15.
During 2016 the government, following MoU guidelines, drafted and legislated a framework to
balance the RES account within 2017 and automatically monitor its performance going forward.
According to the introduced methodology, electricity suppliers will take up a charge to cover the
deficit (RES fee). The relevant charge will be calculated by the regulator (RAE) for each year based
on the projected deficit and will be paid by the suppliers based on their market share. This,
alongside with the contribution of the “ETMEAR” fee paid by the consumers are expected to balance
the RES account by the end of 2017.
Chart 8. RES account deficit bridge estimates
Source: LAGIE, AXIA Research
Based on our updated capacity expansion plan, we adjust our estimates for Terna Energy and the
RES division accordingly, accounting now for a terminal wind capacity of 980MW in 2018 vs.
880MW previously.
We expect a 15% y-o-y hike in RES sales in 2017 that are seen at EUR 173.6m. The hike is attributed
to the operation of Agios Georgios 73MW hybrid park for the entire year as well as the operation of
48 additional MW that are expected to be operational in 2H17. A further hike of 16% y-o-y is
expected in 2018 courtesy of the operation of the 155MW Fluvana I park the US in 1H18 and the
44MW in Greece later in the year. In respect of group revenues we model for a stable stream on
trading related income (an activity with minimal profitability), while we pencil in construction
0
100
200
300
400
500
600
Terna Energy
Iberdrola Anemos EDF ENEL Green Power
Europe Energy
EREN Group
Protergia PPC RES Other
2016 2015
1,865 1,806
470 367.5
920 949.8
374
66
101
200
200
Total RES compensation Total acount inflows Total RES compensation Total acount inflows
2017e 2016
Market pool ETMEAR RES fee Other Deficit
Greek RES account to balance in 2017 removing a significant concern
Updating estimates
Gek Terna – Company Update
AXIA Research Page 16
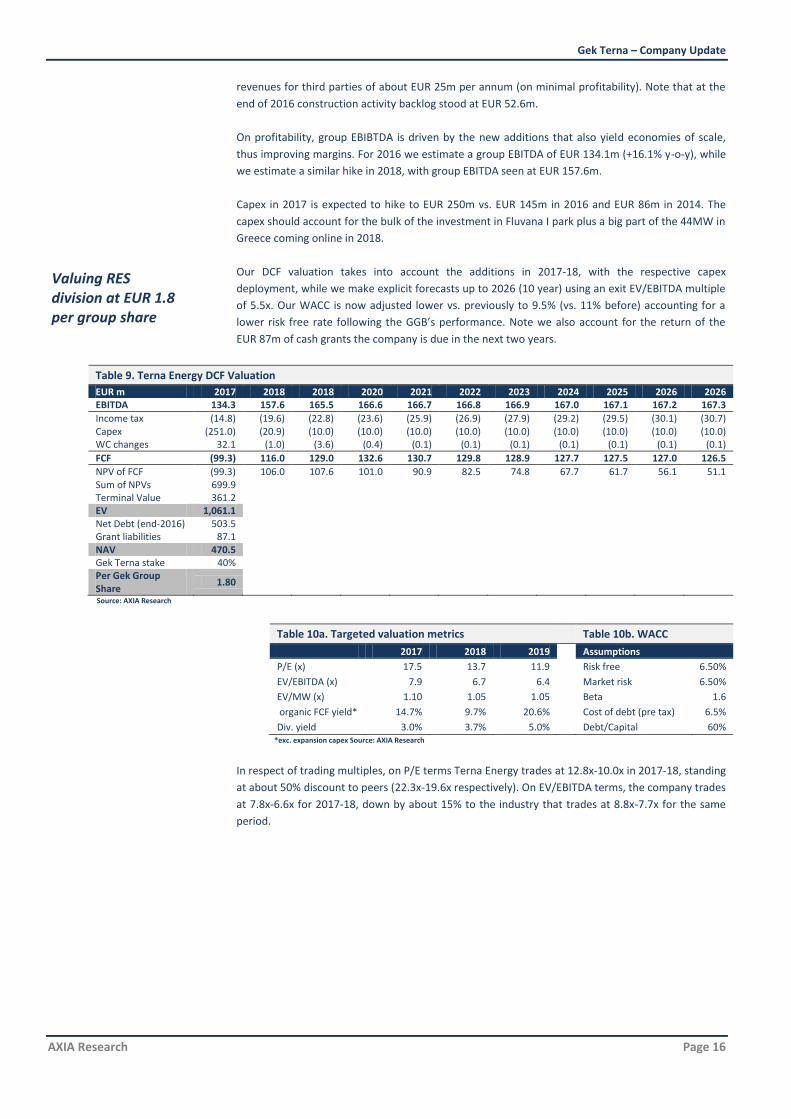
revenues for third parties of about EUR 25m per annum (on minimal profitability). Note that at the
end of 2016 construction activity backlog stood at EUR 52.6m.
On profitability, group EBIBTDA is driven by the new additions that also yield economies of scale,
thus improving margins. For 2016 we estimate a group EBITDA of EUR 134.1m (+16.1% y-o-y), while
we estimate a similar hike in 2018, with group EBITDA seen at EUR 157.6m.
Capex in 2017 is expected to hike to EUR 250m vs. EUR 145m in 2016 and EUR 86m in 2014. The
capex should account for the bulk of the investment in Fluvana I park plus a big part of the 44MW in
Greece coming online in 2018.
Our DCF valuation takes into account the additions in 2017-18, with the respective capex
deployment, while we make explicit forecasts up to 2026 (10 year) using an exit EV/EBITDA multiple
of 5.5x. Our WACC is now adjusted lower vs. previously to 9.5% (vs. 11% before) accounting for a
lower risk free rate following the GGB’s performance. Note we also account for the return of the
EUR 87m of cash grants the company is due in the next two years.
Table 9. Terna Energy DCF Valuation
EUR m 2017 2018 2018 2020 2021 2022 2023 2024 2025 2026 2026 EBITDA 134.3 157.6 165.5 166.6 166.7 166.8 166.9 167.0 167.1 167.2 167.3
Income tax (14.8) (19.6) (22.8) (23.6) (25.9) (26.9) (27.9) (29.2) (29.5) (30.1) (30.7) Capex (251.0) (20.9) (10.0) (10.0) (10.0) (10.0) (10.0) (10.0) (10.0) (10.0) (10.0) WC changes 32.1 (1.0) (3.6) (0.4) (0.1) (0.1) (0.1) (0.1) (0.1) (0.1) (0.1)
FCF (99.3) 116.0 129.0 132.6 130.7 129.8 128.9 127.7 127.5 127.0 126.5
NPV of FCF (99.3) 106.0 107.6 101.0 90.9 82.5 74.8 67.7 61.7 56.1 51.1 Sum of NPVs 699.9
Terminal Value 361.2
EV 1,061.1
Net Debt (end-2016) 503.5
Grant liabilities 87.1
NAV 470.5
Gek Terna stake 40%
Per Gek Group Share
1.80
Source: AXIA Research
Table 10a. Targeted valuation metrics
Table 10b. WACC
2017 2018 2019 Assumptions
P/E (x) 17.5 13.7 11.9 Risk free 6.50%
EV/EBITDA (x) 7.9 6.7 6.4 Market risk 6.50%
EV/MW (x) 1.10 1.05 1.05 Beta 1.6
organic FCF yield* 14.7% 9.7% 20.6% Cost of debt (pre tax) 6.5%
Div. yield 3.0% 3.7% 5.0% Debt/Capital 60% *exc. expansion capex Source: AXIA Research
In respect of trading multiples, on P/E terms Terna Energy trades at 12.8x-10.0x in 2017-18, standing
at about 50% discount to peers (22.3x-19.6x respectively). On EV/EBITDA terms, the company trades
at 7.8x-6.6x for 2017-18, down by about 15% to the industry that trades at 8.8x-7.7x for the same
period.
Valuing RES division at EUR 1.8 per group share

Gek Terna – Company Update
AXIA Research Page 17
Concession portfolio
Following the completion of the Greek highways, Gek Terna will start receiving cash dividend
streams from its EUR 165m equity investment. Beyond that, the prospect of engaging and
completing the Kasteli airport concession, an EUR 120m investment, would significantly enhance
the company’s concession portfolio securing long term, stable and predictable cash streams to the
group that can total up to EUR 40m per year.
We currently do not include Kasteli concession on our estimates and value highways concession
participation at their book value of EUR 175m (EUR 1.8/sh). Kasteli would add another cEUR 1.0 per
share on concession activity valuation.
Table 11. Gek Terna Concession portfolio
Project Status Stake Equity Invested
(EUR m) IRR
Ionian Road Under Construction c56% 109 7.8%
Central Greece Motorway Under Construction c50% 32 7.5%
Olympia Odos Motorway Under Construction 17.0% 34 11.8%
Kasteli Airport Sole bidder 60.0% 120 high single digit(1)
(1) AXIA Research estimates Source: AXIA Research, The Company
Highways concessions were tendered in 2006-07 for the construction and operation of highways in
the mainland of Greece with a total budget at the time of EUR 8.5bn. At that time consortiums of
both Greek and international companies participated in the tenders securing various projects.
Projects would be financed by equity contribution of the concessionaires (c10% of total), Greek and
foreign banks loans (40-50%) and State participation utilizing EU funds.
Following the burst of the crisis projects were halted in early 2010, as the lower revision of traffic
volume projections raised questions over the viability of the projects under the current framework by
the lending banks and concessionaires. Following extensive negotiations in late 2013 the State came
into an agreement with all interested parties on a new framework that should allow the completion
of the projects. Among other cost revisions and cuts in the overall projects to be executed that
brought total const down to EUR 5.5bn and revised the IRR of the projects from 9-10% to c7.0%, a
key element to the revision was the decision of the State to concede the priority in cash payment to
the banks and the concessionaires. More specifically In the initial signed agreements the State was
first in the cash flow chain, so the operator had to pay the State, then opex etc and finally pay
dividend to the other shareholders and the respective obligations to creditors. With the new
agreement, the creditors have moved to the top of the cash flow chain, leaving the Greek State at
the bottom. This secures the self funding of the projects and assumes lower traffic volume risk than
the previous structure.
Table 11a. Highways budget Table 11b. Funding structure of projects
Highway Budget (EUR m) Length (Km)
Ionia 1,057 379
Aegean 943 229
Olympia 2,092 311
Central Greece 1,370 231
Amount (EUR bn) % of total
Private Equity 0.675 12.5%
Debt 1.595 29.4%
EU & EIB 1.65 30.4%
State 1.5 27.7%
Source: AXIA Research, press
Highways concessions were tendered in 2006-07 for the construction and operation of highways in
the mainland of Greece with a total budget at the time of EUR 8.5bn that was split amongst 4
consortiums with the participation of German, French and Spanish companies along with Greek
contractors.
Gek Terna initially participated in Ionia Odos and Central Greece with a 33% stake along with
Ferrovial and ACS, while it held a 17% stake in Olympia Odos. Following the relaunch of the projects
in 2013 the company increased its stake in Ionia and Central Greece taking upon the stakes of its
Spanish partners, currently holding a c56% stake in Ionia and c50% in Central Greece, while it
Greek highways concessions background
Gek Terna investment in highways…

Gek Terna – Company Update
AXIA Research Page 18
maintained stable its stake in Olympia Odos at 17%. The company has currently invested in total
EUR 165m up till now and upon the full completion in early 2H17 total investment should reach EUR
175m.
Upon the completion of the construction works the concession will be enabled to start paying cash
dividends to its shareholders. Note that the 40 year concession period started officially in about
2009 and has a 40 year tenor. According to the date submitted to the parliament with the
restructuring deal, Ionia Odos carries an IRR of 7.76%, Central Greece of 7.49% and Olympia 11.8%.
Taking into account as well the delayed cash payments for the previous years, we estimate that Gek
Terna will receive about EUR 15-20m per year as cash dividends up to 2039. Concessions are
consolidated under the equity method as per by the bylaws the decisions request increased majority
and the income is reported as (income from associates). Note that part of these dividends will be
used to service the cEUR 148m of debt under Gek’s concession division.
In respect of the Kasteli airport concession, Gek Terna has been the sole bidder for the project in a
JV with India based airport operator JMR. The project concerns the greenfield development and 40-
year operating concession of a new international airport in Kasteli, Crete.
According to the bid Gek Terna will hold a 60% stake in the operating concession, while the
company’s construction arm will undertake the development of the project for a budget of EUR
480m. In terms of financing, EUR 200m will come from the concessionaires (Gek to contribute EUR
120m), with the State adding the remaining amount utilizing public investment funds as well as the
State fees from the current nearby operating airport in Heraklio, Crete that will be eventually
decommissioned.
Currently the technical file of the offer has been cleared by the relevant Ministry and the financial
terms are being examined. We would expect relevant in the close period. Note that the project has
a 5 year construction period.
In respect of prospects for the project, although we do not include it at this point in our estimates
we calculate that the airport concession could yield a high single digit IRR for the project. Assuming
the Equity investment of EUR 120m, we would add another cEUR 1.0 per share to the concession
division estimates. Recall that we roughly estimate about another EUR 0.4-0.5 per share for the
construction division from the project.
Crete is the biggest island in the country and a major tourism destination in the Mediterranean. The
two currently operating international airports in Crete host about 20% of the total international
arrivals in the country, with Athens International airport accounting for another c45%. International
air traffic volumes in the island have been outperforming the overall country’s growth rates for a
long time. Yet the relevant infrastructure remained underinvested, with demand urging for
significant upgrade projects.
Chart 9a. Heraklio airport traffic volumes (m passengers) Chart 9b. Heraklio airport traffic volumes % growth
Source: AXIA Research, HCAA
4.0
3.6 3.4
3.9 4.0
5.0 5.2 5.0
4.8 4.8 4.7 4.9
5.3 5.4 5.4 5.1 4.9
5.2 5.1
5.8 6.0 6.1
1994
1995
1996
1997
1998
1999
2000
2001
2002
2003
2004
2005
2006
2007
2008
2009
2010
2011
2012
2013
2014
2015
Domestic International Total
-15%
-10%
-5%
0%
5%
10%
15%
20%
25%
Heracleio Airport Total GR airports
…to generate cumulative cash of about EUR 450m
Kasteli airport concession
Gek Terna – Company Update
AXIA Research Page 19
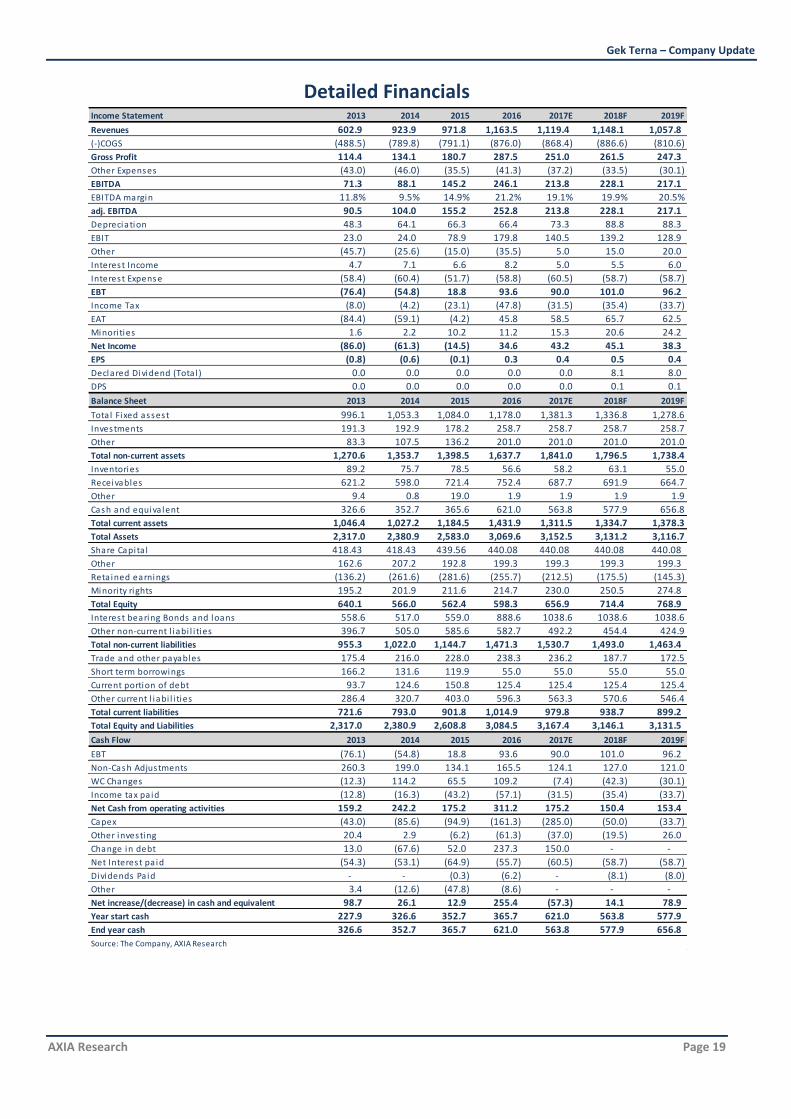
Detailed Financials
Income Statement 2013 2014 2015 2016 2017E 2018F 2019F
Revenues 602.9 923.9 971.8 1,163.5 1,119.4 1,148.1 1,057.8
(-)COGS (488.5) (789.8) (791.1) (876.0) (868.4) (886.6) (810.6)
Gross Profit 114.4 134.1 180.7 287.5 251.0 261.5 247.3
Other Expenses (43.0) (46.0) (35.5) (41.3) (37.2) (33.5) (30.1)
EBITDA 71.3 88.1 145.2 246.1 213.8 228.1 217.1
EBITDA margin 11.8% 9.5% 14.9% 21.2% 19.1% 19.9% 20.5%
adj. EBITDA 90.5 104.0 155.2 252.8 213.8 228.1 217.1
Depreciation 48.3 64.1 66.3 66.4 73.3 88.8 88.3
EBIT 23.0 24.0 78.9 179.8 140.5 139.2 128.9
Other (45.7) (25.6) (15.0) (35.5) 5.0 15.0 20.0
Interest Income 4.7 7.1 6.6 8.2 5.0 5.5 6.0
Interest Expense (58.4) (60.4) (51.7) (58.8) (60.5) (58.7) (58.7)
EBT (76.4) (54.8) 18.8 93.6 90.0 101.0 96.2
Income Tax (8.0) (4.2) (23.1) (47.8) (31.5) (35.4) (33.7)
EAT (84.4) (59.1) (4.2) 45.8 58.5 65.7 62.5
Minori ties 1.6 2.2 10.2 11.2 15.3 20.6 24.2
Net Income (86.0) (61.3) (14.5) 34.6 43.2 45.1 38.3
EPS (0.8) (0.6) (0.1) 0.3 0.4 0.5 0.4
Declared Dividend (Tota l ) 0.0 0.0 0.0 0.0 0.0 8.1 8.0
DPS 0.0 0.0 0.0 0.0 0.0 0.1 0.1
Balance Sheet 2013 2014 2015 2016 2017E 2018F 2019F
Total Fixed assest 996.1 1,053.3 1,084.0 1,178.0 1,381.3 1,336.8 1,278.6
Investments 191.3 192.9 178.2 258.7 258.7 258.7 258.7
Other 83.3 107.5 136.2 201.0 201.0 201.0 201.0
Total non-current assets 1,270.6 1,353.7 1,398.5 1,637.7 1,841.0 1,796.5 1,738.4
Inventories 89.2 75.7 78.5 56.6 58.2 63.1 55.0
Receivables 621.2 598.0 721.4 752.4 687.7 691.9 664.7
Other 9.4 0.8 19.0 1.9 1.9 1.9 1.9
Cash and equiva lent 326.6 352.7 365.6 621.0 563.8 577.9 656.8
Total current assets 1,046.4 1,027.2 1,184.5 1,431.9 1,311.5 1,334.7 1,378.3
Total Assets 2,317.0 2,380.9 2,583.0 3,069.6 3,152.5 3,131.2 3,116.7
Share Capita l 418.43 418.43 439.56 440.08 440.08 440.08 440.08
Other 162.6 207.2 192.8 199.3 199.3 199.3 199.3
Retained earnings (136.2) (261.6) (281.6) (255.7) (212.5) (175.5) (145.3)
Minori ty rights 195.2 201.9 211.6 214.7 230.0 250.5 274.8
Total Equity 640.1 566.0 562.4 598.3 656.9 714.4 768.9
Interest bearing Bonds and loans 558.6 517.0 559.0 888.6 1038.6 1038.6 1038.6
Other non-current l iabi l i ties 396.7 505.0 585.6 582.7 492.2 454.4 424.9
Total non-current liabilities 955.3 1,022.0 1,144.7 1,471.3 1,530.7 1,493.0 1,463.4
Trade and other payables 175.4 216.0 228.0 238.3 236.2 187.7 172.5
Short term borrowings 166.2 131.6 119.9 55.0 55.0 55.0 55.0
Current portion of debt 93.7 124.6 150.8 125.4 125.4 125.4 125.4
Other current l iabi l i ties 286.4 320.7 403.0 596.3 563.3 570.6 546.4
Total current liabilities 721.6 793.0 901.8 1,014.9 979.8 938.7 899.2
Total Equity and Liabilities 2,317.0 2,380.9 2,608.8 3,084.5 3,167.4 3,146.1 3,131.5
Cash Flow 2013 2014 2015 2016 2017E 2018F 2019F
EBT (76.1) (54.8) 18.8 93.6 90.0 101.0 96.2
Non-Cash Adjustments 260.3 199.0 134.1 165.5 124.1 127.0 121.0
WC Changes (12.3) 114.2 65.5 109.2 (7.4) (42.3) (30.1)
Income tax pa id (12.8) (16.3) (43.2) (57.1) (31.5) (35.4) (33.7)
Net Cash from operating activities 159.2 242.2 175.2 311.2 175.2 150.4 153.4
Capex (43.0) (85.6) (94.9) (161.3) (285.0) (50.0) (33.7)
Other investing 20.4 2.9 (6.2) (61.3) (37.0) (19.5) 26.0
Change in debt 13.0 (67.6) 52.0 237.3 150.0 - -
Net Interest pa id (54.3) (53.1) (64.9) (55.7) (60.5) (58.7) (58.7)
Dividends Pa id - - (0.3) (6.2) - (8.1) (8.0)
Other 3.4 (12.6) (47.8) (8.6) - - -
Net increase/(decrease) in cash and equivalent 98.7 26.1 12.9 255.4 (57.3) 14.1 78.9
Year start cash 227.9 326.6 352.7 365.7 621.0 563.8 577.9
End year cash 326.6 352.7 365.7 621.0 563.8 577.9 656.8
Source: The Company, AXIA Research

Gek Terna – Company Update
AXIA Research Page 20
Per share data 2013 2014 2015 2016 2017E 2018F 2019F
EPS (0.84) (0.59) (0.14) 0.34 0.42 0.44 0.37
BVPS 6.21 5.49 5.46 5.81 6.38 6.94 7.46
DPS 0.00 0.00 0.00 0.00 0.00 0.08 0.08
Valuation ratios 2013 2014 2015 2016 2017E 2018F 2019F
P/E n.m. n.m. -10.4 x 6.6 x 7.7 x 7.4 x 8.7 x
EV/EBITDA 11.2 x 6.5 x 3.9 x 2.6 x 4.4 x 4.1 x 3.9 x
EV/EBIT 34.7 x 23.8 x 7.2 x 3.5 x 6.7 x 6.7 x 6.6 x
EV/Sales 1.3 x 0.6 x 0.6 x 0.5 x 0.8 x 0.8 x 0.8 x
P/BV 0.5 x 0.3 x 0.3 x 0.4 x 0.5 x 0.5 x 0.4 x
Div. yield 0.0% 0.0% 0.0% 0.0% 0.0% 2.4% 2.3%
FCF yield 39.9% 83.1% 49.5% 38.8% -44.3% 24.4% 43.9%
ROA -2.6% -0.6% 1.2% 1.4% 1.4% 1.2%
ROE -10.2% -2.6% 6.0% 6.9% 6.6% 5.2%
ROIC -3.3% -0.8% 1.6% 1.9% 1.9% 1.6%
Growth rates 2013 2014 2015 2016 2017E 2018F 2019F
Revenues n.m. 53.2% 5.2% 19.7% -3.8% 2.6% -7.9%
EBITDA n.m. 23.5% 64.8% 69.5% -13.1% 6.7% -4.8%
EBIT n.m. 4.4% 228.2% 127.9% -21.9% -0.9% -7.4%
EBT n.m. n.m. n.m. 397.2% -3.8% 12.2% -4.8%
Net Income n.m. n.m. n.m. -339.6% 24.8% 4.3% -15.1%
Profitability ratios 2013 2014 2015 2016 2017E 2018F 2019F
Gross margin 19.0% 14.5% 18.6% 24.7% 22.4% 22.8% 23.4%
EBITDA margin 11.8% 9.5% 14.9% 21.2% 19.1% 19.9% 20.5%
EBIT margin 3.8% 2.6% 8.1% 15.5% 12.5% 12.1% 12.2%
Net Income margin n.m. n.m. -1.5% 3.0% 3.9% 3.9% 3.6%
Leverage Ratios 2013 2014 2015 2016 2017E 2018F 2019F
LT Debt / Tota l Capita l i ztion 1.53 x 2.48 x 3.42 x 3.70 x 3.00 x 3.00 x 3.00 x
Total Debt / Tota l Capita l i zation 2.29 x 3.82 x 5.23 x 4.49 x 3.54 x 3.54 x 3.54 x
Net Debt/EBITDA 6.40 x 4.31 x 2.87 x 1.64 x 2.85 x 2.61 x 2.38 x
FFO / Tota l Debt n.m. 0.00 x 0.07 x 0.10 x 0.10 x 0.11 x 0.11 x
Gearnig (Tota l debt / Debt+Equity) 0.55 x 0.56 x 0.58 x 0.63 x 0.64 x 0.62 x 0.60 x
Net Debt / Equity 0.71 x 0.67 x 0.74 x 0.67 x 0.93 x 0.83 x 0.67 x
Coverage Ratios 2013 2014 2015 2016 2017E 2018F 2019F
FFO Interest Coverage ((FFO + Int.) / Int.) 47.3% 131.9% 244.6% 331.8% 328.2% 372.4% 362.8%
Pretax Interest Coverage (EBIT / Int.) 42.9% 45.1% 175.0% 355.2% 253.3% 261.7% 244.5%
Source: The Company, AXIA Research

Gek Terna – Company Update
AXIA Research Page 21
Disclosures
General information This research report was prepared by AXIA Ventures Group Limited, a company incorporated under the laws of Cyprus (referred to herein, together with its subsidiary companies and affiliates, collectively, as “AXIA”) which is authorised and regulated by the Cyprus Securities and Exchange Commission (authorisation number 086/07). AXIA is authorized to provide investment services in the United Kingdom, Cyprus, Greece and in Portugal pursuant to its permissions under the Markets in Financial Instruments Directive and may also provide similar services in other countries, inside or outside of the European Union, subject to the applicable provisions. AXIA Ventures Group Limited is not a registered broker-dealer in the United States (U.S.), and, therefore, is not subject to U.S. rules regarding the preparation of research reports and the independence of research analysts. In the U.S., this research report is intended solely for persons who meet the definition of “major U.S. institutional investors” in Rule 15a-6 under the U.S. Securities and Exchange Act, as amended, or persons listed under Rule 15a-6(4)) and is meant to be disseminated only through “Axia Capital Markets LLC”, a wholly owned subsidiary of AXIA Ventures Group Limited and associated US registered broker-dealer in accordance with Rule 15a-6 of the US Securities and Exchange Act. Content of the report The persons in charge of the preparation of this report, the names of whom are disclosed below, certify that the views and opinions expressed on the subject security, issuer, companies or businesses covered by this research report (each a “Subject Company” and, collectively, the “Subject Companies”) are their personal opinions and that no part of their compensation was, is or will be directly or indirectly related to the specific recommendations or views contained in this research report. Whilst all substantial sources of information for the research are indicated in this report, including, without limitation, bases of valuation applied to any security or derivative security, such information has not been disclosed to the Subject Companies for their comments and no such information is hereby certified. All information contained herein is subject to change at any time without notice. No member of AXIA has an obligation to update, modify or amend this research report or to otherwise notify a reader thereof in the event that any matter stated herein, or any opinion, projection, forecast or estimate set forth herein, changes or subsequently becomes inaccurate, or if research on the Subject Company is withdrawn. Further, past performance is not indicative of future results. Persons responsible for this report: Argyrios Gkonis (Analyst), Constantinos Zouzoulas (Head of research). Key Definitions
AXIA Research 12-month rating*
Buy The stock to generate total return** of and above 10% within the next 12-months
Neutral The stock to generate total return**between -10% and 10% within the next 12-months
Sell The stock to generate total return** of and below -10% within the next 12 months
Under Review Stock’s target price or rating is subject to possible change
Restricted Applicable Laws / Regulation and AXIA Ventures Group Limited policies might restrict certain types of communication and investment recommendations
Not Rated There is no rating for the company by AXIA Ventures Group Limited
* Exceptions to the bands may be granted by the Investment Review Committee of AXIA taking into account specific characteristics of the Subject Company **Total return: % price appreciation equals percentage change in share price from current price to projected target price plus projected dividend yield.
Rating history for Gek Terna S.A.
Date Rating Share Price (EUR) Target Price (EUR)
11/03/2014 Buy 3.84 7.00
18/06/2015 Buy 1.46 3.80
19/04/2016 Buy 1.71 3.40
12/05/2017 Buy 3.35 4.70

Gek Terna – Company Update
AXIA Research Page 22
AXIA Ventures Group Limited Rating Distribution as of today
Coverage Universe Count Percent Of which Investment
Banking Relationships Count Percent
Buy 11 61% 1 1 6%
Neutral 2 11%
Sell
Restricted
Not Rated
Under Review 5 28%
Independence and objectivity, conflicts of interest management None of the analysts in charge of this report are involved in activities within AXIA where such involvement is inconsistent with the maintenance of that analyst’s independence or objectivity. None of them has received or purchased shares in any Subject Company prior to any private or public offering of those shares. However, the analysts responsible for the preparation of this report may interact with trading desks or sales personnel for the purpose of gathering and interpreting market information with regard to the Subject Companies. As an investment services provider engaging in a wide range of businesses, AXIA is active in the field of activities which may include the provision of services to issuers of securities, with respect to underwriting or placing of financial instruments or with respect to advice on capital structure, industrial strategy and related matters (“investment banking services”). The nature of such activities, in conjunction with the activity of production and issuance of research reports, may be considered as leading to situations of conflict of interests when the research reports cover an issuer with whom AXIA has an ongoing or has recently had a business relationship for the provision of investment banking services. AXIA has all the necessary internal structures and arrangements in order to identify and avoid or, should avoidance be impossible, to manage such situations in a manner consistent with the highest standards, in accordance with its internal conflicts of interest policy. In compliance with such arrangements, analysts and other staff who are involved in the preparation and dissemination of research (including, without limitation, this report) operate independently of management and the reporting line is separate from AXIA’s investment banking business. “Chinese Wall” procedures (procedures separating the availability of information of any Subject Company) are in place between the investment banking and research businesses to ensure that any confidential and/or price sensitive information is handled appropriately. In all cases when, at the time of preparation or issuance of a report, an issuer covered by such report is in a business relationship with AXIA for the provision of investment banking services, Axia includes a note in the report, drawing the attention of the recipients to such fact. The same note is included when such business relationship has been terminated less than 12 months before the issuance of the report. However, it cannot be fully precluded that issuers covered by a report may be in discussions with AXIA’s investment banking department for a potential future cooperation in investment banking matters, even though a business relationship does not already exist. In such cases AXIA may not be able to announce the fact of such discussions in the reports even if such reports cover the specific issuer. Therefore, even if this research report does not mention any existing or recent business relationship with an issuer whose securities are covered by the report, such issuer may be a potential future customer of AXIA in the field of investment banking services. It is noted that, even in such case, the persons in charge of this report do not participate in any such discussion and their remuneration is not determined based on the proceeds of the department providing investment banking services and that such situation is not reasonably expected to impair the independence or objectivity of AXIA’s reports.
Investment decisions Investors should make their own investment decisions using their own independent advisors as they believe necessary and based upon their specific financial situations and investment objectives when investing. Investors should consult their independent advisors if they have any doubts as to the applicability to their business or investment objectives of the information and the strategies discussed herein. Investments involve risks and recipients should exercise prudence and their own independent judgment in making their investment decisions. Therefore, this research report should not be regarded by recipients as a substitute for the exercise of their own judgment. This research report has no regard to the specific investment objectives, financial situation or particular needs of any specific recipient, even if sent only to a single recipient. This research report is not guaranteed to be a complete statement or summary of any securities, markets, reports or developments referred to in this research report. It is published solely for information purposes. This research report is being furnished to certain persons as permitted by applicable law, and accordingly may not be reproduced or circulated to any other person without the prior written consent of a member of AXIA. This research report may not be relied upon by any retail customers or persons to whom this research report may not be provided by law. It does not constitute a factual representation, a financial promotion or other advertisement, is not to be construed as a solicitation or an offer to buy or sell any securities or related financial instruments in any jurisdiction and may not be relied on in any manner by any recipient. Unauthorized use or disclosure of this research report is strictly prohibited. Investing in any non-U.S. securities or related financial instruments (including ADRs) discussed in this research report may present certain risks. The securities of non-U.S. issuers may not be registered with, or be subject to the regulations of, the U.S. Securities and Exchange Commission. Information on such non-U.S. securities or related financial instruments may be limited. Non-U.S. companies may not be subject to audit and reporting standards and regulatory requirements comparable to those in effect within the United States.

Gek Terna – Company Update
AXIA Research Page 23
No liability Neither AXIA nor any of its directors, officers, employees or agents shall have any liability, however arising, for any error, inaccuracy or incompleteness of fact or opinion in this research report or lack of care in this research report’s preparation or publication, or any losses or damages which may arise from the use of this research report. AXIA does not represent or warrant that any investments will increase in value or generate profits. Any responsibility or liability for any information contained herein is expressly disclaimed. Any opinions or information contained herein is subject to change at any time without notice and may differ from other opinions expressed professionally by persons within AXIA. This material should not be construed as a solicitation or recommendation to use AXIA to effect transactions in any security mentioned herein or as an attempt to induce securities transactions by such recipients in any manner whatsoever. AXIA is not providing this research report pursuant to any express or implied understanding that the recipients will direct commission income to AXIA. Recipients In the countries of the European Union, this report is communicated by AXIA to persons who are classified as eligible counterparties or professional clients and is only available to such persons. In any other country outside the European Union, this report is addressed exclusively to persons entitled to receive research reports from foreign Investment Firms according to the applicable legal and regulatory provisions. The information contained in this research report is not addressed to and does not apply to any other categories of investors than those specified above. AXIA in relation to its research complies with the applicable requirements and laws concerning disclosures and these are indicated on this legend or in the research report where applicable. By accepting this research report, you agree to be bound by the foregoing limitations. This material is not intended for the use of private investors.

Gek Terna – Company Update
AXIA Research Page 24
AXIA Ventures Group
10 G. Kranidiotis, Suite 102
4, Vas. Sofias Ave., 3rd Floor
645 Fifth Avenue, Suite 903
Berkeley Sq. House, Berkeley Sq.
Avenida da Liberdade 240, 4th floor
1065 Nicosia, Cyprus
10674 Athens, Greece New York, NY 10022, US London, W1J 6BD, UK 1250-096 Lisbon, Portugal
Tel: +357 22 742000 Tel: +30 210 7414400 Tel: +1 212 7920255 Tel: +44 20 78876080 Tel: +351 219364444 Fax: +357 22 742001 Fax: +30 210 7414449 Fax: +1 212 7920256 Fax: +44 20 78876001 Fax: +351 966049598
www.axiavg.com
Research
Constantinos Zouzoulas [email protected] +30 210 7414460
Jonas Floriani [email protected] +44 208 068 3516
Argyrios Gkonis [email protected] +30 210 7414462
Maria Almaça [email protected] +351 21 936 44 47
Damiani Papatheodotou [email protected] +357 22 742013
Malene Krogh-Fladmark [email protected] +30 210 7414463
Equity Capital Markets
Thanos Adamantopoulos [email protected] +44 207 9876033
Equity Sales / Trading
Stavros Agrotis [email protected] +357 22 742000
Constantinos Koufopoulos [email protected] +30 210 7414422
Harry Smyrnopoulos [email protected] +30 210 7414425
Maria Mitsouli [email protected] +30 210 7414424
Elias Calfoglou [email protected] +30 210 7414429
Athanasia Markidi [email protected] +30 210 7414428
Ioanna Georgiou [email protected] +30 210 7414427
George Baroumis [email protected] +30 210 7414426