gc05 live longer - milken...
TRANSCRIPT

How to Live Longer and Live Better
Voltaire’s View of Doctors
“Doctors give medicines about which they know little To cure diseases about which they know less To humans about whom they know nothing!”
4
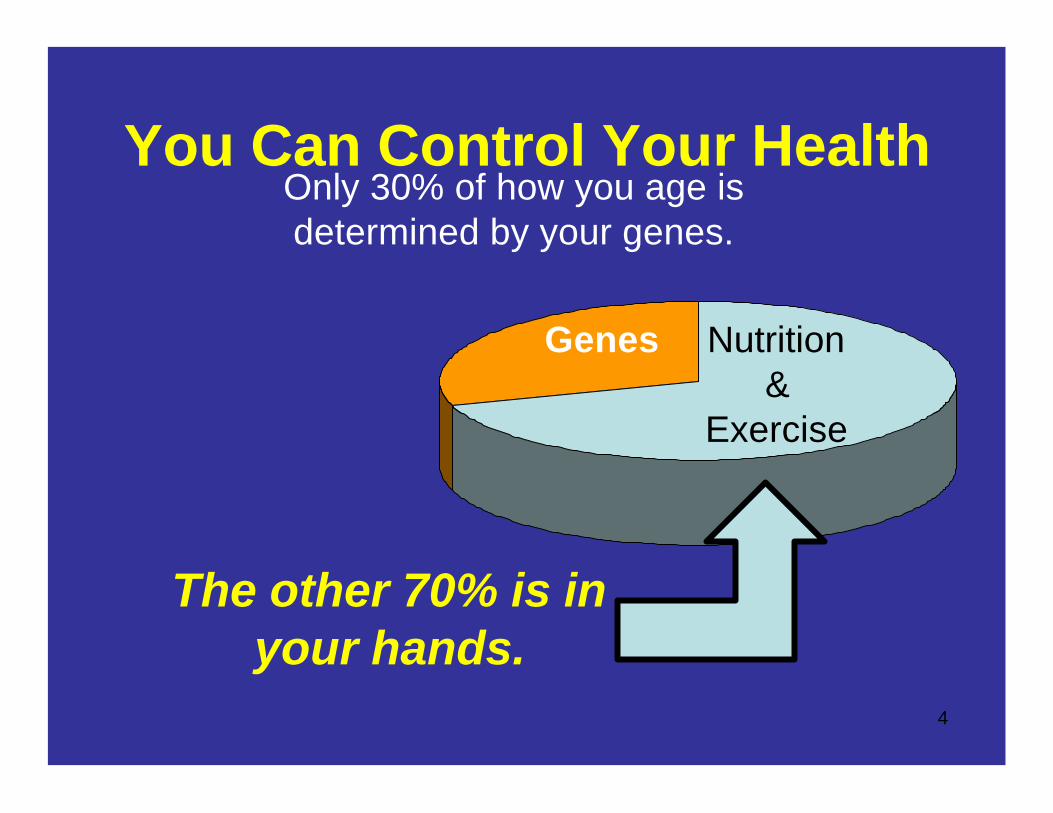
You Can Control Your HealthOnly 30% of how you age isdetermined by your genes.
The other 70% is inyour hands.
Nutrition&
Exercise
Genes
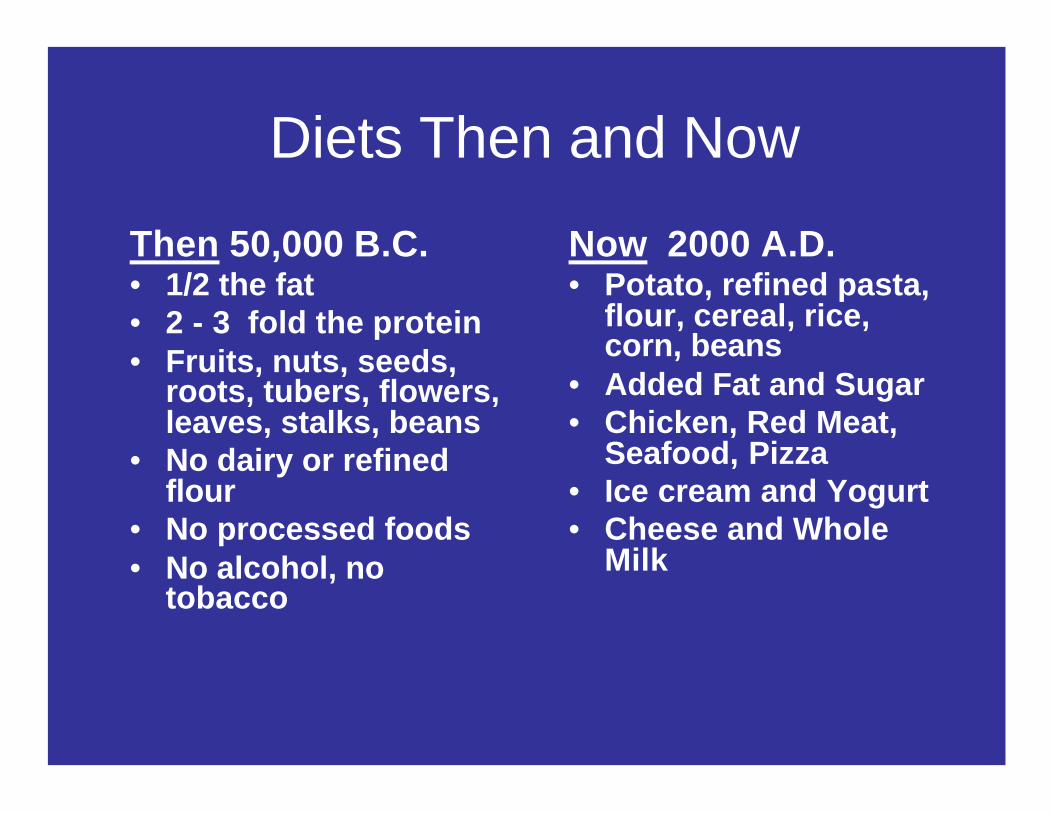
Diets Then and Now
Then 50,000 B.C.• 1/2 the fat• 2 - 3 fold the protein• Fruits, nuts, seeds,
roots, tubers, flowers, leaves, stalks, beans
• No dairy or refined flour
• No processed foods• No alcohol, no
tobacco
Now 2000 A.D.• Potato, refined pasta,
flour, cereal, rice, corn, beans
• Added Fat and Sugar• Chicken, Red Meat,
Seafood, Pizza• Ice cream and Yogurt• Cheese and Whole
Milk
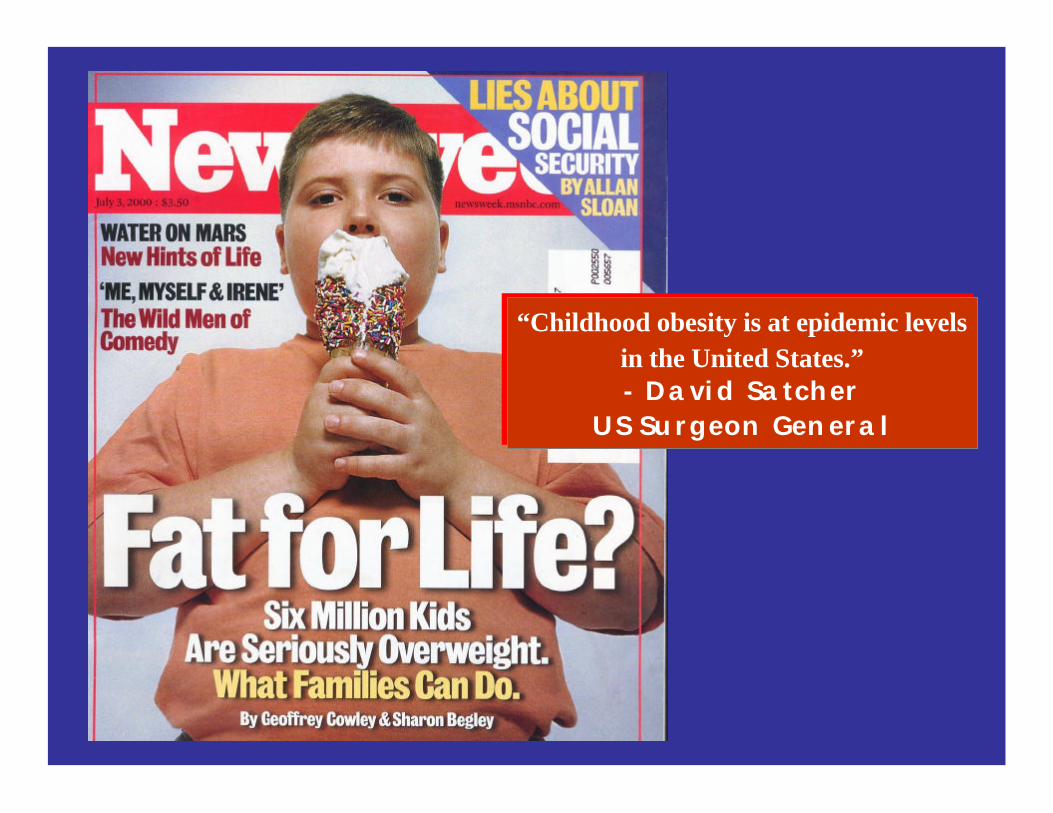
“Childhood obesity is at epidemic levels in the United States.”- David Satcher
US Surgeon General
“Childhood obesity is at epidemic levels in the United States.”- David Satcher
US Surgeon General

Only in Los AngelesOnly in Los Angeles
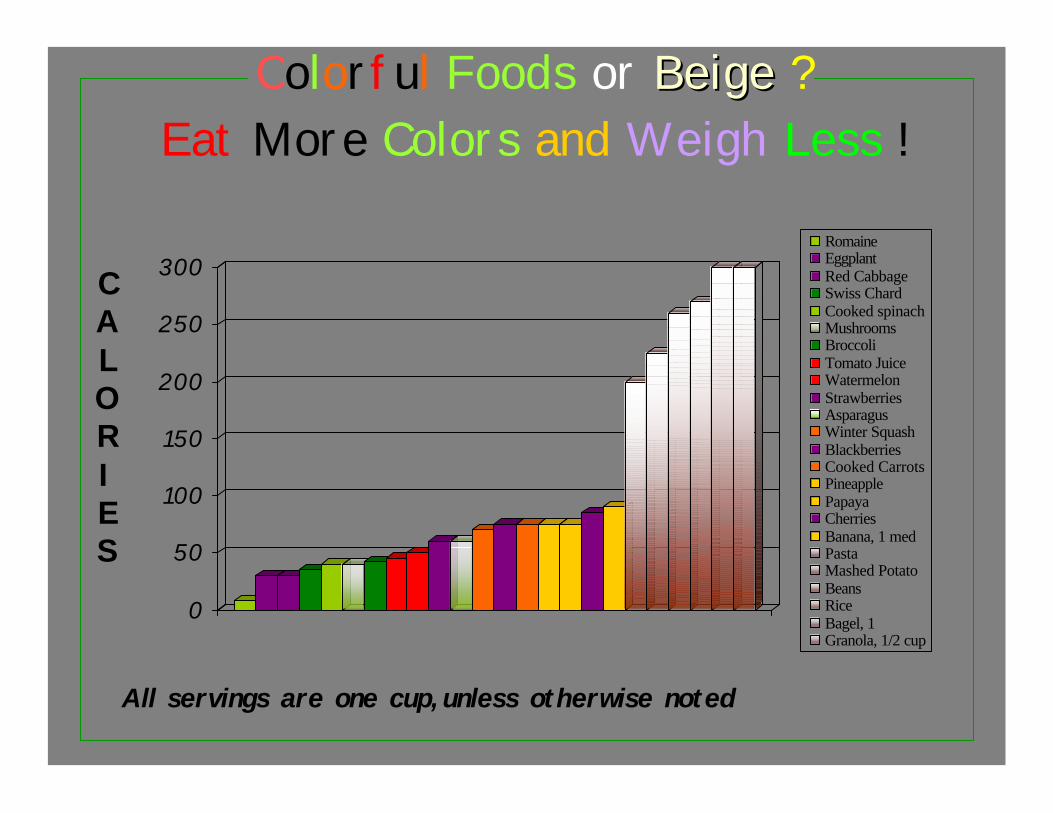
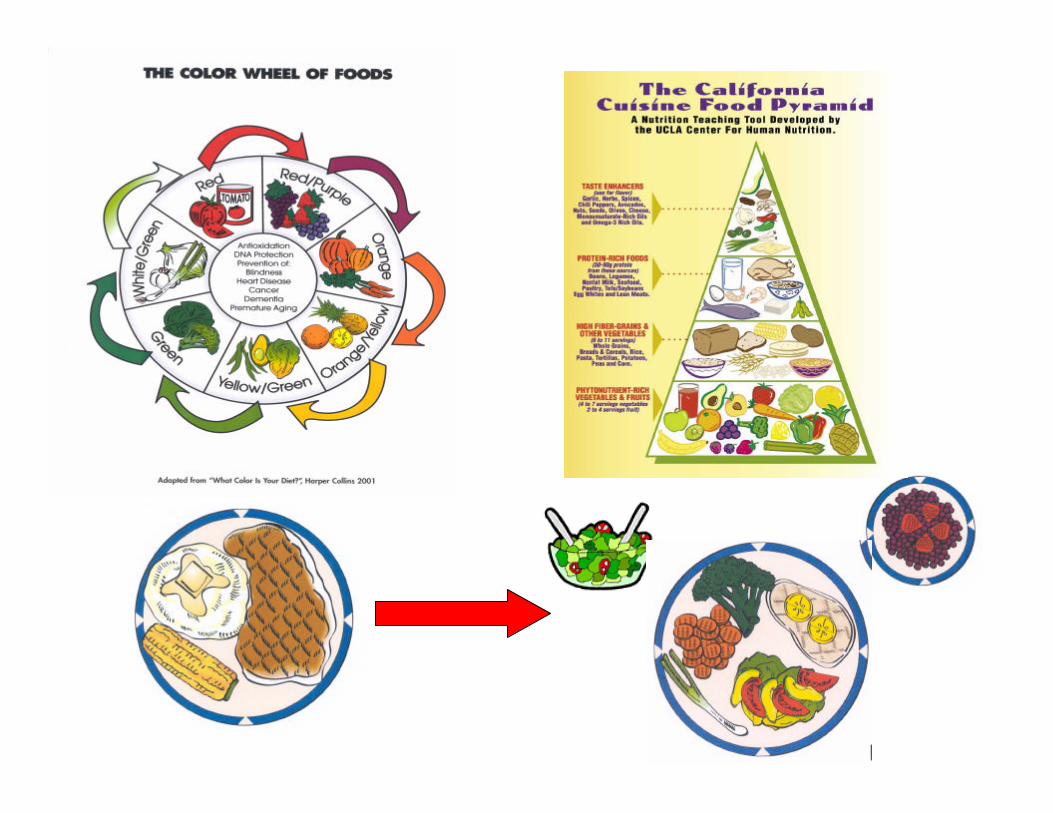
Colorful Foods or Beige Beige ?Eat More Colors and Weigh Less !
0
50
100
150
200
250
300RomaineEggplantRed CabbageSwiss ChardCooked spinachMushroomsBroccoliTomato JuiceWatermelonStrawberriesAsparagusWinter SquashBlackberriesCooked CarrotsPineapplePapayaCherriesBanana, 1 medPastaMashed PotatoBeansRiceBagel, 1Granola, 1/2 cup
All servings are one cup,unless otherwise noted
CALORIES
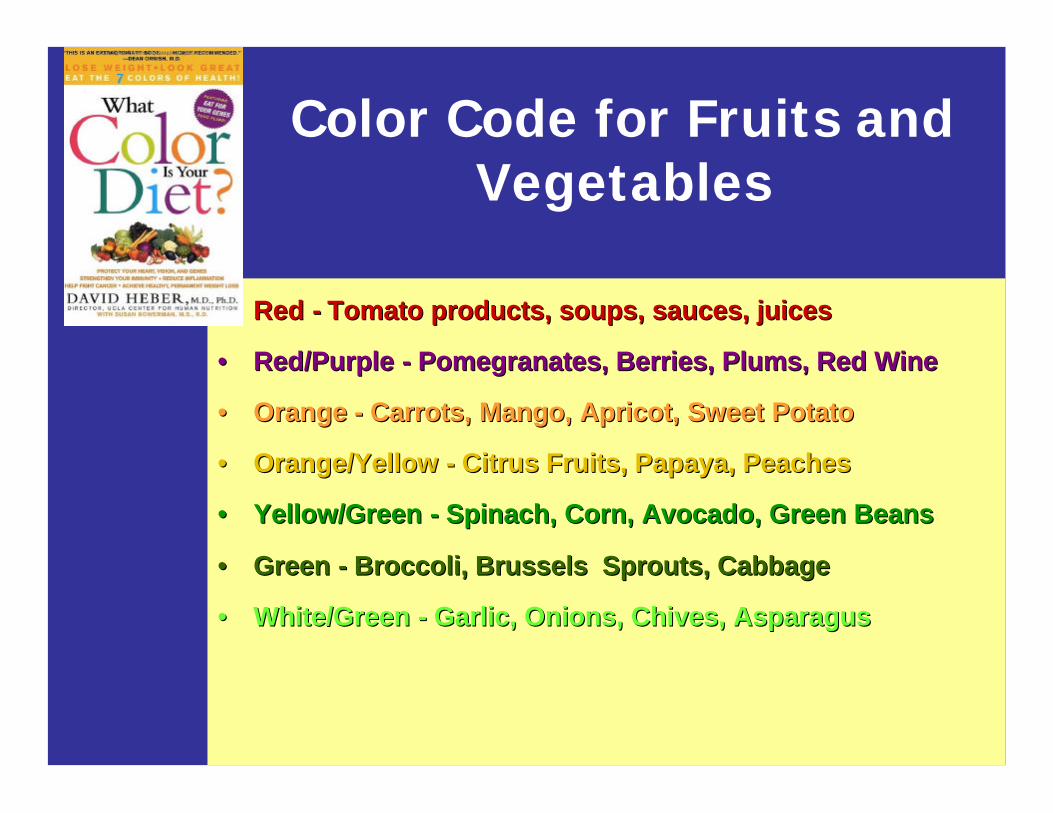
•• Red Red -- Tomato products, soups, sauces, juicesTomato products, soups, sauces, juices
•• Red/Purple Red/Purple -- Pomegranates, Berries, Plums, Red WinePomegranates, Berries, Plums, Red Wine
•• Orange Orange -- Carrots, Mango, Apricot, Sweet PotatoCarrots, Mango, Apricot, Sweet Potato
•• Orange/Yellow Orange/Yellow -- Citrus Fruits, Papaya, PeachesCitrus Fruits, Papaya, Peaches
•• Yellow/Green Yellow/Green -- Spinach, Corn, Avocado, Green BeansSpinach, Corn, Avocado, Green Beans
•• Green Green -- Broccoli, Brussels Sprouts, CabbageBroccoli, Brussels Sprouts, Cabbage
•• White/Green White/Green -- Garlic, Onions, Chives, AsparagusGarlic, Onions, Chives, Asparagus
Color Code for Fruits and Vegetables
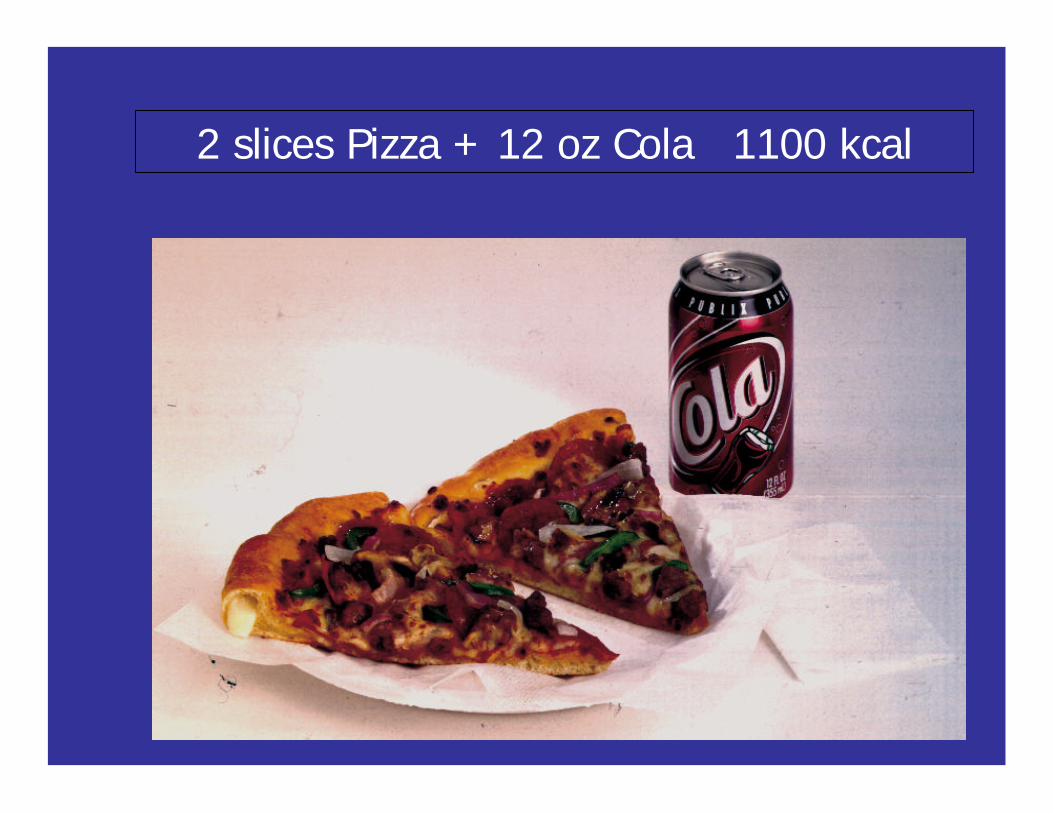
2 slices Pizza + 12 oz Cola 1100 kcal
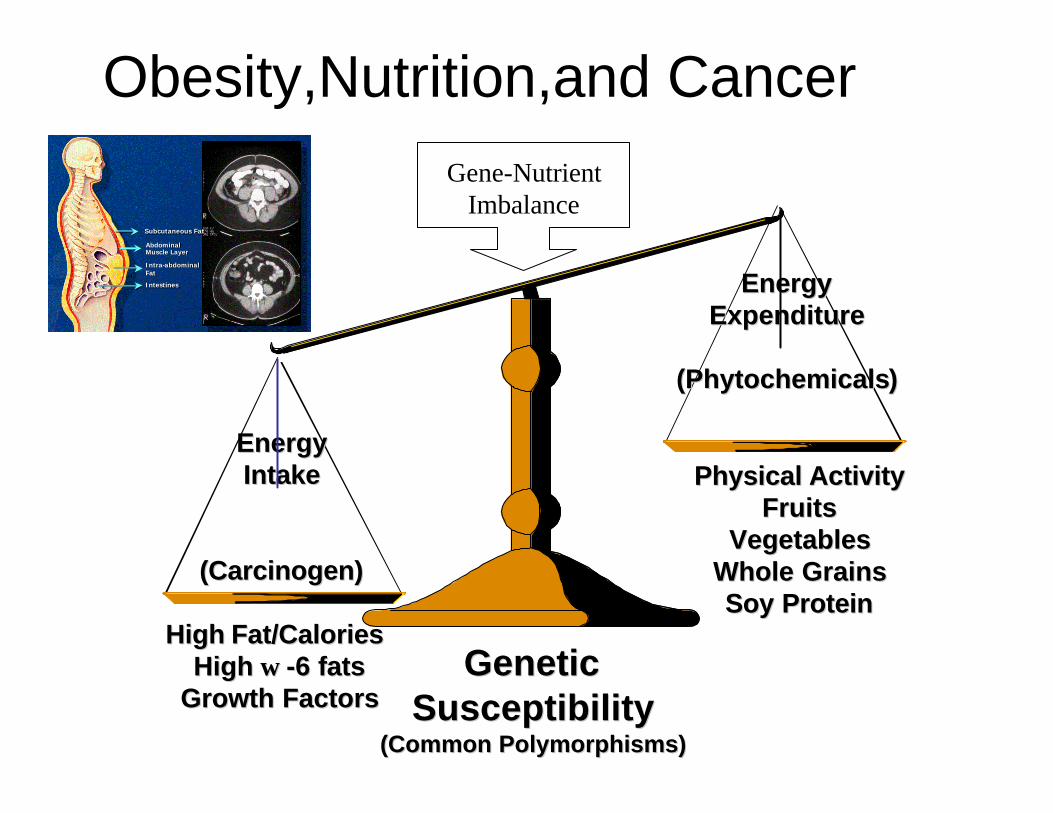
Energy Energy Intake Intake
(Carcinogen)(Carcinogen)
EnergyEnergyExpenditureExpenditure
((PhytochemicalsPhytochemicals) )
High Fat/Calories High Fat/Calories High High ωω --6 fats6 fats
Growth FactorsGrowth FactorsGeneticGenetic
SusceptibilitySusceptibility(Common Polymorphisms)(Common Polymorphisms)
Physical Activity Physical Activity FruitsFruits
VegetablesVegetablesWhole GrainsWhole GrainsSoy ProteinSoy Protein
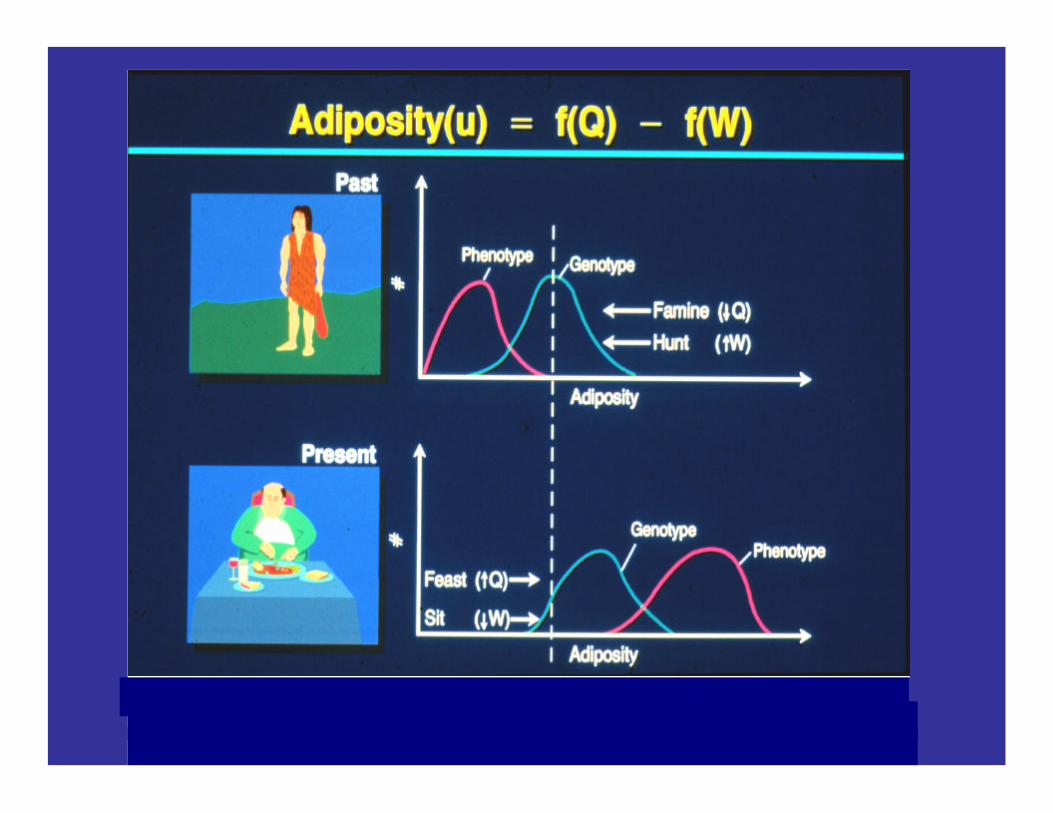
Obesity,Nutrition,and Cancer Gene-Nutrient
Imbalance
6
Subcutaneous FatSubcutaneous Fat
Abdominal Muscle LayerAbdominal Muscle Layer
Intra-abdominal FatIntra-abdominal Fat
IntestinesIntestines
Protein Personalization with Meal Replacements
www.LAShapeDiet.com
Research Paradigms
• Nutrigenetics - the individuality of response to nutrients based on genetics
• Nutrigenomics - the impact of nutrition on gene expression and disease risk.
• Immune Function and Inflammation• Energetics and Obesity - Beyond Diets• Functional Foods, Supplements, and
Botanicals -“Let Food be Your Medicine”
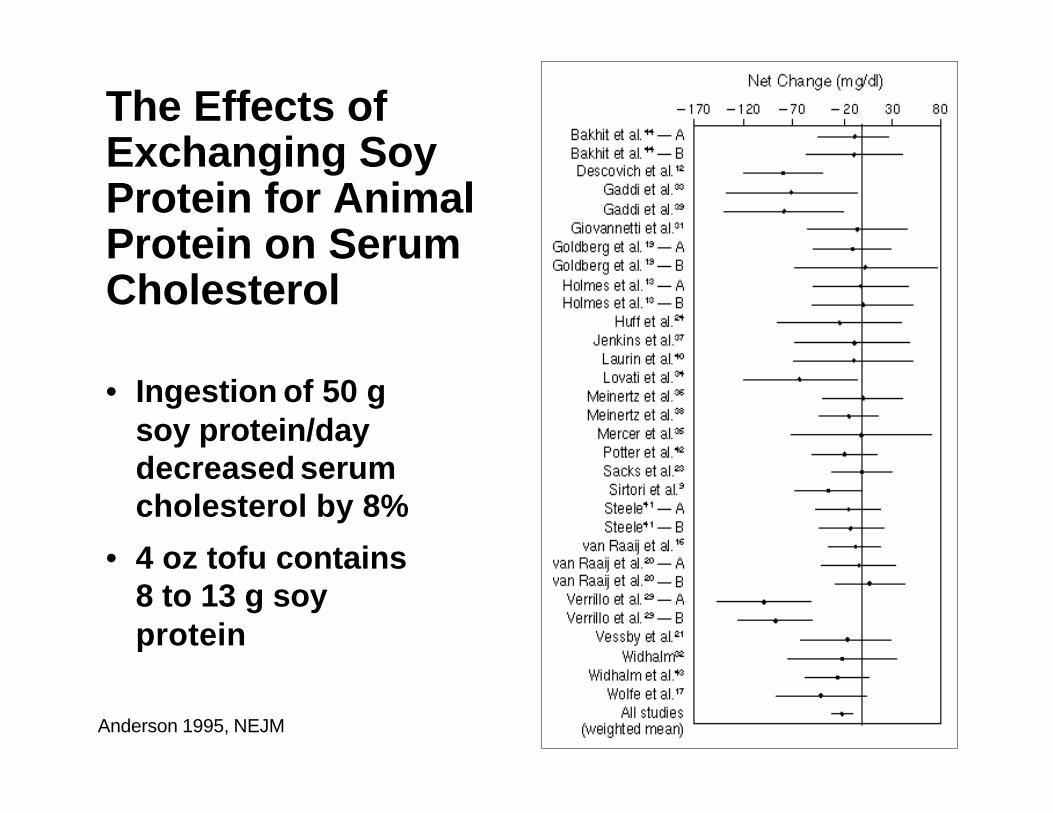
The Effects of Exchanging Soy Protein for Animal Protein on Serum Cholesterol
The Effects of Exchanging Soy Protein for Animal Protein on Serum Cholesterol
• Ingestion of 50 g soy protein/day decreased serum cholesterol by 8%
• 4 oz tofu contains 8 to 13 g soy protein
Anderson 1995, NEJM
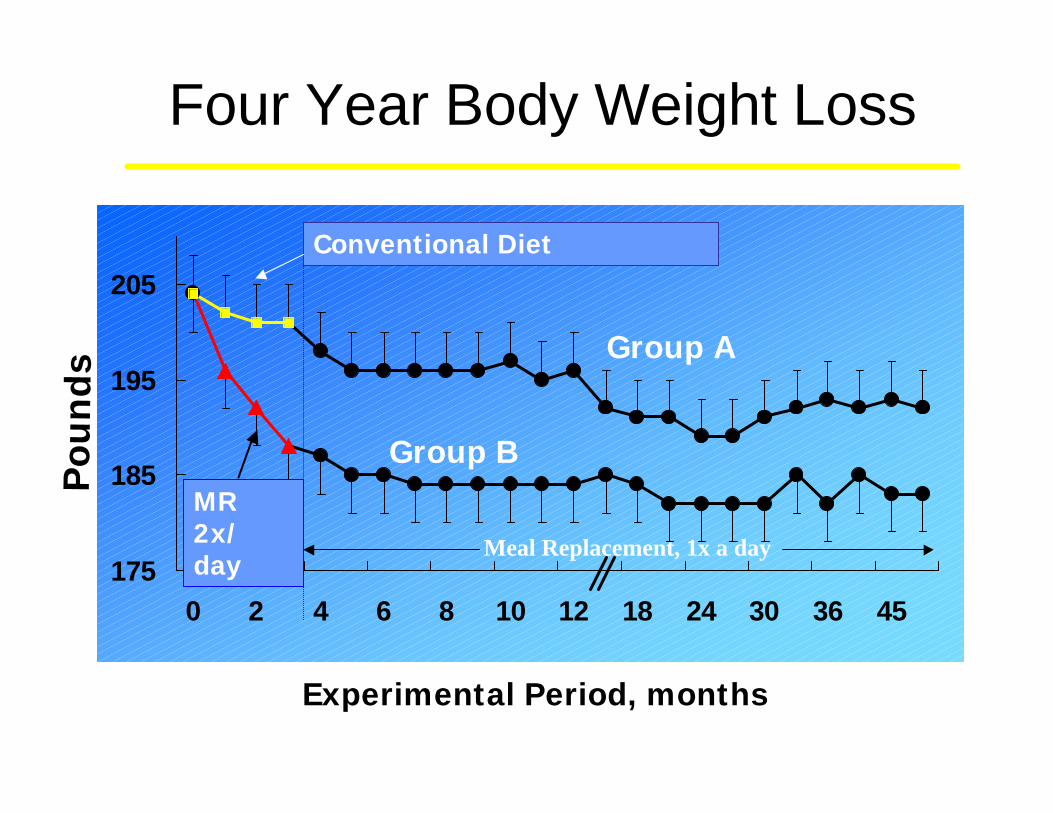
Four Year Body Weight Loss
175
185
195
205
0 2 4 6 8 10 12 18 24 30 36 45
Po
un
ds
Experimental Period, months
Meal Replacement, 1x a day
Conventional Diet
MR 2x/ day
Group A
Group B
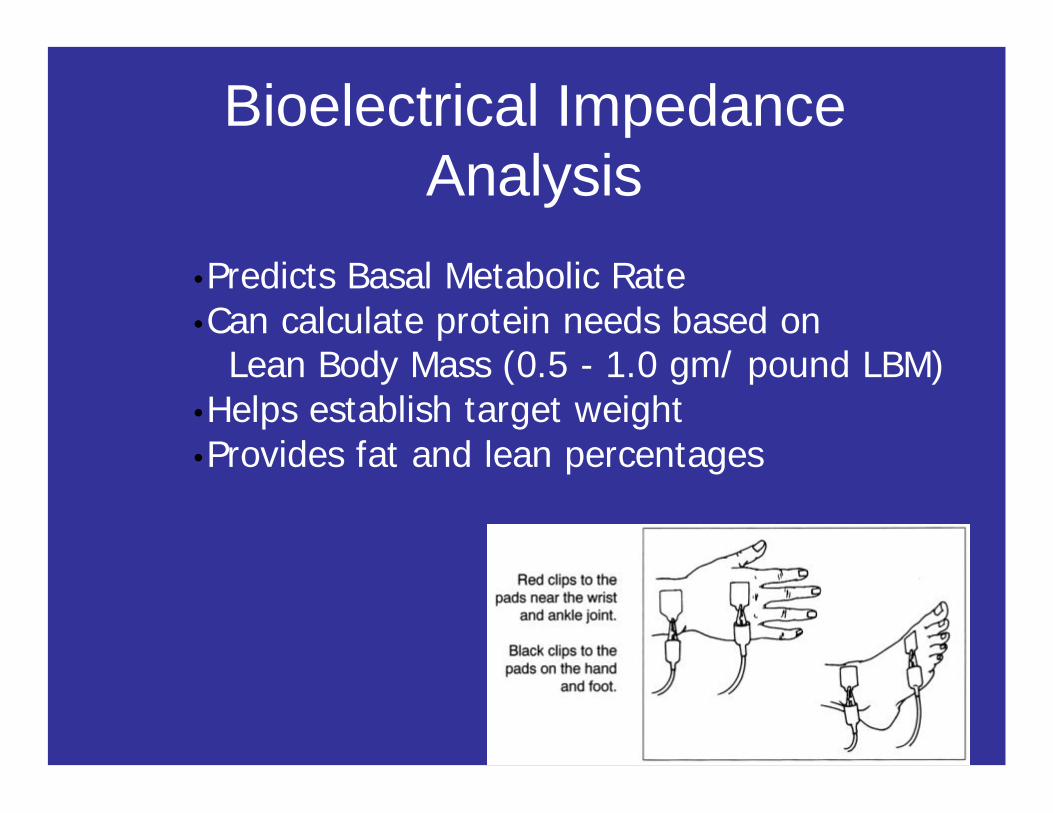
•Predicts Basal Metabolic Rate•Can calculate protein needs based on
Lean Body Mass (0.5 - 1.0 gm/ pound LBM)•Helps establish target weight•Provides fat and lean percentages
Bioelectrical Impedance Analysis
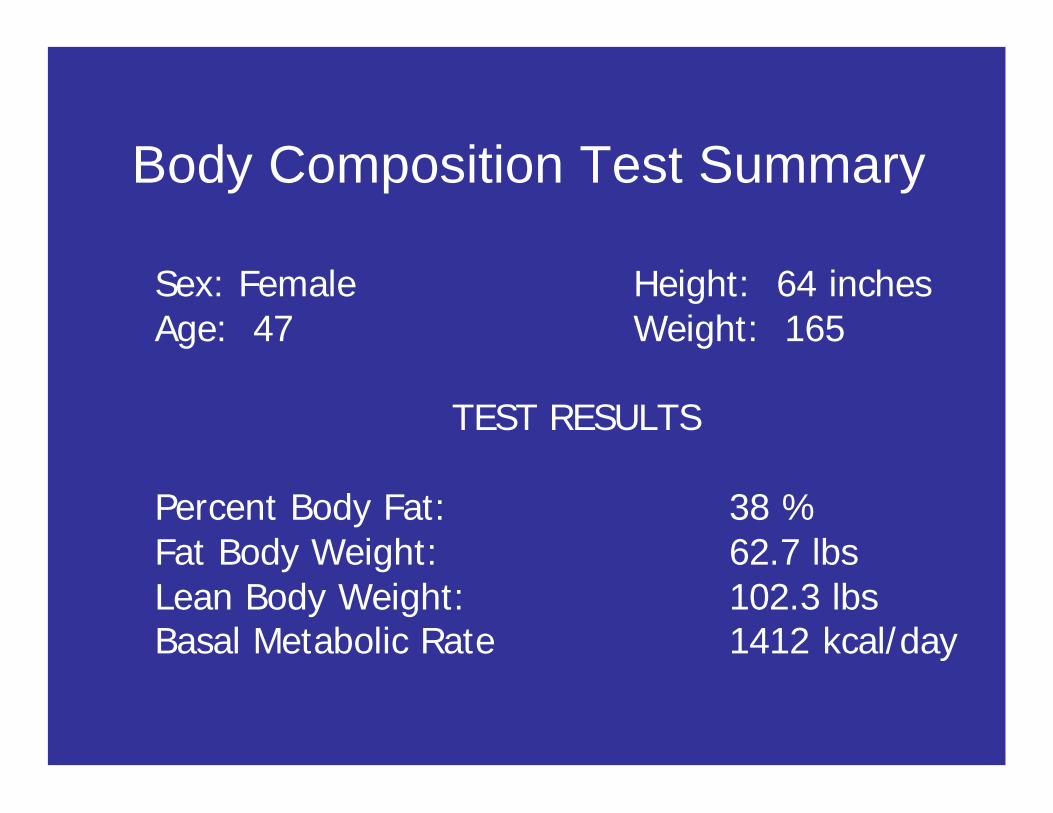
Body Composition Test Summary
Sex: Female Height: 64 inchesAge: 47 Weight: 165
TEST RESULTS
Percent Body Fat: 38 %Fat Body Weight: 62.7 lbsLean Body Weight: 102.3 lbsBasal Metabolic Rate 1412 kcal/day
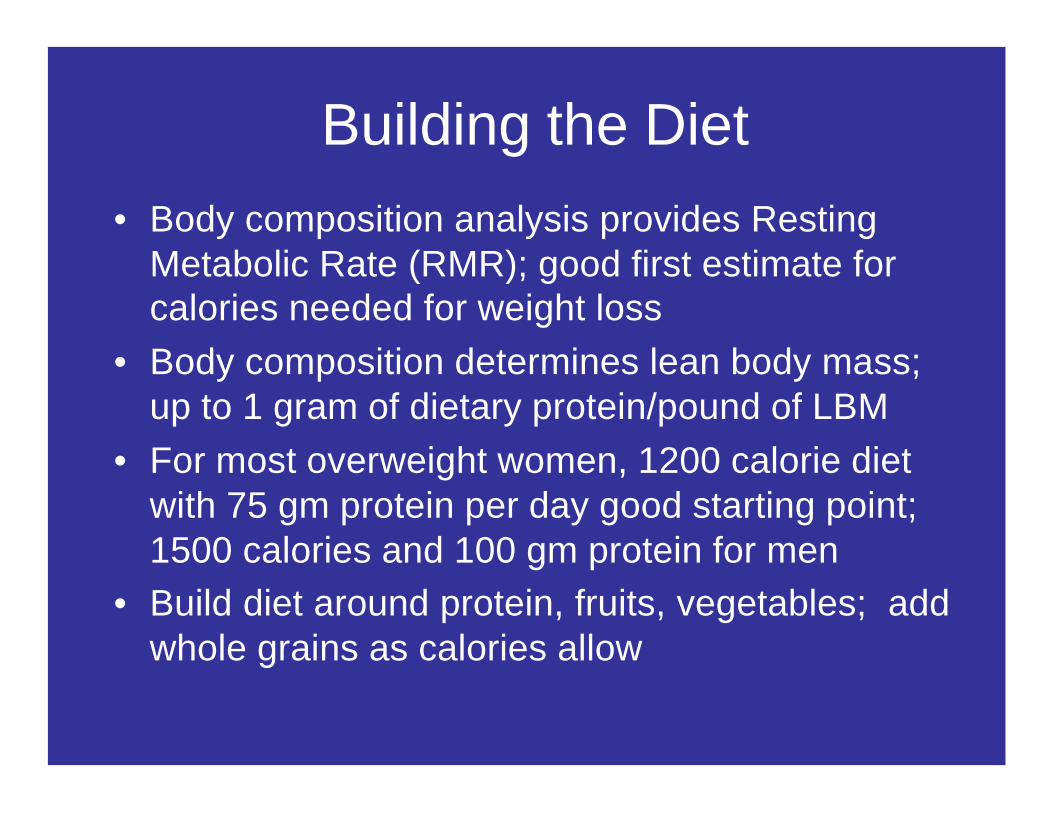
Building the Diet• Body composition analysis provides Resting
Metabolic Rate (RMR); good first estimate for calories needed for weight loss
• Body composition determines lean body mass; up to 1 gram of dietary protein/pound of LBM
• For most overweight women, 1200 calorie diet with 75 gm protein per day good starting point; 1500 calories and 100 gm protein for men
• Build diet around protein, fruits, vegetables; add whole grains as calories allow
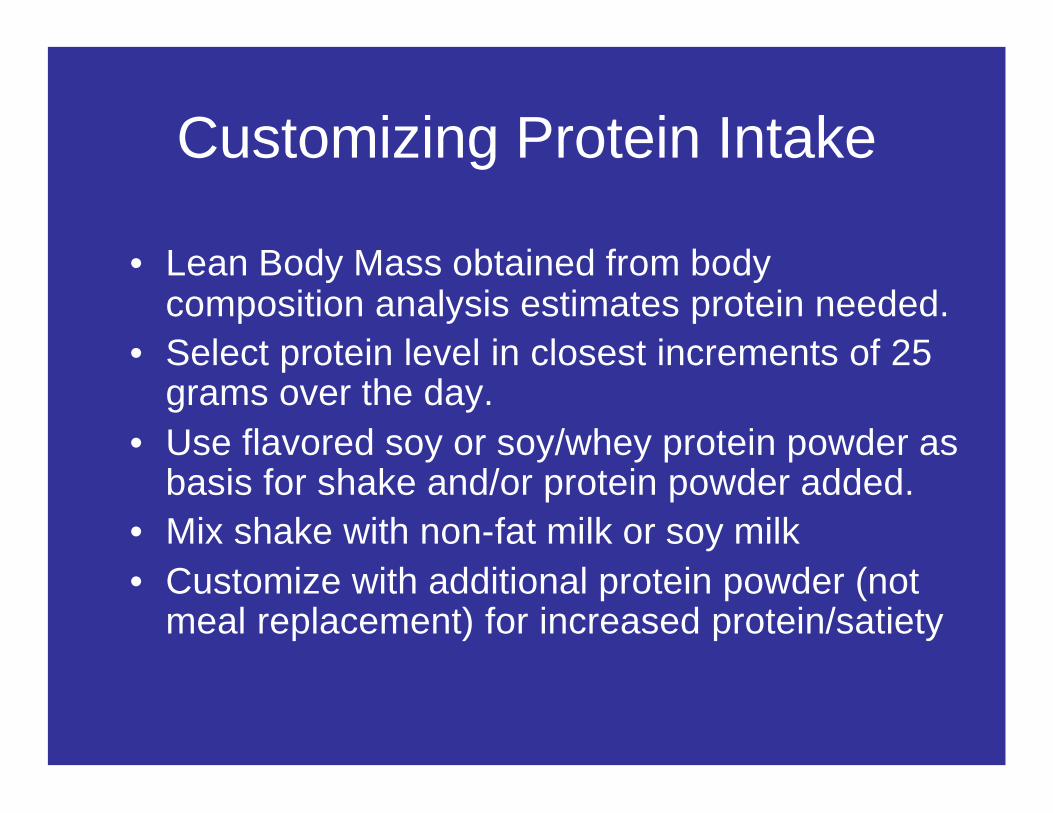
Customizing Protein Intake
• Lean Body Mass obtained from body composition analysis estimates protein needed.
• Select protein level in closest increments of 25 grams over the day.
• Use flavored soy or soy/whey protein powder as basis for shake and/or protein powder added.
• Mix shake with non-fat milk or soy milk• Customize with additional protein powder (not
meal replacement) for increased protein/satiety

The Ornish Atkins The Ornish Atkins South Beach Zone DietSouth Beach Zone Diet
Dean Ornish, M.D.Dean Ornish, M.D.President, Preventive Medicine Research InstitutePresident, Preventive Medicine Research InstituteClinical Professor of Medicine, UCSFClinical Professor of Medicine, UCSF88thth Annual Milken Institute Global ConferenceAnnual Milken Institute Global ConferenceApril 19, 2005April 19, 2005
1. Avoid trans fatty 1. Avoid trans fatty acids, hydrogenated acids, hydrogenated fats, and saturated fats fats, and saturated fats (“bad fats”).(“bad fats”).
2. Take 3 grams/day of 2. Take 3 grams/day of fish oil or flax seed oil to fish oil or flax seed oil to provide omegaprovide omega--3 fatty 3 fatty acids (“good fats”).acids (“good fats”).
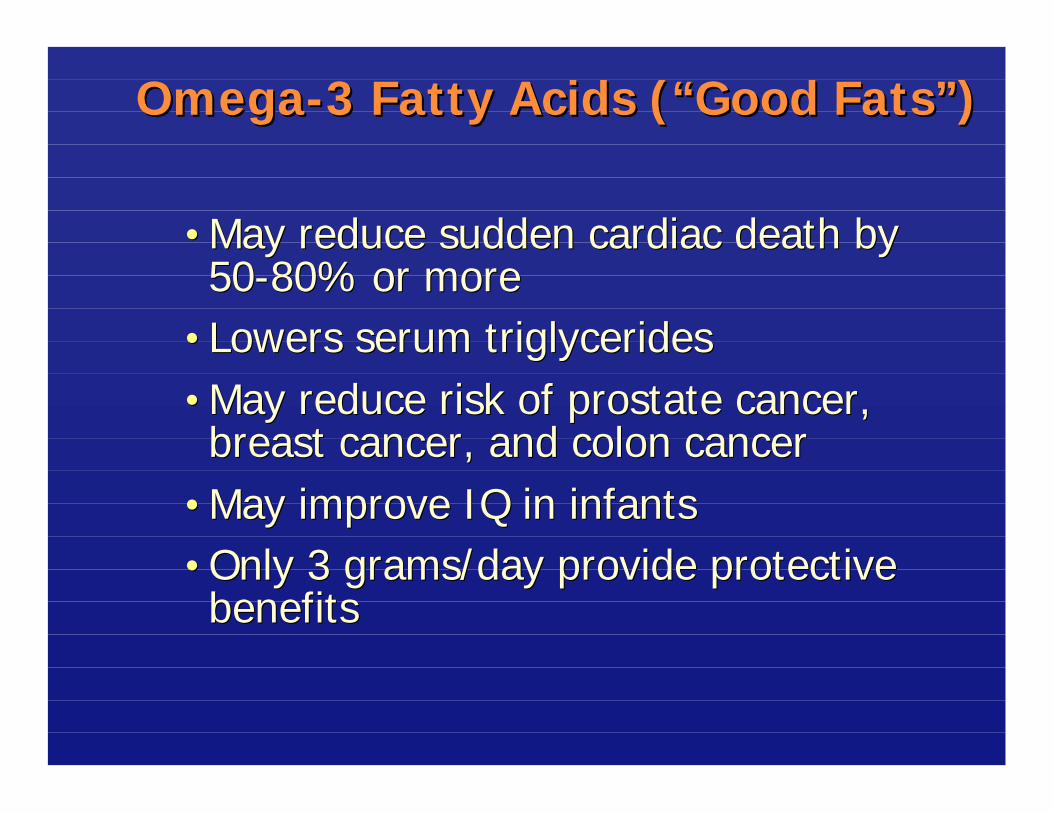
OmegaOmega--3 Fatty Acids (“Good Fats”)3 Fatty Acids (“Good Fats”)
••May reduce sudden cardiac death by May reduce sudden cardiac death by 5050--80% or more80% or more
••Lowers serum triglyceridesLowers serum triglycerides••May reduce risk of prostate cancer, May reduce risk of prostate cancer, breast cancer, and colon cancerbreast cancer, and colon cancer
••May improve IQ in infantsMay improve IQ in infants••Only 3 grams/day provide protective Only 3 grams/day provide protective benefitsbenefits
3. Avoid refined 3. Avoid refined carbohydrates such as carbohydrates such as sugar, white flour, white sugar, white flour, white rice, high fructose corn rice, high fructose corn syrup (“bad syrup (“bad carbscarbs”).”).
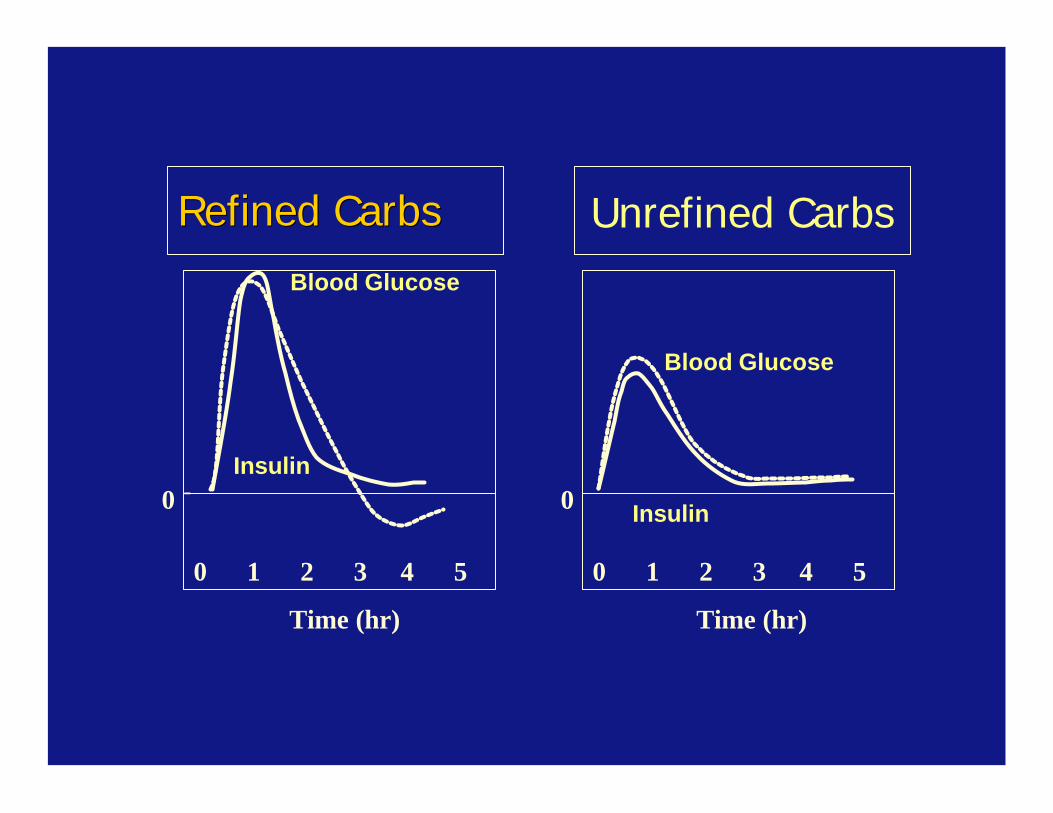
0
Blood Glucose
Insulin
Refined Refined CarbsCarbs
-
Blood Glucose
Insulin
Unrefined Carbs
0 0
0 1 2 3 4 5 0 1 2 3 4 5
Time (hr) Time (hr)
WholeWhole--grain consumption grain consumption improves insulin sensitivity improves insulin sensitivity in overweight and obese in overweight and obese adults.adults.
Pereira M, et al. Effect of whole grains on insulin sensitivity Pereira M, et al. Effect of whole grains on insulin sensitivity in in overweight overweight hyperinsulinemichyperinsulinemic adults. adults. Am J Am J ClinClin NutrNutr..2002; 75(5):8482002; 75(5):848--55.55.
4. Eat more fruits, 4. Eat more fruits, vegetables, whole vegetables, whole grains (e.g., brown rice, grains (e.g., brown rice, whole wheat flour), whole wheat flour), legumes, and soy legumes, and soy products (“good products (“good carbscarbs”).”).
5. What you 5. What you includeinclude in in your diet is as important your diet is as important as what you as what you excludeexclude. .
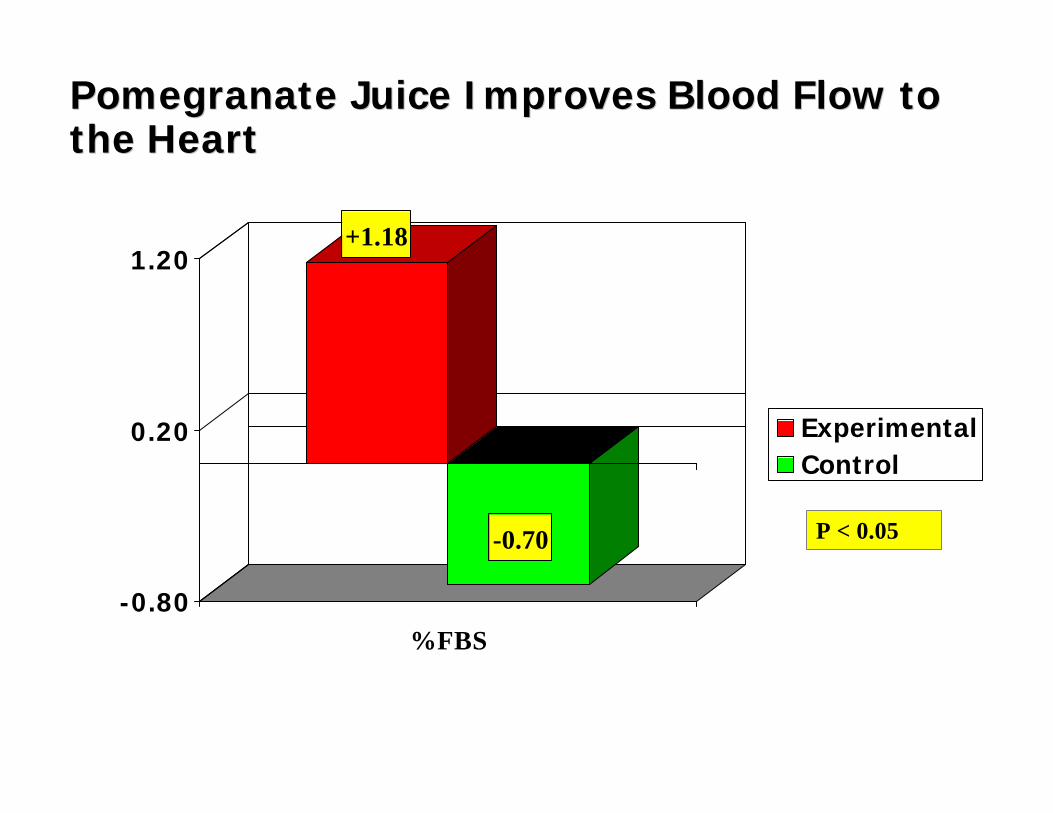
Pomegranate Juice Improves Blood Flow to Pomegranate Juice Improves Blood Flow to the Heartthe Heart
+1.18
-0.70
-0.80
0.20
1.20
%FBS
ExperimentalControl
P < 0.05
6. When you eat less fat, 6. When you eat less fat, you consume fewer you consume fewer calories without having calories without having to eat less food.to eat less food.
7. Energy balance is 7. Energy balance is important: burn more important: burn more calories and/or eat calories and/or eat fewer calories. fewer calories.
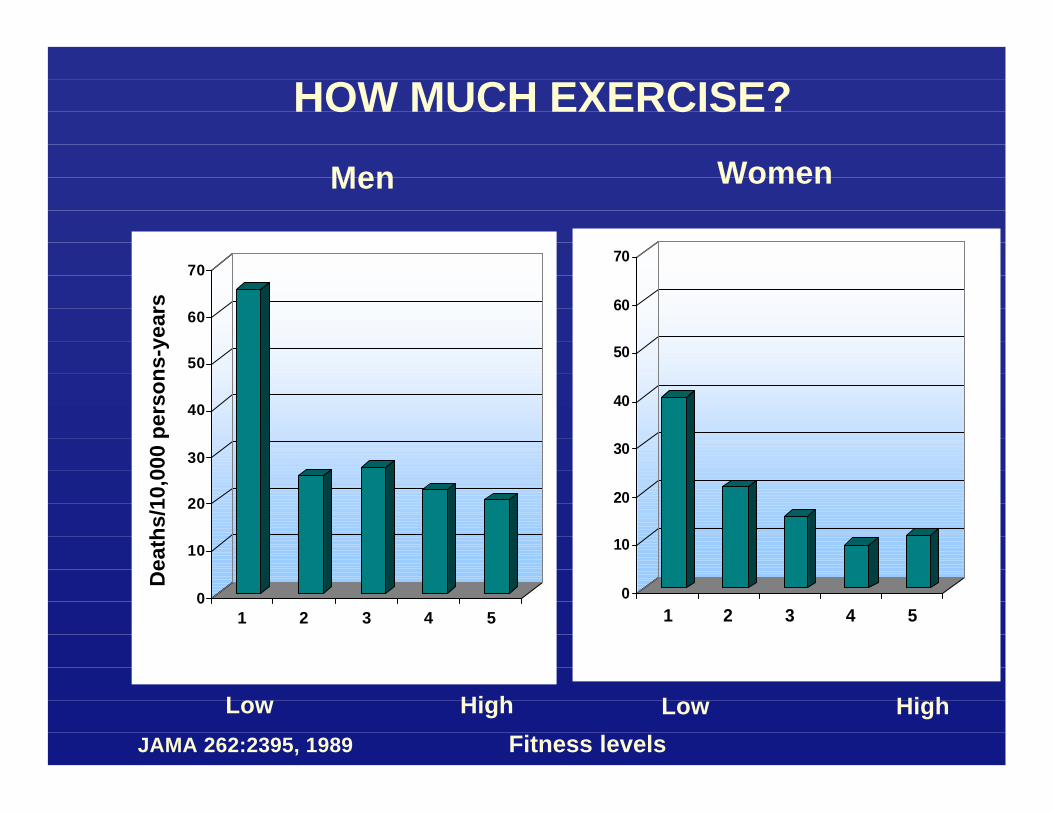
8. Exercise more. 8. Exercise more. A little goes a long way.A little goes a long way.
0
10
20
30
40
50
60
70
1 2 3 4 50
10
20
30
40
50
60
70
Dea
ths/
10,0
00 p
erso
ns-
year
s
1 2 3 4 5
HOW MUCH EXERCISE?
Men Women
JAMA 262:2395, 1989 Fitness levels
Low High Low High
9. Eat less red meat.9. Eat less red meat.
10. Lose weight in ways 10. Lose weight in ways that enhance your that enhance your health rather than ways health rather than ways that may harm it. that may harm it.
Can Lifestyle Can Lifestyle Changes Reverse Changes Reverse Coronary Heart Coronary Heart Disease?Disease?
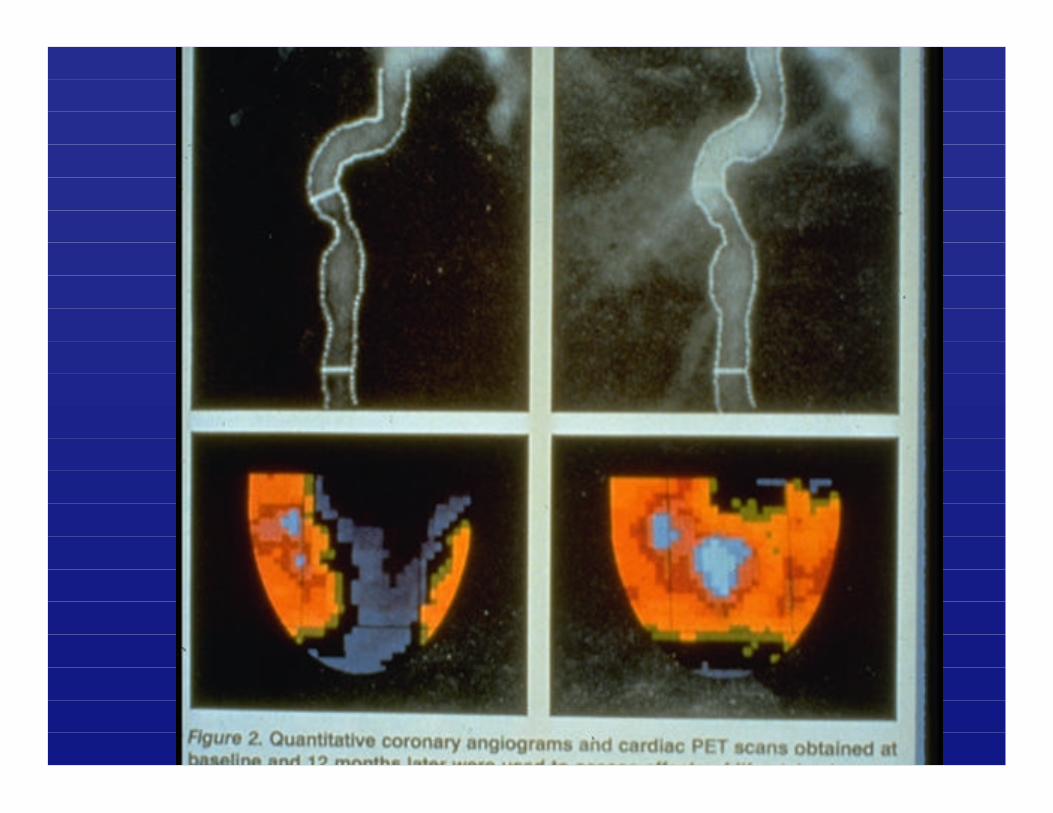
There was a 40% There was a 40% reduction in LDLreduction in LDL--cholesterol in the cholesterol in the Lifestyle Heart Trial Lifestyle Heart Trial after one year without after one year without drugs.drugs.
Ornish D et al. Ornish D et al. JAMAJAMA. 1998;280:2001. 1998;280:2001--2007.2007.
Can Lifestyle Can Lifestyle Changes Reverse Changes Reverse the Progression of the Progression of Prostate Cancer?Prostate Cancer?
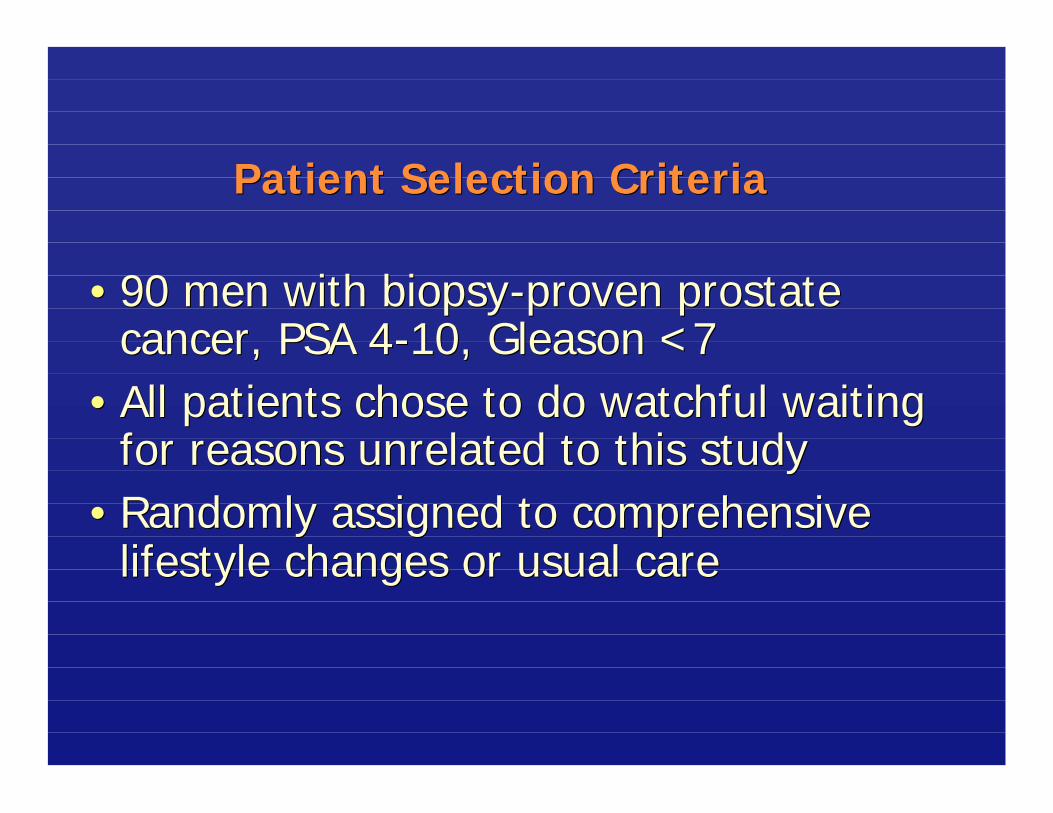
Patient Selection CriteriaPatient Selection Criteria
•• 90 men with biopsy90 men with biopsy--proven prostate proven prostate cancer, PSA 4cancer, PSA 4--10, Gleason <710, Gleason <7
•• All patients chose to do watchful waiting All patients chose to do watchful waiting for reasons unrelated to this studyfor reasons unrelated to this study
•• Randomly assigned to comprehensive Randomly assigned to comprehensive lifestyle changes or usual carelifestyle changes or usual care
None of the None of the experimental group experimental group patients but six control patients but six control group patients had group patients had conventional treatment conventional treatment during the first year.during the first year.
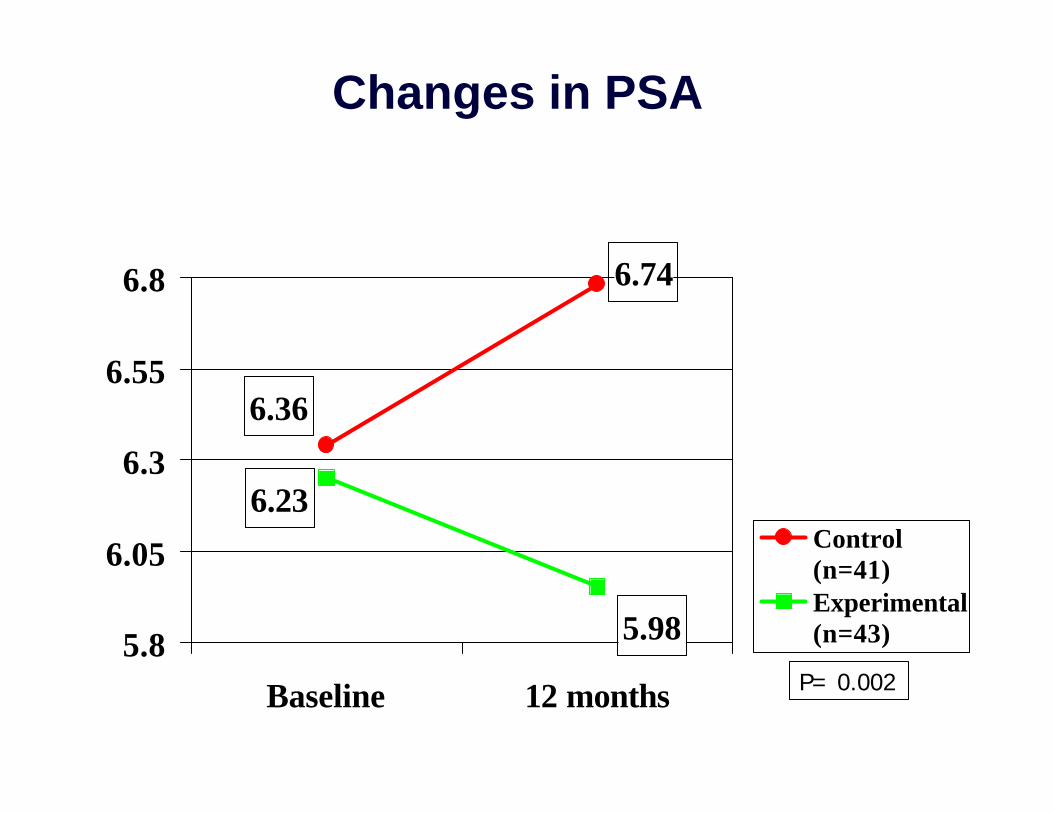
6.74
6.23
5.98
6.36
5.8
6.05
6.3
6.55
6.8
Baseline 12 months
Control(n=41)Experimental(n=43)
Changes in PSA
P= 0.002
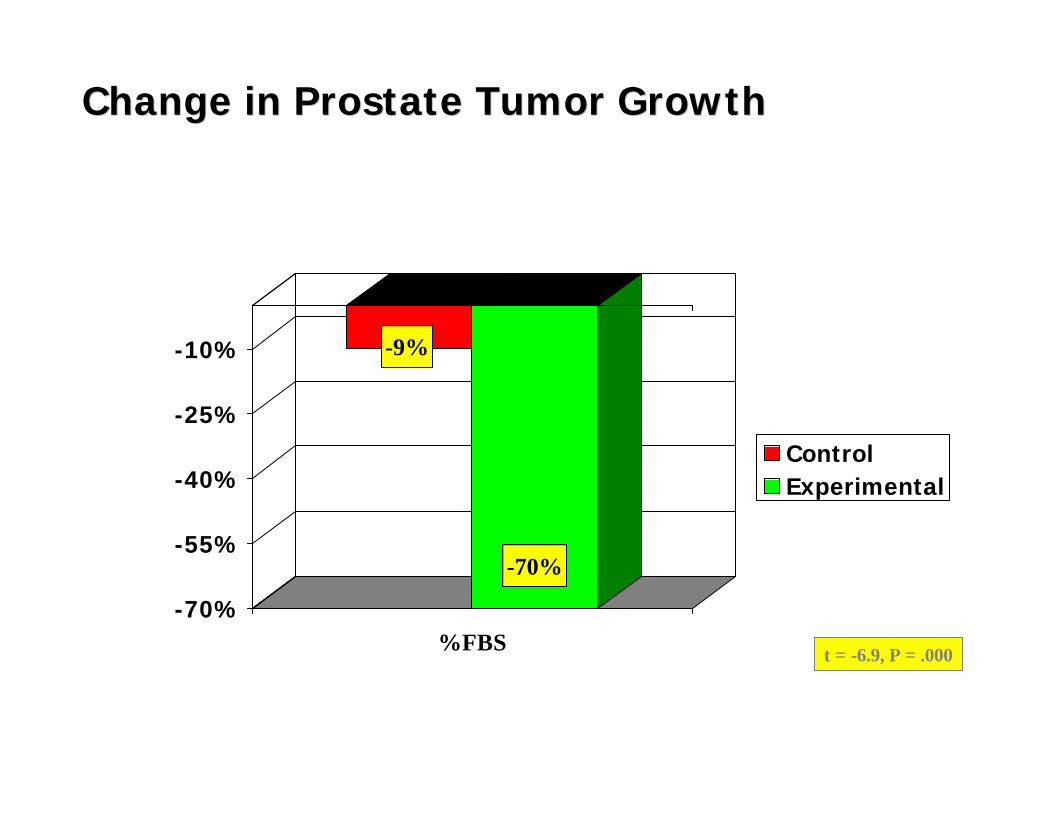
Change in Prostate Tumor GrowthChange in Prostate Tumor Growth
-9%
-70%
-70%
-55%
-40%
-25%
-10%
%FBS
ControlExperimental
t = -6.9, P = .000
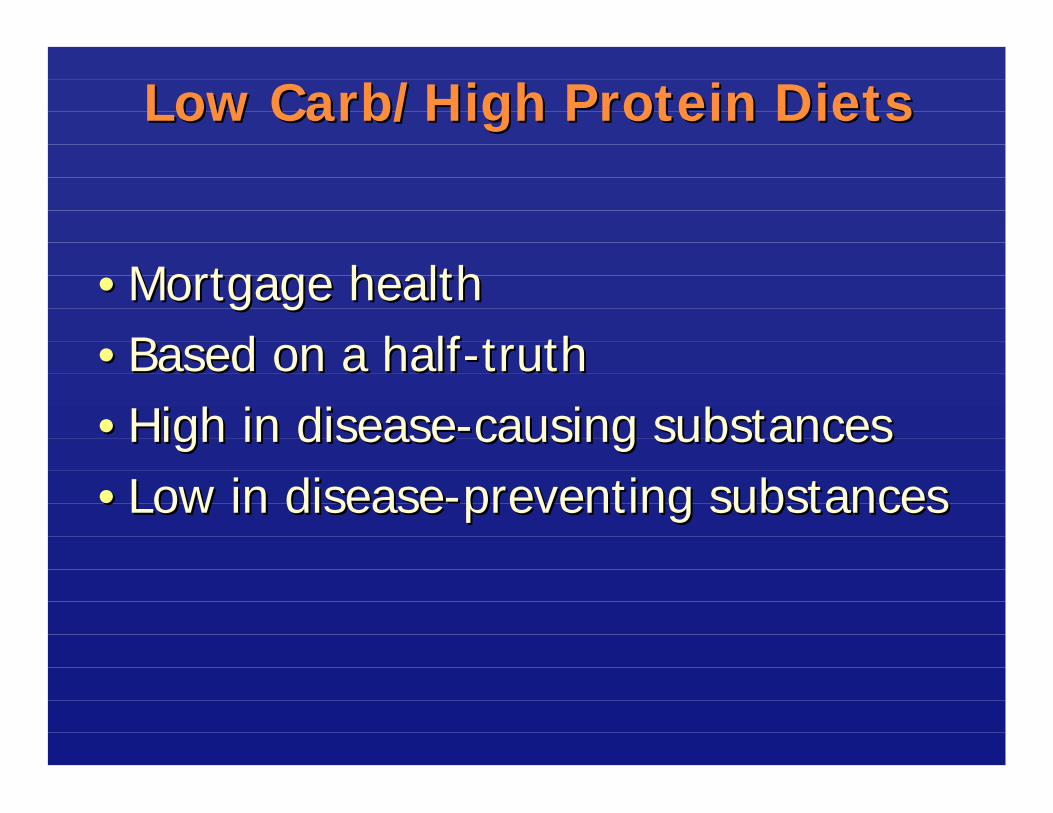
Low Low CarbCarb/High Protein Diets/High Protein Diets
•• Mortgage healthMortgage health•• Based on a halfBased on a half--truthtruth•• High in diseaseHigh in disease--causing substancescausing substances•• Low in diseaseLow in disease--preventing substancespreventing substances
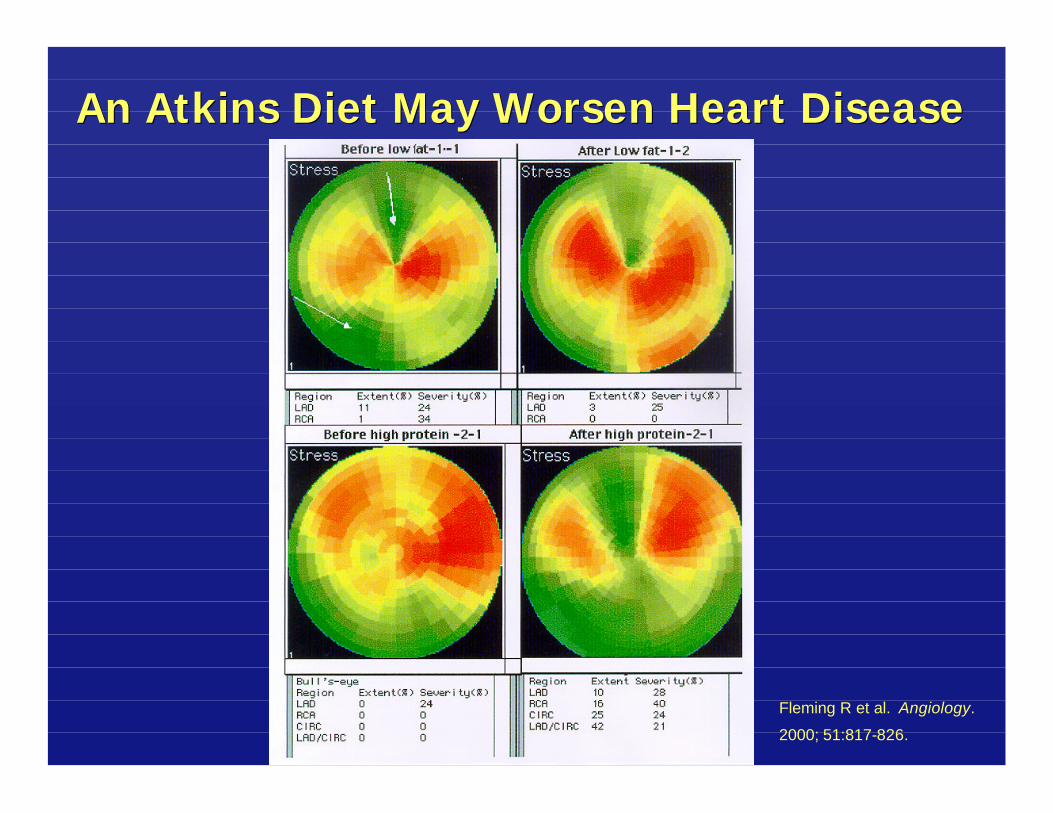
An Atkins Diet May Worsen Heart DiseaseAn Atkins Diet May Worsen Heart Disease
Fleming R et al. Angiology.
2000; 51:817-826.
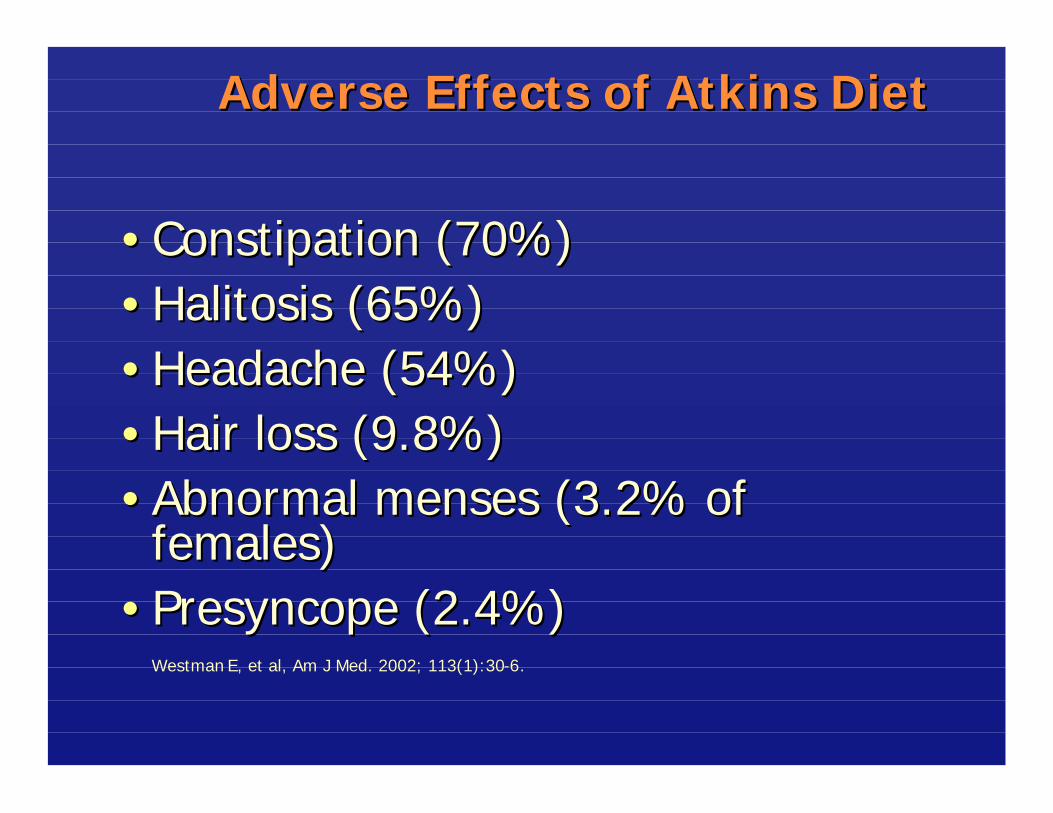
Adverse Effects of Atkins DietAdverse Effects of Atkins Diet
•• Constipation (70%)Constipation (70%)•• Halitosis (65%)Halitosis (65%)•• Headache (54%)Headache (54%)•• Hair loss (9.8%)Hair loss (9.8%)•• Abnormal menses (3.2% of Abnormal menses (3.2% of females)females)
•• Presyncope (2.4%)Presyncope (2.4%)WestmanWestman E, et al, Am J Med. 2002; 113(1):30E, et al, Am J Med. 2002; 113(1):30--6.6.
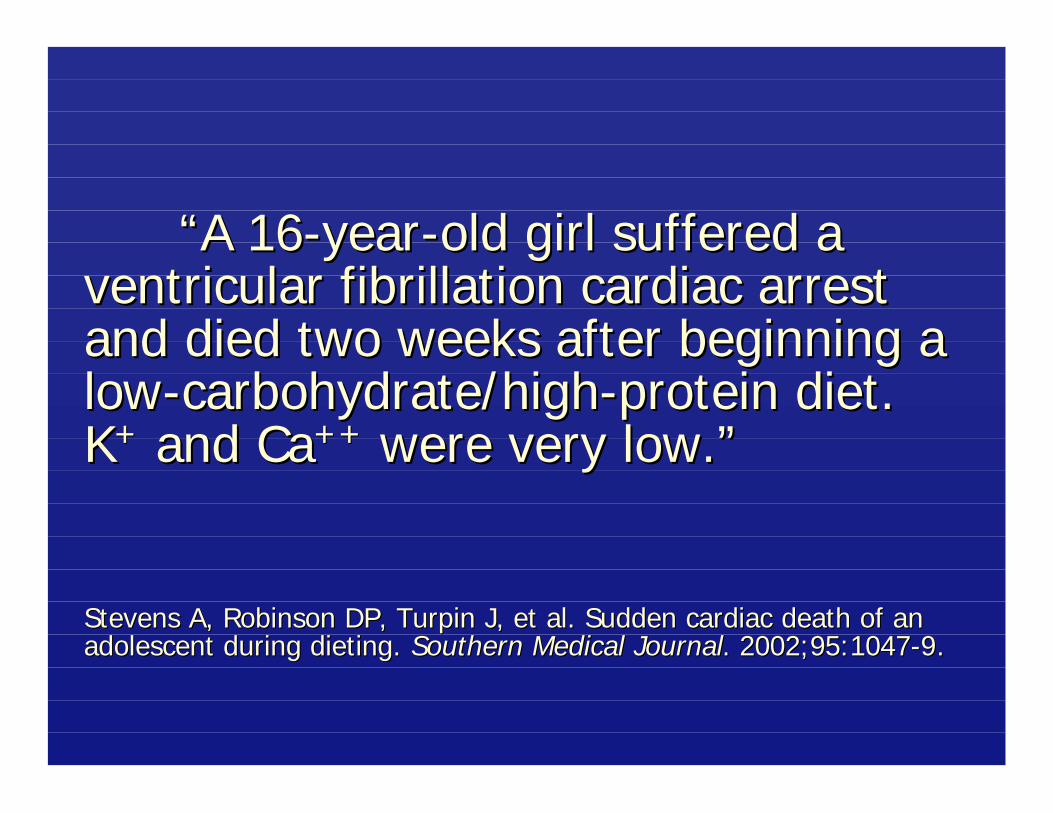
“A 16“A 16--yearyear--old girl suffered a old girl suffered a ventricular fibrillation cardiac arrest ventricular fibrillation cardiac arrest and died two weeks after beginning a and died two weeks after beginning a lowlow--carbohydrate/highcarbohydrate/high--protein diet. protein diet. KK++ and Caand Ca++++ were very low.”were very low.”
Stevens A, Robinson DP, Turpin J, et al. Sudden cardiac death ofStevens A, Robinson DP, Turpin J, et al. Sudden cardiac death of an an adolescent during dieting. adolescent during dieting. Southern Medical JournalSouthern Medical Journal. 2002;95:1047. 2002;95:1047--9.9.

KetoneKetone bodies undergo urinary bodies undergo urinary excretion with a excretion with a cationcation to maintain to maintain electrical neutrality, causing low Kelectrical neutrality, causing low K++, , CaCa++++, and Mg, and Mg++++. Elevated levels of . Elevated levels of free fatty acids may promote free fatty acids may promote ventricular arrhythmias.ventricular arrhythmias.
Stevens A, Robinson DP, Turpin J, et al. Sudden cardiac death ofStevens A, Robinson DP, Turpin J, et al. Sudden cardiac death of an an adolescent during dieting. adolescent during dieting. Southern Medical JournalSouthern Medical Journal. 2002;95:1047. 2002;95:1047--9.9.
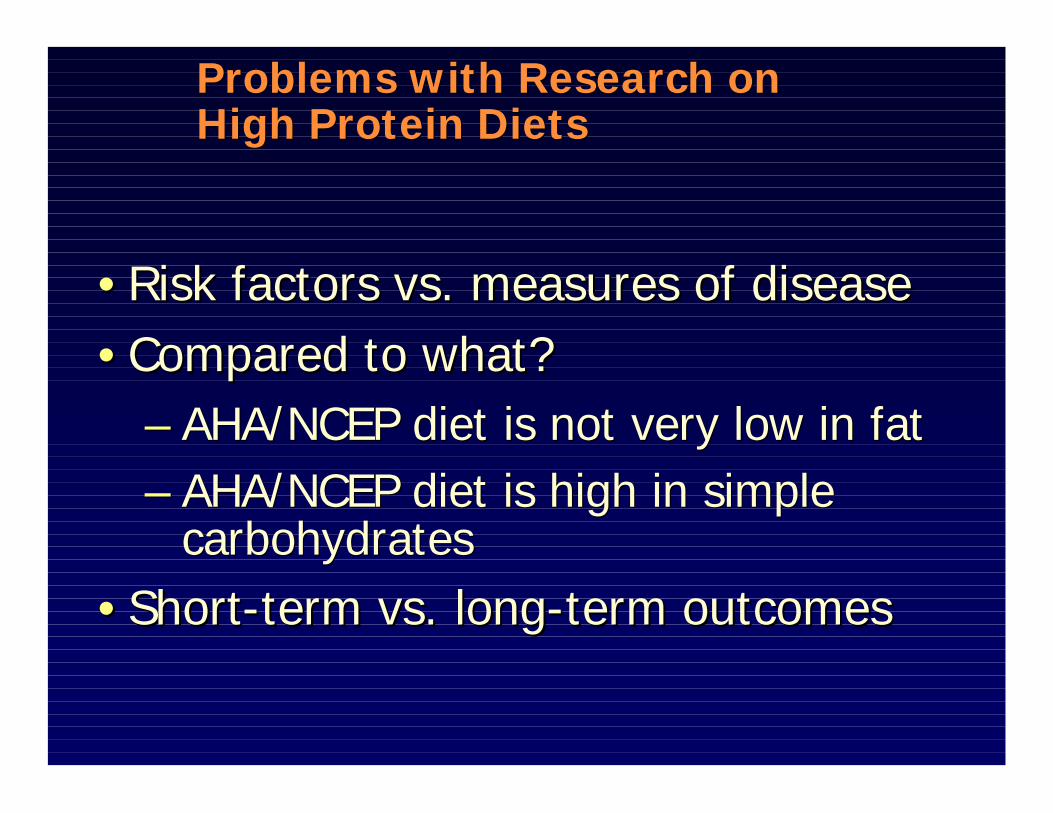
Problems with Research on Problems with Research on High Protein DietsHigh Protein Diets
•• Risk factors vs. measures of diseaseRisk factors vs. measures of disease•• Compared to what?Compared to what?
–– AHA/NCEP diet is not very low in fatAHA/NCEP diet is not very low in fat–– AHA/NCEP diet is high in simple AHA/NCEP diet is high in simple
carbohydratescarbohydrates
•• ShortShort--term vs. longterm vs. long--term outcomesterm outcomes
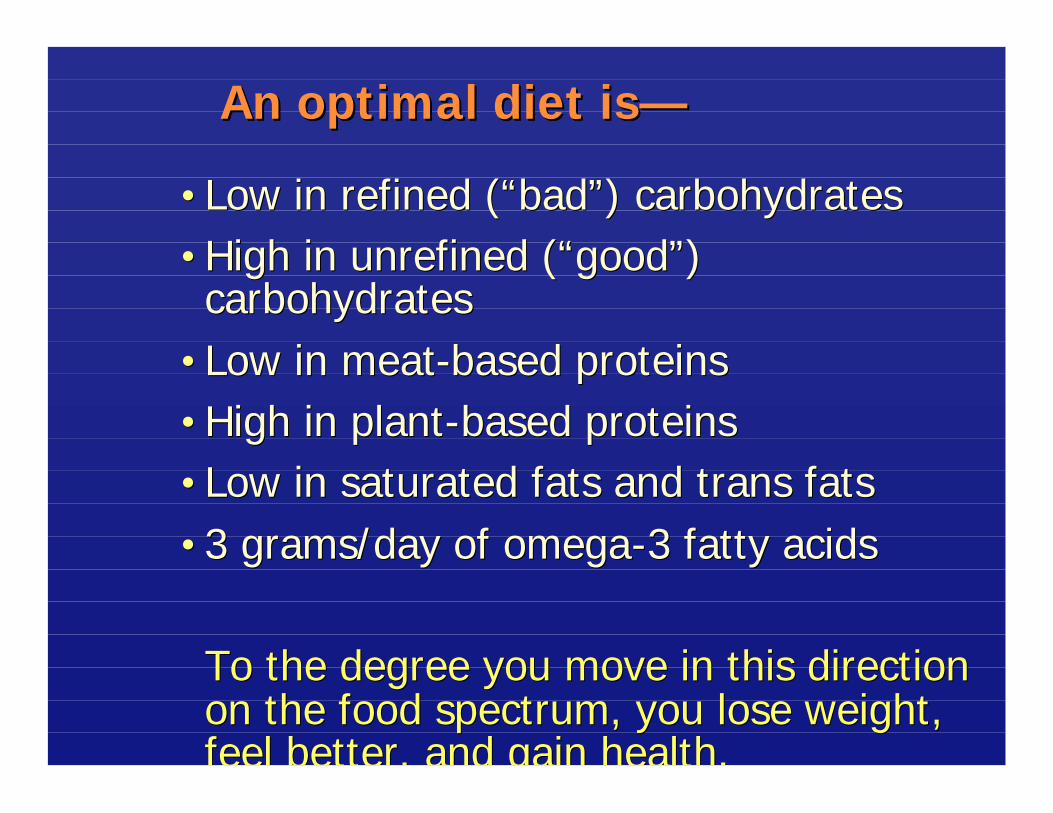
An optimal diet isAn optimal diet is——
••Low in refined (“bad”) carbohydratesLow in refined (“bad”) carbohydrates••High in unrefined (“good”) High in unrefined (“good”) carbohydratescarbohydrates
••Low in meatLow in meat--based proteinsbased proteins••High in plantHigh in plant--based proteinsbased proteins••Low in saturated fats and trans fatsLow in saturated fats and trans fats••3 grams/day of omega3 grams/day of omega--3 fatty acids3 fatty acids
To the degree you move in this direction To the degree you move in this direction on the food spectrum, you lose weight, on the food spectrum, you lose weight, feel better, and gain health.feel better, and gain health.
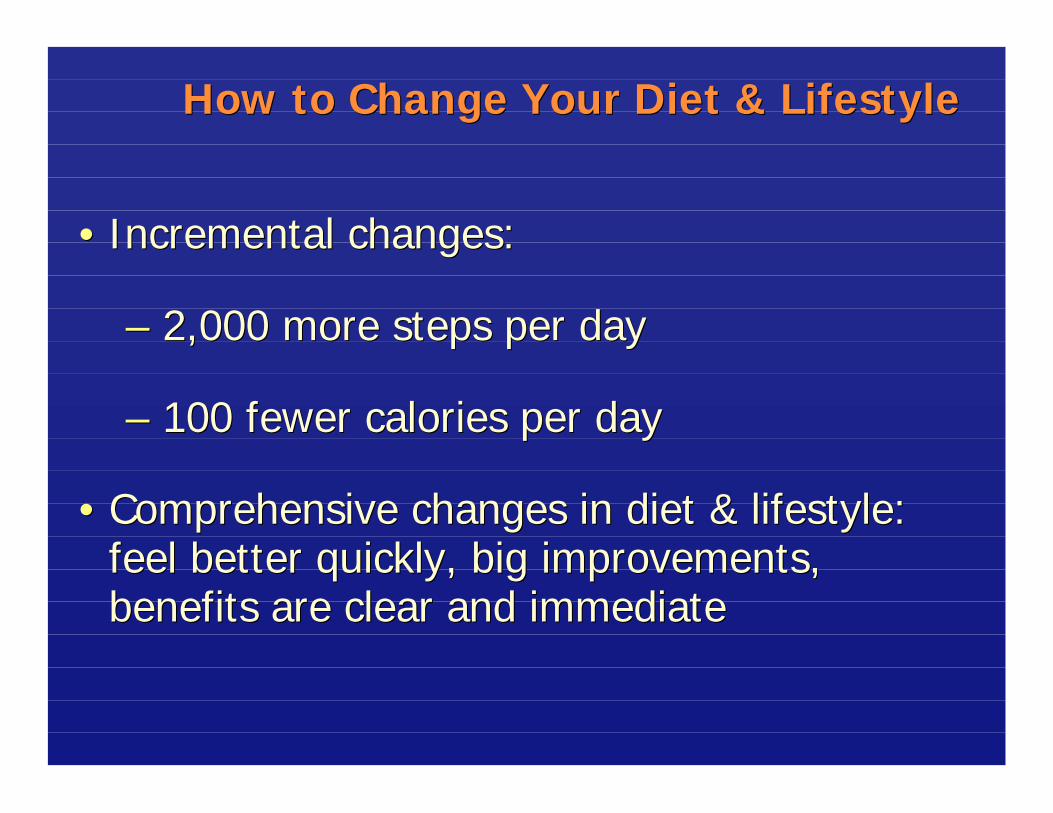
How to Change Your Diet & LifestyleHow to Change Your Diet & Lifestyle
•• Incremental changes:Incremental changes:
–– 2,000 more steps per day2,000 more steps per day
–– 100 fewer calories per day100 fewer calories per day
•• Comprehensive changes in diet & lifestyle: Comprehensive changes in diet & lifestyle: feel better quickly, big improvements, feel better quickly, big improvements, benefits are clear and immediatebenefits are clear and immediate
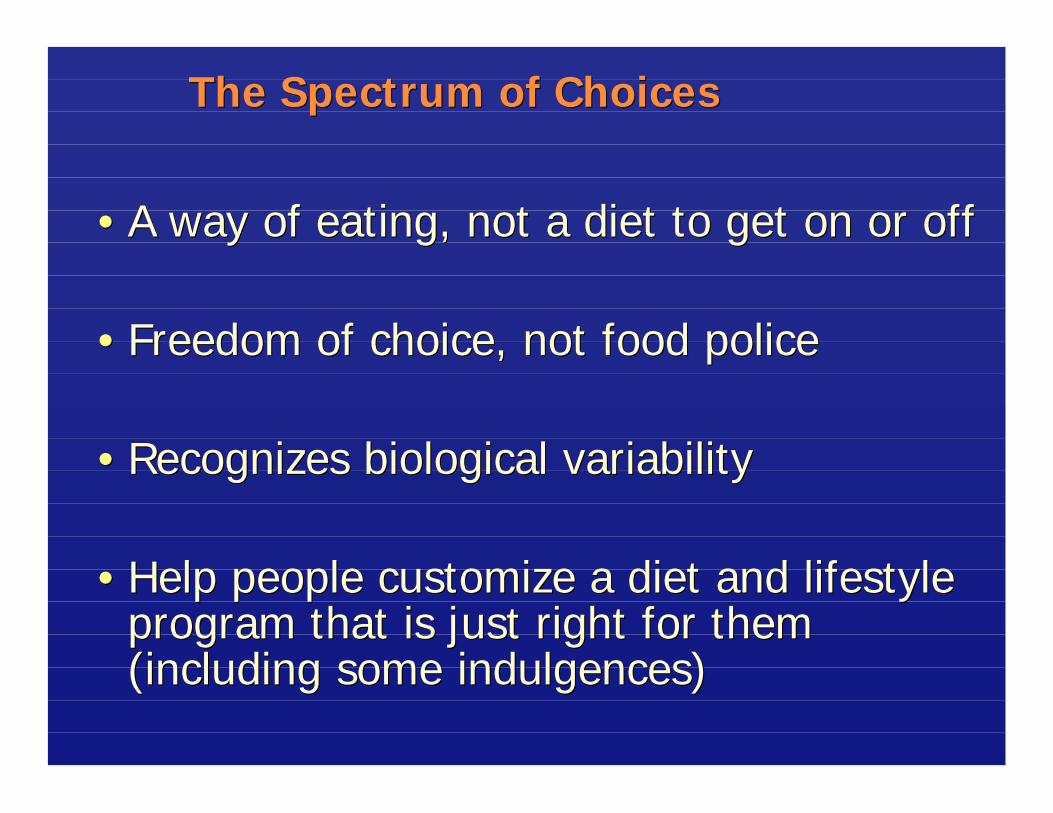
The Spectrum of ChoicesThe Spectrum of Choices
•• A way of eating, not a diet to get on or offA way of eating, not a diet to get on or off
•• Freedom of choice, not food policeFreedom of choice, not food police
•• Recognizes biological variabilityRecognizes biological variability
•• Help people customize a diet and lifestyle Help people customize a diet and lifestyle program that is just right for them program that is just right for them (including some indulgences)(including some indulgences)
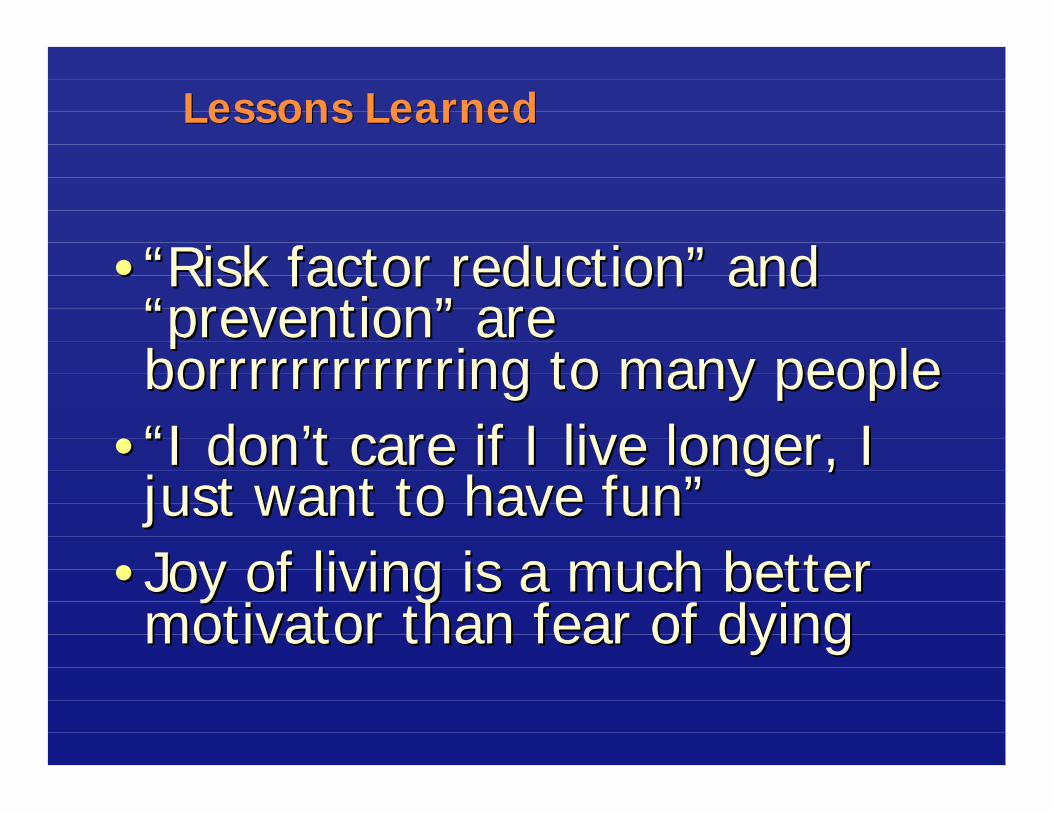
Lessons LearnedLessons Learned
••“Risk factor reduction” and “Risk factor reduction” and “prevention” are “prevention” are borrrrrrrrrrrringborrrrrrrrrrrring to many peopleto many people
••“I don’t care if I live longer, I “I don’t care if I live longer, I just want to have fun”just want to have fun”
••Joy of living is a much better Joy of living is a much better motivator than fear of dyingmotivator than fear of dying

There’s no point in There’s no point in giving up something giving up something you enjoy unless you you enjoy unless you get something back get something back that’s even betterthat’s even better––and quickly!and quickly!

© The New Yorker Magazine, June 16, 2003

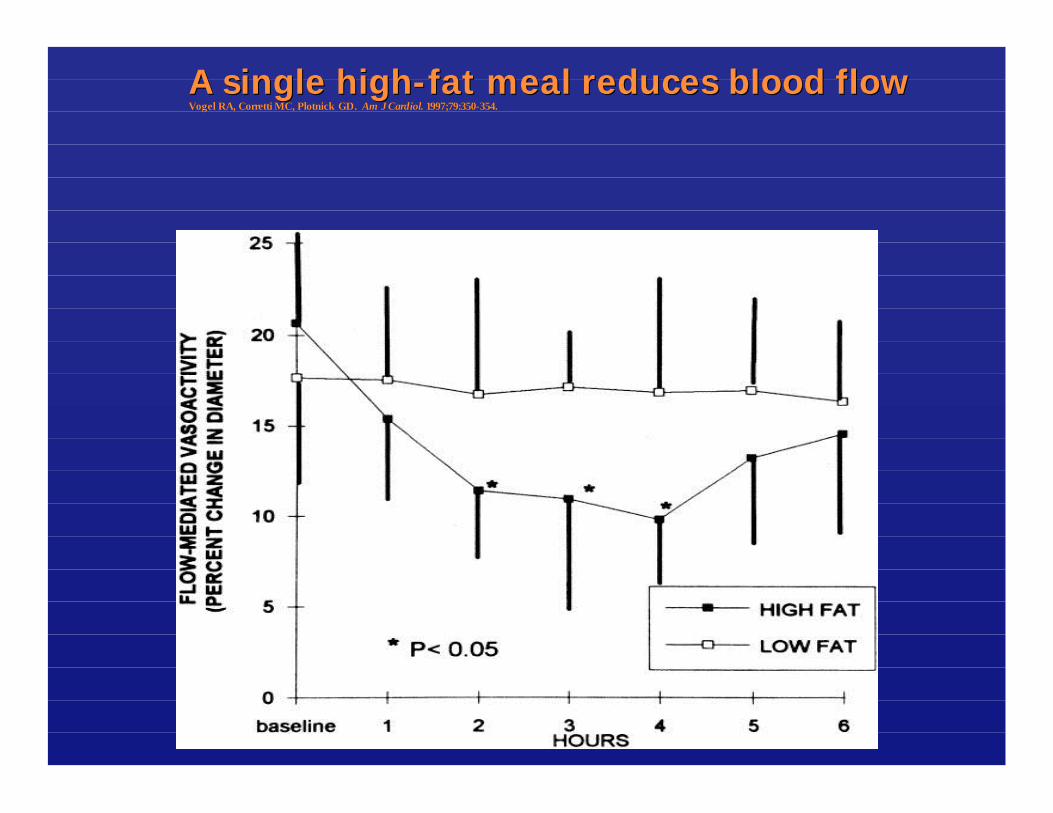
A single highA single high--fat meal reduces blood flowfat meal reduces blood flowVogel RA, Vogel RA, CorrettiCorretti MC, MC, PlotnickPlotnick GD. GD. Am J Am J CardiolCardiol. . 1997;79:3501997;79:350--354.354.
How to LiveHow to LiveLonger and BetterLonger and Better
Milken Institute Global ConferenceSusan Trimbo, Ph.D.
GNC
Trends Affecting the Nutritional Trends Affecting the Nutritional Supplement IndustrySupplement Industry
• Aging Population: U.S. Census Bureau data indicates that the number of Americans age 65 or older is expected to increaseby 54% from 2000 to 2010. These consumers are significantlymore likely to use VMHS products than younger person.
• Rising Healthcare Costs and Use of Preventive Measures:Healthcare related costs have increased substantially in theUnited States. To reduce medical costs and avoid the complexities of dealing with the healthcare system, manyconsumers take preventive measures, including alternativemedicines and nutritional supplements.
Trends Affecting the Nutritional Trends Affecting the Nutritional Supplement IndustrySupplement Industry
• Increasing Focus on Fitness: The number of Americansbelonging to health clubs has grown 23% from 29.5 millionin 1998 to 39.4 million in 2003, according to the InternationalHealth, Racquet & Sportsclub Association. Fitness-orientedconsumers are interested in taking sports nutrition productsto increase energy, endurance and strength during exercise.
• Increasing Incidence of Obesity: According to data from the1999-2002 National Health Nutrition Examination Survey,65% of adults in the United States are either overweight orobese. Obesity may lead to more serious health conditions,such as diabetes, heart disease and high blood pressure. Anestimated 49% of adults in the United States are currentlydieting, according to a 2004 Gallup Study of Dieting and theMarket for Diet Products and Services.
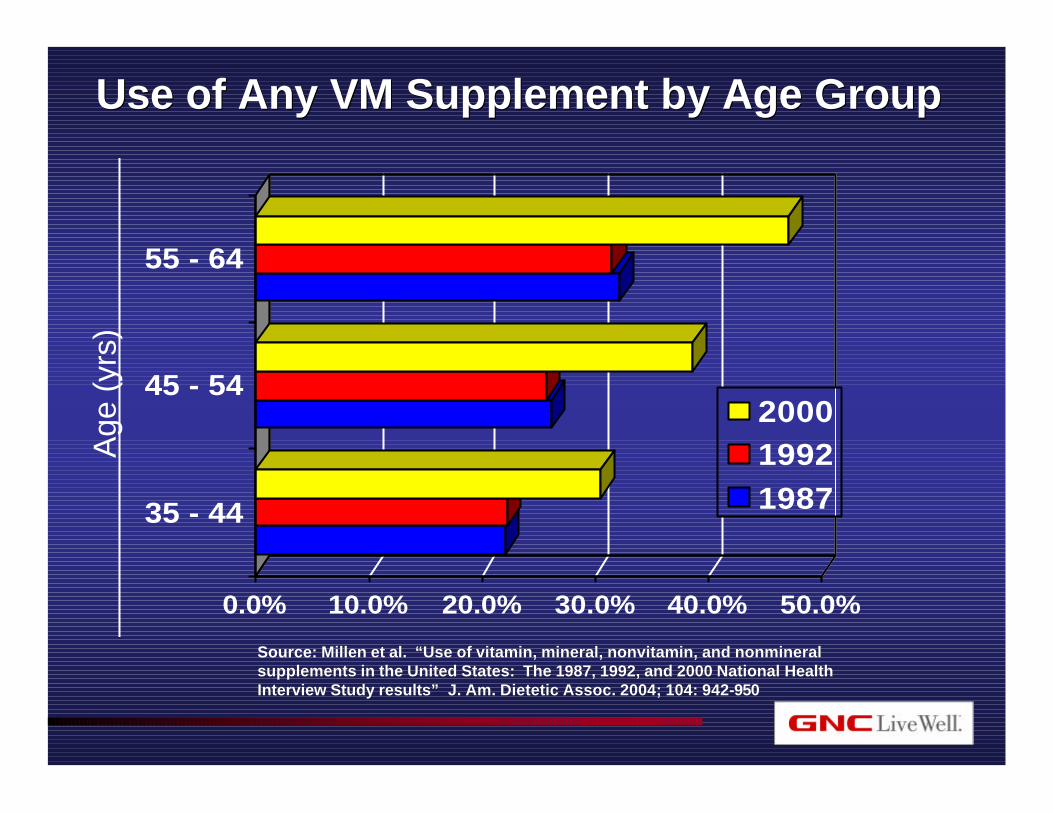
Use of Any VM Supplement by Age GroupUse of Any VM Supplement by Age Group
0.0% 10.0% 20.0% 30.0% 40.0% 50.0%
35 - 44
45 - 54
55 - 64
200019921987
Age
(yr
s)
Source: Millen et al. Millen et al. ““Use of vitamin, mineral, nonvitamin, and nonmineral Use of vitamin, mineral, nonvitamin, and nonmineral supplements in the United States: The 1987, 1992, and 2000 Natisupplements in the United States: The 1987, 1992, and 2000 National Health onal Health Interview Study resultsInterview Study results”” J. Am. Dietetic Assoc. 2004; 104: 942J. Am. Dietetic Assoc. 2004; 104: 942--950950
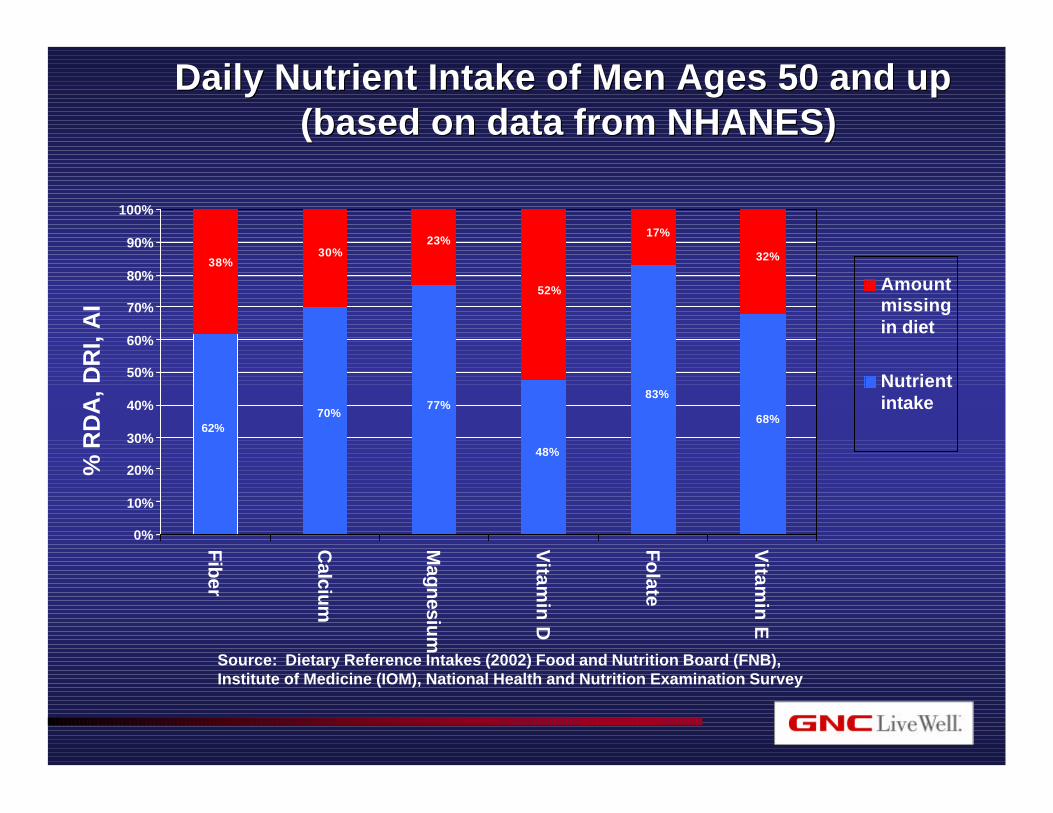
Daily Nutrient Intake of Men Ages 50 and upDaily Nutrient Intake of Men Ages 50 and up(based on data from NHANES)(based on data from NHANES)
62%70%
77%
48%
83%
68%
38%30%
23%
52%
17%
32%
0%
10%
20%
30%
40%
50%
60%
70%
80%
90%
100%
Fib
er
Calcium
Magnesium
Vitam
in D
Fo
late
Vitam
in E
Amountmissingin diet
Nutrientintake
%R
DA
, DR
I, A
I
Source: Dietary Reference Intakes (2002) Food and Nutrition Board (FNB), Institute of Medicine (IOM), National Health and Nutrition Examination Survey
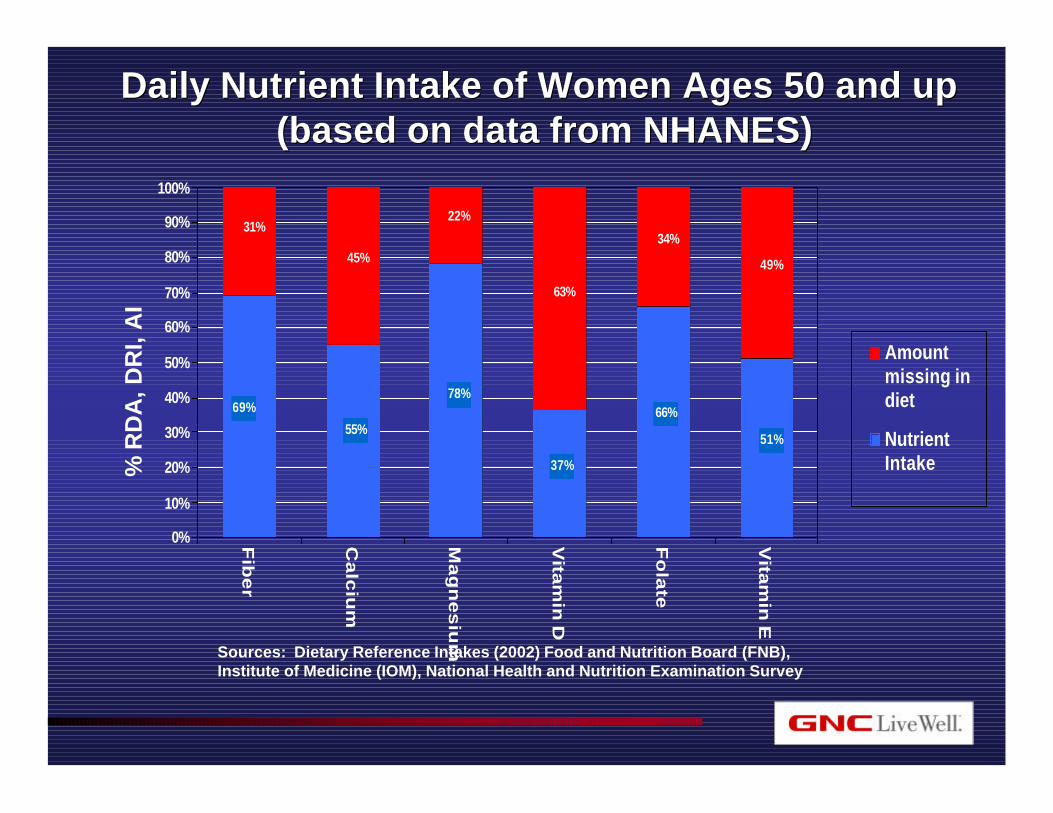
Daily Nutrient Intake of Women Ages 50 and upDaily Nutrient Intake of Women Ages 50 and up(based on data from NHANES)(based on data from NHANES)
69%
31%
55%
45%
78%
22%
37%
63%
66%
34%
51%
49%
0%
10%
20%
30%
40%
50%
60%
70%
80%
90%
100%
Fib
er
Ca
lciu
m
Ma
gn
es
ium
Vita
min
D
Fo
late
Vita
min
E
Amountmissing indiet
NutrientIntake%
RD
A, D
RI,
AI
Sources: Dietary Reference Intakes (2002) Food and Nutrition Board (FNB), Institute of Medicine (IOM), National Health and Nutrition Examination Survey
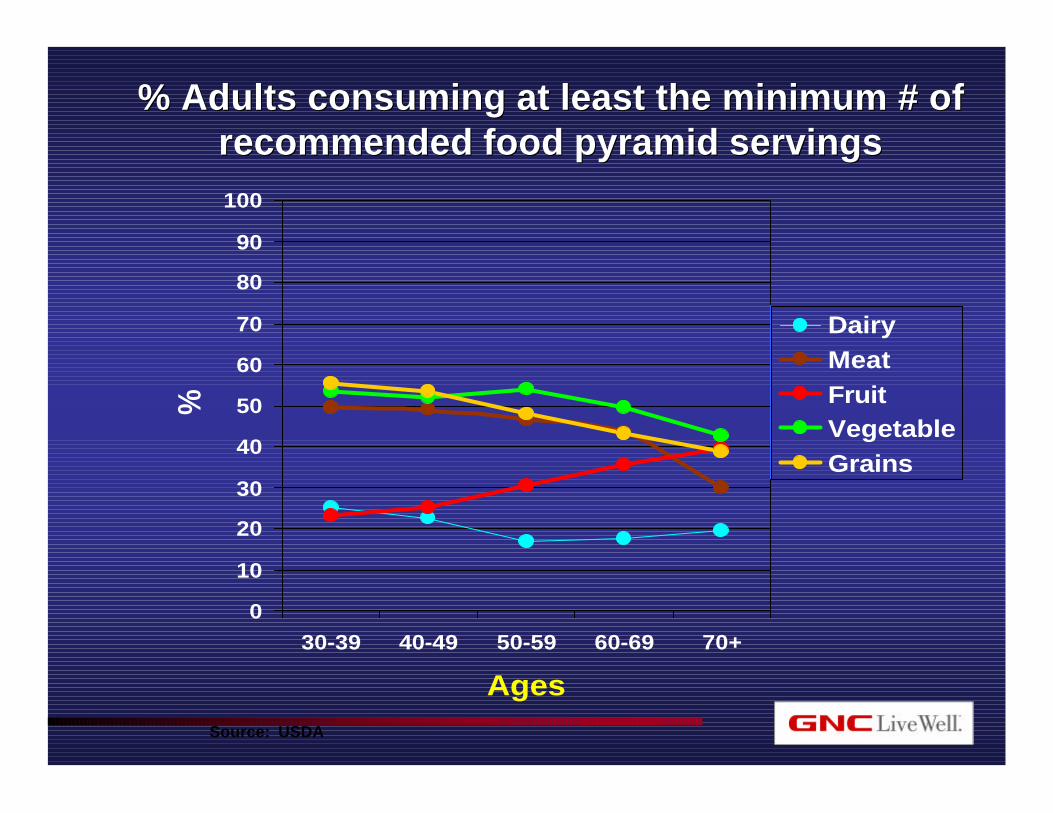
% Adults consuming at least the minimum # of % Adults consuming at least the minimum # of recommended food pyramid servingsrecommended food pyramid servings
0
10
20
30
40
50
60
70
80
90
100
30-39 40-49 50-59 60-69 70+
Ages
%
DairyMeatFruitVegetableGrains
Source: USDA


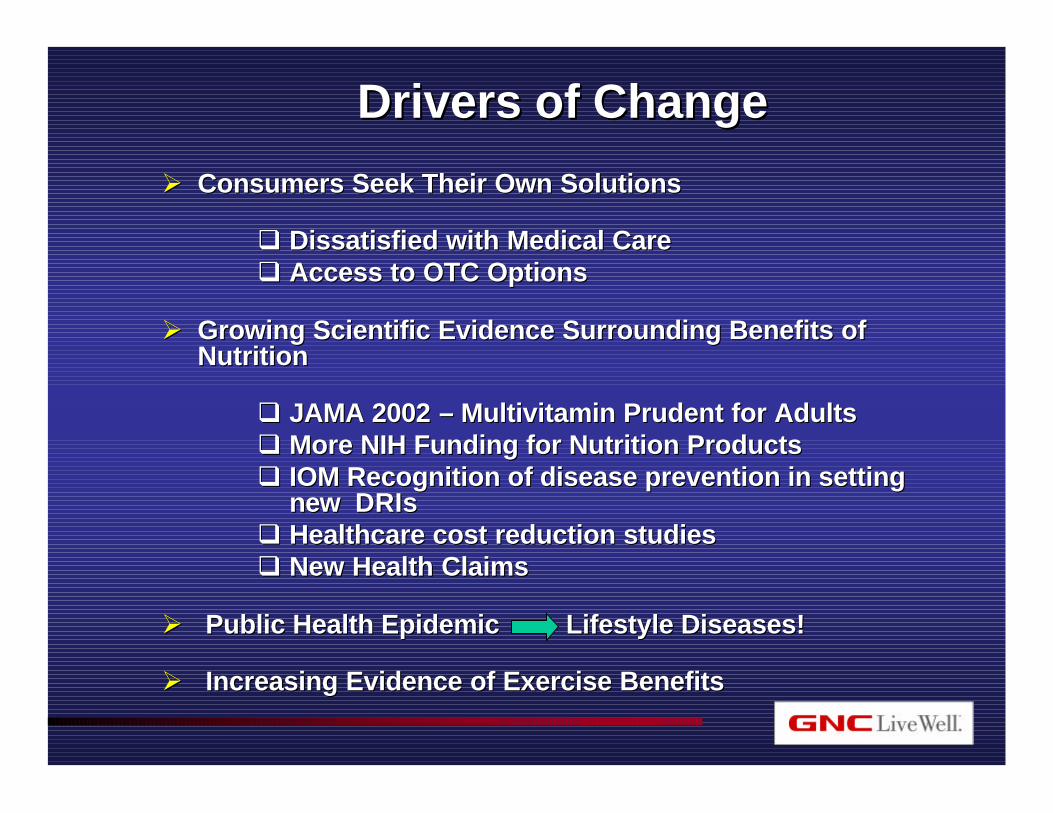
Drivers of ChangeDrivers of Change
ØØ Consumers Seek Their Own SolutionsConsumers Seek Their Own Solutions
qq Dissatisfied with Medical CareDissatisfied with Medical Careqq Access to OTC OptionsAccess to OTC Options
ØØ Growing Scientific Evidence Surrounding Benefits of Growing Scientific Evidence Surrounding Benefits of NutritionNutrition
qq JAMA 2002 JAMA 2002 –– Multivitamin Prudent for AdultsMultivitamin Prudent for Adultsqq More NIH Funding for Nutrition ProductsMore NIH Funding for Nutrition Productsqq IOM Recognition of disease prevention in setting IOM Recognition of disease prevention in setting
new new DRIsDRIsqq Healthcare cost reduction studiesHealthcare cost reduction studiesqq New Health ClaimsNew Health Claims
ØØ Public Health Epidemic Lifestyle Diseases!Public Health Epidemic Lifestyle Diseases!
ØØ Increasing Evidence of Exercise BenefitsIncreasing Evidence of Exercise Benefits
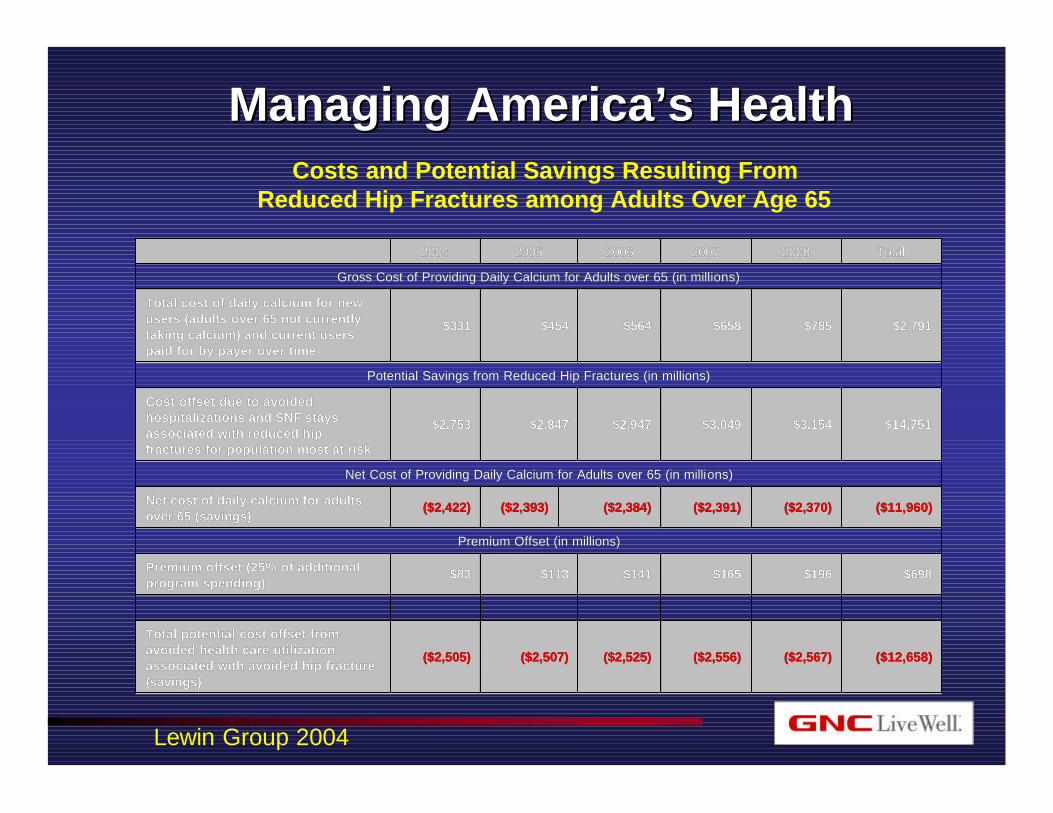
Managing America’s HealthManaging America’s Health
($12,658)($12,658)($2,567)($2,567)($2,556)($2,556)($2,525)($2,525)($2,507)($2,507)($2,505)($2,505)
Total potential cost offset from Total potential cost offset from avoided health care utilization avoided health care utilization associated with avoided hip fracture associated with avoided hip fracture (savings)(savings)
$698 $698 $196 $196 $165 $165 $141 $141 $113 $113 $83 $83 Premium offset (25% of additional Premium offset (25% of additional program spending)program spending)
Premium Offset (in millions)Premium Offset (in millions)
($11,960)($11,960)($2,370)($2,370)($2,391)($2,391)($2,384)($2,384)($2,393)($2,393)($2,422)($2,422)Net cost of daily calcium for adults Net cost of daily calcium for adults over 65 (savings)over 65 (savings)
Net Cost of Providing Daily Calcium for Adults over 65 (in milliNet Cost of Providing Daily Calcium for Adults over 65 (in millions)ons)
$14,751 $14,751 $3,154 $3,154 $3,049 $3,049 $2,947 $2,947 $2,847 $2,847 $2,753 $2,753
Cost offset due to avoided Cost offset due to avoided hospitalizations and SNF stays hospitalizations and SNF stays associated with reduced hip associated with reduced hip fractures for population most at riskfractures for population most at risk
Potential Savings from Reduced Hip Fractures (in millions)Potential Savings from Reduced Hip Fractures (in millions)
$2,791 $2,791 $785 $785 $658 $658 $564 $564 $454 $454 $331 $331
Total cost of daily calcium for new Total cost of daily calcium for new users (adults over 65 not currently users (adults over 65 not currently taking calcium) and current users taking calcium) and current users paid for by payer over timepaid for by payer over time
Gross Cost of Providing Daily Calcium for Adults over 65 (in milGross Cost of Providing Daily Calcium for Adults over 65 (in millions)lions)
TotalTotal2008200820072007200620062005200520042004
Costs and Potential Savings Resulting FromReduced Hip Fractures among Adults Over Age 65
Lewin Group 2004
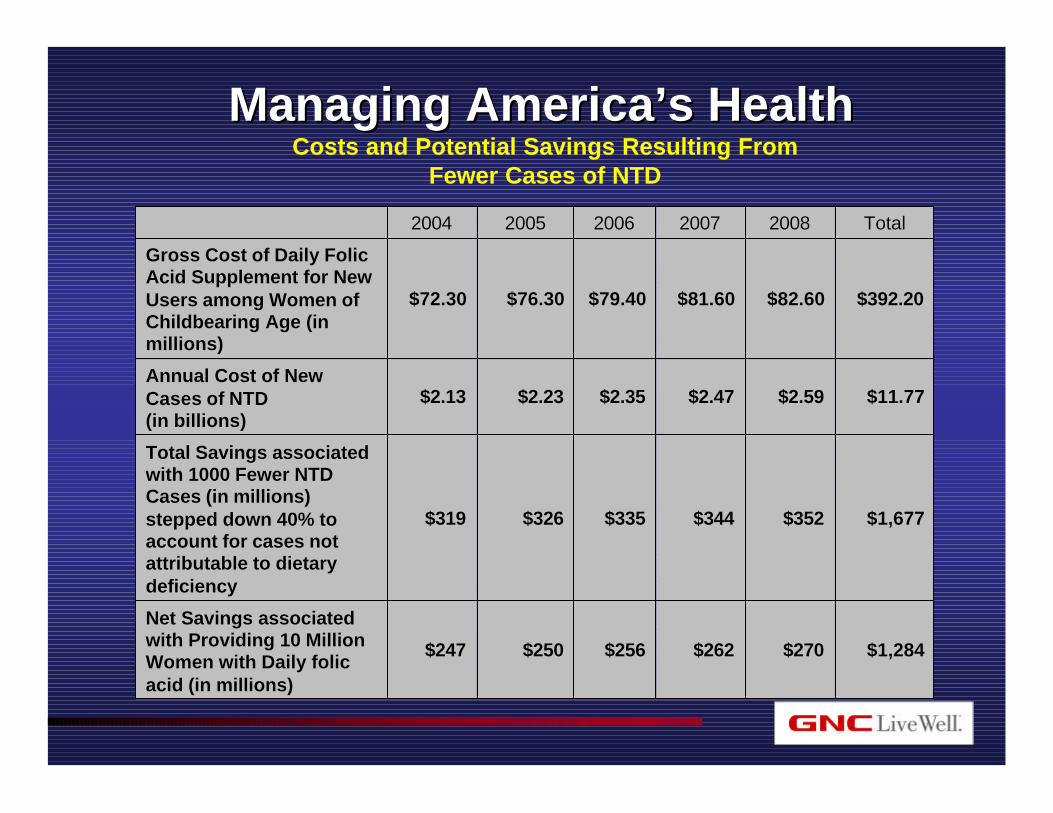
Managing America’s HealthManaging America’s Health
$1,284$1,284$270$270$262$262$256$256$250$250$247$247
Net Savings associated Net Savings associated with Providing 10 Million with Providing 10 Million Women with Daily folic Women with Daily folic acid (in millions)acid (in millions)
$1,677$1,677$352$352$344$344$335$335$326$326$319$319
Total Savings associated Total Savings associated with 1000 Fewer NTD with 1000 Fewer NTD Cases (in millions) Cases (in millions) stepped down 40% to stepped down 40% to account for cases not account for cases not attributable to dietary attributable to dietary deficiencydeficiency
$11.77$11.77$2.59$2.59$2.47$2.47$2.35$2.35$2.23$2.23$2.13$2.13Annual Cost of New Annual Cost of New Cases of NTDCases of NTD(in billions)(in billions)
$392.20$392.20$82.60$82.60$81.60$81.60$79.40$79.40$76.30$76.30$72.30$72.30
Gross Cost of Daily Folic Gross Cost of Daily Folic Acid Supplement for New Acid Supplement for New Users among Women of Users among Women of Childbearing Age (in Childbearing Age (in millions)millions)
TotalTotal2008200820072007200620062005200520042004
Costs and Potential Savings Resulting FromFewer Cases of NTD
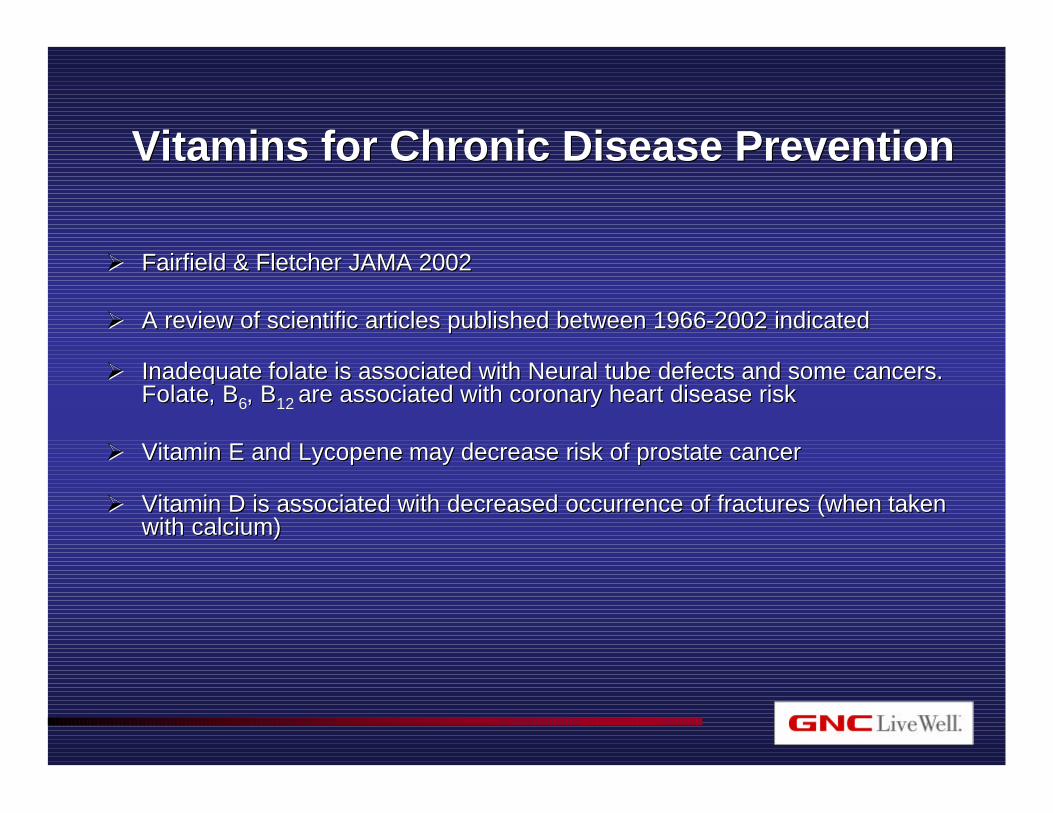
Vitamins for Chronic Disease PreventionVitamins for Chronic Disease Prevention
ØØ Fairfield & Fletcher JAMA 2002Fairfield & Fletcher JAMA 2002
ØØ A review of scientific articles published between 1966A review of scientific articles published between 1966--2002 indicated2002 indicated
ØØ Inadequate Inadequate folatefolate is associated with Neural tube defects and some cancers. is associated with Neural tube defects and some cancers. FolateFolate, B, B66, B, B12 12 are associated with coronary heart disease riskare associated with coronary heart disease risk
ØØ Vitamin E and Vitamin E and LycopeneLycopene may decrease risk of prostate cancermay decrease risk of prostate cancer
ØØ Vitamin D is associated with decreased occurrence of fractures (Vitamin D is associated with decreased occurrence of fractures (when taken when taken with calcium)with calcium)
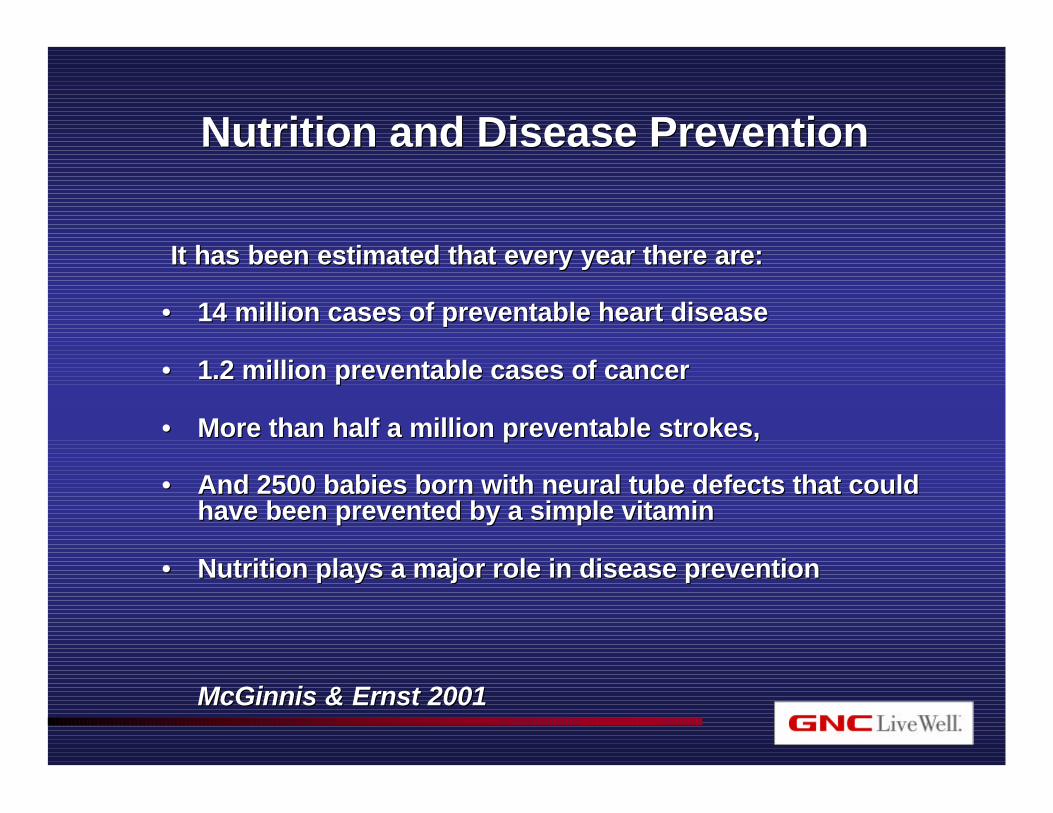
Nutrition and Disease PreventionNutrition and Disease Prevention
It has been estimated that every year there are:It has been estimated that every year there are:
•• 14 million cases of preventable heart disease14 million cases of preventable heart disease
•• 1.2 million preventable cases of cancer1.2 million preventable cases of cancer
•• More than half a million preventable strokes,More than half a million preventable strokes,
•• And 2500 babies born with neural tube defects that could And 2500 babies born with neural tube defects that could have been prevented by a simple vitaminhave been prevented by a simple vitamin
•• Nutrition plays a major role in disease preventionNutrition plays a major role in disease prevention
McGinnis & Ernst 2001McGinnis & Ernst 2001
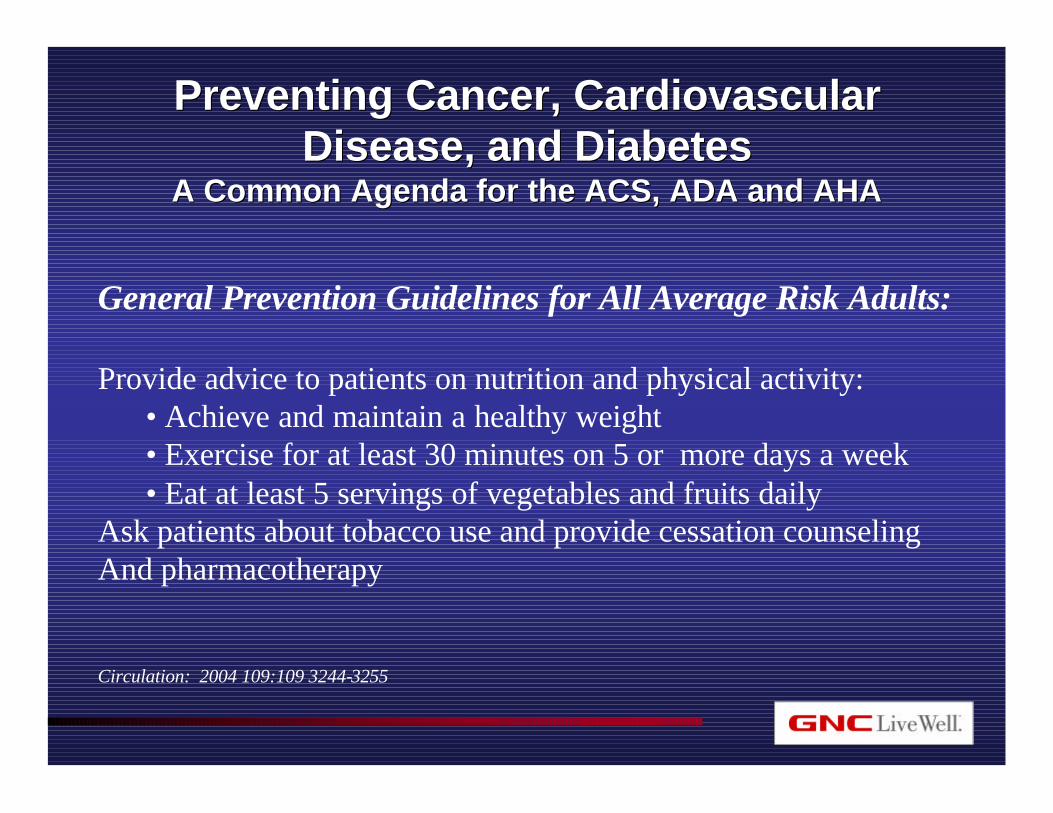
Preventing Cancer, Cardiovascular Preventing Cancer, Cardiovascular Disease, and DiabetesDisease, and Diabetes
A Common Agenda for the ACS, ADA and AHAA Common Agenda for the ACS, ADA and AHA
General Prevention Guidelines for All Average Risk Adults:
Provide advice to patients on nutrition and physical activity:• Achieve and maintain a healthy weight• Exercise for at least 30 minutes on 5 or more days a week• Eat at least 5 servings of vegetables and fruits daily
Ask patients about tobacco use and provide cessation counseling And pharmacotherapy
Circulation: 2004 109:109 3244-3255
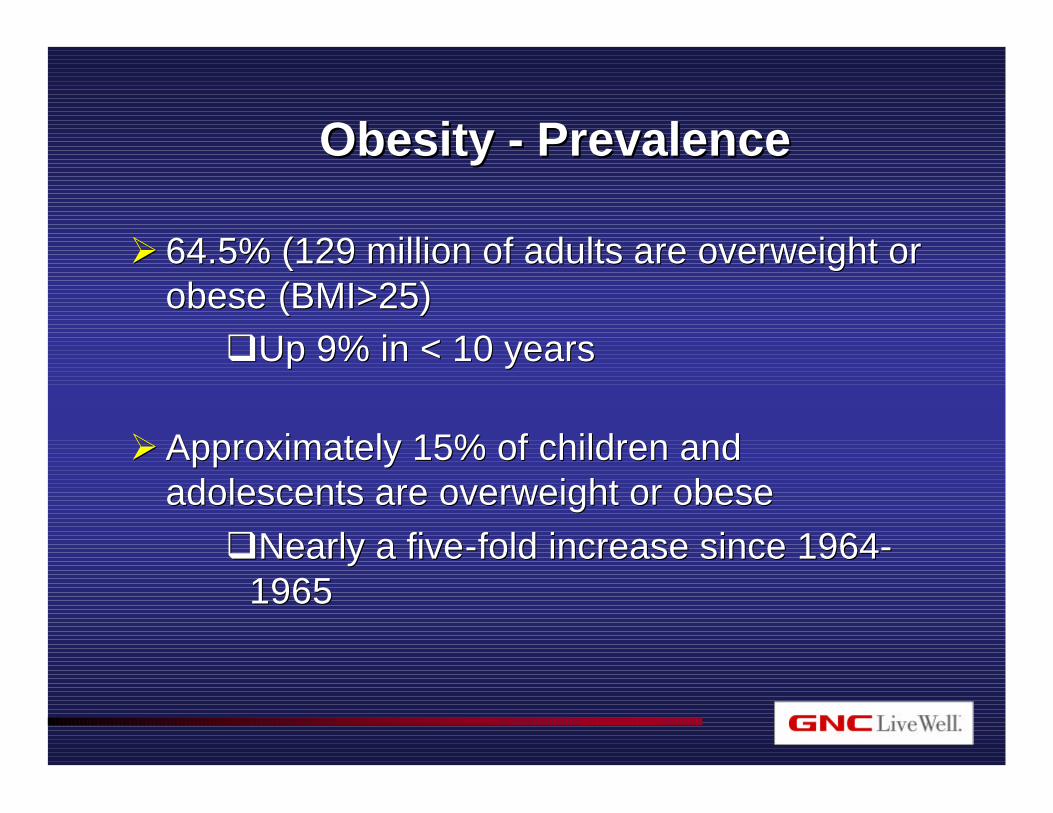
Obesity Obesity -- PrevalencePrevalence
ØØ 64.5% (129 million of adults are overweight or 64.5% (129 million of adults are overweight or obese (BMI>25)obese (BMI>25)qqUp 9% in < 10 yearsUp 9% in < 10 years
ØØ Approximately 15% of children and Approximately 15% of children and adolescents are overweight or obeseadolescents are overweight or obeseqqNearly a fiveNearly a five--fold increase since 1964fold increase since 1964--
19651965
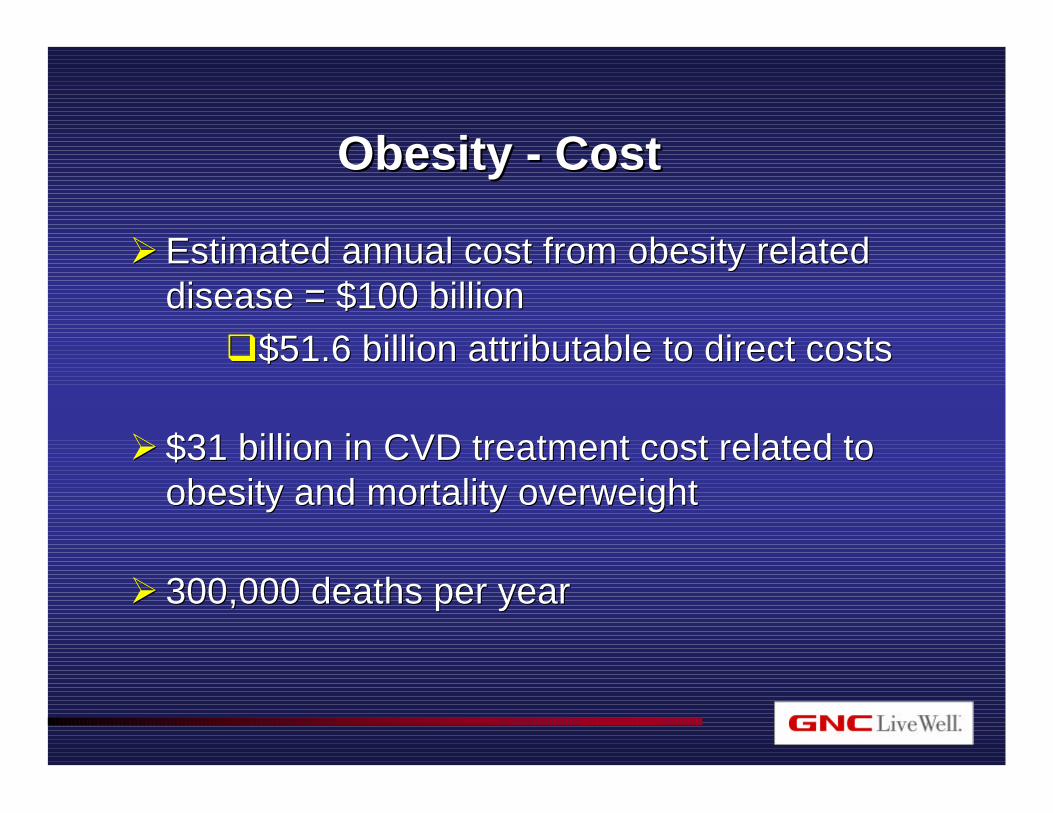
Obesity Obesity -- CostCost
ØØ Estimated annual cost from obesity related Estimated annual cost from obesity related disease = $100 billiondisease = $100 billionqq$51.6 billion attributable to direct costs$51.6 billion attributable to direct costs
ØØ $31 billion in CVD treatment cost related to $31 billion in CVD treatment cost related to obesity and mortality overweightobesity and mortality overweight
ØØ 300,000 deaths per year300,000 deaths per year
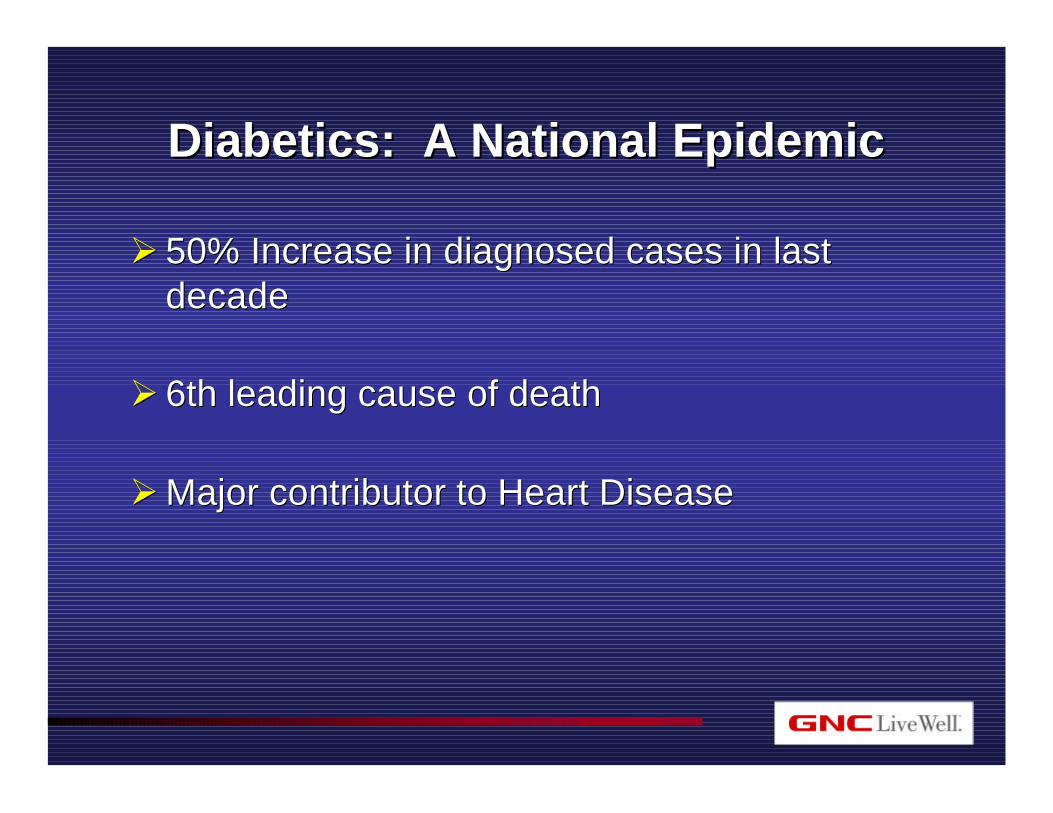
Diabetics: A National EpidemicDiabetics: A National Epidemic
ØØ 50% Increase in diagnosed cases in last 50% Increase in diagnosed cases in last decadedecade
ØØ 6th leading cause of death6th leading cause of death
ØØMajor contributor to Heart DiseaseMajor contributor to Heart Disease
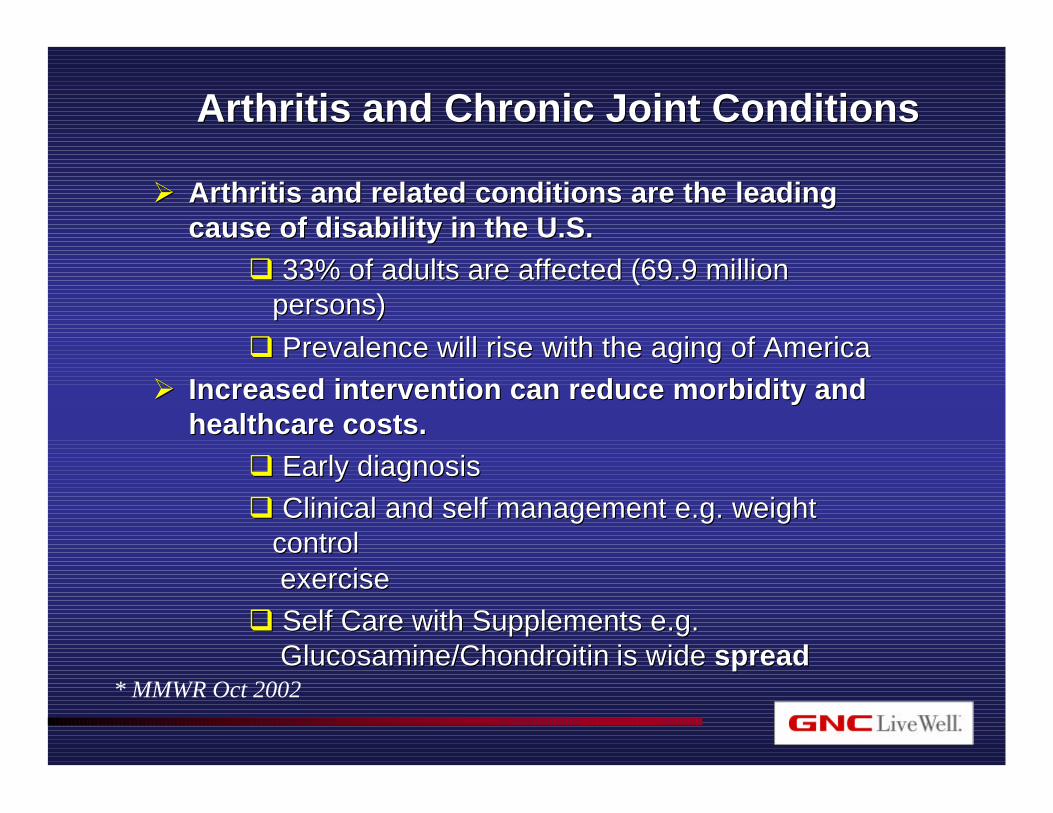
Arthritis and Chronic Joint ConditionsArthritis and Chronic Joint Conditions
ØØ Arthritis and related conditions are the leading Arthritis and related conditions are the leading cause of disability in the U.S.cause of disability in the U.S.
qq 33% of adults are affected (69.9 million 33% of adults are affected (69.9 million persons)persons)
qq Prevalence will rise with the aging of AmericaPrevalence will rise with the aging of AmericaØØ Increased intervention can reduce morbidity and Increased intervention can reduce morbidity and
healthcare costs.healthcare costs.qq Early diagnosisEarly diagnosisqq Clinical and self management e.g. weight Clinical and self management e.g. weight
controlcontrolexerciseexercise
qq Self Care with Supplements e.g.Self Care with Supplements e.g.Glucosamine/ChondroitinGlucosamine/Chondroitin is wideis wide spreadspread
* MMWR Oct 2002
Watch the discussion again or share it.Order this session–and many more–on DVD!
Please visit the DVD Center in the Executive Center to order copies for you and your associates.
Special discount for attendees only for the duration of the event.