gb935 concepts & principles v7.0
DESCRIPTION
eTOm Concepts & PrinciplesTRANSCRIPT
Business Metrics Scorecard (BMS)
GB935Concepts & Principles
Version 7.0April, 2013
©TM Forum 2013. All Rights Reserved.
BMS – Concepts & Principles
Notice
Copyright © TeleManagement Forum 2013. All Rights Reserved.
This document and translations of it may be copied and furnished to others, and derivative works that comment on or otherwise explain it or assist in its implementation may be prepared, copied, published, and distributed, in whole or in part, without restriction of any kind, provided that the above copyright notice and this section are included on all such copies and derivative works. However, this document itself may not be modified in any way, including by removing the copyright notice or references to TM FORUM, except as needed for the purpose of developing any document or deliverable produced by a TM FORUM Collaboration Project Team (in which case the rules applicable to copyrights, as set forth in the TM FORUM IPR Policy, must be followed) or as required to translate it into languages other than English.
The limited permissions granted above are perpetual and will not be revoked by TM FORUM or its successors or assigns.
This document and the information contained herein is provided on an "AS IS" basis and TM FORUM DISCLAIMS ALL WARRANTIES, EXPRESS OR IMPLIED, INCLUDING BUT NOT LIMITED TO ANY WARRANTY THAT THE USE OF THE INFORMATION HEREIN WILL NOT INFRINGE ANY OWNERSHIP RIGHTS OR ANY IMPLIED WARRANTIES OF MERCHANTABILITY OR FITNESS FOR A PARTICULAR PURPOSE.
Direct inquiries to the TM Forum office: 240 Headquarters Plaza,East Tower – 10th Floor,Morristown, NJ 07960 USATel No. +1 973 944 5100Fax No. +1 973 944 5110TM Forum Web Page: www.tmforum.org
GB935, Version 7.0 TM Forum 2013. All Rights Reserved. Page 2 of 40
BMS – Concepts & Principles
Table of Contents
Notice............................................................................................................................................2
Table of Contents..........................................................................................................................3
List of Figures...............................................................................................................................4
Executive Summary......................................................................................................................5
1. Introduction...............................................................................................................................61.1. Document Overview.....................................................................................................61.2. Industry Benefit.............................................................................................................6
2. Business Metric Taxonomy......................................................................................................82.1. Metric Terminology.......................................................................................................82.2. Metric Naming............................................................................................................102.3. Metric Categories.......................................................................................................13
2.3.1. Domain............................................................................................................132.3.2. Process Focus..................................................................................................142.3.3. Topic................................................................................................................14
2.4. Metric Codes..............................................................................................................162.5. Metrics and "Meta Processes".....................................................................................182.6. Metric Model...............................................................................................................212.7. Supporting Taxonomies..............................................................................................25
2.7.1. Business Object Taxonomy...............................................................................252.7.2. Business Value Driver Taxonomy......................................................................27
3. The Business Metrics Scorecard (BMS).................................................................................293.1. The Customer Experience Life Cycle..........................................................................293.2. Structure of the Business Metrics Scorecard................................................................323.3. Navigating the Business Metrics Scorecard.................................................................34
Appendix A: Terms and Abbreviations Used within this Document.........................................36
Appendix B: Administrative Information....................................................................................38B.1. Version History...........................................................................................................38B.2. Release History..........................................................................................................39B.3. Document Family and Related Documents.................................................................39
GB935, Version 7.0 TM Forum 2013. All Rights Reserved. Page 3 of 40
BMS – Concepts & Principles
List of Figures
Figure 1 - The Balanced Scorecard 13
Figure 2 - Process Foci 14
Figure 3 - Example of how coding is used for the business metrics 17
Figure 4 - Fulfillment Meta Process 19
Figure 5 - Assurance Meta Process 19
Figure 6 - Billing Meta Process 20
Figure 7 - Customer Management Meta Process 20
Figure 8 - Customer Experience Lifecycle 29
Figure 9 - Business Metrics Scorecard 32
Figure 10 - F-CE-2a 34
Figure 11 - B-OE-2c and B-OE-2d 35
GB935, Version 7.0 TM Forum 2013. All Rights Reserved. Page 4 of 40
BMS – Concepts & Principles
Executive Summary
Service providers are striving to achieve business excellence and are increasingly looking to the TM Forum for guidance and understanding: What does business excellence mean? How far away from business excellence are we? What initiatives should we develop in order to obtain the benefits of achieving business excellence?
For these purposes the industry requires quantitative as well as qualitative information to support its evolution in the increasingly complex market that is developing. Service providers need measures that will focus attention on aspects of their operation and areas of their business where improvement will bring the most benefit. They also need a way to compare themselves with their peers and to promote areas in which they are able to offer uniquely superior performance.
The TM Forum is addressing this situation with the Business Metrics Scorecard. The objective of this team is to create a set of business metrics aimed specifically at business performance at the service level. These are living metrics developed and maintained by a project team and will evolve over time to continually reflect the interests of the service provider community. This is a real example of work done for the industry by the industry.
Further information on the measures and the benchmarking data associated with them is provided in other output from this team and TM Forum (see www.tmforum.org or email [email protected] for more information).
GB935, Version 7.0 TM Forum 2013. All Rights Reserved. Page 5 of 40
BMS – Concepts & Principles
1. Introduction
1.1. Document Overview
The GB935 document family describes the TM Forum output related to business metrics. The document family consists of several documents, including a Concepts & Principles document, an addendum A that lists out the business metric specifications, and an addendum B that describes the process for contributing new business metrics.
This Concepts & Principles document provides an overview of the business metrics that have been developed in collaboration with service providers via the Business Metrics Scorecard team. This includes definitions of key terms, taxonomy, naming conventions, and how the metrics are structurally composed into a business metrics scorecard.
The Business Metric Specifications Addendum A lists the definitions of the 100+ business metrics that are currently active with the BMS team. This includes key attributes like naming, codes, categories, formula, description, units, etc. The Business Metrics Development Guide Addendum B describes how contributors can submit new metric proposals to the BMS team, and includes the process to follow and the definition detail they should fill out in a provided form. Additional information concerning each metric and its corresponding benchmarking data is available by contacting the business benchmarking team ([email protected]), and/or subscribing to its reports and services.
1.2. Industry Benefit
The Business Metrics Scorecard group is responsible for the TM Forum Business Metrics used by digital service providers and suppliers as standard industry business performance metrics. This includes identification of new metrics requirements, as triggered by the proliferation of new and innovative services and extension of the Balanced Scorecard as needed.
To assist in this goal, the BMS team is motivated by the following key functions:
Standardize the vocabulary and modeling of business metrics
Standardize the definition of specific business metrics, that appear on the Business Metrics Scorecard
Build holistic linkages between BMS metrics and other TM Forum standards
Additionally, the BMS metrics are used as the basis for the TM Forum’s Business Benchmarking Studies, Metrics Conformance testing, and various Benchmarking Services, which leads to additional benefits that include:
Access to relevant benchmarking data, that are:
o Service offering focused
o Assessed against relevant peers
GB935, Version 7.0 TM Forum 2013. All Rights Reserved. Page 6 of 40
BMS – Concepts & Principles
Ability to develop investment business cases based on achievable targets to support improvement initiatives
Awareness of areas of strength
Means to analyze the inter-relationship between metrics
Access to industry trends.
The benefits will be attained on the basis of analyzed and raw benchmarking data that will be available in two forms:
Benchmarking Study Summary Reports
A secure current database that can be queried – the Business Benchmarking Secure Web-Portal.
GB935, Version 7.0 TM Forum 2013. All Rights Reserved. Page 7 of 40
BMS – Concepts & Principles
2. Business Metric Taxonomy
Before we can advance much further with our metrics discussion, we need to state clearly how we intend to use the various metrics-related terms (like metric, measure, benchmark, etc.).
2.1. Metric Terminology
The business metrics that have been developed and housed in the Business Metrics Scorecard represent areas of business operation that are important in assessing business performance, customer satisfaction/loyalty and operational efficiency. Any metric managed by the BMS team will be called a business metric. A business metric must:
Be intelligible to anyone familiar with high-level telecom business concepts; i.e. a business metric does not require specialist or technical knowledge
Be appropriate to include in a business scorecard, i.e. a set of enterprise-level performance indicators of the business
Be part of a select minority of all metrics; i.e. it is not likely that all measurable things are business metrics.
According to the US National Institute of Standards and Technology, “a measure is for more concrete or objective attributes and metric for more abstract, higher-level, or somewhat subjective attributes”.1 A measure is a more general concept than a metric. Any quantity can be measured, but a good business metric also has a clearly understood preferred progression, a numerical directionality which indicates how we’d like to see the metric change as the business improves. Preferred progression can come in many different flavors, like:
The higher, the better (like revenue) The lower, the better (like customer response time) The closer to a specific value, the better (like body temperature) Can be equal to or lower than a value, but must not exceed (like a speed limit) Can be equal to or higher than a specific value, but must not be lower (like bank account
balance).
A metric is more likely to be some sort of comparison between two values, often expressed as a ratio, less frequently as a difference. But still, not all metrics need be comparisons. So for example, one can have a metric which is the number of days it takes to go from bill cycle close to bills issued. However, even this simple count does have directionality -- since the shorter this delay, the better.
A metric begins with the thing being measured. The measurand is the "entity quantified by the measure"2. Important kinds of measurands in the BMS work include:
number of subjects, or more specifically:o number of things (like # bills)o number of events (like # customer contacts)o number of people (like # customers)
monetary value of subjectso monetary value of things (like $ value of bills)
1 National Institute of Standards and Technology, http://samate.nist.gov/index.php/Metrics_and_Measures.html
2 Structured Metrics Metamodel (SMM), V1.0
GB935, Version 7.0 TM Forum 2013. All Rights Reserved. Page 8 of 40
BMS – Concepts & Principles
o monetary value of processes or capabilities (like $ cost of assurance) time durations
o time durations for work effort (like # hours for all order processing)o time durations between events (like # hours between customer requested date
and customer committed date)
A benchmark generally suggests that a number or set of numbers is available for the metric that is indicative of either an average or a target for the industry. While the BMS team is responsible for defining business metrics, the Benchmarking team is responsible for running benchmarking studies using these metrics, which generates reports containing benchmark numbers, both average and 80-percentile values, among others.
A dimension is a breakdown scheme for a metric. For example, a metric like "Revenue" can be dimensioned by region, by service, by market segment, etc. or indeed by any combination of these. Ideally, a dimension should not be part of a metric name, since one can instantiate many metrics from one metric by running through all combinations of dimensions -- and that just leads to clutter.
Note that Frameworx business metrics are service offering (SO) agnostic, and as such can be dimensioned by any appropriate service. That means that the same metric (F-CE-2a Mean Duration to Fulfill ) would be used to study service fulfillment time for residential broadband, mobile services, or IP VPNs. Obviously, the data collected would be quite different. Thus, it is generally not appropriate, for example, to compare a fulfillment metric for mobile service against a fulfillment benchmark for DSL service.
GB935, Version 7.0 TM Forum 2013. All Rights Reserved. Page 9 of 40
BMS – Concepts & Principles
2.2. Metric Naming
A given metric might be expressed in multiple equivalent ways. For example, one could write "A as a % of B" or "% A of B" or "A/B %". All this variety can lead to the same metric erroneously entered multiple times in different namings, or else might make it difficult to find a metric given different namings. So in order to ensure consistency in the naming of metrics, a set of naming type was used to standardize metrics, detailed below.
What principles guided these metric name types? A good metric name should provide the gist of the metric without having to resort to looking up further detail. For example, "# hours to fulfill service order" is better than "time to fulfill service order" since we do not need to look up the units. Also, "# hours" is self-explanatory, so we do not need to write "Number of hours". Also business objects and their states have been standardized as much as possible; so we use "bills" instead of "invoices", for example. Lists of standardize business objects, value drivers, and other expressions are presented later in this chapter.
Some ratios are ratios of the same thing, where some subset based on attribute is in the numerator. This can be written very compactly. For example "% bills issued electronically" means "% of bills that were issued electronically out of total bills". A percentage of two different things in the same units can be written as "% opex, of revenue", where the comma and "of" are used to indicate what the percent is based on. In the most general case, we have two different things in a ratio, like cost of fulfillment per employee. Such ratios are generally not written as percents.
Prose metric names are written in title case. In addition to a Prose Name, a metric also has an "XLS Name". This is driven by the need to have clear formulas for derived metrics. So while older formulas exist in Prose Formula form, we have made sure that every formula can also be expressed an XLS Formula using the XLS Names. XLS Names are written in lowercase using the syntax for named ranges in Microsoft Excel3, or in other spreadsheet products that adopt the same naming conventions.
To summarize, metric naming in BMS FX13 has been driven by several needs:
To keep the name as short as possible. To keep the name meaningful enough so that we reduce the need to reference the more
complete definition in the documentation To keep the structure of the names consistent To keep the terms in the name consistent (see Business Object Model for BMS
Measurand)
Below are the principle metric naming types used in FX13:
Type: Count - Basic
Format: # <business-objects> Example: # Bills Format: # <business-objects> <qualification> Example: # Bills Issued Note: It is important to follow the metric format exactly. Thus it is "# Bills", not "# of Bills",
not "# Bills Total", not "Number of Bills", etc.3 http://office.microsoft.com/en-ca/excel-help/define-and-use-names-in-formulas-HA102749565.aspx#_Toc312073993
GB935, Version 7.0 TM Forum 2013. All Rights Reserved. Page 10 of 40
BMS – Concepts & Principles
Type: Valuation
Since currency is a count of dollars, it is similar to a count, except that the business object is not countable, but rather a financial concept that can be "evaluated".
Format: $ <financial-object> Example: $ Revenue Note: A native financial concept (like cost or revenue) is easily understood to be
"evaluatable". But if the item being evaluated is not a native financial concept, like the money value of bills issued, we precede the object with "value of". Thus bills, which can either be counted or evaluated, need require the expression "$ Value of Bills" to clearly indicate we mean the dollar value and not the count of bills.
Type: Ratio - Simple
Format: % <business-object> <qualification> Implication: % <business-object> <qualification> / <business-object> Total Example: % Activation Failed Implication: % Activations Failed / Activations Total Note: This is the simplest kind of ratio to express since the same business object is
referenced in the numerator and the denominator. Thus a % can be used to denote his type.
Type: Ratio - Common
Format: % <business-objects-1> , of <business-objects-2> Implication: % <business-object> <qualification> / <business-object> Example: % Cost of Fulfillment, of Opex Implication: % Cost of Fulfillment / Opex Note: This is a ratio of two different business objects, but expressed in the same units.
Because the units are the same, a % will also be used to denote this type.
Type: Ratio - General
Format: # <business-objects> per <business-object> Example: # Minutes per Service Problem Resolution Note: This is the most general kind of ratio to express, since the numerator and
denominator can be totally difference objects. The "per" is used to denote this type.
Type: Ratio - Over One
Description: There are some BMS ratios that are really not ratios, but needed to be expressed as a numerator over denominator of 1 for historical modeling reasons.
Type: Special Name
Description: Some of the metric names do not follow the above canonical rules. This occurs when a common industry name is preferred. Thus, rather than saying "% Customer Requests Resolved on First Call", we prefer to use the common industry name "First Call Resolution (FCR)". Since industry names exist independently of our naming convention, we denote these as Special Names.
Example: First Call Resolution (FCR)
Type Suffix: Metric-Name-Type - By Dimension
Description: Generally a dimension should not be part of a metric definition intrinsically. Rather, the dimensions should be listed out in the separate field (Prose or XLS)
GB935, Version 7.0 TM Forum 2013. All Rights Reserved. Page 11 of 40
BMS – Concepts & Principles
Dimensions. But we permit this due to historical reasons: many of the metrics already in the Scorecard are pre-dimensioned. But going forward, we advocate that metric dimensions should be extracted from the definition proper, and kept in the Dimension field.
Format: <metric-name-type> , by <dimension> Type Example: # Bills Issued, by Delivery Type Note: A dimension phrase is always started with a comma and the word "by" and ends
with the word "Type". Other uses of the word "by" may exist, and these are not dimensioned metrics (like "% Problem Reports Resolved by Due Date", which does not have the comma before "by"). Also note that a pre-dimensioned metric will have multiple values, distributed by the values of the dimension. So the above example metric will have values for each of the different Delivery Types, like paper invoice, e-bill, etc.
Type: Suffix: Metric-Name-Type - By Dimension Value
Description: A few metrics are explicitly dimensioned by just one dimension value. For example, rather than metric by "Service Type", it is a metric "By Voice Services" only. The construction is similar to the preceding, except there is no "Type" at the end.
Format: <metric-name-type> , by <dimension-value> Example: % Revenue, by Voice Services
Other Patterns
Note that other patterns also recur within the metric names:
If a business object's time between two states is being measured, expressions like "from <state1> to <state2>" appear, as in "# Hours for all Orders, from Ordering to Activation".
Generic metric words that can be used everywhere (like Average, Mean or Total) are avoided. The word Mean is actually reserved for the benchmarking reports -- as in the mean of a metric given that the sample data has come from many CSPs. Otherwise, without these conventions, we would end up having a "Mean of a Mean", which is a bit unwieldy.
To distinguish the time for one instance of a business object versus the aggregate time for all instances, the word "All" is used, as in "# Hours for All Orders" (an aggregate) versus "#Hours per Order" (an average or mean).
As these patterns evolve, we will document them in future versions of GB935.
GB935, Version 7.0 TM Forum 2013. All Rights Reserved. Page 12 of 40

BMS – Concepts & Principles
2.3. Metric Categories
The TM Forum Business Metrics have been used by the Business Benchmarking program by over 170 service providers in 65 countries to,
Assess business health, identify problem areas and drive focused improvement Support business case, budgeting and investment decisions and Track business performance against best-in-class peers based on geography, size
and service offering.
The BMS Business Metrics are based on a scaffold that targets business performance based on a balanced scorecard. The balanced scorecard looks at financial, customer-oriented and process oriented measures.
Figure 1 - The Balanced Scorecard
2.3.1. Domain
Comparing performance indicators in each of the 3 areas of the balanced scorecard are required for a 360-degree view (Figure 1)
Revenue and Margin – financial performance indicators such as OpEx as a % of revenue or recovered leakage
Customer Experience – indicators from the customer-facing side of the business Operational Efficiency – indicators around the key operational process areas of
fulfillment, assurance, billing, and Call Center
GB935, Version 7.0 TM Forum 2013. All Rights Reserved. Page 13 of 40
BMS – Concepts & Principles
The metrics have been developed to be service agnostic and to be applicable across existing and future service offerings. A service change or an addition of a new service will not have an impact on the definition of the metric.
2.3.2. Process Focus
The Balanced Scorecard is further divided into 5 process focus areas as shown in the figure below, namely General, Customer Management, Fulfillment, Assurance and Billing. This delineation helps to concentrate the measure in specific service provider process areas. Metrics with a General process focus address the entire line of business. While metrics in the Domains of Customer Experience and Operational Efficiency, fall into one of process foci of Customer Management, Fulfillment, Assurance, and Billing.
Figure 2 - Process Foci
2.3.3. Topic
In addition to the process detail, topic areas are used to ensure that the metrics are organized in a clear fashion. The topic areas are defined by Balanced Scorecard Domain as;
Revenue And Margin1. Margin/Revenue
GB935, Version 7.0 TM Forum 2013. All Rights Reserved. Page 14 of 40

BMS – Concepts & Principles
2. OpEx/CapEx3. OpEx/Revenue4. Revenue Breakdown5. Customer Constancy
Customer Experience1. Preferred Access2. Customer Time Spent3. Usability4. Accuracy5. Contact Availability6. Ease of Doing Business7. Pricing Flexibility8. Security
Operational Efficiency1. Unit Cost2. Time3. Rework4. Simplicity5. Process Flexibility6. Utilization
Each metric has a domain, process focus, and topic. The decomposition of domains according to process is applied to Customer Experience and Operational Efficiency. Revenue and Margin maintains an overall, general view of the service offering, and is not broken down further.
Metrics have been defined for combinations of domain, process focus and topic. The resultant high-level scaffold is described further in “The Business Metrics Scaffold”.
In some cases, it has been appropriate to position the metrics with a lower level of granularity. For this purpose, modifying details have been defined for certain metrics. An example of modifying detail is addressing specific customer segments, i.e. Consumer & SME vs. Large Enterprise & Government. Appendix A contains some of the modifying details (“possible options”) that are available for selected metrics.
GB935, Version 7.0 TM Forum 2013. All Rights Reserved. Page 15 of 40
BMS – Concepts & Principles
2.4. Metric Codes
Every BMS metric is associated with a metric code, for example, "CM-CE-2b" is the metric code for "Average Handle Time". At first glance the metric codes seem complex, but in fact, they contain useful information about the metric. The code naming leverages the Balanced Scorecard refinements described above. A metric is uniquely coded as follows:
<Process Focus>- <Domain> -<Topic Number>-<a-z>
Where Process Focus is one of:
General metrics (G)
Customer Management metrics (CM)
Fulfillment metrics (F)
Assurance metrics (A)
Billing Metrics (B)
And Domain is one of:
Revenue and Margin (RM)
Customer Experience (CE)
Operational Efficiency (OE)
And Topic Number is a number representing the topics as covered in the Topics section earlier.
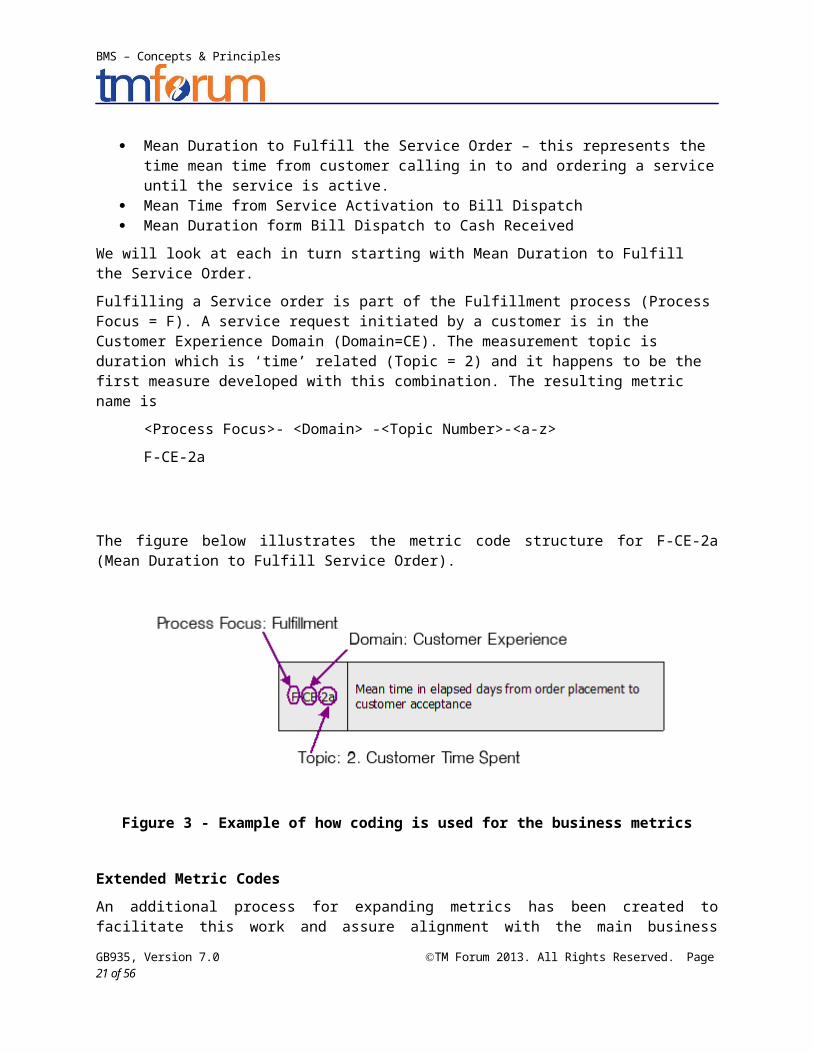
As an example let’s assume that we are looking at measuring the performance of the order to a process for a particular service offering. The order to cash process includes accepting and validating the customer order, procuring the service, activating the service, billing for the service and receiving payment for the service. Three metrics that are critical to do this are
Mean Duration to Fulfill the Service Order – this represents the time mean time from customer calling in to and ordering a service until the service is active.
Mean Time from Service Activation to Bill Dispatch Mean Duration form Bill Dispatch to Cash Received
We will look at each in turn starting with Mean Duration to Fulfill the Service Order.
Fulfilling a Service order is part of the Fulfillment process (Process Focus = F). A service request initiated by a customer is in the Customer Experience Domain (Domain=CE). The measurement topic is duration which is ‘time’ related (Topic = 2) and it happens to be the first measure developed with this combination. The resulting metric name is
<Process Focus>- <Domain> -<Topic Number>-<a-z>
F-CE-2a
GB935, Version 7.0 TM Forum 2013. All Rights Reserved. Page 16 of 40
BMS – Concepts & Principles
The figure below illustrates the metric code structure for F-CE-2a (Mean Duration to Fulfill Service Order).
Figure 3 - Example of how coding is used for the business metrics
Extended Metric Codes
An additional process for expanding metrics has been created to facilitate this work and assure alignment with the main business performance metrics developed by the Business Metrics Development team. To accommodate increased detail, these expanded metrics have additional characters in their metric codes. For example, the Revenue Assurance metrics link to the main business performance metrics via the Revenue and Margin Domain and the General Process Focus. This means that all RA metrics start with G-RM.
Secondly, to be understandable, expanded metrics need to have a topic identifier that is easily recognizable. Thus for Revenue Assurance metrics for example, “RA” is used instead of a topic identifier of like “6”. Similarly, the expanded metrics have a topic separation themselves. These are expressed as sub-topics and are indicated with alpha sub-topic identifiers. In the case of the Revenue Assurance, sub-topics include DQ (Data Quality), RL (Revenue Leakage), and PE (Process Efficiency).
Finally, the individual metrics are designated by lower-case alpha characters after the sub-topic, similar to the designations in the main metrics set. Therefore, an example Revenue Assurance metric would be G-RM-RA-DQa. Since this can be cumbersome, it is permitted to call the metric simply RA-DQa, with the G-RM- implied. When using the metric outside the specific RA context, the full metric code should be used to avoid confusion.
GB935, Version 7.0 TM Forum 2013. All Rights Reserved. Page 17 of 40
BMS – Concepts & Principles
2.5. Metrics and "Meta Processes"
To enable “apples-to-apples” comparisons, several "meta-processes" have been abstracted up a layer from the Business Process Framework. By meta-process we mean a simplified sequence of stages for major end-to-end processes. Meta-processes are process overviews used to establish start and stop points for metrics in the different process foci. There is no meta-process for the “General” process focus since it applies to the entire business.
The key meta-processes and their stages are listed below (alternate names are shown in parentheses).
Fulfillmento Sellingo Order Handling (Ordering)o Service Configurationo Resource Provisioningo Service Activation (Activation)
Assuranceo Resource Data Collection & Processingo Resource Trouble Detection/Handlingo Service Problem Managemento Customer QoS/SLA Management
Billingo Initiate Billing / Collection (Bill Cycle Close)o Resource Data Collection & Processingo Service Rating & Discountingo Invoicing (Bill Dispatch)o Collection Management
Customer Management (Call Center portion of CRM)o no stages used
The following figures illustrate the sequence of the stages of the TM Forum Business Metrics meta-processes.
GB935, Version 7.0 TM Forum 2013. All Rights Reserved. Page 18 of 40
BMS – Concepts & Principles
Figure 4 - Fulfillment Meta Process
Figure 5 - Assurance Meta Process
GB935, Version 7.0 TM Forum 2013. All Rights Reserved. Page 19 of 40
BMS – Concepts & Principles
Figure 6 - Billing Meta Process
Figure 7 - Customer Management Meta Process
GB935, Version 7.0 TM Forum 2013. All Rights Reserved. Page 20 of 40
BMS – Concepts & Principles
2.6. Metric Model
Having established the basic terminology for metrics, metric categories, the metric code, and the metric name, we are now ready to look at the overall metric model, i.e. the kinds of metric attributes we would want in a metric database or inventory. Over the past 6 months, the BMS team has analyzed many different sets of metrics to come up with a set of fields that should cover most needs. Most metric definitions will not have all these fields, at least not at the beginning -- so whether the metric is mandatory is indicated in parentheses.
Identification Section
1. ID: Metric ID, assigned by team responsible for metric; UUID supersedes this when available (mandatory and unique)
2. Unused: A non-blank value indicates the metric has not been used yet, in any study; "X" indicates a metric has not been reported on, "Y" indicates a measure that is not a part of any reported-on metric, and "D" indicates the measure is deprecated. (optional)
3. Code: team-specific alphanumeric code; longer form ID, more human friendly than a number (recommended)
4. Name: actual metric name, that should be fairly descriptive of the metric without further documentation (mandatory and unique)
5. XLS Name: XLS-friendly name for use in XLS-formulas; the XLS-name must be a valid XLS named range (no dashes or spaces, but underscores and periods are ok) (mandatory and centrally managed)
6. Alternate Name: an additional/alternate non-canonical name (or nickname) for the metric, common in the industry (ex: ARPU, Profitability) (optional)
7. Category: high-level categorization within overall TMForum metric structure: Business Metric (domain-significant quantifiable), Measure (interim quantifiable), or other category (mandatory)
8. Fx Domain: one or more of the Frameworx Domains that best houses the metric: Common, Customer, Enterprise, Market_Sales, Product, Resource, Service, Supplier_Partner (ideally mandatory, but for future use)
9. Capability: what business capability is being measured, or more broadly, what business domain does the measurand belong to (ideally mandatory, but for future use)
10. Measurand: what business architecture object is being measured, ie. the measurand: process, employee, network resource, etc. (ideally mandatory, but for future use)
11. Topic: standardized topic names, across all metrics teams (to be determined) (ideally mandatory, but for future use)
12. Level: metric level hierarchy (optional)13. Parent: parent metric linkage, if this is a child metric (optional)14. Group: TMForum group/team that is responsible for the metric definition (mandatory)15. Alternate Category 1: team-specific category 1 (for BMS, this is the "BMS Domain")
(recommended)16. Alternate Category 2: team-specific category 2 (for BMS, this is the "BMS Process")
(recommended)17. Alternate Category 3: team-specific category 3 (for BMS, this is the "BMS Topic")
(recommended)18. Alternate ID: alternate/abbreviated metric ID (for BMS, this is the shorter metric ID for
the RA metrics) (optional)
GB935, Version 7.0 TM Forum 2013. All Rights Reserved. Page 21 of 40
BMS – Concepts & Principles
Definition Section
19. Metric Type: indicates whether direct, ratio, formula, etc. (mandatory)20. Prose Formula: prose expression of formula, may not be as precise as the XLS Formula
(optional)21. XLS Formula: precise XLS-compatible formula using XLS named ranges (from XLS
Name field) (mandatory)22. Prose Ratio: if Metric Type = Ratio, then this is automatically generated as Numerator
Name / Denominator Name (optional)23. XLS Ratio: if Metric Type = Ratio, then this is automatically generated as Numerator XLS
Name / Denominator XLSName (mandatory if formula with XLS formula = blank)24. Numerator Metric ID: if Metric Type = Ratio, then this should be a unique identifier
(FxMetric UUID, ID, etc.) for the record in this table that is the Numerator of the ratio (mandatory if formula with XLS formula = blank)
25. Numerator Name: if Metric Type = Ratio, then this should be the Name field associated with the Numerator ID, used to automatically generate Prose Ratio (optional and derived from Numerator FxMetric ID)
26. Numerator XLS Name: if Metric Type = Ratio, then this should be the Name field associated with the Numerator ID, used to automatically generate XLS Ratio (optional and derived from Numerator FxMetric ID)
27. Numerator Includes: items included from numerator; this is obtained from the same table (optional and derived from Numerator FxMetric ID)
28. Numerator Excludes: items excluded from numerator; this is obtained from the same table (optional and derived from Numerator FxMetric ID)
29. Numerator Units: units for numerator; this is obtained from the same table (optional and derived from Numerator FxMetric ID)
30. Denominator Metric ID: if Metric Type = Ratio, then this should be a unique identifier (FxMetric UUID, ID, etc.) for the record in this table that is the Denominator of the ratio (mandatory if formula with XLS formula = blank)
31. Denominator Name: if Metric Type = Ratio, then this should be the Name field associated with the Numerator ID, used to automatically generate Prose Ratio (optional and derived from Denominator FxMetric ID)
32. Denominator XLS Name: if Metric Type = Ratio, then this should be the Name field associated with the Numerator ID, used to automatically generate XLS Ratio (optional and derived from Denominator FxMetric ID)
33. Denominator Includes: items included from denominator; this is obtained from the same table (optional and derived from Denominator FxMetric ID)
34. Denominator Excludes: items excluded from denominator; this is obtained from the same table (optional and derived from Denominator FxMetric ID)
35. Denominator Units: units for denominator; this is obtained from the same table (optional and derived from Denominator FxMetric ID)
36. Dependent Metrics: list of metrics that use this metric in calculation (optional)
Description Section
37. Description: text description of the metric (recommended)38. Comments: general remarks about the metric, including how to measure, common
pitfalls, etc. (optional)39. Includes: business rules for what is included in metric definition (mandatory if formula
with XLS formula = blank)
GB935, Version 7.0 TM Forum 2013. All Rights Reserved. Page 22 of 40
BMS – Concepts & Principles
40. Excludes: business rules for is excluded in metric definition (mandatory if formula with XLS formula = blank)
41. Prose Dimensions: text description of key dimensions to consider (optional)42. XLS Dimensions: XLS-friendly comma-delimited list of cube dimensions (to be
determined) (optional)43. Owner Notes: editorial comments about the metric, quality of the metric definition,
warnings to user, etc. for internal management use only (optional)44. Source: provenance of the metric (who supplied it, inside or outside TMForum,
company, etc.); could be organization or person name, email address, etc. (optional)45. Reference: set of additional narrative and reference material about metric, possibly from
external standards; may also include references to non-textual material (links, images, etc.) (optional)
Measurement Section
46. Units: units of measure, like Number, Currency, Days, etc. (mandatory)47. Accuracy: number of significant figures (formerly decimal points) in results (mandatory)48. Capture Period: period over which measuring takes place (mandatory)49. Preferred: direction of preferred metric value: High, Low, or None; possibly consider
Range for future use (mandatory)50. Value Type: indicates whether scalar (single value), distribution (a set of values,
generally due to dimension embedded in metric definition) or cube of data (future use)51. Question: form of question used to elicit a measurement of this metric (future use)52. Approach: describes the measurement scheme, approach and criteria for measuring a
value, especially when not quantitative (ex: enumerated ranges) (future use)
Business Section
53. Business Value Driver: from a list of business drivers: revenue benefit, cost benefit, efficiency, customer exp, time to market, etc. (TBD) (future use)
54. Business Audience: enablers and users of this metrics (future use)55. Business Impact: what this metric impacts in the business if it lags (future use)56. Business Priority: how important this metric is to the business (future use)57. Business Response: what the business must do in response to less-than-optimal values
for metric (future use)58. Related Metrics: links to impacted or impacting metrics in this list (future use)59. Reporting Detail: set of linkages to all reports, studies, etc. that benchmarked this metric
(privileged information) (future use)60. Benchmark Detail: set of linkages to benchmarks of this metric (privileged information)
(future use)
Tracking Section
61. State: status of the metric: active (default, in current use), deprecated (should no longer be used) (mandatory)
62. Entry Date: date when metric was defined or added (mandatory)63. Last Used: indicates when metric was last used (in a report, study, etc.), ie. The most
recent benchmarking of this metric; a blank will be interpreted to mean no benchmarking thus far (privileged information) (future use)
Frameworx Section
64. SID Linkages: list of Names from SID, that are relevant in the metric definition (future use)
GB935, Version 7.0 TM Forum 2013. All Rights Reserved. Page 23 of 40

BMS – Concepts & Principles
65. eTOM Linkages: list of Names from eTOM, that are relevant in the metric definition (future use)
66. TAM Linkages: list of Names from TAM, that are relevant in the metric definition (future use)
67. Actor Linkage: list of comma-delimited Actor Names related to metric (future use)68. Other Linkages: related actors, stakeholders, capabilities, ecosystem components, etc.
(future use)69. XLS Fields: list of comma-delimited XLS fields extracted from XLS formula, if applicable
(future use)
Legacy Section
70. Legacy Name: old metric prose name, for data quality tracking (optional)71. Legacy Prose Formula: old metric prose formula, for data quality tracking (optional)72. Legacy Prose Ratio: old metric prose ratio, for data quality tracking (optional)73. Legacy Numerator FxMetric ID: old metric numerator ID, for data quality tracking
(optional)74. Legacy Numerator Name: old metric numerator name associated with ID, for data quality
tracking (optional)75. Legacy Denominator FxMetric ID: old metric denominator ID, for data quality tracking
(optional)76. Legacy Denominator Name: old metric denominator name associated with ID, for data
quality tracking (optional)77. Legacy Factor: old metric includes and excludes, if measure/factor (optional)78. Legacy Links: old metric linkages (optional)
GB935, Version 7.0 TM Forum 2013. All Rights Reserved. Page 24 of 40
BMS – Concepts & Principles
2.7. Supporting Taxonomies
As we build and expand the BMS metric model, we encounter fields/attributes that add richness to the understanding of a metric, like "Measurand", and "Business Value Driver". But to ensure that the values entered for these attributes are logical and consistent, we need to build some light, supporting taxonomies to guide their use. For example, for Business Value Driver, one can imagine all sorts of prose entered to describe what benefits the metric is related to. By using a supporting model (like the Business Value Model), we ensure that we select from a small set of consistently named metrics that do not overlap, and reduce interpretation as to meaning. Note that all these taxonomies are still evolving, and we expect further maturing in future releases of the BMS documentation.
2.7.1. Business Object Taxonomy
Many of the BMS metrics are about process, and as such, what we are measuring, the measurand, is process, or more broadly speaking, an occurrence. Some measurands are people or stakeholders (# customers, # FTE), while other are artifacts, tangible or informational (# problem reports, # data records). And of course many are financial in nature ($ cost, $ revenue). A list of business architecture domains will help standardize these measurand categories, which will give us another way to organize, navigate, and analyze metrics. Measurands are substantives, or nouns in our business architecture depictions. Some people call them business objects.
A taxonomy for measurands and other substantives will help limit and control the number of nouns (and ideally states and behaviors) that are used in the metric definitions. For this iteration, our focus has been on the substantives only. We are basing the top-level business architecture domains on the work of the OMG (Object Management Group) BASIG (Business Architecture Special Interest Group) -- who have produced a domain model. The top-level measurand domains are:
Capability Stakeholder Money Artifact (a document, information record, or other business object, like a bill, a payment,
a problem report, etc.) Occurrence (an initiative, process, behavior or event, that takes place in time) Resource (a tangible or intangible material used to deliver products/services to
customers)
The list of measurands used in this release of the BMS metrics is as follows:
Capabilityo assuranceo repair (a subset of assurance)o repair and maintenance (a subset of assurance)o billingo channel (may overlap Marketing & Sales and CRM)o collections (a subset of billing)
GB935, Version 7.0 TM Forum 2013. All Rights Reserved. Page 25 of 40
BMS – Concepts & Principles
o customer management (referred to as CRM earlier)o fulfillmento sales (a subset of the Marketing & Sales capability discussed earlier)o SLA management (a subset of assurance)
Stakeholdero customero employee (NOC FTE)o user
Valueo account receivableso asseto billing chargeo billo capexo collectable debt written offo costo operating incomeo opexo revenueo sales
Artifacto billo billing suspense fileo data recordo ordero problem reporto service problemo settlement reporto SLAo XDR
Occurrenceo activationo bill processing faulto billing erroro case of revenue recoveryo customer callo customer contacto customer incidento customer paymento customer requesto customer transactiono failureo fulfillment issueo installationo pricing changeo service outage
GB935, Version 7.0 TM Forum 2013. All Rights Reserved. Page 26 of 40
BMS – Concepts & Principles
o SLA violation Resource
o future infrastructure buildo revenue systemo customer service
Using this taxonomy, for example, the metric "Average Handle Time" has a measurand of "occurrence.customer_request", since it represents the time to handle a customer request, which is a kind of business occurrence. The list of measurands will help keep the list of nouns used in metrics to a manageable level.
2.7.2. Business Value Driver Taxonomy
A business value driver is a high-level business benefit we are trying to ultimately monitor using a metric. It is related to the business reason or imperative for wanting the metric in the first place.
Benefit Statement
A benefit statement will be written as either "increase" a value we want (like revenue), or decrease an "anti-value" (something we don't want, like cost). If a benefit statement can be written in either way, we will pick the one expressed using the most intuitive wording.
Simple Benefit Statement (Atomic & Derived)
Below are some benefit statements that are relevant to the BMS metrics:
decrease customer risk decrease excessive contacts decrease information loss decrease launch time decrease operating cost decrease problems decrease revenue loss decrease process time decrease waiting time decrease time to revenue decrease time to market increase customer satisfaction increase margin increase marketshare increase productivity increase revenue
Atomic Benefits Statements
GB935, Version 7.0 TM Forum 2013. All Rights Reserved. Page 27 of 40
BMS – Concepts & Principles
It should be apparent that these benefits are inter-related. For example, increasing productivity can in consequence lead to improved customer experience as well as reduced operating costs. Thus, we distinguish between atomic and derived benefits. Atomic benefit statements are benefit statements that represent the most elemental forms of value (or "anti-value" in the case of cost). Atomic benefits are the benefits that are necessary for a balanced view of performance. While one can try to reduce everything to money, a mature business understanding appreciates that customer and market benefits may not always be easily correlated to financial performance. Here is a running list of BMS benefit statements to date that we consider to be atomic, grouped by topic.
Revenueo increase revenueo decrease time to revenueo decrease revenue loss
Costo decrease operating costo increase margin
Customero increase customer satisfaction
Marketo decrease time to marketo increase marketshare
Value Drivers
We define a value driver as an atomic benefit statement, or a sequence of benefit statements that causally lead to an atomic benefit. A sequence of benefit statements can be chained using the "->" (leads to) symbol. Below are the benefit statements used as value drivers in the current list of BMS metrics. Only metrics with a non-blank "Preferred" value (meaning we prefer them to tend higher or lower), are canonical metrics, and as such will have an associated value driver.
Revenueo increase revenueo decrease revenue losso decrease information loss -> decrease revenue losso decrease process time -> decrease time to revenue
Costo decrease operating costo decrease excessive contacts -> decrease operating costo decrease problems -> decrease operating costo decrease process time -> decrease operating costo increase productivity -> decrease operating costo increase margin
Customero increase customer satisfactiono decrease customer risk -> increase customer satisfactiono decrease excessive contacts -> increase customer satisfactiono decrease problems -> increase customer satisfactiono decrease waiting time -> increase customer satisfaction
GB935, Version 7.0 TM Forum 2013. All Rights Reserved. Page 28 of 40
BMS – Concepts & Principles
o increase productivity -> increase customer satisfaction Market
o decrease launch time -> decrease time to marketo increase marketshare
GB935, Version 7.0 TM Forum 2013. All Rights Reserved. Page 29 of 40
BMS – Concepts & Principles
3. The Business Metrics Scorecard (BMS)
In December 2009, the TM Forum Business Benchmarking team launched the Business Metrics Framework (BMF), later renamed the Business Metrics Scorecard (BMS). The BMS is both a visual graphic of current TM Forum benchmarks as well as a framework for ongoing metrics discussions in the telecommunications industry.
3.1. The Customer Experience Life Cycle
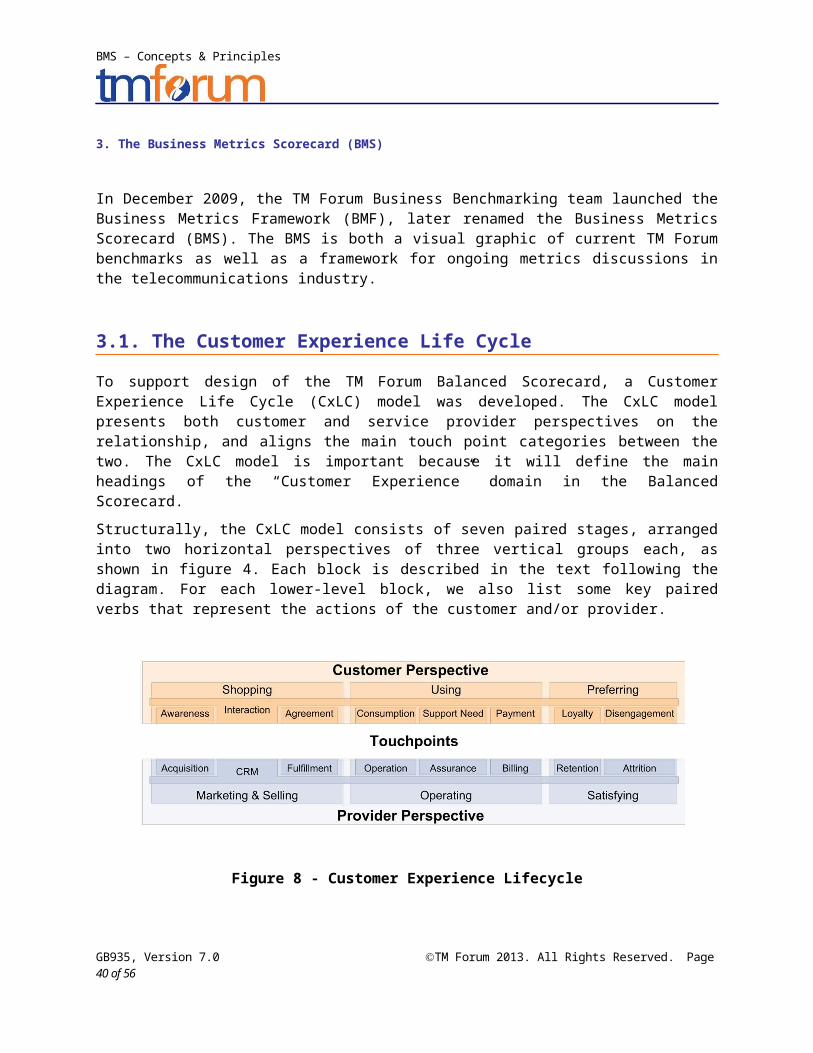
To support design of the TM Forum Balanced Scorecard, a Customer Experience Life Cycle (CxLC) model was developed. The CxLC model presents both customer and service provider perspectives on the relationship, and aligns the main touch point categories between the two. The CxLC model is important because it will define the main headings of the “Customer Experience” domain in the Balanced Scorecard.
Structurally, the CxLC model consists of seven paired stages, arranged into two horizontal perspectives of three vertical groups each, as shown in figure 4. Each block is described in the text following the diagram. For each lower-level block, we also list some key paired verbs that represent the actions of the customer and/or provider.
Figure 8 - Customer Experience Lifecycle
The first group in the CxLC model consists of three stages relating to the customer’s “Buying” experience, as tied to the service provider’s “Marketing and Selling”.
Awareness/Acquisition: This is the stage during which the service provider attempts to reach a prospective customer and/or the customer becomes aware of the service provider. The provider can position messages which the customer observes and reacts to. The customer can learn about offerings the provider informs the market about.
o Key Customer Verbs: Observe, React, Understand
o Key CSP Verbs: Position, Reach, Inform
GB935, Version 7.0 TM Forum 2013. All Rights Reserved. Page 30 of 40
BMS – Concepts & Principles
Interaction/CRM: Unlike the other stages, interaction can occur at any point in the lifecycle although it is a natural consequence of Awareness/Acquisition. The provider persuades the customer about their value proposition and engages in further dialogue with the customer. Perhaps the customer contacts the provider’s call center, visits the provider’s store or goes to the provider’s website. The provider responds to the customer’s queries about products and prices. The customer may request marketing literature or a demonstration to which the service provider responds.
o Key Customer Verbs: Engage, Contact, Request
o Key CSP Verbs: Persuade, Answer, Respond
Agreement/Fulfillment: This is the stage when the customer and provider enter into a commitment ranging from a simple one-time transaction to a complex multi-year relationship. The customer can specify their needs and the provider proposes a solution, whether consumer or enterprise. Here is where the purchase occurs and orders are placed. By the end of this phase the provider has provisioned the offering and the customer has received the product.
o Key Customer Verbs: Specify, Agree, Receive
o Key CSP Verbs: Propose, Order, Deliver
The second group consists of three stages relating to the customer “Using” the service, while the provider is “Operating” it.
Consumption/Operation: This is the stage when the customer is using the purchased product and the provider is operating the service. It also encompasses the scenario where things no longer work. This is to say the customer can no longer use the product or the provider cannot deliver the service. It also includes terminating the service.
o Key Customer Verbs: Learn, Use, Conclude
o Key CSP Verbs: Instruct, Render, Cease
Support Need/Assurance: This is the stage when there is a problem with the service and the customer reports the problem while the provider resolves it. In the extreme case the customer returns the product and the provider replaces it. This stage also covers customer training and education by the provider on how to use the products.
o Key Customer Verbs: Can’t Use, Report Problem, Return
o Key CSP Verbs: Can’t Render, Resolve Problem, Replace
Payment/Billing: This stage begins with the provider billing the customer by way of an invoice. The customer verifies the invoice and may make inquiries to which the
GB935, Version 7.0 TM Forum 2013. All Rights Reserved. Page 31 of 40
BMS – Concepts & Principles
provider gives explanations. Ultimately the customer pays the provider or the provider initiates collections procedures.
o Key Customer Verbs: Verify, Dispute, Pay
o Key CSP Verbs: Bill, Explain, Collect
The last group consists of two stages that describe what happens after the transaction is completed. Will CSP end up “Satisfying” the customer, who will hopefully end up “Advocating” the CSP or service? Does the customer continue, augment or diminish its relationship with the provider?
Loyalty/Retention: At this stage the transaction comes to a close and the customer must decide whether to renew the agreement with the provider. The provider is not only interested in retaining the customer but wants the customer to upgrade their commitment yielding greater ARPU. If the service provider succeeds in truly inspiring its customers they will advocate the provider’s services to family and friends.
o Key Customer Verbs: Renew, Enhance, Advocate
o Key CSP Verbs: Retain, Upgrade, Inspire
Disengagement/Attrition: This stage represents the negative version of Loyalty/Retention. Here the service provider has disappointed or the customer has complained. The customer may downgrade their agreement. In the worst case the customer leaves the relationship.
o Key Customer Verbs: Complain, Diminish, Leave
o Key CSP Verbs: Disappoint, Downgrade, Lose
GB935, Version 7.0 TM Forum 2013. All Rights Reserved. Page 32 of 40

BMS – Concepts & Principles
3.2. Structure of the Business Metrics Scorecard
The metrics are held in the Business Metric Scaffold as shown below. As you can see, the structure of the scaffold reflects the structure of the balanced scorecard shown in Figure 1. The scorecard is further refined by process foci, and topic as described earlier.
Individual metrics appear in the scaffold cells based on a combination of their domain, focus and topic. Metric naming codes are used to uniquely identify a metric and are used to quickly determine where a metric sits within the scaffold based on this combination as well as reference the detailed metric descriptions in the Business Performance Measurement System (BPMS). For better viewing the Metric Scaffold can be downloaded from the TM Forum website at www.tmforum.org .
Figure 9 - Business Metrics Scorecard
GB935, Version 7.0 TM Forum 2013. All Rights Reserved. Page 33 of 40
BMS – Concepts & Principles
In order to provide a holistic business-oriented benchmarking and metrics framework, the BMF has been structured to look like the scorecard first introduced in “Basic Structure of the Business Metrics”. Referring to figure 5, the three largest areas of the BMF model correspond to the three main domains:
Revenue and Margin (in burgundy, running along the top of model)
Customer Experience (in orange, at the bottom left of model)
Operational Efficiency (in blue, at the bottom right of model)
In the Revenue and Margin domain, the BMF parses out rows based on key groupings of metrics: Revenue, Profitability (including Margin and Revenue Assurance), Cost (including OpEx and CapEx), and Churn.
Both the Customer Experience and Operational Efficiency domains consist of columns that reference the topics described in “Basic Structure of the Business Metrics”. Due to the number of topics, they are grouped in the BMF as “consolidated topics” for simplicity.
Thus in the Customer Experience domain, the consolidated topics (columns) are Access, Time and Quality. (The Quality grouping consolidates the topics of Usability, Accuracy and Availability.) Note that the row names are extracted from the Customer Experience Lifecycle.
In the Operational Efficiency domain, the consolidated topics (columns) are Cost, Time, Quality and Effectiveness. (The Quality grouping consolidates the topics of Defects and Simplicity, while the Effectiveness grouping consolidates the topics of Process Flexibility & Automation, and Utilization.) Most of the row names are extracted from eTOM.
Thus the BMF leverages several important model components to build a holistic view of business benchmarking:
The overall scorecard structure of the TM Forum Benchmarking metrics and domains, factoring in process, as well as customer experience, and revenue and margin
The topics used to group metrics in the TM Forum Benchmarking domains, supporting views by cost, time, quality, etc.
Process categories from eTOM, to ensure we are using standard process naming conventions
Customer experience categories from the CxLC, to leverage a rich view of the customer experience.
GB935, Version 7.0 TM Forum 2013. All Rights Reserved. Page 34 of 40
BMS – Concepts & Principles
3.3. Navigating the Business Metrics Scorecard
Using the earlier example, we can see in the figure below where metric F-CE-2a appears on the scaffold.
Figure 10 - F-CE-2a
Using similar logic, the Mean Duration from Service Activation to Bill Dispatch and the Mean Duration from Bill Dispatch to Cash Received, are both part of the Billing process (Process Focus = B), they are both part of the service provider’s internal operational domain (Domain = OE), and as with the Fulfillment measure both are time related (Topic = 2), The resulting measure names are B-OE-2c, and B-OE-2d respectively. The last letter is different to indicate a unique measure in the same Process-Domain-Topic tuple.
GB935, Version 7.0 TM Forum 2013. All Rights Reserved. Page 35 of 40
BMS – Concepts & Principles
Figure 11 - B-OE-2c and B-OE-2d
These metrics have been developed and honed over the past 6+ years, and have been used in studies in support of Business Performance around multiple services offerings as well as Revenue Management studies such as Billing Performance. In a very dynamic telecommunications environment, the base metrics have proven to be resilient. When changes are required, the scaffold provides a structure, and this document outlines a process, that when followed ensures that metrics are
1. Required – the metric goal is not satisfied by existing metrics2. Consistent - the metric can be calculated and fits into the scaffold, using existing
terminology and methodology3. Benchmark-able – the metric has been normalized to accommodate global
benchmarking.4. Standardized – the metric is reviewed for relevance and measurability by service
providers and adopted into the BPMS and the Business Metrics Scaffold, becoming a part of the standardized TM Forum Business Metrics.
GB935, Version 7.0 TM Forum 2013. All Rights Reserved. Page 36 of 40
BMS – Concepts & Principles
Appendix A: Terms and Abbreviations Used within this Document
Term Definition Possible Options
1 Access Media The interface mechanism between the service provider and the end-customer
Direct (store front, acct mgr.) reseller/distributor phone web mail
2 Channel The channel to market for the service. Direct (store front, acct mgr.) reseller/distributor call center web
3 Customer Confirmed Date
The date that the service provider confirmed delivery of the service.
4 Customer Density Differentiates between services that are delivered in a high populous area with high degree of infrastructure (Urban/Suburban), versus outlying areas with highly distributed customer and low degree of infrastructure
Urban/Suburban Rural
5 Customer Request Interaction between a service provider and an end-customer.
Possible types are shown.
Complaint Inquiry Change
6 Customer Required Date
The date that the customer requested the service to be activated by
7 Defect Type Technology refers to a network or service problem. Workforce refers either the SP or 3rd party employed workforce. A System cause refers to a problem in the OSS/BSS infrastructure.
customer caused technology caused workforce caused system caused (data
mismatch problems) other
8 End-Customer Segment
Indicator of end-customer segment. Small and medium business is considered to be the same segment as consumer
Consumer, Small/Medium Business
Large Enterprise, Government
9 Maintenance Type Unplanned maintenance references exception based intervention or maintenance
Planned vs. Unplanned
GB935, Version 7.0 TM Forum 2013. All Rights Reserved. Page 37 of 40
BMS – Concepts & Principles
Term Definition Possible Options
10 Market Position An indication whether the Service provider is operating as the incumbent or outside the 'geography' where they are incumbent. (This metric is valuable to a wireline operator that was once the monopoly carrier. It is best applied to measures that are applicable to wireline vs. wireless carriers)
Incumbent Competitor
11 Payment Timing when the customer is scheduled to pay for services
Prepaid, Postpaid
12 Request Category Process that the contact is referencing. See Customer Request
Fulfillment Assurance Billing General
13 Service Component Differentiates the Bearer from the Application. The bearer provides connectivity only.
Bearer, Data, Content, Retail
GB935, Version 7.0 TM Forum 2013. All Rights Reserved. Page 38 of 40
BMS – Concepts & Principles
Appendix B: Administrative Information
This appendix provides additional background material about the TM Forum and this document.
B.1. Version History
This section records the changes between this and the previous document version as it is edited by the team concerned. Note: this is an incremental number which does not have to match the release number.
Version Number Date Modified Modified by: Description of changes
1.1.0 15 June 2005 Mike Kelly First issue of Release 1.0 document
2.1.0 12 June 2006 Alpna Doshi
Paul Winder
First Issue of Release 2
New name of the document – Business Metrics Scaffold
3.0.0 5 May 2008 Rudi Jetzelsperger First Issue of Release 3
updated metrics and added Revenue Assurance Metrics
3.0.1 6 June 2009 Robert Bratulic Made minor corrections
5.0.0 18 April 2010 Robert Bratulic New major release, aligned with BMF 5.0
6.0.0 8 August 2010 Beryl Graham New major release, aligned with BMS 6.0 / Metrics Inventory 6.0.0
6.1.0 31 August 2010 Alicja Kawecki Updated Notice, minor cosmetic corrections for web posting and ME
6.2.0 19 January 2011 Alicja Kawecki Updated to reflect TM Forum Approved status
7.0 31 March 2013 Robert Bratulic Document has been significantly restructured based on GB935, BM1000, and BM1001 – now all combined into one GB935 document family of 3 documents. Concepts & Principles is the main document, with 2 addenda – one for metric specifications, the other for metric development.
GB935, Version 7.0 TM Forum 2013. All Rights Reserved. Page 39 of 40
BMS – Concepts & Principles
B.2. Release History
This section records the changes between this and the previous official document release.
Release Number Date Modified Modified by: Description of changes
1.0 15 June 2005 Mike Kelly First release of document
2.0 12 June 2006 Alpna Doshi Second Release of document
3.0 14 April 2008 Rudi Jetzelsperger Third Release of document
4.0 16 June 2009 Robert Bratulic Fourth Release of document
5.0 18 April 2010 Robert Bratulic Fifth Release of document, including first references to BMF model
6.0 01 August 2010 Beryl Graham Sixth Release of document aligned with BMS 6.0 / Metrics Inventory 6.0.0
7.0 31 March 2013 Robert Bratulic Document has been significantly restructured based on GB935, BM1000, and BM1001 – now all combined into one GB935 document family of 3 documents. Concepts & Principles is the main document, with 2 addenda – one for metric specifications, the other for metric development.
B.3. Document Family and Related Documents
Document Name Revision / Date
TM Forum GB935: Concepts & Principles V7.0 / Apr 2013
TM Forum GB935-A: Addendum A: Business Metric Specifications V7.0 / Apr 2013
TM Forum GB935-B: Addendum B: Business Metric Development Guide V7.0 / Apr 2013
TM Forum Business Metrics Poster V7.0 / Apr 2013
GB935, Version 7.0 TM Forum 2013. All Rights Reserved. Page 40 of 40