gasification: an alternative process for energy … municipal solid waste gasification will be...
TRANSCRIPT
Gasification: An Alternative Process
for Energy Recovery and Disposal of Municipal Solid Wastes
by Alexander Klein
Advisor: Professor Nickolas Themelis
Submitted in partial fulfillment of the requirements for the degree of
M.S. in Earth Resources Engineering
Department of Earth and Environmental Engineering Fu Foundation School of Engineering and Applied Science
Columbia University May 2002
Research project sponsored by the Earth Engineering Center
www.columbia.edu/cu/earth
1
Gasification: An Alternative Process for Energy Recovery and Disposal of Municipal Solid Wastes
Alexander Klein
Executive Summary
Many cities are confronted with the problem of how to dispose of large quantities of
municipal solid waste (MSW). Currently, landfills are the primary destination of waste receiving
about 60 percent. However, with landfill tipping fees rising and their proven negative
environmental impacts, cleaner and less costly alternatives for municipal waste disposal should
be identified and implemented. High temperature energy recovery from MSW, known as waste-
to-energy (WTE), is one such alternative. Waste-to-energy reduces the amount of materials sent
to landfills, prevents air/water contamination, improves recycling rates and lessens the
dependence on fossil fuels for power generation. The two most commercially viable forms of
large scale WTE are combustion and gasification. Combustion of wastes is a well-established
practice, while gasification is still in its early stages as a large-scale commercial industry. The
purpose of this study was to assess MSW gasification technology as an alternative to combustion
and also to examine its potential role in a zero-emission waste-to-energy (ZEWTE) process.
Currently, 33 million tons of MSW are combusted annually in the US, accounting for the
energy equivalent of 1.6 billion gallons of fuel oil. During combustion, dioxins/furans
(PCDD/PCDFs) form in the flue gases as they leave the combustion chamber and cool to 650-
300°C. These dioxin/furan emissions are the primary catalyst for political and environmental
opposition to the expansion of the WTE industry. Over the past decade, progress has been made
in reducing dioxin/furan release from U.S. WTE plants lowering them from 4000 g/year in 1990
to 400 g/year in 1999. The most effective capturing techniques have been adsorption on activated
carbon and the use of baghouse filters instead of electrostatic precipitators.
Gasification is a process that devolatilizes solid or liquid hydrocarbons, and converts
them into a low or medium BTU gas. There are more than 100 waste gasification facilities
operating or under construction around the world. Some plants have been operating
commercially for more than five years. Gasification has several advantages over traditional
combustion of MSW. It takes place in a low oxygen environment that limits the formation of
2
dioxins and of large quantities of SOx and NOx. Furthermore, it requires just a fraction of the
stoichiometric amount of oxygen necessary for combustion. As a result, the volume of process
gas is low, requiring smaller and less expensive gas cleaning equipment. The lower gas volume
also means a higher partial pressure of contaminants in the off-gas, which favors more complete
adsorption and particulate capture according to chemical thermodynamics: ∆G= -RTln(P1/P0).
Finally, gasification generates a fuel gas that can be integrated with combined cycle turbines,
reciprocating engines and, potentially, with fuel cells that convert fuel energy to electricity more
than twice as efficiently as conventional steam boilers.
During gasification, tars, heavy metals, halogens and alkaline compounds are released
within the product gas and can cause environmental and operational problems. Tars are high
molecular weight organic gases that ruin reforming catalysts, sulfur removal systems, ceramic
filters and increase the occurrence of slagging in boilers and on other metal and refractory
surfaces. Alkalis can increase agglomeration in fluidized beds that are used in some gasification
systems and also can ruin gas turbines during combustion. Heavy metals are toxic and
bioaccumulate if released into the environment. Halogens are corrosive and are a cause of acid
rain if emitted to the environment. The key to achieving cost efficient, clean energy recovery
from municipal solid waste gasification will be overcoming problems associated with the release
and formation of these contaminants.
The two gasification plants compared in this study utilize unique gas cleaning and
gasification technologies to produce a synthesis gas suitable as fuel in a combined cycle turbine.
The first plant assessed was designed by TPS Termiska. This process uses partial combustion
with air at atmospheric pressure in a bubbling fluidized bed, followed by a circulating fluidized
bed vessel containing dolomite that catalytically “cracks” the tars. The TPS system has been
operating using 200 tonnes of “refuse-derived fuel” per day (RDF) since 1993 in Italy, sending
its product gas to a closely coupled boiler. Battelle-Columbus Laboratories designed the second
plant examined in this study. This system is an indirectly heated atmospheric pressure gasifier
that avoids nitrogen in the fuel stream and produces a medium BTU gas. The Battelle plant has
been licensed by the Future Energy Resources Company and is near the commercial stage for
biomass gasification with a capacity of 200 tons/day.
Finally, this paper speculates on the viability of two processes in which gasification takes
place in a hydrogen rich environment, known as hydrogasification. The first process generates a
3
methane rich gas that can be transported to a utility and combusted in a gas turbine. The second
process reforms the synthesis gas on-site into a relatively pure hydrogen stream that is then fed to
a fuel cell stack. This system utilizes the formation of calcium carbonate to provide heat for
reforming while capturing carbon dioxide emissions. Both of these processes result in zero
emissions to the atmosphere at the plant site.
This thesis concludes that waste gasification is a viable and cost competitive alternative
to the combustion of RDF. However, the dearth of commercial gasification plants, and the
operational difficulties experienced at several pilot and large scale demonstration plants, indicate
that improvements in operating conditions and in gas cleaning technologies are necessary before
gasification can be considered a reliable, off-the-shelf solution to the waste disposal problems of
large municipalities.
4
Acknowledgements
The author gratefully acknowledges the financial support of Columbia University’s Department of Earth and Environmental Engineering (Harry Krumb’s School of Mines), and the Energy Answers Corporation. Special thanks are due to my advisor, Professor Nickolas Themelis. Professor Themelis’s support, advice and extensive technical knowledge were invaluable in the creation of this document. Also, the inputs of Professor Klaus Lackner, Dr. Hanwei Zhang, Joe Didio, Ko Matsunaga, Claire Todd and Shefali Verma are greatly appreciated.
Alexander E Klein
New York City, May 2002
5
Table of Contents Section Page 1. Introduction . . . . . . . . . . . . . . . . . . . . . . . . . . . . . . . . . . . . . . . . . . . . . . . . . . . . . . . . . . . . 6
1.1 Gasification Process . . . . . . . . . . . . . . . . . . . . . . . . . . . . . . . . . . . . . . . . . . . . . . . 6 2. Gasifier Designs . . . . . . . . . . . . . . . . . . . . . . . . . . . . . . . . . . . . . . . . . . . . . . . . . . . . . . . . . 7
2.1 Fixed Beds. . . . . . . . . . . . . . . . . . . . . . . . . . . . . . . . . . . . . . . . . . . . . . . . . . . . . . . 7 2.1.1 Downdraft . . . . . . . . . . . . . . . . . . . . . . . . . . . . . . . . . . . . . . . . . . . . . . . 7 2.1.2 Updraft . . . . . . . . . . . . . . . . . . . . . . . . . . . . . . . . . . . . . . . . . . . . . . . . .. 8 2.1.3 Slagging Fixed Beds . . . . . . . . . . . . . . . . . . . . . . . . . . . . . . . . . . . . . . . 9
2.2 Fluidized Beds . . . . . . . . . . . . . . . . . . . . . . . . . . . . . . . . . . . . . . . . . . . . . . . . . . . 10 2.2.1 Bubbling Fluidized Beds. . . . . . . . . . . . . . . . . . . . . . . . . . . . . . . . . . . . 11 2.2.2 Circulating Fluidized Beds . . . . . . . . . . . . . . . . . . . . . . . . . . . . . . . . . . 12
3. MSW as an Energy Feedstock . . . . . . . . . . . . . . . . . . . . . . . . . . . . . . . . . . . . . . . . . . . . . . 13 4. Product Gas. . . . . . . . . . . . . . . . . . . . . . . . . . . . . . . . . . . . . . . . . . . . . . . . . . . . . . . . . . . . . 16
4.1 Tars . . . . . . . . . . . . . . . . . . . . . . . . . . . . . . . . . . . . . . . . . . . . . . . . . . . . . . . . . . . 16 4.2 Halogens/Acid Gases . . . . . . . . . . . . . . . . . . . . . . . . . . . . . . . . . . . . . . . . . . . . . . 19 4.3 Heavy Metals . . . . . . . . . . . . . . . . . . . . . . . . . . . . . . . . . . . . . . . . . . . . . . . . . . . . 20 4.4 Alkalis. . . . . . . . . . . . . . . . . . . . . . . . . . . . . . . . . . . . . . . . . . . . . . . . . . . . . . . . . . 21
5. Power Generation. . . . . . . . . . . . . . . . . . . . . . . . . . . . . . . . . . . . . . . . . . . . . . . . . . . . . . . . 22 5.1 Integrated Gasification Combined Cycle (IGCC) . . . . . . . . . . . . . . . . . . . . . . . . 23 5.2 Fuel Cells. . . . . . . . . . . . . . . . . . . . . . . . . . . . . . . . . . . . . . . . . . . . . . . . . . . . . . . 23
6. Description of Commercial Technologies Considered . . . . . . . . . . . . . . . . . . . . . . . . . . . 25 6.1 TPS Termiska Processer – AB. . . . . . . . . . . . . . . . . . . . . . . . . . . . . . . . . . . . . . . 26 6.2 Battelle Columbus Laboratories. . . . . . . . . . . . . . . . . . . . . . . . . . . . . . . . . . . . . . 27 6.3 Essex County, NJ. . . . . . . . . . . . . . . . . . . . . . . . . . . . . . . . . . . . . . . . . . . . . . . . . 29 6.4 SEMASS, Massachusetts. . . . . . . . . . . . . . . . . . . . . . . . . . . . . . . . . . . . . . . . . . . 30
7. Technoeconomic Comparison . . . . . . . . . . . . . . . . . . . . . . . . . . . . . . . . . . . . . . . . . . . . . . 30 7.1 Energy Comparison . . . . . . . . . . . . . . . . . . . . . . . . . . . . . . . . . . . . . . . . . . . . . . . 31
7.2 Capital Costs . . . . . . . . . . . . . . . . . . . . . . . . . . . . . . . . . . . . . . . . . . . . . . . . . . . . 33 7.3 Operating Costs. . . . . . . . . . . . . . . . . . . . . . . . . . . . . . . . . . . . . . . . . . . . . . . . . . 34
8. Gasification Technologies for the Future. . . . . . . . . . . . . . . . . . . . . . . . . . . . . . . . . . . . . . 36 8.1 Hydrogasification of Waste with Methane Export. . . . . . . . . . . . . . . . . . . . . . . . 37 8.2 Zero Emission Waste-To-Energy. . . . . . . . . . . . . . . . . . . . . . . . . . . . . . . . . . . . . 38
Conclusions . . . . . . . . . . . . . . . . . . . . . . . . . . . . . . . . . . . . . . . . . . . . . . . . . . . . . . . . . . . . . . 44 References . . . . . . . . . . . . . . . . . . . . . . . . . . . . . . . . . . . . . . . . . . . . . . . . . . . . . . . . . . . . . . . 47
1. Introduction
Many cities are confronted with the problem of how to discard large quantities of
municipal solid waste (MSW). Currently, landfills are the primary means of MSW disposal
taking in approximately 60% of the residential garbage generated in the US (SCS Engineers,
1992). However, rising landfill tipping fees and their proven negative environmental impacts
(Denison, 1996; Miranda and Hale 1999), have led to the search for cleaner and less costly
alternatives for municipal waste disposal. High temperature energy recovery from MSW, known
as waste-to-energy (WTE), is one such alternative. Waste-to-Energy reduces the amount of
materials sent to landfills, can prevent air/water contamination, improves recycling rates and
lessens the dependence on fossil fuels for power generation. The two most commercially viable
forms of large scale WTE are combustion and gasification. Combustion is a well-established
practice, while gasification is still in its early stages as a large-scale commercial industry. The
purpose of this study was to assess MSW gasification technology as an alternative to combustion
and also to examine its potential role in a zero-emission waste-to-energy (ZEWTE) process.
1.1. Gasification Process
Gasification is a thermochemical process that generates a gaseous, fuel rich product.
Regardless of how the gasifier is designed, two processes must take place in order to produce a
useable fuel gas. In the first stage, pyrolysis releases the volatile components of the fuel at
temperatures below 600°C (1112°F). The by-product of pyrolysis that is not vaporized is called
char and consists mainly of fixed carbon and ash. In the second gasification stage, the carbon
remaining after pyrolysis is either reacted with steam or hydrogen or combusted with air or pure
oxygen. Gasification with air results in a nitrogen-rich, low BTU fuel gas. Gasification with
pure oxygen results in a higher quality mixture of carbon monoxide and hydrogen and virtually
no nitrogen. Gasification with steam is more commonly called “reforming” and results in a
hydrogen and carbon dioxide rich “synthetic” gas (syngas). Typically, the exothermic reaction
between carbon and oxygen provides the heat energy required to drive the pyrolysis and char
gasification reactions. (EREN, 2002)
The basic gasification reactions that must be considered are:
1) C + O2 CO2 -393 kJ/mol (exothermic)
7
2) C + H2O CO + H2 +131 kJ /mol (endothermic)
3) C + CO2 2CO +172 kJ/mol (endothermic)
4) C + 2H2 CH4 -74 kJ/mol (exothermic)
5) CO + H20 CO2 + H2 -41 kJ/mol (exothermic)
6) CO + 3H2 CH4 + H20 -205 kJ/mol (exothermic)
(Krigmont, 1999)
All of these reactions are reversible and their rates depend on the temperature, pressure and
concentration of oxygen in the reactor.
2. Gasifier Designs
The reactors used for the gasification process are very similar to those used in
combustion processes. The main reactor types are fixed beds and fluidized beds.
2.1 Fixed Beds
Fixed bed gasifiers typically have a grate to support the feed material and maintain a
stationary reaction zone. They are relatively easy to design and operate, and are therefore useful
for small and medium scale power and thermal energy uses. It is difficult, however, to maintain
uniform operating temperatures and ensure adequate gas mixing in the reaction zone. As a
result, gas yields can be unpredictable and are not optimal for large-scale power purposes (i.e.
over 1 MW). The two primary types of fixed bed gasifiers are updraft and downdraft.
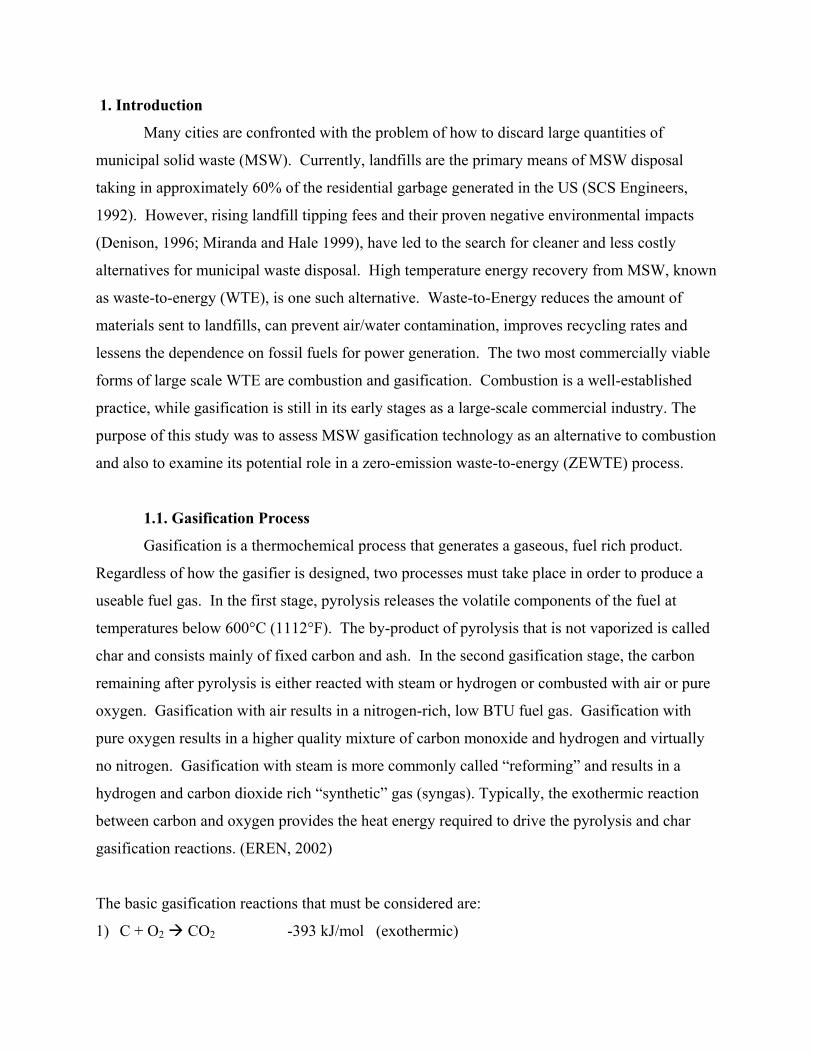
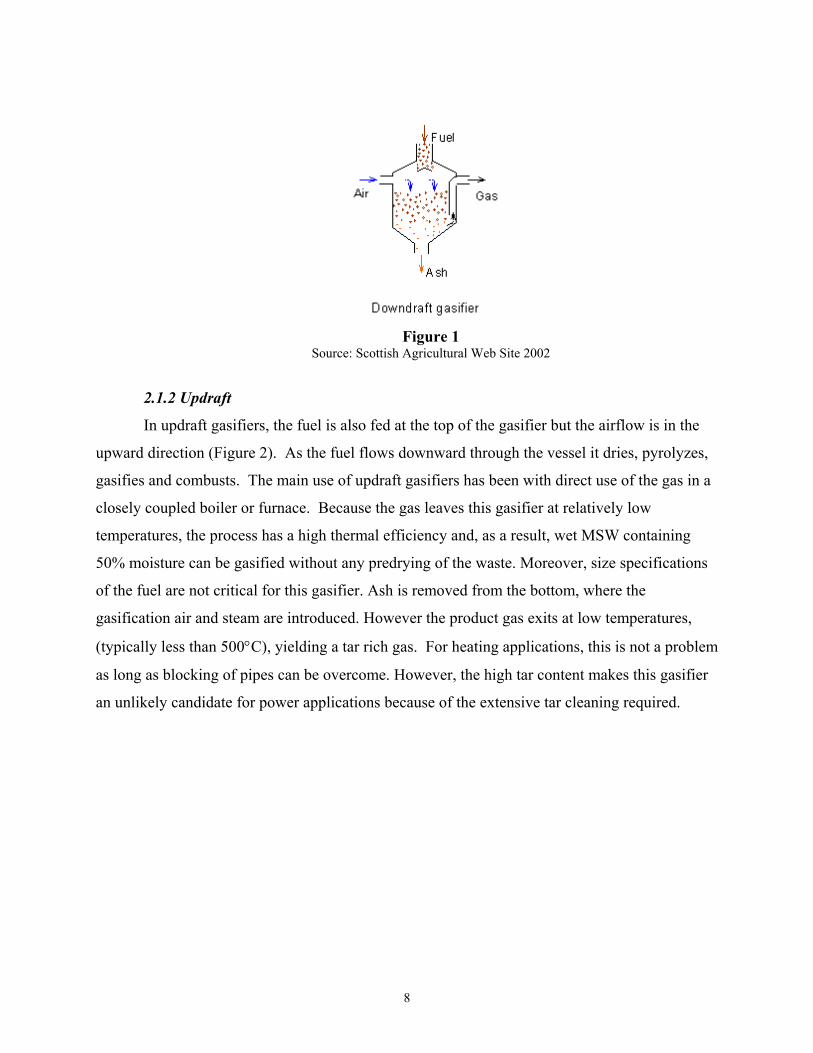
2.1.1 Downdraft
Downdraft gasifiers (Figure 1) have a long history of use in cars and buses to produce a
wood-derived gas for internal combustion engines. In a downdraft gasifier, air is introduced into
a downward flowing packed bed or solid fuel stream and gas is drawn off at the bottom. The
air/oxygen and fuel enter the reaction zone from above decomposing the combustion gases and
burning most of the tars. As a result, a simple cooling and filtration process is all that is
necessary to produce a gas suitable for an internal combustion engine. Downdraft gasifiers are
not ideal for waste treatment because they typically require a low ash fuel such as wood, to avoid
clogging. In addition, downdrafts have been difficult to scale up beyond 1MW because of the
geometry of their throat section.
8
Figure 1
Source: Scottish Agricultural Web Site 2002
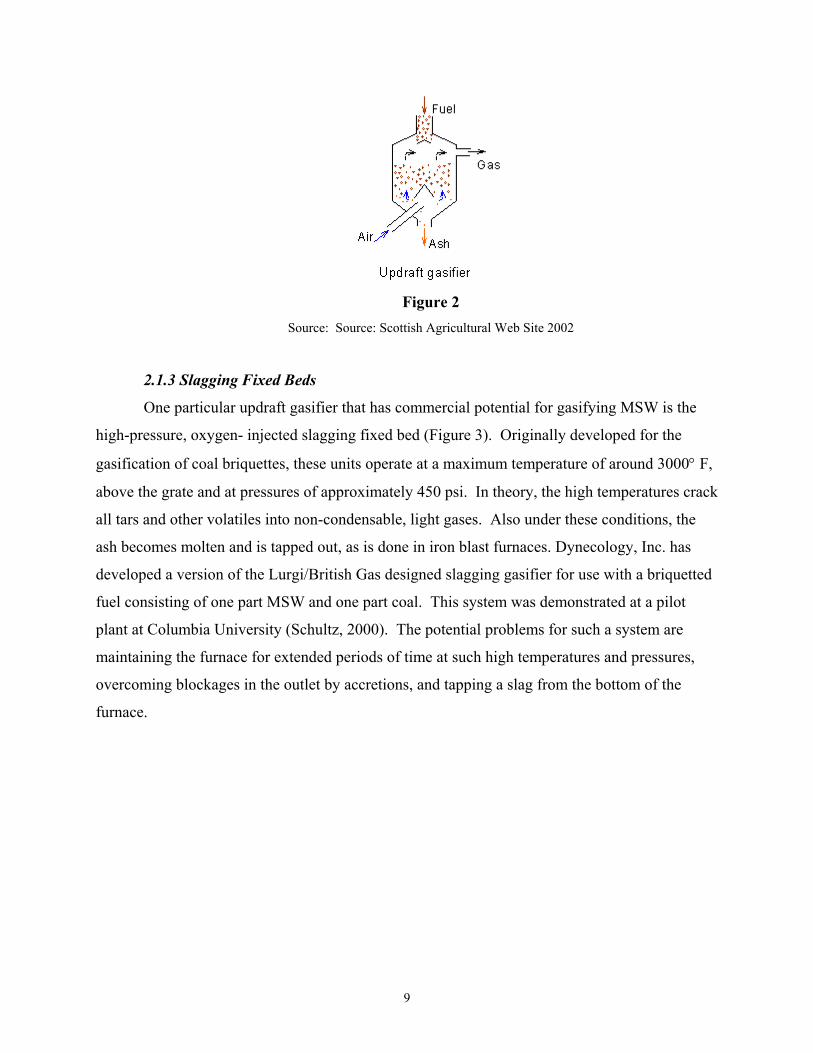
2.1.2 Updraft
In updraft gasifiers, the fuel is also fed at the top of the gasifier but the airflow is in the
upward direction (Figure 2). As the fuel flows downward through the vessel it dries, pyrolyzes,
gasifies and combusts. The main use of updraft gasifiers has been with direct use of the gas in a
closely coupled boiler or furnace. Because the gas leaves this gasifier at relatively low
temperatures, the process has a high thermal efficiency and, as a result, wet MSW containing
50% moisture can be gasified without any predrying of the waste. Moreover, size specifications
of the fuel are not critical for this gasifier. Ash is removed from the bottom, where the
gasification air and steam are introduced. However the product gas exits at low temperatures,
(typically less than 500°C), yielding a tar rich gas. For heating applications, this is not a problem
as long as blocking of pipes can be overcome. However, the high tar content makes this gasifier
an unlikely candidate for power applications because of the extensive tar cleaning required.
9
Figure 2
Source: Source: Scottish Agricultural Web Site 2002
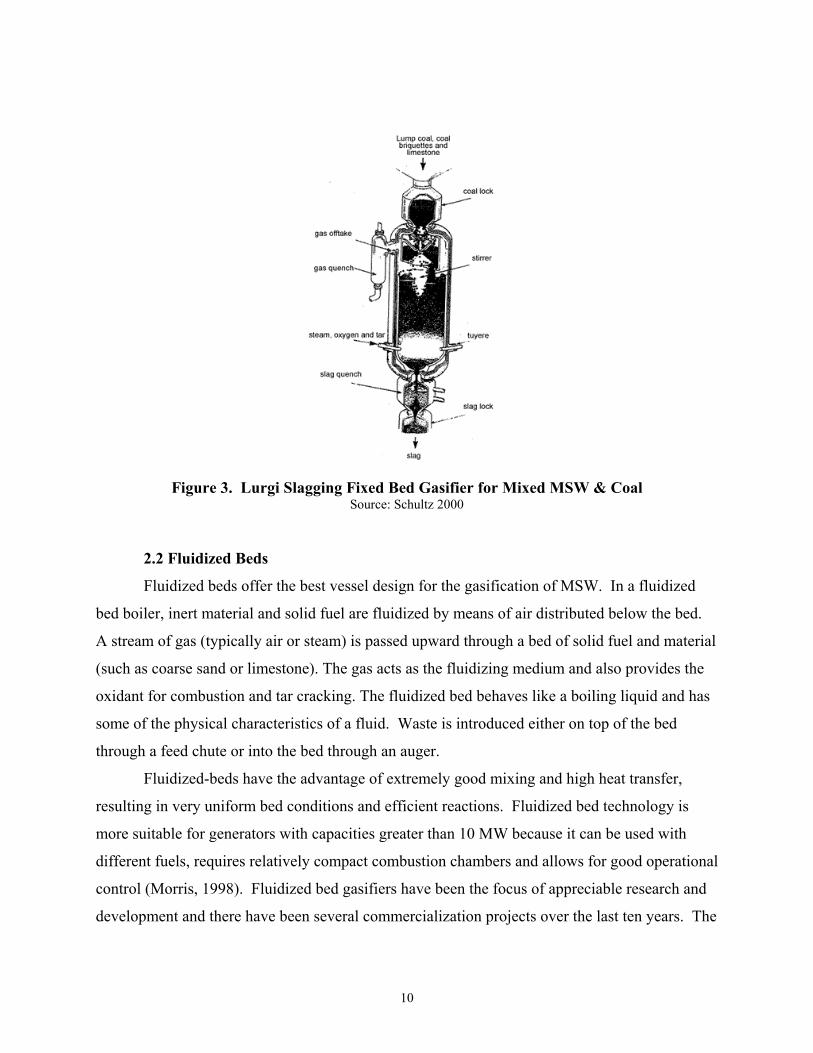
2.1.3 Slagging Fixed Beds
One particular updraft gasifier that has commercial potential for gasifying MSW is the
high-pressure, oxygen- injected slagging fixed bed (Figure 3). Originally developed for the
gasification of coal briquettes, these units operate at a maximum temperature of around 3000° F,
above the grate and at pressures of approximately 450 psi. In theory, the high temperatures crack
all tars and other volatiles into non-condensable, light gases. Also under these conditions, the
ash becomes molten and is tapped out, as is done in iron blast furnaces. Dynecology, Inc. has
developed a version of the Lurgi/British Gas designed slagging gasifier for use with a briquetted
fuel consisting of one part MSW and one part coal. This system was demonstrated at a pilot
plant at Columbia University (Schultz, 2000). The potential problems for such a system are
maintaining the furnace for extended periods of time at such high temperatures and pressures,
overcoming blockages in the outlet by accretions, and tapping a slag from the bottom of the
furnace.
10
Figure 3. Lurgi Slagging Fixed Bed Gasifier for Mixed MSW & CoalSource: Schultz 2000
2.2 Fluidized Beds
Fluidized beds offer the best vessel design for the gasification of MSW. In a fluidized
bed boiler, inert material and solid fuel are fluidized by means of air distributed below the bed.
A stream of gas (typically air or steam) is passed upward through a bed of solid fuel and material
(such as coarse sand or limestone). The gas acts as the fluidizing medium and also provides the
oxidant for combustion and tar cracking. The fluidized bed behaves like a boiling liquid and has
some of the physical characteristics of a fluid. Waste is introduced either on top of the bed
through a feed chute or into the bed through an auger.
Fluidized-beds have the advantage of extremely good mixing and high heat transfer,
resulting in very uniform bed conditions and efficient reactions. Fluidized bed technology is
more suitable for generators with capacities greater than 10 MW because it can be used with
different fuels, requires relatively compact combustion chambers and allows for good operational
control (Morris, 1998). Fluidized bed gasifiers have been the focus of appreciable research and
development and there have been several commercialization projects over the last ten years. The
11
two main types of fluidized beds for power generation are bubbling and circulating fluidized
beds.
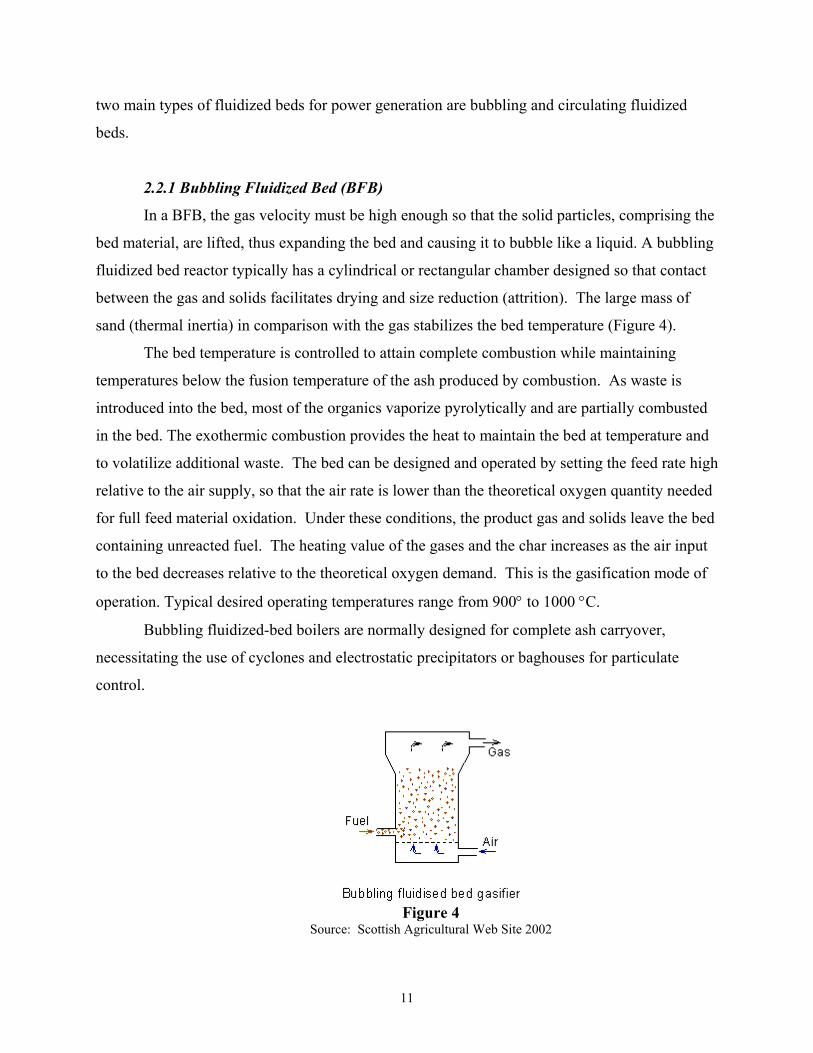
2.2.1 Bubbling Fluidized Bed (BFB)
In a BFB, the gas velocity must be high enough so that the solid particles, comprising the
bed material, are lifted, thus expanding the bed and causing it to bubble like a liquid. A bubbling
fluidized bed reactor typically has a cylindrical or rectangular chamber designed so that contact
between the gas and solids facilitates drying and size reduction (attrition). The large mass of
sand (thermal inertia) in comparison with the gas stabilizes the bed temperature (Figure 4).
The bed temperature is controlled to attain complete combustion while maintaining
temperatures below the fusion temperature of the ash produced by combustion. As waste is
introduced into the bed, most of the organics vaporize pyrolytically and are partially combusted
in the bed. The exothermic combustion provides the heat to maintain the bed at temperature and
to volatilize additional waste. The bed can be designed and operated by setting the feed rate high
relative to the air supply, so that the air rate is lower than the theoretical oxygen quantity needed
for full feed material oxidation. Under these conditions, the product gas and solids leave the bed
containing unreacted fuel. The heating value of the gases and the char increases as the air input
to the bed decreases relative to the theoretical oxygen demand. This is the gasification mode of
operation. Typical desired operating temperatures range from 900° to 1000 °C.
Bubbling fluidized-bed boilers are normally designed for complete ash carryover,
necessitating the use of cyclones and electrostatic precipitators or baghouses for particulate
control.
Figure 4
Source: Scottish Agricultural Web Site 2002
12
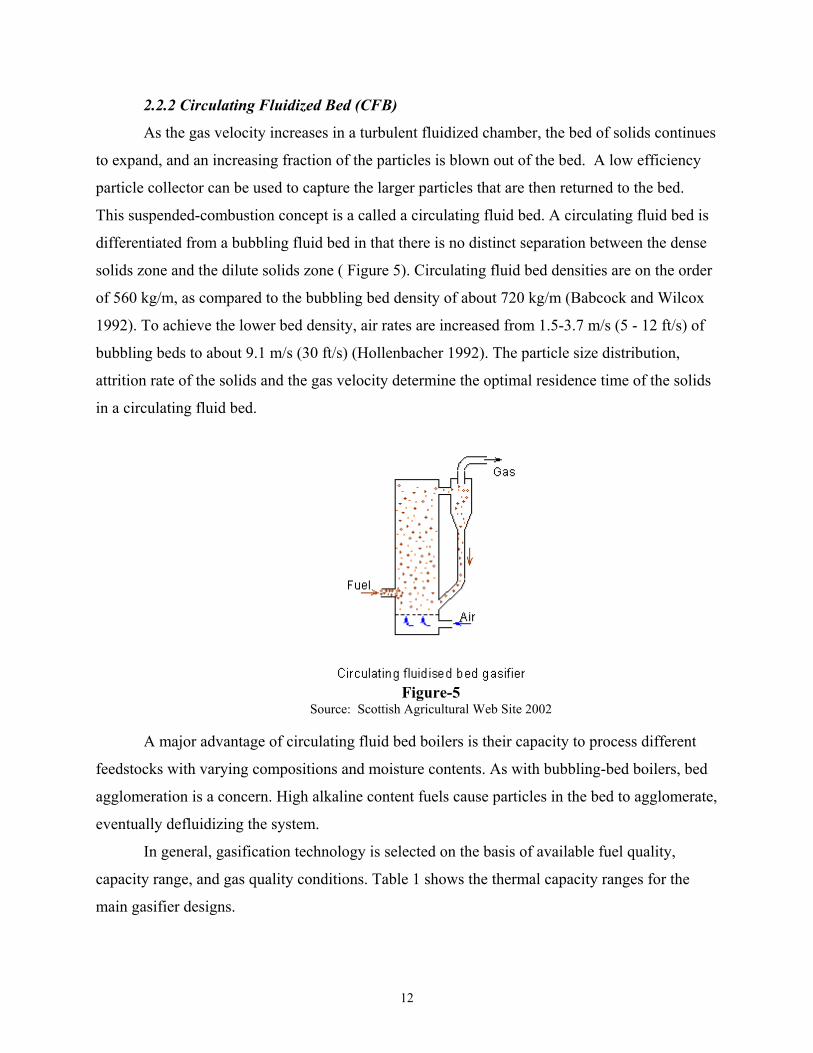
2.2.2 Circulating Fluidized Bed (CFB)
As the gas velocity increases in a turbulent fluidized chamber, the bed of solids continues
to expand, and an increasing fraction of the particles is blown out of the bed. A low efficiency
particle collector can be used to capture the larger particles that are then returned to the bed.
This suspended-combustion concept is a called a circulating fluid bed. A circulating fluid bed is
differentiated from a bubbling fluid bed in that there is no distinct separation between the dense
solids zone and the dilute solids zone ( Figure 5). Circulating fluid bed densities are on the order
of 560 kg/m, as compared to the bubbling bed density of about 720 kg/m (Babcock and Wilcox
1992). To achieve the lower bed density, air rates are increased from 1.5-3.7 m/s (5 - 12 ft/s) of
bubbling beds to about 9.1 m/s (30 ft/s) (Hollenbacher 1992). The particle size distribution,
attrition rate of the solids and the gas velocity determine the optimal residence time of the solids
in a circulating fluid bed.
Figure-5
Source: Scottish Agricultural Web Site 2002
A major advantage of circulating fluid bed boilers is their capacity to process different
feedstocks with varying compositions and moisture contents. As with bubbling-bed boilers, bed
agglomeration is a concern. High alkaline content fuels cause particles in the bed to agglomerate,
eventually defluidizing the system.
In general, gasification technology is selected on the basis of available fuel quality,
capacity range, and gas quality conditions. Table 1 shows the thermal capacity ranges for the
main gasifier designs.
13
Table 1. Thermal Capacity of Different Gasifier Designs
Gasifier Design Fuel Capacity
Downdraft 1kW – 1MW
Updraft 1.1MW – 12MW
BFB 1MW-50MW
CFB 10MW-200MW Source: Morris, 1998
Larger capacity gasifiers are preferable for treatment of MSW because they allow for
variable fuel feed, uniform process temperatures due to highly turbulent flow through the bed,
good interaction between gases and solids, and high levels of carbon conversion (EREN, 2002).
3. MSW as an Energy Feedstock
MSW is a negatively priced, abundant and essentially renewable feedstock. Currently,
about 220 million tons per year or 0.8 tons of MSW per capita are generated in the US. The
composition of these wastes can vary from one community to the next, but the overall
differences are not substantial. Table 2 shows two separate estimates of the typical US MSW
composition.
Table 2. Comparison of US MSW Composition (%)
Tchobanoglous, et al. 1993 EPA 530-S-97-015, 1997 Paper 34 33.7 Cardboard 6 5.5 Plastics 7.0 9.1 Textiles 2.0 3.6 Rubber, Leather, “other” 1.0 2.0 Wood 2.0 7.2 Yard Wastes 2.0 14.0 Food Wastes 9.0 9.0 Glass and Metals 17.5 13.1 Source: Columbia, 2001
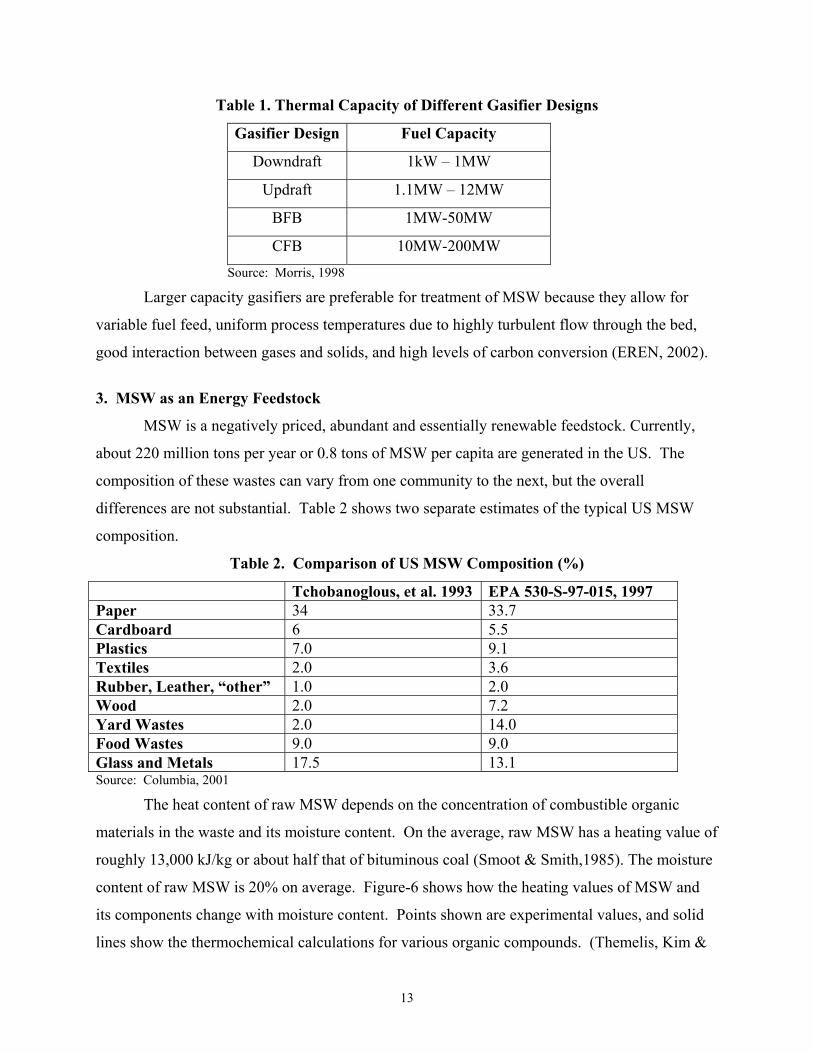
The heat content of raw MSW depends on the concentration of combustible organic
materials in the waste and its moisture content. On the average, raw MSW has a heating value of
roughly 13,000 kJ/kg or about half that of bituminous coal (Smoot & Smith,1985). The moisture
content of raw MSW is 20% on average. Figure-6 shows how the heating values of MSW and
its components change with moisture content. Points shown are experimental values, and solid
lines show the thermochemical calculations for various organic compounds. (Themelis, Kim &
14
Brady, 2002). This table shows that mixed plastics and rubber contribute the highest heating
values to municipal solid waste. Moist food and yard wastes have the lowest heating value and
are better suited for composting, rather than for combustion or gasification.
Figure 6. Effect of moisture on heating value of MSW materials
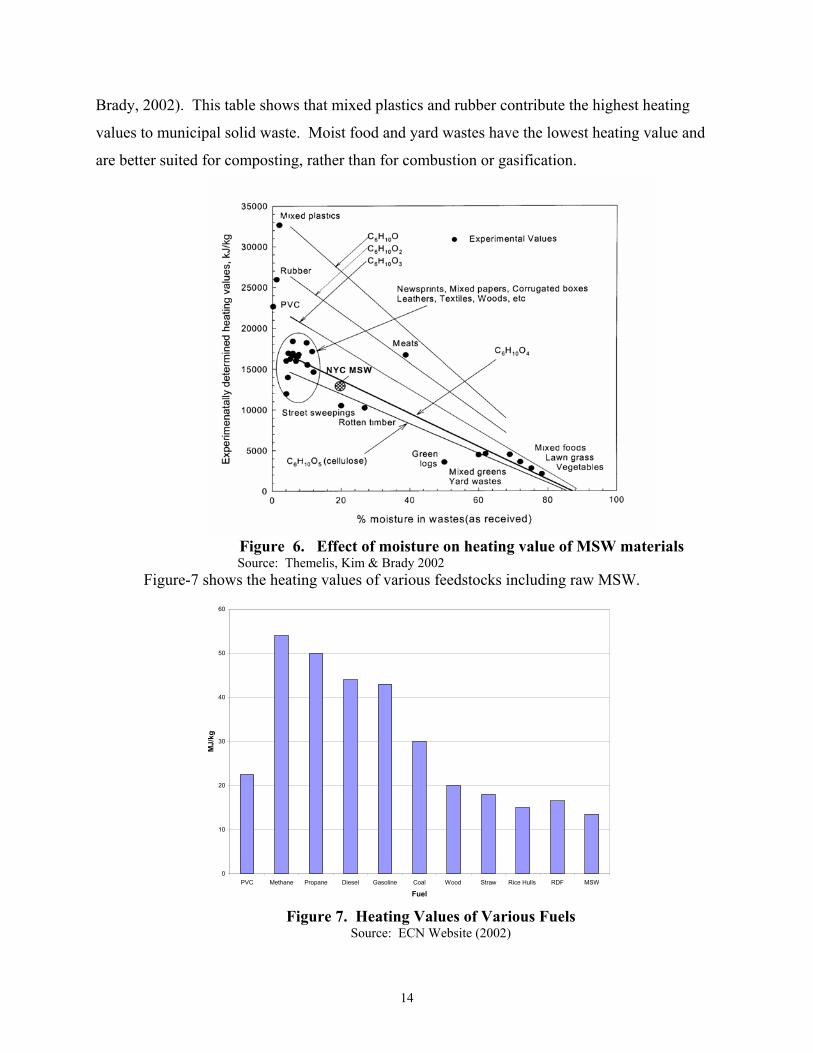
Source: Themelis, Kim & Brady 2002 Figure-7 shows the heating values of various feedstocks including raw MSW.
0
10
20
30
40
50
60
PVC Methane Propane Diesel Gasoline Coal Wood Straw Rice Hulls RDF MSW
Fuel
MJ/
kg
Figure 7. Heating Values of Various Fuels
Source: ECN Website (2002)
15
A study by Themelis and Kim (2002) modeled the thermodynamic properties of the
combustible components of municipal solid waste. They calculated the following molecular
formulas for the key components of MSW as follows:
Mixed paper: C6H9.6O4.6N0.036 S0.01
Mixed plastics: C6H8.6O1.7
Mixed food wastes: C6H9.6O3.5N0.28 S0.2
Yard wastes: C6H9.2O3.8N0.01 S0..04
Based on the data shown by Tchobanoglous (1993) in Table 2, Themelis and Kim (2002)
also showed that the hydrocarbon formula that most closely approximated the mix of organic
wastes in MSW is C6H10O4.
The ash composition and concentration of a fuel can result in agglomeration in the
gasification vessel and that can lead to clogging of fluidized beds and increased tar formation. In
general, no slagging occurs with fuels having an ash content below 5%. MSW has high ash
content (10-12%), versus coal ash (5-10%) and wood wastes (1-5% ash).
Raw MSW can be converted into a better fuel for power generation by making it more
homogeneous. Several waste-to-energy plants create a refuse-derived fuel (RDF), through the
separation of inert materials, size reduction, and densifying. RDF plants remove recyclable or
non-combustible materials and shred the remaining trash into a homogenous fuel. The densified
material is more easily transported, stored, combusted and gasified than raw MSW. The size of a
particle affects the time required to combust. Therefore shredded RDF, which typically has a
diameter of 6 inches or less, reduces the required residence time in a fluidized bed and allows for
more complete combustion. During gasification, the use of a RDF permits a lower air-to-fuel
ratio and lowers bed temperatures. Under these conditions, a very large fraction of the organic
refuse component breaks down into volatile components. In addition, the processing of MSW to
RDF can include the addition of calcium compounds that reduce HCl emissions and may reduce
trace elements concentration by one to two orders of magnitude.
Producing a true RDF cost-effectively remains one of the most difficult tasks in
thermochemical conversion of solid waste. It involves a large amount of mechanical processing
and close supervision, which greatly impact operating costs and can account for as much as 50%
of the total plant capital costs. If too much metal and glass are allowed to pass through into the
16
gasifier, the heating value of the RDF decreases and there are constant operational problems and
plant shutdowns making the plants costly and unreliable. Therefore, waste gasification will be
most successful in communities where there is good recycling practice. It should be noted that
energy recovery from waste is not in competition with recycling, but rather its complement in a
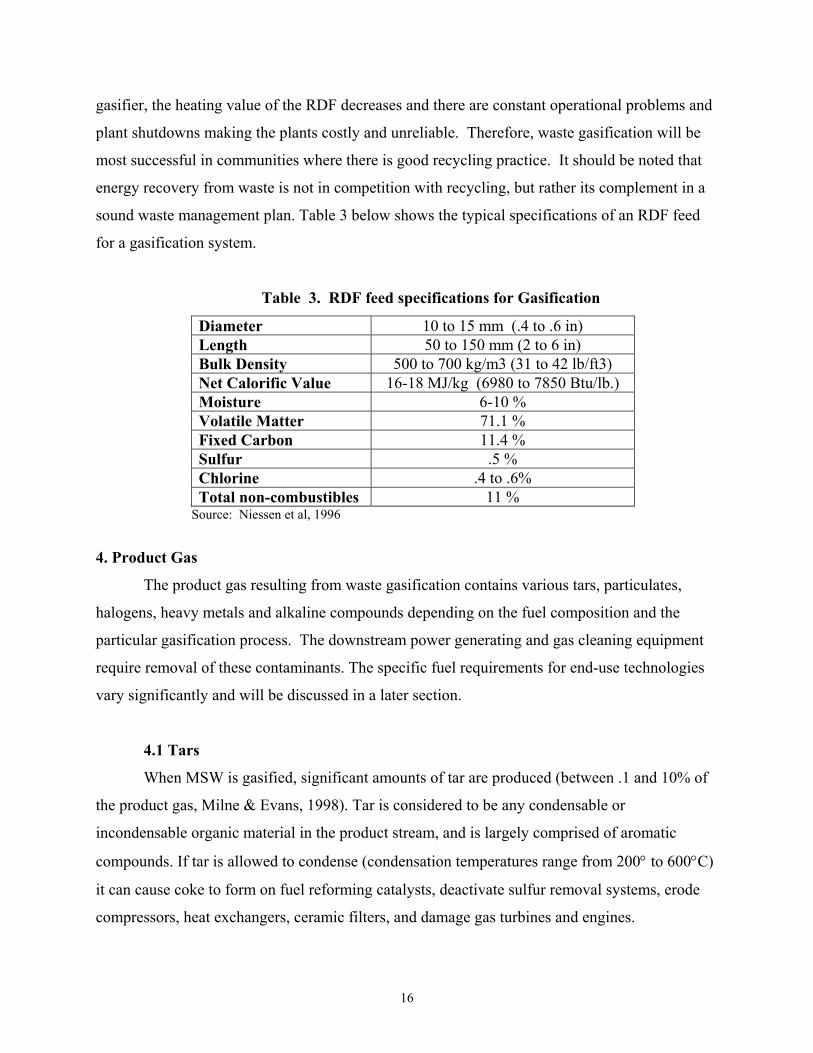
sound waste management plan. Table 3 below shows the typical specifications of an RDF feed
for a gasification system.
Table 3. RDF feed specifications for Gasification
Diameter 10 to 15 mm (.4 to .6 in) Length 50 to 150 mm (2 to 6 in) Bulk Density 500 to 700 kg/m3 (31 to 42 lb/ft3) Net Calorific Value 16-18 MJ/kg (6980 to 7850 Btu/lb.) Moisture 6-10 % Volatile Matter 71.1 % Fixed Carbon 11.4 % Sulfur .5 % Chlorine .4 to .6% Total non-combustibles 11 %
Source: Niessen et al, 1996
4. Product Gas
The product gas resulting from waste gasification contains various tars, particulates,
halogens, heavy metals and alkaline compounds depending on the fuel composition and the
particular gasification process. The downstream power generating and gas cleaning equipment
require removal of these contaminants. The specific fuel requirements for end-use technologies
vary significantly and will be discussed in a later section.
4.1 Tars
When MSW is gasified, significant amounts of tar are produced (between .1 and 10% of
the product gas, Milne & Evans, 1998). Tar is considered to be any condensable or
incondensable organic material in the product stream, and is largely comprised of aromatic
compounds. If tar is allowed to condense (condensation temperatures range from 200° to 600°C)
it can cause coke to form on fuel reforming catalysts, deactivate sulfur removal systems, erode
compressors, heat exchangers, ceramic filters, and damage gas turbines and engines.
17
Incondensible tars can also cause problems for advanced power conversion devices, such as fuel
cell catalysts and complicate environmental emissions compliance.
The amount and composition of tars are dependent on the fuel, the operating conditions
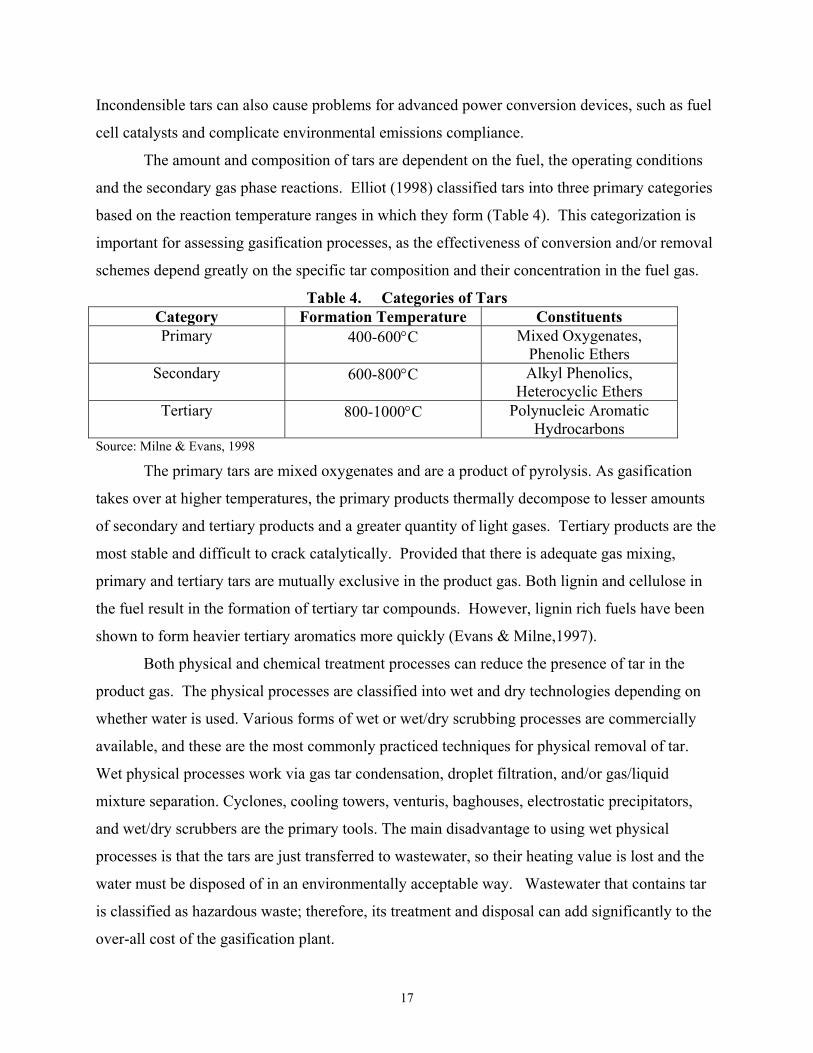
and the secondary gas phase reactions. Elliot (1998) classified tars into three primary categories
based on the reaction temperature ranges in which they form (Table 4). This categorization is
important for assessing gasification processes, as the effectiveness of conversion and/or removal
schemes depend greatly on the specific tar composition and their concentration in the fuel gas.
Table 4. Categories of Tars Category Formation Temperature Constituents Primary 400-600°C Mixed Oxygenates,
Phenolic Ethers Secondary 600-800°C Alkyl Phenolics,
Heterocyclic Ethers Tertiary 800-1000°C Polynucleic Aromatic
Hydrocarbons Source: Milne & Evans, 1998
The primary tars are mixed oxygenates and are a product of pyrolysis. As gasification
takes over at higher temperatures, the primary products thermally decompose to lesser amounts
of secondary and tertiary products and a greater quantity of light gases. Tertiary products are the
most stable and difficult to crack catalytically. Provided that there is adequate gas mixing,
primary and tertiary tars are mutually exclusive in the product gas. Both lignin and cellulose in
the fuel result in the formation of tertiary tar compounds. However, lignin rich fuels have been
shown to form heavier tertiary aromatics more quickly (Evans & Milne,1997).
Both physical and chemical treatment processes can reduce the presence of tar in the
product gas. The physical processes are classified into wet and dry technologies depending on
whether water is used. Various forms of wet or wet/dry scrubbing processes are commercially
available, and these are the most commonly practiced techniques for physical removal of tar.
Wet physical processes work via gas tar condensation, droplet filtration, and/or gas/liquid
mixture separation. Cyclones, cooling towers, venturis, baghouses, electrostatic precipitators,
and wet/dry scrubbers are the primary tools. The main disadvantage to using wet physical
processes is that the tars are just transferred to wastewater, so their heating value is lost and the
water must be disposed of in an environmentally acceptable way. Wastewater that contains tar
is classified as hazardous waste; therefore, its treatment and disposal can add significantly to the
over-all cost of the gasification plant.
18
Dry tar removal using ceramic, metallic, or fabric filters are alternatives to wet tar
removal processes. However, at temperatures above 150°C, tars can become “sticky” causing
operational problems with such barriers. As a result, such dry tar removal schemes are rarely
implemented. Injection of activated carbon in the product gas stream or in a granular bed may
also reduce tars through adsorption and collection with a baghouse. The carbonaceous material
containing the tars can be recycled back to the gasifier to encourage further thermal and catalytic
decomposition.
Chemical tar treatment processes are the most widely practiced in the gasification
industry. They can be divided into four generic categories: thermal, steam, partially oxidative,
and catalytic processes. Tars can be removed from the gas stream in the fuel reformer or by
separate hot gas tar removal catalysts. Thermal destruction has been shown to break down
aromatics at temperatures above 1,000oC. However, such high temperatures can have adverse
effects on heat exchangers and refractory surfaces due to ash sintering in the gasification vessel.
The introduction of steam does encourage reformation of primary and some secondary
oxygenated tar compounds, but has little effect on tertiary aromatics.
The presence of oxygen during gasification has been shown to accelerate both the
destruction of primary tar products and the formation of aromatic compounds from the phenolic
compounds. Evans and Milne 1997 reported the amount of aromatics formed by thermal
cracking increases in the presence of low oxygen environments (less than 10%) of the gas. Only
above 10% was a decrease in the amount of tertiary tars observed. A net increase in the CO level
could also be observed as the product from the oxidative cracking of tars. It was also shown that
benzene levels were not affected by the presence of oxygen.
The most widely used and studied tar cracking catalyst is dolomite (a mixture of MgCO3
and CaCO3). Dolomite has been shown to work more effectively when placed in a vessel
downstream from the gasifier and in a low carbon monoxide environment. When used in the
gasifier, the catalysts accumulate a layer of coke rapidly causing them to lose their effectiveness.
The specific tar conversion and destruction schemes chosen depend on the nature and
composition of the tars present, as well as the intended end-use equipment. For a closely
coupled lime-kiln or well-designed combustion boiler, tar clean-up is not critical. However,
advantages of tar cracking in the product gas include increased thermal-to-electrical efficiencies,
lower emissions, and lower effluent treatment costs. The lack of effective and inexpensive tar
19
removal processes has remained the primary barrier to widespread commercialization of biomass
and MSW integrated gasification combined cycle (IGCC) power generation.
4.2 Halogens/Acid Gases
The principal combustion products of halogens are either hydrogen halides, (i.e. HCl,
HBr) or metal halides (i.e. HgCl) that leave the fuel bed along with the flue gases. In the
gasificatio of pure MSW, HCl is the prevailing chlorine product. Bromine (Br) seems to
accumulate to a greater extent in the bottom ash. Typical Br content in municipal solid waste,
however, is very low (30 - 200 mg/kg), as compared to Cl (3,000-6,000 mg/kg). Chlorine is
mainly transformed to HCl and bromine to HBr, both of which are easily removed in all modern
scrubbing systems and hence cause no emission problems.
A significant advantage of gasification is that it takes place in a reducing atmosphere,
which prevents sulfur and nitrogen compounds from oxidizing. As a result, most elemental
nitrogen or sulfur in the waste stream end up as H2S, COS, N2 or ammonia rather than SOx and
NOx. The reduced sulfur species can then be recovered as elemental sulfur at efficiencies
between 95 and 99%, or converted to a sulfuric acid by-product. The typical sulfur removal and
recovery processes used to treat the raw syngas are the same as commercially available methods
used in other industrial applications, such as oil refining and natural gas recovery. One
commonly used process to remove sulfur compounds is the selective-amine technology where
reduced sulfur species are removed from the syngas using an amine-based solvent in an absorber
tower. Physical solvents are also used. The reduced sulfur species removed in the solvent
stripper are converted to elemental sulfur in a sulfur recovery process such as the Selectox/Claus
process (Orr and Maxwell, 2000).
When MSW is gasified, nitrogen in the fuel is converted primarily to ammonia, which
when fired in a turbine or other combustion engine forms nitrogen oxides, a harmful pollutant.
Removal of ammonia and other nitrogen compounds in the product gas prior to combustion can
be accomplished with wet scrubbers or by catalytic destruction. Catalytic destruction of
ammonia has been studied with dolomite and iron based catalysts. This technique is of interest
because tars are simultaneously decomposed (cracked) to lower weight gaseous compounds.
Destruction of 99% of the ammonia in the gas stream has been demonstrated with these catalysts.
If the product gas is cooled first, wet scrubbing with lime is also an effective ammonia removal
20
technique. Gasification processes that use pure oxygen, steam or hydrogen, will only have
nitrogen contents brought in through the fuel stream. Typical MSW has a nitrogen content of
less than 1% by mass.
4.3 Heavy Metals
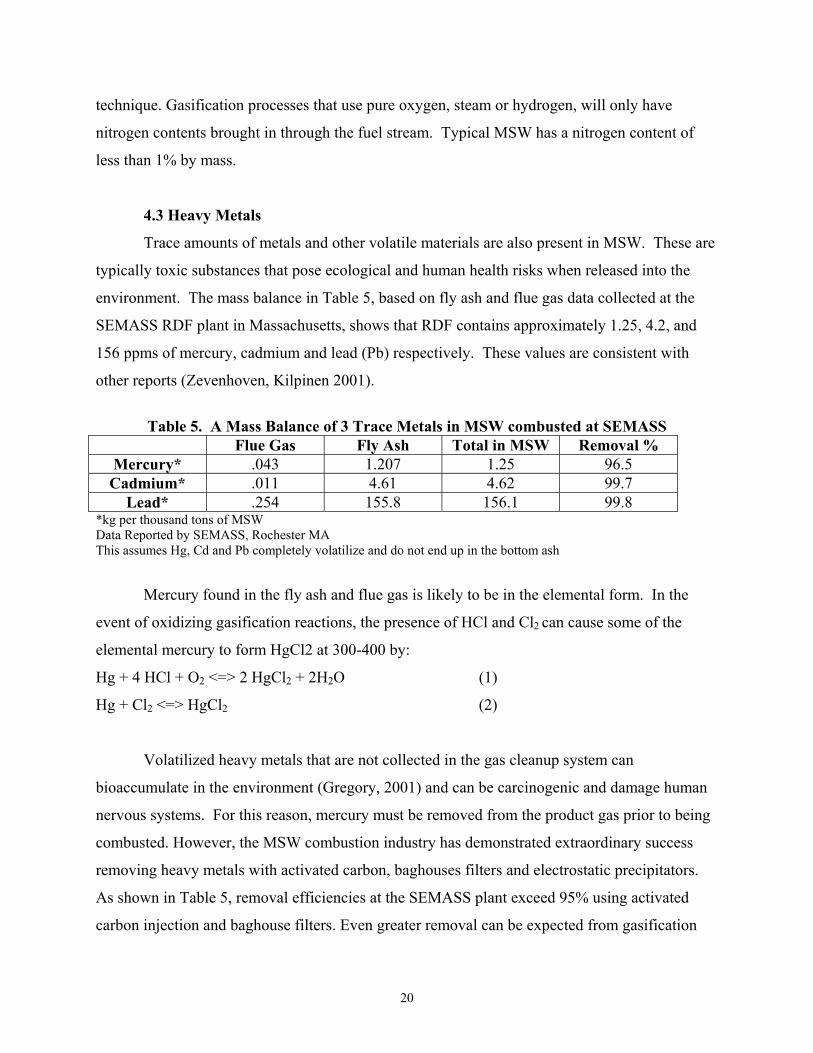
Trace amounts of metals and other volatile materials are also present in MSW. These are
typically toxic substances that pose ecological and human health risks when released into the
environment. The mass balance in Table 5, based on fly ash and flue gas data collected at the
SEMASS RDF plant in Massachusetts, shows that RDF contains approximately 1.25, 4.2, and
156 ppms of mercury, cadmium and lead (Pb) respectively. These values are consistent with
other reports (Zevenhoven, Kilpinen 2001).
Table 5. A Mass Balance of 3 Trace Metals in MSW combusted at SEMASS Flue Gas Fly Ash Total in MSW Removal %
Mercury* .043 1.207 1.25 96.5 Cadmium* .011 4.61 4.62 99.7
Lead* .254 155.8 156.1 99.8 *kg per thousand tons of MSW Data Reported by SEMASS, Rochester MA This assumes Hg, Cd and Pb completely volatilize and do not end up in the bottom ash
Mercury found in the fly ash and flue gas is likely to be in the elemental form. In the
event of oxidizing gasification reactions, the presence of HCl and Cl2 can cause some of the
elemental mercury to form HgCl2 at 300-400 by:
Hg + 4 HCl + O2 <=> 2 HgCl2 + 2H2O (1)
Hg + Cl2 <=> HgCl2 (2)
Volatilized heavy metals that are not collected in the gas cleanup system can
bioaccumulate in the environment (Gregory, 2001) and can be carcinogenic and damage human
nervous systems. For this reason, mercury must be removed from the product gas prior to being
combusted. However, the MSW combustion industry has demonstrated extraordinary success
removing heavy metals with activated carbon, baghouses filters and electrostatic precipitators.
As shown in Table 5, removal efficiencies at the SEMASS plant exceed 95% using activated
carbon injection and baghouse filters. Even greater removal can be expected from gasification
21
plants, because heavy metals will have a higher partial pressure in the product gas, which will
encourage greater adsorption during cooling according to the thermodynamic relationship: ∆G=-
RTln(P1/P0).
4.4 Alkalis
Alkali compounds in biomass and MSW gasification ash can cause serious slagging in
the boiler or gasification vessel. Sintered or fused deposits can form agglomerates in fluidized
beds and on grates. Potassium sulfates and chlorides have been found to mix with flue dust and
condense on the upper walls of the furnace. The primary elements causing alkali slagging are
potassium, sodium, chlorine and silica. Sufficient volatile alkali content in a feedstock that
reduces fusion temperature and promotes slagging begins with a fuel concentration of 0.17 to
0.34kg/GJ. At higher levels, noticeable fouling occurs (Miles et al, 1996).
Alkali deposit formation is a result of particle impaction, condensation, thermophoresis,
and chemical reaction. Unfortunately, most deposits occur subsequent to combustion and cannot
be predicted solely by analysis of the fuel composition. A study by Korsgren et al, 1999, showed
that there are two characteristic temperature intervals for alkali metal emission. A small fraction
of the alkali content is released below 500°C and is attributed to the decomposition of the
organic structure. Another fraction of alkali compounds is released from the char residue at
temperatures above 500°C.
The presence of alkali metals in combustion and gasification processes is known to cause
several operational problems. Eutectic alkali salts mixtures with low melting points are formed
on the surfaces of fly ash particles or the fluidized bed material. The sticky particle surfaces may
lead to the formation of bed material agglomerates, which must be replaced by fresh material.
The deposition of fly ash particles and the condensation of vapor-phase alkali compounds on
heat exchanging surfaces lower the heat conductivity and may eventually require temporary plant
shutdowns for the removal of deposits.
The challenges of removing alkali vapor and particulate matter are closely connected,
since alkali metal compounds play an important role in the formation of new particles as well as
the chemical degradation of ceramic barrier filters used in some hot gas cleaning systems. The
most straightforward way of reducing the alkali content from the fuel gas prior to the gas turbine
is to cool the gas and condense out the alkali compounds. If the gas cooler is kept at 400-500°C,
22
the alkali concentration has been shown to approach the gas specifications for gas turbines, i.e.
0.1 ppm (wt) and below. Although effective, the energy loss makes this method less attractive.
There has been extensive research on developing ceramic filters followed by high temperature
“getter beds” that may be used for capturing alkali compounds while simultaneously removing
other particulate matter from the hot product gas produced in high pressure, high temperature
gasifiers. An ideal high temperature “getter” material would have the characteristics of rapid
adsorption rates, high loading capacity, transformation of alkali into a less corrosive form, and
irreversible adsorption to prevent the release of adsorbed alkali during process fluctuations.
Such materials include bauxite (aluminium ore) and emathlite (roughly 70% SiO2 and 10%
Al2O3, with the remainder composed of smaller amounts (<5%) of MgO, Fe2O3, TiO2, CaO,
K2O, and Na2O), and have been shown to reduce alkali species below the specifications for the
operation of gas turbines (Turn, et al 2000). However, more research needs to be done to
determine the impact of carbonaceous tars on such “getter beds”. If tar concentrations are
relatively high in the product gas they are likely to cause significant fouling. As a result, high
temperature gas cleanup depends on sufficient tar cracking upstream.
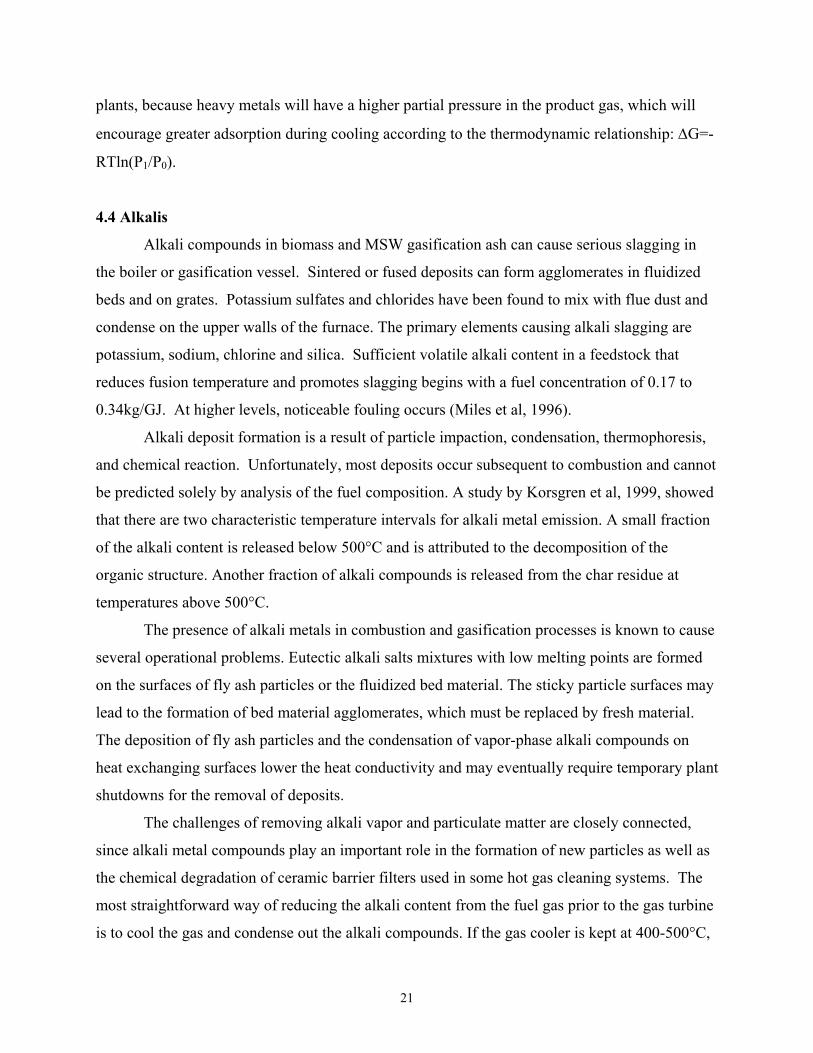
Table 6. Alkali Concentration in Some Fuels (mg/kg, ppmw, dry)
Coal Scrap Tires Wood Saw
Dust
RDF Straw
Sodium (Na) 100-500 200-600 40 3,000-5,000 100-5000
Potassium
(K)
50-3,000 200-600 500 2,000-3,000 5,000-10,000
Chlorine (Cl) Na Na Na 3000-6000 Na Source: Zevenhoven & Kilpinen, 2001 Source of Chlorine: ASME, 2002
5.0 Power Generation
Power generating equipment that can be integrated with a MSW gasification process
include steam boilers, reciprocating engines, combined cycle turbines and fuel cells.
Combustion boilers have the highest tolerance for tars and other impurities but are also the least
efficient (about 31%) from the point of view of thermal energy conversion to electricity. In
contrast, combined cycle turbines, reciprocating engines and fuel cells offer operational
23
efficiencies of 40%+. The following two sections describe combined cycle turbines and fuel cells
as potential components in an integrated MSW gasification system.
5.1 Integrated Gasification Combined Cycle IGCC
The Integrated Gasification Combined Cycle (IGCC) concept is based on the
combination of a gasification system with a gas turbine and a steam cycle and has the potential to
provide thermal energy to power conversion efficiencies exceeding 40 %.
Critical for the success of the IGCC is the maintenance of the gas turbine. The IGCC
turbine’s lifetime can be limited due to erosion and high temperature corrosion caused by
impaction of particles and deposition of impurities such as alkali metals in the product gas.
Corrosion of the turbine blades is accelerated by formation of low melting eutectic salt mixtures,
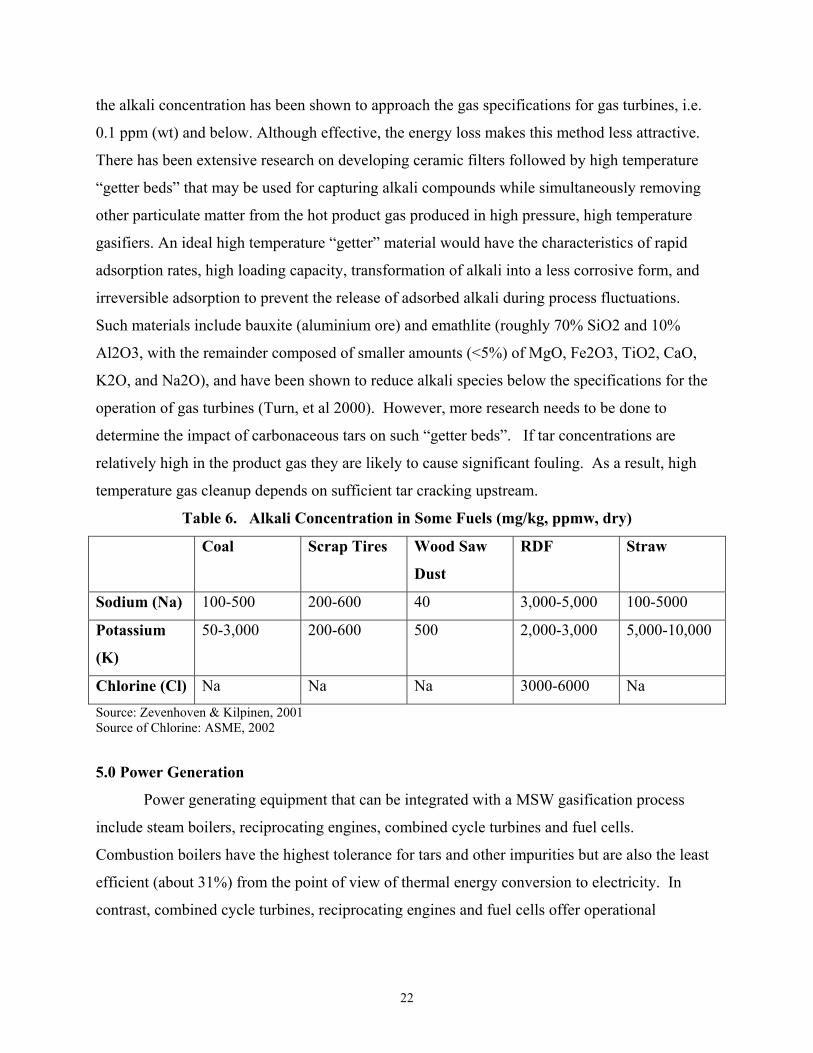
of which alkali sulfates are believed to be important constituents. Turbine manufactures have set
specifications for the maximum tolerable alkali metal concentration of the fuel gas to be less than
0.1 ppm of the fuel by weight. These specifications are often based on operating experience with
fossil fuels (ETIS 2001).
Table 7. Gas Turbine Specifications for Trace Elements in a Product Gas
Element Allowable Concentration
Motivation
Potassium <1 ppm Hot Corrosion Sodium <1 ppm Hot Corrosion
Lead 1 ppm Hot Corrosion Zinc 1 ppm Fouling Tar <0.5 mg/m3 Hot Corrosion
Particulates < 0.1 ppm Fouling Source: Spliethoff, 2001
5.2 Fuel Cells
The best type of fuel cell for integration with a MSW gasifier is the tabular solid oxide
fuel cell (TSOFC) (Figure 8). The electrolyte used is a solid, nonporous metal oxide, usually
Y2O3 –stabilized ZrO2. The cell operates at 1000°C where ionic conduction by oxygen ions
takes place. Typically, the anode is Co-ZrO2 or Ni-ZrO2 cermet, and the cathode is Sr-doped La
MnO3. The solid ceramic construction of the cell reduces the hardware corrosion problems
characterized by the liquid electrolyte cells and has the advantage of being impervious to gas
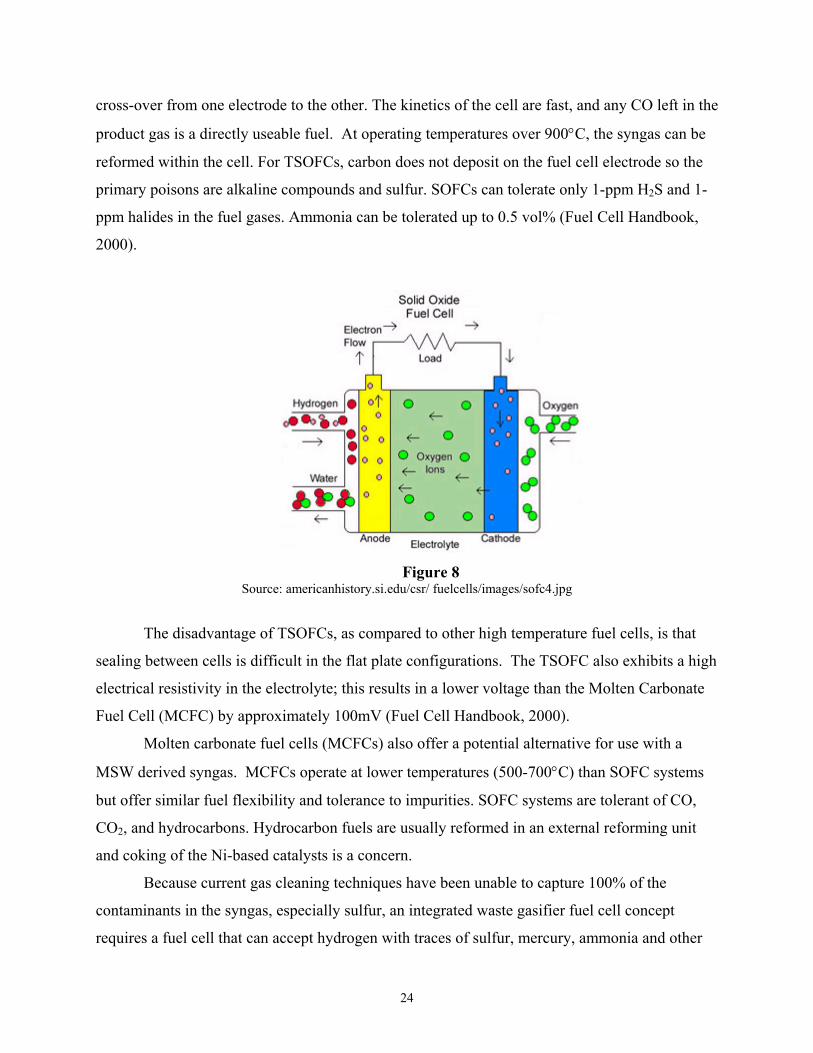
24
cross-over from one electrode to the other. The kinetics of the cell are fast, and any CO left in the
product gas is a directly useable fuel. At operating temperatures over 900°C, the syngas can be
reformed within the cell. For TSOFCs, carbon does not deposit on the fuel cell electrode so the
primary poisons are alkaline compounds and sulfur. SOFCs can tolerate only 1-ppm H2S and 1-
ppm halides in the fuel gases. Ammonia can be tolerated up to 0.5 vol% (Fuel Cell Handbook,
2000).
Figure 8
Source: americanhistory.si.edu/csr/ fuelcells/images/sofc4.jpg
The disadvantage of TSOFCs, as compared to other high temperature fuel cells, is that
sealing between cells is difficult in the flat plate configurations. The TSOFC also exhibits a high
electrical resistivity in the electrolyte; this results in a lower voltage than the Molten Carbonate
Fuel Cell (MCFC) by approximately 100mV (Fuel Cell Handbook, 2000).
Molten carbonate fuel cells (MCFCs) also offer a potential alternative for use with a
MSW derived syngas. MCFCs operate at lower temperatures (500-700°C) than SOFC systems
but offer similar fuel flexibility and tolerance to impurities. SOFC systems are tolerant of CO,
CO2, and hydrocarbons. Hydrocarbon fuels are usually reformed in an external reforming unit
and coking of the Ni-based catalysts is a concern.
Because current gas cleaning techniques have been unable to capture 100% of the
contaminants in the syngas, especially sulfur, an integrated waste gasifier fuel cell concept
requires a fuel cell that can accept hydrogen with traces of sulfur, mercury, ammonia and other
25
chemicals from the feedstock. Such SOFCs have not yet been designed or manufactured for
operation with synthesis gas. So, until more tolerant fuel cells or more advanced gas cleaning
technologies have been developed, integrated waste gasifiers with fuel cells will be impractical.
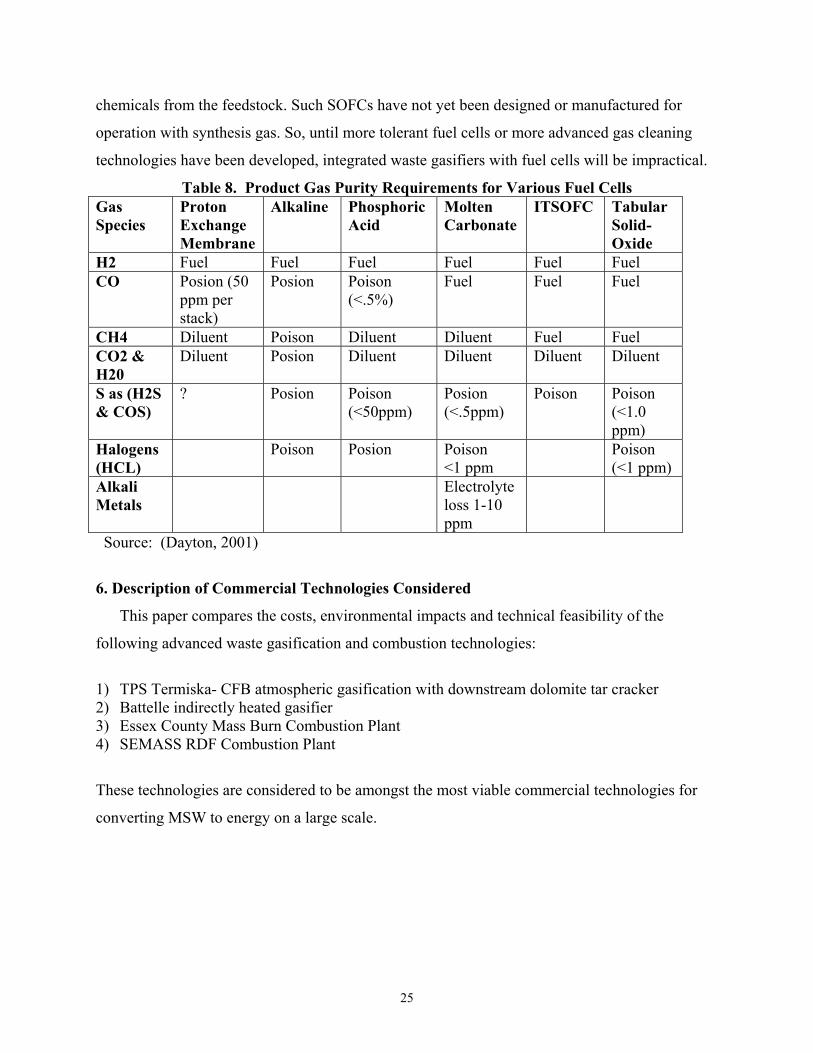
Table 8. Product Gas Purity Requirements for Various Fuel Cells Gas Species
Proton Exchange Membrane
Alkaline Phosphoric Acid
Molten Carbonate
ITSOFC Tabular Solid- Oxide
H2 Fuel Fuel Fuel Fuel Fuel Fuel CO Posion (50
ppm per stack)
Posion Poison (<.5%)
Fuel Fuel Fuel
CH4 Diluent Poison Diluent Diluent Fuel Fuel CO2 & H20
Diluent Posion Diluent Diluent Diluent Diluent
S as (H2S & COS)
? Posion Poison (<50ppm)
Posion (<.5ppm)
Poison Poison (<1.0 ppm)
Halogens (HCL)
Poison Posion Poison <1 ppm
Poison (<1 ppm)
Alkali Metals
Electrolyte loss 1-10 ppm
Source: (Dayton, 2001)
6. Description of Commercial Technologies Considered
This paper compares the costs, environmental impacts and technical feasibility of the
following advanced waste gasification and combustion technologies:
1) TPS Termiska- CFB atmospheric gasification with downstream dolomite tar cracker 2) Battelle indirectly heated gasifier 3) Essex County Mass Burn Combustion Plant 4) SEMASS RDF Combustion Plant
These technologies are considered to be amongst the most viable commercial technologies for
converting MSW to energy on a large scale.
26
6.1 TPS Termiska Processer –AB
TPS Termiska is a Swedish research and development company that focuses on
combustion and gasification of solid waste and biomass. TPS Termiska licensed its waste
gasification technology to Ansaldo Aerimpianti SpA in 1989. In 1992, Ansaldo installed a
commercial, two-bed unit in Greve-in-Chianti, Italy, which is operated by TPS. The gasification
plant has a total capacity of 200 metric tons of RDF per day (Figure 8). The two units have a
combined capacity of 30 MWth. The TPS technology uses a starved-air gasification process in a
combined bubbling and circulating fluidized bed reactor operated at 850°C and near atmospheric
pressure. RDF is fed to the fluidized bed. Air is used as the gasification/fluidizing agent. Part of
the air is injected into the gasifier vessel through the bottom section and the remainder higher up
in the vessel. This pattern of air distribution causes a density gradient in the vessel. The lower
part maintains bubbling fluidization that allows coarse fuel particles adequate residence time for
good gasification reactions. The secondary air introduced higher up in the vessel increases the
superficial velocity of air through the reactor so that smaller, lighter particles are carried away in
the gas flow.
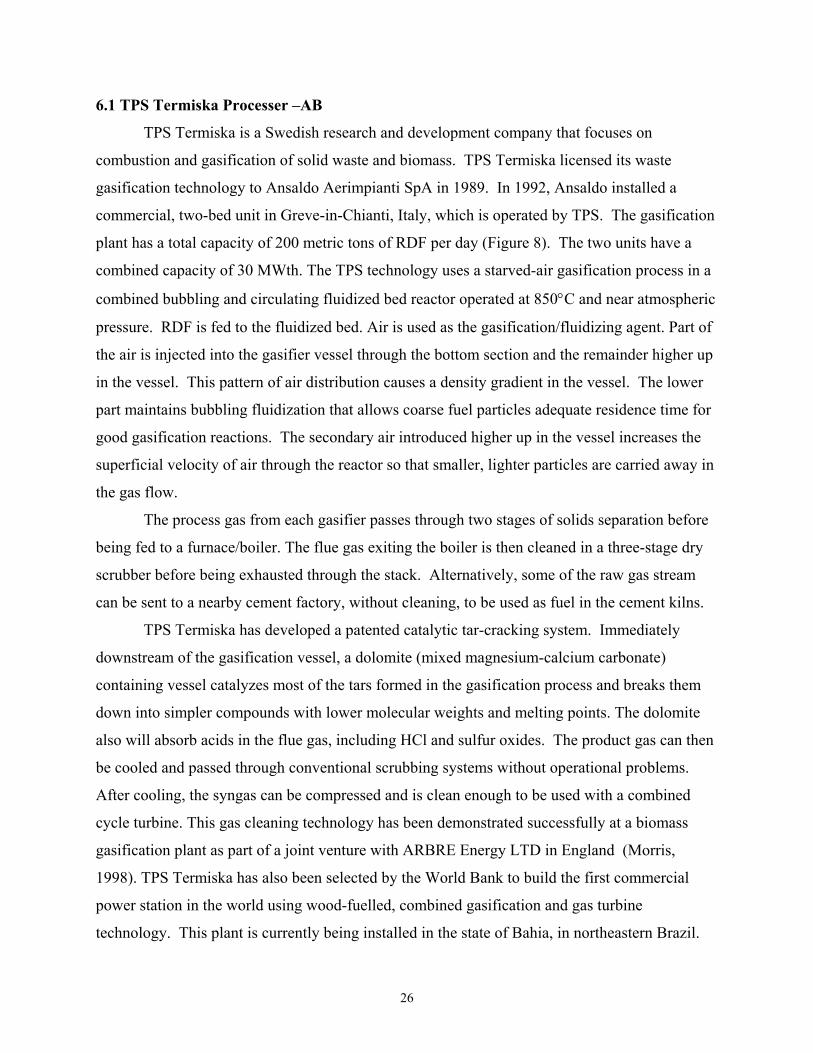
The process gas from each gasifier passes through two stages of solids separation before
being fed to a furnace/boiler. The flue gas exiting the boiler is then cleaned in a three-stage dry
scrubber before being exhausted through the stack. Alternatively, some of the raw gas stream
can be sent to a nearby cement factory, without cleaning, to be used as fuel in the cement kilns.
TPS Termiska has developed a patented catalytic tar-cracking system. Immediately
downstream of the gasification vessel, a dolomite (mixed magnesium-calcium carbonate)
containing vessel catalyzes most of the tars formed in the gasification process and breaks them
down into simpler compounds with lower molecular weights and melting points. The dolomite
also will absorb acids in the flue gas, including HCl and sulfur oxides. The product gas can then
be cooled and passed through conventional scrubbing systems without operational problems.
After cooling, the syngas can be compressed and is clean enough to be used with a combined
cycle turbine. This gas cleaning technology has been demonstrated successfully at a biomass
gasification plant as part of a joint venture with ARBRE Energy LTD in England (Morris,
1998). TPS Termiska has also been selected by the World Bank to build the first commercial
power station in the world using wood-fuelled, combined gasification and gas turbine
technology. This plant is currently being installed in the state of Bahia, in northeastern Brazil.
27
Figure 8. TPS Termiska Flow Sheet
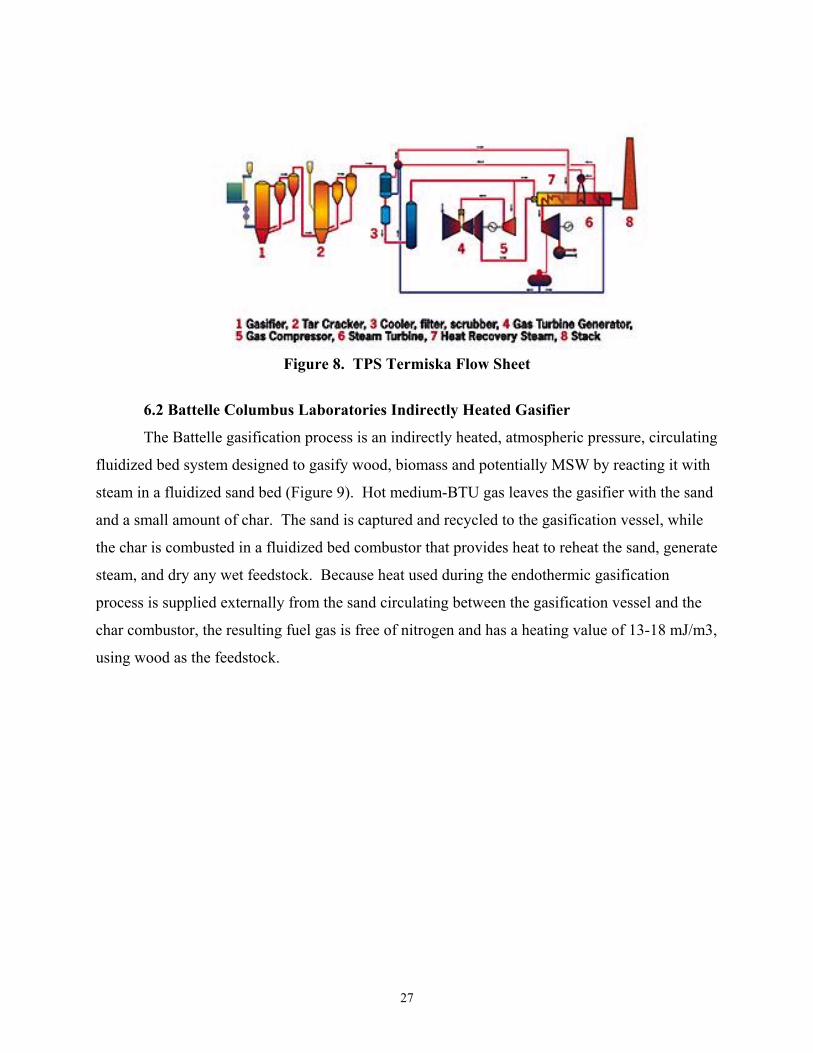
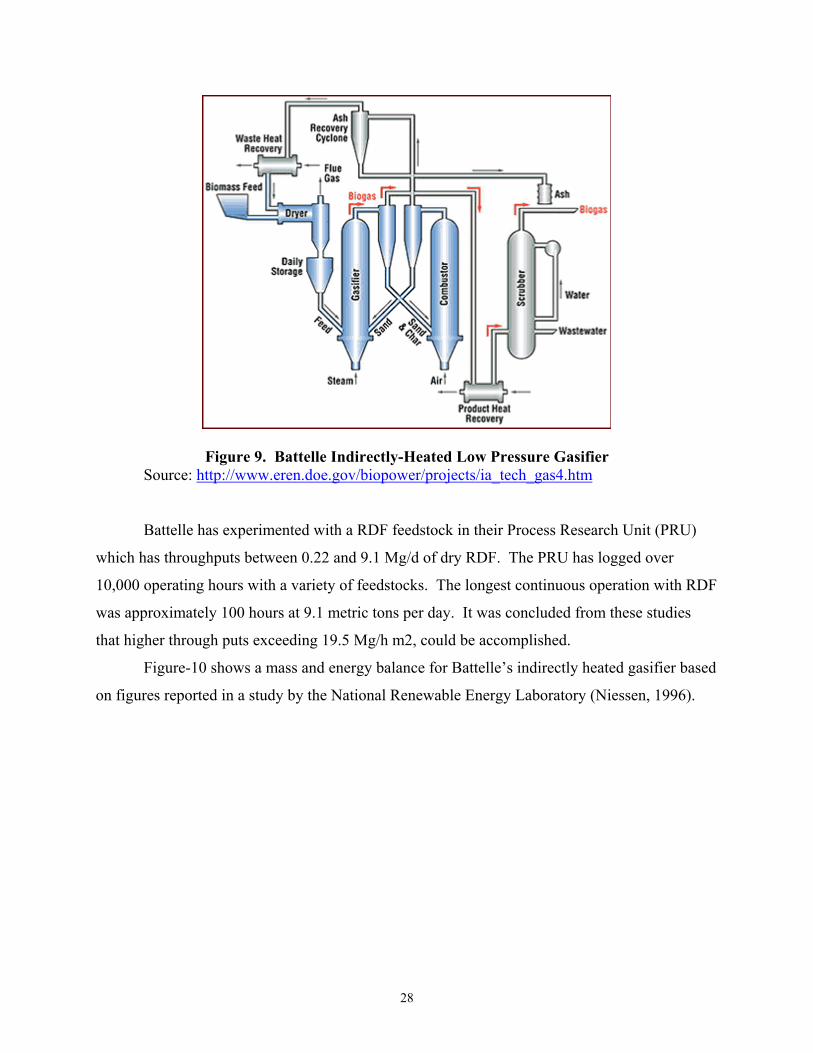
6.2 Battelle Columbus Laboratories Indirectly Heated Gasifier
The Battelle gasification process is an indirectly heated, atmospheric pressure, circulating
fluidized bed system designed to gasify wood, biomass and potentially MSW by reacting it with
steam in a fluidized sand bed (Figure 9). Hot medium-BTU gas leaves the gasifier with the sand
and a small amount of char. The sand is captured and recycled to the gasification vessel, while
the char is combusted in a fluidized bed combustor that provides heat to reheat the sand, generate
steam, and dry any wet feedstock. Because heat used during the endothermic gasification
process is supplied externally from the sand circulating between the gasification vessel and the
char combustor, the resulting fuel gas is free of nitrogen and has a heating value of 13-18 mJ/m3,
using wood as the feedstock.
28
Figure 9. Battelle Indirectly-Heated Low Pressure Gasifier Source: http://www.eren.doe.gov/biopower/projects/ia_tech_gas4.htm
Battelle has experimented with a RDF feedstock in their Process Research Unit (PRU)
which has throughputs between 0.22 and 9.1 Mg/d of dry RDF. The PRU has logged over
10,000 operating hours with a variety of feedstocks. The longest continuous operation with RDF
was approximately 100 hours at 9.1 metric tons per day. It was concluded from these studies
that higher through puts exceeding 19.5 Mg/h m2, could be accomplished.
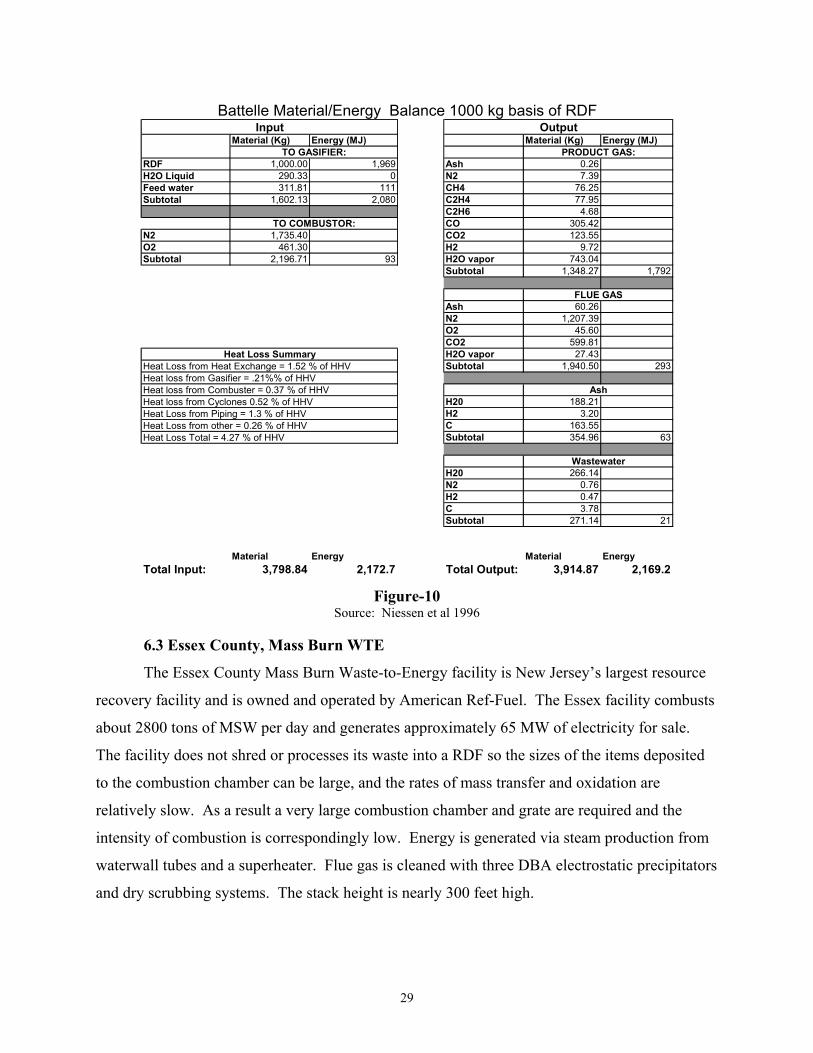
Figure-10 shows a mass and energy balance for Battelle’s indirectly heated gasifier based
on figures reported in a study by the National Renewable Energy Laboratory (Niessen, 1996).
29
Material (Kg) Energy (MJ) Material (Kg) Energy (MJ)
RDF 1,000.00 1,969 Ash 0.26H2O Liquid 290.33 0 N2 7.39Feed water 311.81 111 CH4 76.25Subtotal 1,602.13 2,080 C2H4 77.95
C2H6 4.68CO 305.42
N2 1,735.40 CO2 123.55O2 461.30 H2 9.72Subtotal 2,196.71 93 H2O vapor 743.04
Subtotal 1,348.27 1,792
Ash 60.26N2 1,207.39O2 45.60CO2 599.81H2O vapor 27.43Subtotal 1,940.50 293
H20 188.21H2 3.20C 163.55Subtotal 354.96 63
H20 266.14N2 0.76H2 0.47C 3.78Subtotal 271.14 21
Material Energy Material EnergyTotal Input: 3,798.84 2,172.7 Total Output: 3,914.87 2,169.2
Heat Loss from other = 0.26 % of HHVHeat Loss Total = 4.27 % of HHV
TO GASIFIER:
FLUE GAS
Heat loss from Combuster = 0.37 % of HHVHeat loss from Cyclones 0.52 % of HHV
PRODUCT GAS:
Battelle Material/Energy Balance 1000 kg basis of RDF
Ash
Heat Loss from Piping = 1.3 % of HHV
Wastewater
TO COMBUSTOR:
OutputInput
Heat Loss SummaryHeat Loss from Heat Exchange = 1.52 % of HHVHeat loss from Gasifier = .21%% of HHV
Figure-10
Source: Niessen et al 1996
6.3 Essex County, Mass Burn WTE
The Essex County Mass Burn Waste-to-Energy facility is New Jersey’s largest resource
recovery facility and is owned and operated by American Ref-Fuel. The Essex facility combusts
about 2800 tons of MSW per day and generates approximately 65 MW of electricity for sale.
The facility does not shred or processes its waste into a RDF so the sizes of the items deposited
to the combustion chamber can be large, and the rates of mass transfer and oxidation are
relatively slow. As a result a very large combustion chamber and grate are required and the
intensity of combustion is correspondingly low. Energy is generated via steam production from
waterwall tubes and a superheater. Flue gas is cleaned with three DBA electrostatic precipitators
and dry scrubbing systems. The stack height is nearly 300 feet high.
30
6.4 SEMASS RDF Combustion
The SEMASS resource recovery facility at Rochester, MA was developed by Energy
Answers Corporation and is now owned and operated by American Ref-Fuel. This facility takes
in about 3,000 short tons of waste per day by covered rail car and truck from communities within
a 65-mile radius. There are three combustion units. The waste brought to the plant is loaded
onto conveyors, shredded and exposed to overhead magnets that recover ferrous metals from the
waste. The shredded RDF (also called Processed Refuse Fuel) is then sent into the combustion
chambers through inclined chutes. A portion of the feed is burned in suspension, while the
remainder falls onto a horizontal moving grate. The grate moves slowly and it takes materials
approximately one hour to move from the front to the rear of the boiler. The feed rate can be
adjusted automatically by installed temperature controls to provide maximum efficiency.
Underfire and overfire air are introduced to enhance combustion. Waterwall tubes, a superheater
and an economizer are used to recover heat for production of steam. Detailed operating data
show that 650 kWh of electricity are generated per ton of MSW combusted. Of this amount,
100kWh are used in the plant operation and 550kWh are sold to an electric utility.
7. Technoeconomic Comparison 7.1 Energy Comparison
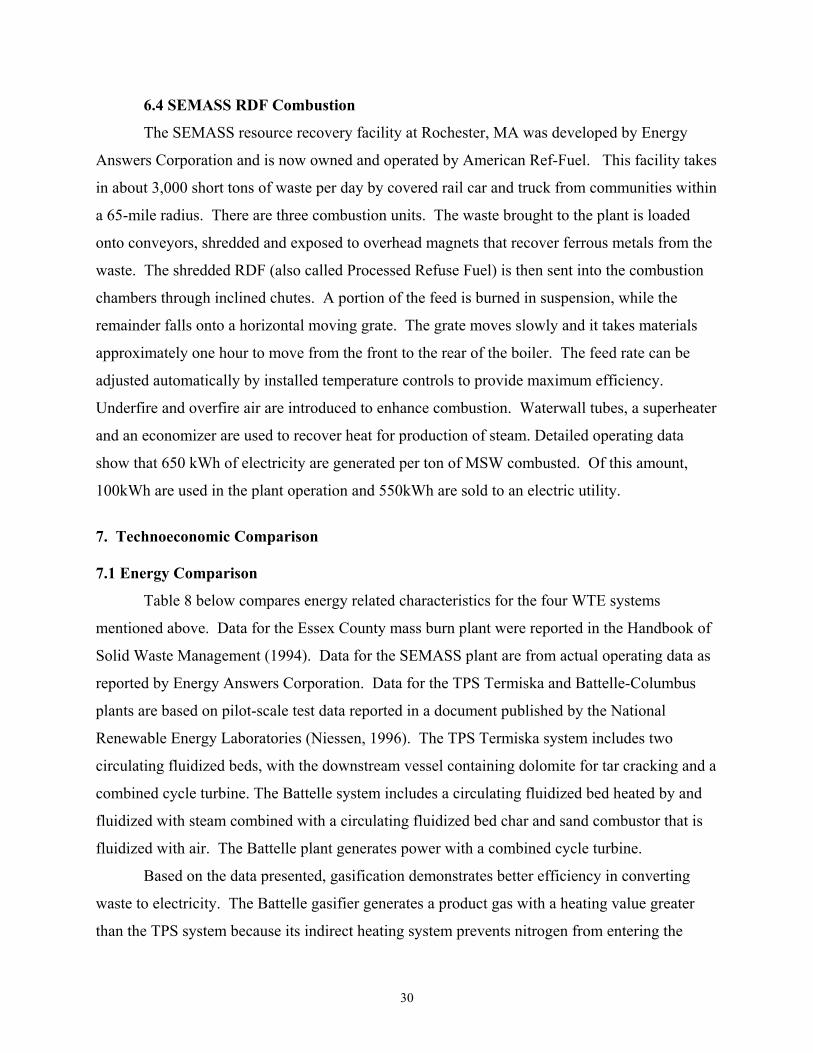
Table 8 below compares energy related characteristics for the four WTE systems
mentioned above. Data for the Essex County mass burn plant were reported in the Handbook of
Solid Waste Management (1994). Data for the SEMASS plant are from actual operating data as
reported by Energy Answers Corporation. Data for the TPS Termiska and Battelle-Columbus
plants are based on pilot-scale test data reported in a document published by the National
Renewable Energy Laboratories (Niessen, 1996). The TPS Termiska system includes two
circulating fluidized beds, with the downstream vessel containing dolomite for tar cracking and a
combined cycle turbine. The Battelle system includes a circulating fluidized bed heated by and
fluidized with steam combined with a circulating fluidized bed char and sand combustor that is
fluidized with air. The Battelle plant generates power with a combined cycle turbine.
Based on the data presented, gasification demonstrates better efficiency in converting
waste to electricity. The Battelle gasifier generates a product gas with a heating value greater
than the TPS system because its indirect heating system prevents nitrogen from entering the
31
gasification vessel. As a result, the volume of gas generated by the Battelle process is also
significantly lower than all the other plants.
The Essex County Mass Burn plant requires the least amount of electric energy to
operate. This reflects the energy penalty associated with the pre-processing of MSW in an RDF
plant. However, Essex also generates the least amount of electricity per ton of waste
demonstrating that a cleaner and more homogenous feedstock results in more efficient
combustion and gasification reactions.
All Tonnages are reported as Short Tons *Temiska TPS *Battelle-
Columbus
**Essex County
Mass Burn
***SEMASS RDF
MSW Processed per Year (Tons) 642,400 341,275 831,105 910,000
RDF Processed per Year (Tons) 506,255 239,075 N/A N/A
HHV of Product Gas (MJ per cu. Meter) 7.5 18.6 N/A N/A
HHV of Product Gas (GJ per Ton MSW) 6.8 7.1 N/A N/A
Volume of Product Gas (cu. meter /Ton MSW) 906 396.5 6700+ 6700
Gross Power Rating (MW) 74.5 47 76 78
Annual Gross Power Production (kwh/ton MSW)
781 703 501 660
Facility Power Needs (kwh/ton MSW) 130 70 23
RDF Plant Power Needs (kwh/ton MSW) 15 21 N/A
Excess Power for Sale (kWh/ton MSW) 636 612 476 550
Table 8. Energy Data for Various MSW Waste-To-Energy Technologies
110
Sources: *Niessen et al, 1998 **Handbook of Solid Waste Management, 1994 *** Provided by Energy Answers Corp. All Tonnages are in Short Tons
32
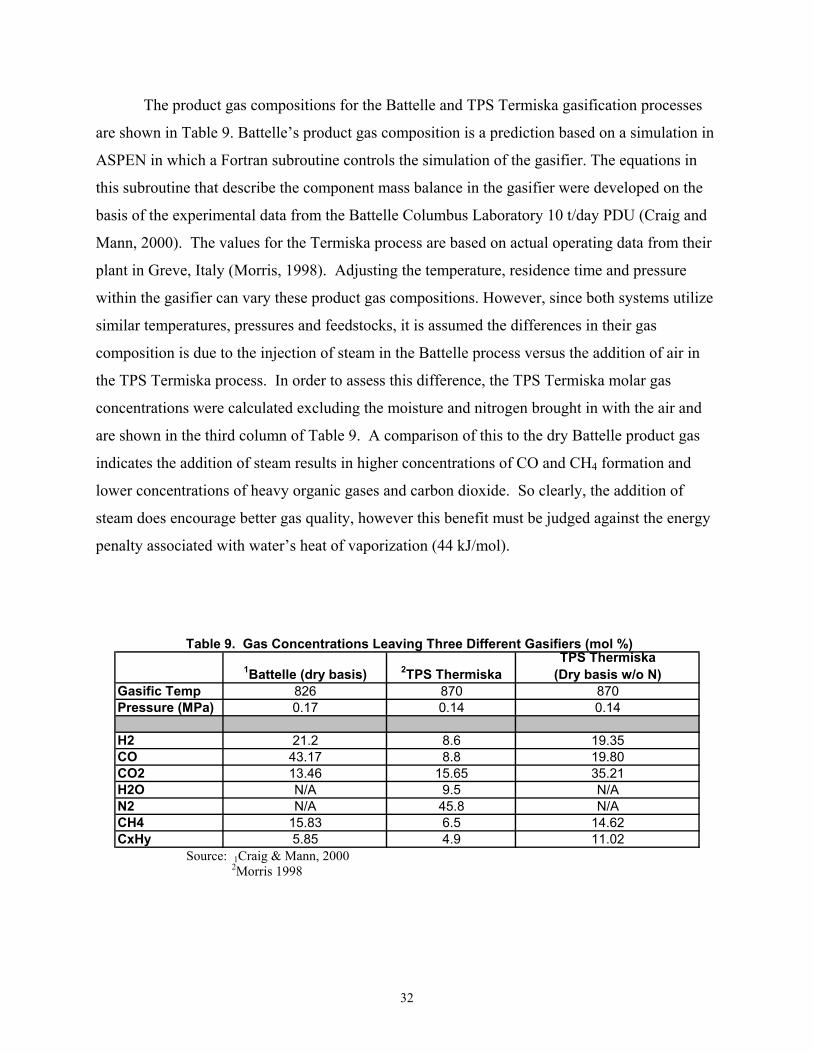
The product gas compositions for the Battelle and TPS Termiska gasification processes
are shown in Table 9. Battelle’s product gas composition is a prediction based on a simulation in
ASPEN in which a Fortran subroutine controls the simulation of the gasifier. The equations in
this subroutine that describe the component mass balance in the gasifier were developed on the
basis of the experimental data from the Battelle Columbus Laboratory 10 t/day PDU (Craig and
Mann, 2000). The values for the Termiska process are based on actual operating data from their
plant in Greve, Italy (Morris, 1998). Adjusting the temperature, residence time and pressure
within the gasifier can vary these product gas compositions. However, since both systems utilize
similar temperatures, pressures and feedstocks, it is assumed the differences in their gas
composition is due to the injection of steam in the Battelle process versus the addition of air in
the TPS Termiska process. In order to assess this difference, the TPS Termiska molar gas
concentrations were calculated excluding the moisture and nitrogen brought in with the air and
are shown in the third column of Table 9. A comparison of this to the dry Battelle product gas
indicates the addition of steam results in higher concentrations of CO and CH4 formation and
lower concentrations of heavy organic gases and carbon dioxide. So clearly, the addition of
steam does encourage better gas quality, however this benefit must be judged against the energy
penalty associated with water’s heat of vaporization (44 kJ/mol).
1Battelle (dry basis) 2TPS Thermiska TPS Thermiska
(Dry basis w/o N)Gasific Temp 826 870 870Pressure (MPa) 0.17 0.14 0.14
H2 21.2 8.6 19.35CO 43.17 8.8 19.80CO2 13.46 15.65 35.21H2O N/A 9.5 N/AN2 N/A 45.8 N/ACH4 15.83 6.5 14.62CxHy 5.85 4.9 11.02
Table 9. Gas Concentrations Leaving Three Different Gasifiers (mol %)
Source: 1Craig & Mann, 2000 2Morris 1998
33
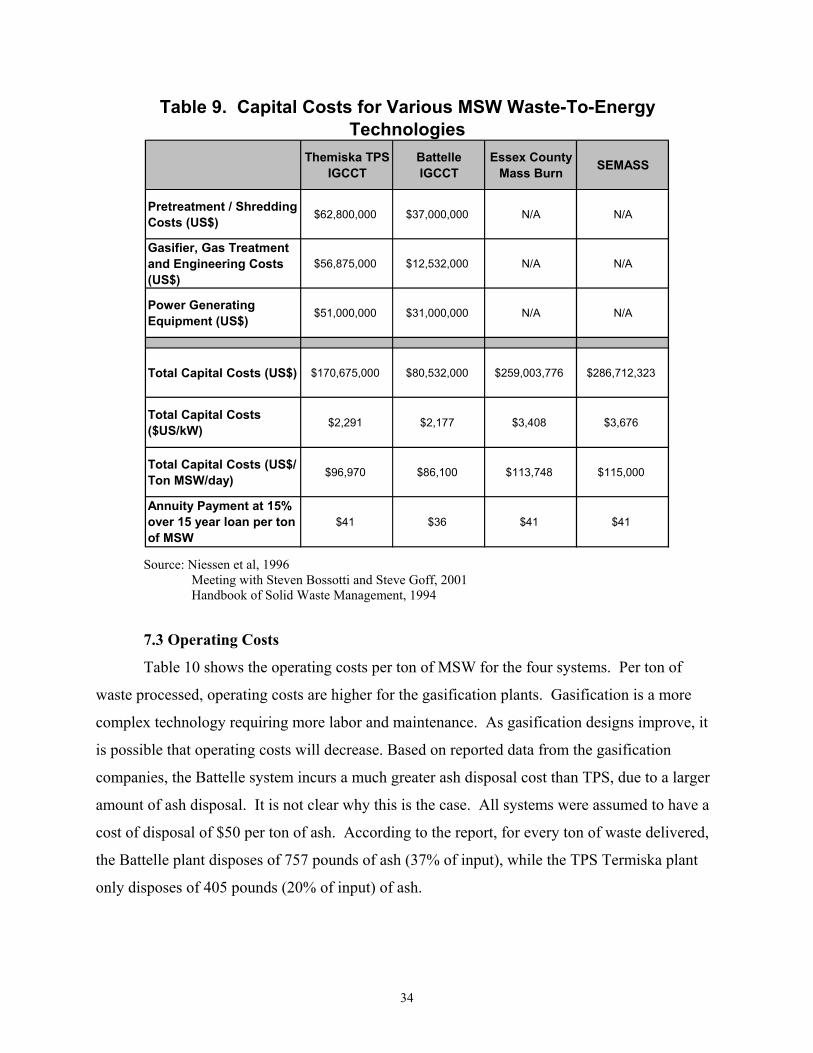
7.2 Capital Costs
The gasification systems are less expensive per kW than the combustion plants because
of their higher chemical to electrical efficiencies. Additionally, overall capital costs per daily ton
are lower for the gasification plants. This is expected since gasification generates less product
gas (from Table 8), which requires much smaller and less expensive gas cleaning equipment.
Plants with lower capital costs are easier to finance, as there are less severe financial risks
associated with plant shutdowns prior to start-up. This trend is evident in the traditional power
markets. For example, investors favor natural gas plants over coal because of their lower up-
front capital costs despite larger fuel costs during operation. Consequently, assuming
comparable reliability, investors are likely to favor gasification plants over combustion plants.
The RDF processing is a significant capital cost of the gasification systems, accounting
for nearly 40% of the total. The green field cost, including power generation system for an
Integrated Biomass gasification system, typically varies between $1,200 and $2,000 per kW,
installed. The extensive pretreatment process for MSW and necessary gas clean-up explains the
higher cost of MSW gasification systems.
In order to normalize the data as much as possible, annuity payments were calculated at a
constant 10% discount rate over an expected loan lifetime period of 15 years for all systems.
Better project financing terms are likely as more acceptance and confidence is garnered towards
this industry. All of the data reported in this thesis are based on engineering estimates. Variable
operating and capital costs such as the price of land, tax rates and insurance were not taken into
account for any of the systems compared.
34
Themiska TPS IGCCT
Battelle IGCCT
Essex County Mass Burn SEMASS
Pretreatment / Shredding Costs (US$) $62,800,000 $37,000,000 N/A N/A
Gasifier, Gas Treatment and Engineering Costs (US$)
$56,875,000 $12,532,000 N/A N/A
Power Generating Equipment (US$) $51,000,000 $31,000,000 N/A N/A
Total Capital Costs (US$) $170,675,000 $80,532,000 $259,003,776 $286,712,323
Total Capital Costs ($US/kW) $2,291 $2,177 $3,408 $3,676
Total Capital Costs (US$/ Ton MSW/day) $96,970 $86,100 $113,748 $115,000
Annuity Payment at 15% over 15 year loan per ton of MSW
$41 $36 $41 $41
Table 9. Capital Costs for Various MSW Waste-To-Energy Technologies
Source: Niessen et al, 1996 Meeting with Steven Bossotti and Steve Goff, 2001 Handbook of Solid Waste Management, 1994
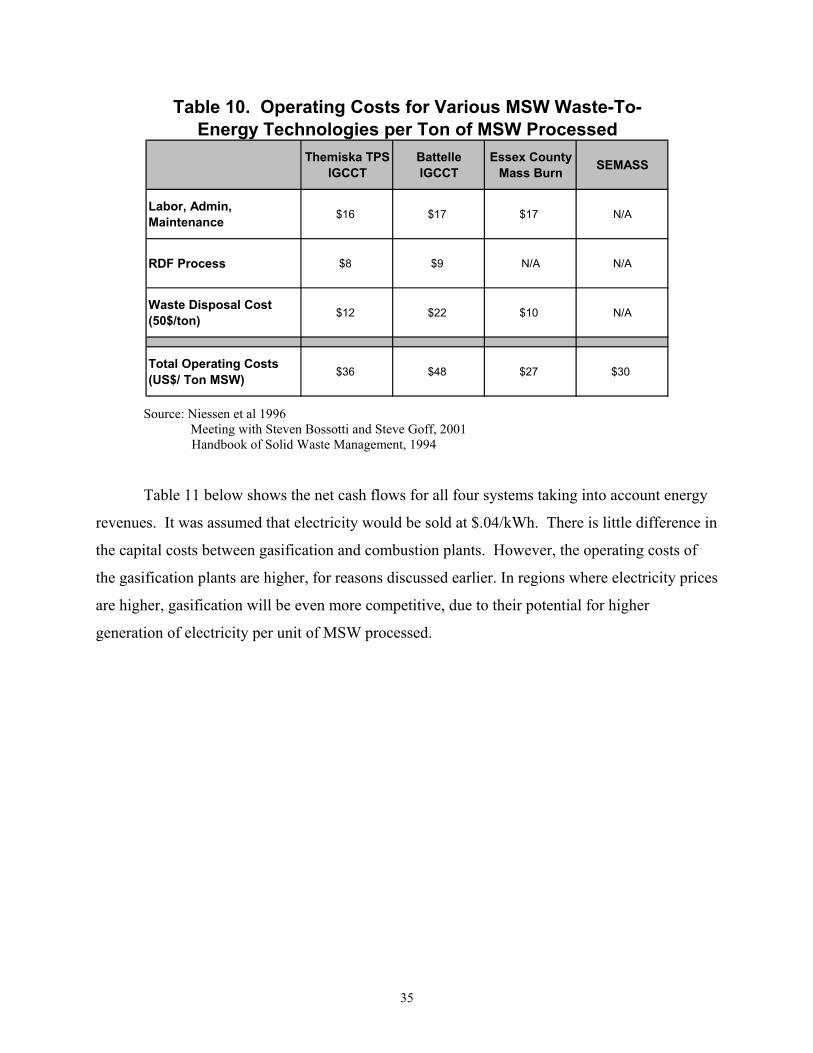
7.3 Operating Costs
Table 10 shows the operating costs per ton of MSW for the four systems. Per ton of
waste processed, operating costs are higher for the gasification plants. Gasification is a more
complex technology requiring more labor and maintenance. As gasification designs improve, it
is possible that operating costs will decrease. Based on reported data from the gasification
companies, the Battelle system incurs a much greater ash disposal cost than TPS, due to a larger
amount of ash disposal. It is not clear why this is the case. All systems were assumed to have a
cost of disposal of $50 per ton of ash. According to the report, for every ton of waste delivered,
the Battelle plant disposes of 757 pounds of ash (37% of input), while the TPS Termiska plant
only disposes of 405 pounds (20% of input) of ash.
35
Themiska TPS IGCCT
Battelle IGCCT
Essex County Mass Burn SEMASS
Labor, Admin, Maintenance $16 $17 $17 N/A
RDF Process $8 $9 N/A N/A
Waste Disposal Cost (50$/ton) $12 $22 $10 N/A
Total Operating Costs (US$/ Ton MSW) $36 $48 $27 $30
Table 10. Operating Costs for Various MSW Waste-To-Energy Technologies per Ton of MSW Processed
Source: Niessen et al 1996 Meeting with Steven Bossotti and Steve Goff, 2001 Handbook of Solid Waste Management, 1994 Table 11 below shows the net cash flows for all four systems taking into account energy
revenues. It was assumed that electricity would be sold at $.04/kWh. There is little difference in
the capital costs between gasification and combustion plants. However, the operating costs of
the gasification plants are higher, for reasons discussed earlier. In regions where electricity prices
are higher, gasification will be even more competitive, due to their potential for higher
generation of electricity per unit of MSW processed.
36
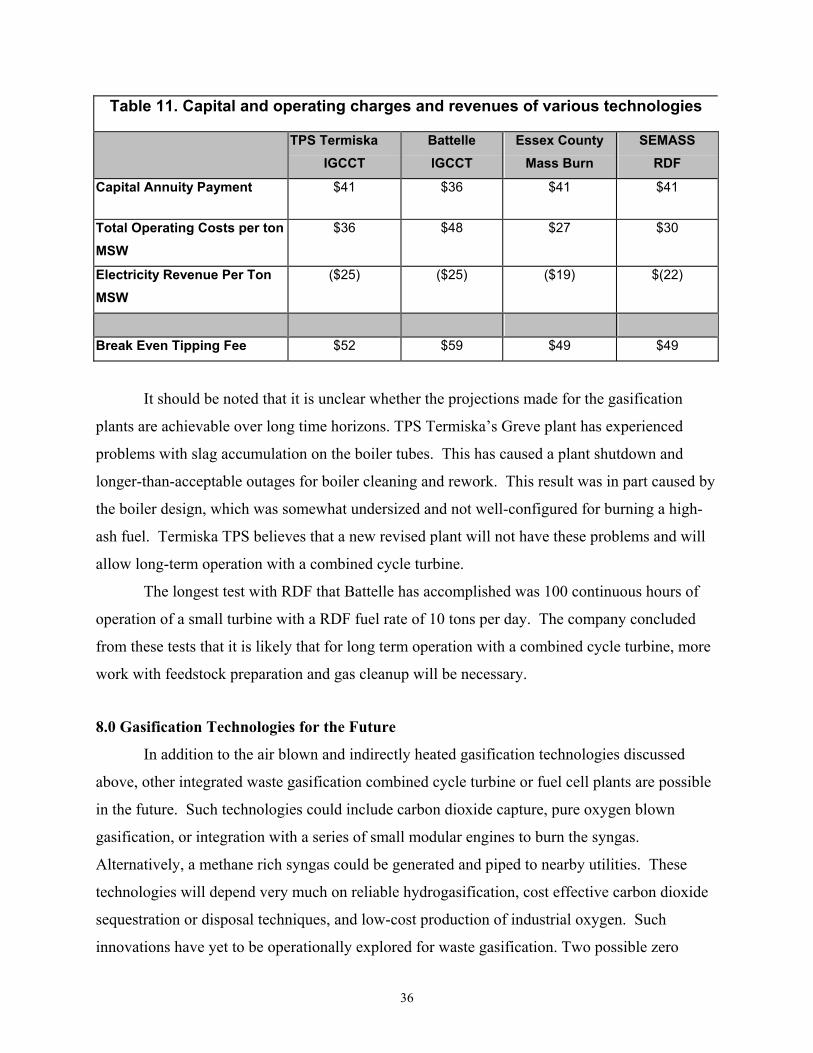
Table 11. Capital and operating charges and revenues of various technologies
TPS Termiska IGCCT
Battelle IGCCT
Essex County Mass Burn
SEMASS RDF
Capital Annuity Payment $41 $36 $41 $41
Total Operating Costs per ton MSW
$36 $48 $27 $30
Electricity Revenue Per Ton MSW
($25) ($25) ($19) $(22)
Break Even Tipping Fee $52 $59 $49 $49
It should be noted that it is unclear whether the projections made for the gasification
plants are achievable over long time horizons. TPS Termiska’s Greve plant has experienced
problems with slag accumulation on the boiler tubes. This has caused a plant shutdown and
longer-than-acceptable outages for boiler cleaning and rework. This result was in part caused by
the boiler design, which was somewhat undersized and not well-configured for burning a high-
ash fuel. Termiska TPS believes that a new revised plant will not have these problems and will
allow long-term operation with a combined cycle turbine.
The longest test with RDF that Battelle has accomplished was 100 continuous hours of
operation of a small turbine with a RDF fuel rate of 10 tons per day. The company concluded
from these tests that it is likely that for long term operation with a combined cycle turbine, more
work with feedstock preparation and gas cleanup will be necessary.
8.0 Gasification Technologies for the Future
In addition to the air blown and indirectly heated gasification technologies discussed
above, other integrated waste gasification combined cycle turbine or fuel cell plants are possible
in the future. Such technologies could include carbon dioxide capture, pure oxygen blown
gasification, or integration with a series of small modular engines to burn the syngas.
Alternatively, a methane rich syngas could be generated and piped to nearby utilities. These
technologies will depend very much on reliable hydrogasification, cost effective carbon dioxide
sequestration or disposal techniques, and low-cost production of industrial oxygen. Such
innovations have yet to be operationally explored for waste gasification. Two possible zero
37
emission plants utilizing hydrogasification are explored below. The first process produces a
methane rich gas and pipes it to a local utility. The second process uses a fuel cell and captures
carbon dioxide and is termed “Zero Emission Waste-to-Energy” (ZEWTE).
8.1 Hydrogasification of Waste with Methane Export
Hydrogasification is an exothermic gasification process in which hydrocarbons are
broken down into a methane rich gas in a hydrogen atmosphere. The main reactions are:
C + 2H2 CH4 -74 KJ/mol
CO + 3H2 CH4 + H20 -205 KJ/mol
Hydrogasification has been experimented with since the 1930’s in Germany, the U.S.,
and Great Britain. For use with MSW, a RDF feed would be fed to a hydrogasifier that operates
under pressure and at temperatures of approximately 800 °C. The resulting methane-rich, low-
tar gas would be passed through a high temperature gas clean-up stage, where alkalis, acid gases
and sulfur would be removed (Figure 10). Following the gas cleaning operation, a portion of the
gas would be sent to a reforming vessel in order to generate enough hydrogen to sustain the
hydrogasification reactions. Alternatively, hydrogen also could be purchased on the open
market, and injected into the gasifier. The resulting methane rich syngas would be piped to a
utility plant. Several utilities, including Duke Energy have expressed their willingness to
purchase syngas generated at waste gasification plants (Conversation with Dr. Helmut Schultz,
Dynecology, 2000).
The main goal of hydrogasification as a waste treatment process is to upgrade the organic
wastes to a methane rich gas. The advantage of the hydrogasification process is that it forms a
gas with low concentration of hydrogen and high concentrations of methane. As a result, there
would be no need to change the conventional pipeline technology in order to transport this
syngas to a nearby utility. Natural gas containing than 10% hydrogen by volume can be
transported without any change in the current gas transport infrastructure (Mozaffarian and
Zwart, 1999). Furthermore, a methane rich gas can be burned directly in a conventional
combined cycle turbine without modification or air bleed. The advantage of generating a syngas
product, rather than combusting the gas to generate electricity is that there would be zero
atmospheric emission at the facility, so siting such a plant may receive less political and
environmental opposition. From an environmental standpoint, syngas clean-up technologies
38
have already demonstrated the ability to scrub out the heavy metals, acid gases and particulates
to be well below emission standards for power plants. To ensure good operation, the methane
rich syngas could also be mixed with the natural gas that is already being burned at the utility.
Hydrogasification is an intriguing process for the destruction of MSW because it may
greatly reduce the heavy organic tars produced during the gasification reactions. Uil et al, 1999
reported that the presence of excess hydrogen in the hydrogasifier, especially in combination
with high operating pressures, might lead to a very low tar content of the produced gas.
Feldmann, 1973 stated that in the hydrogasification of solid wastes no tar was formed at all (Uil
et al 1999). As discussed earlier, minimizing tar greatly improves the effectiveness of gas
cleaning technologies. Additionally, hydrogasification is an exothermic reaction; therefore, once
it has been initiated, supplementary combustion of some of the waste may be unnecessary.
Despite these advantages, hydrogasification of coal and biomass has not been explored
extensively for commercial purposes because the cost of hydrogen was believed to be
prohibitive.
A study by Mozaffarian and Zwart (1999) used the ASPEN plus model to simulate the
hydrogasification of dry poplar wood which has the approximate chemical formula C6H9O3.6
(ECN,2001). The material balances showed that the synthesis gas molar percent concentrations
were 50.2%, 34.8%, 10.1%, and 4.3%, for methane, hydrogen, carbon dioxide, and carbon
monoxide respectively. For MSW with the average chemical formula C6H10O4, the
corresponding hydrogasification reaction could be estimated as:
C6H10O4 + 10.1H2 4.8CH4 + 0.3CO + 0.9CO2 + 3.6H2 + 1.9H2O
This syngas could then either undergo a second methanation reaction to convert the
remaining CO and H2 to CH4, or a PSA could be used to capture the hydrogen and recycle it
back to the gasifier.
8.2. Zero Emission Waste-To-Energy (ZEWTE)
The Zero Emission Waste-to-Energy concept is derived directly from a technology
developed by the Zero Emission Coal Alliance (ZECA). ZECA is pursuing a concept originated
at the Los Alamos National Laboratory. The technology is based on a coal hydrogasification
system, which produces hydrogen and a stream of CO2 suitable for mineral carbonate
sequestration, or use with alternative CO2 disposal processes. In the ZECA process, coal is
39
converted to a methane gas through an exothermic reaction with hydrogen (Eq. 1, below). The
resulting methane synthesis gas is cleaned with sulfur removal systems and cyclones to remove
particulates. The gas is then transferred to a second vessel where it is reformed at approximately
60 atm and 825°C to produce a relatively pure hydrogen stream through the use of a CaO
carbonation reaction. The carbonation reaction removes the CO2 and supplies the energy needed
to drive the reforming reaction (Eq. 2). It is a fortunate coincidence of nature that the net
resulting reaction of equations 1 & 2 are essentially energy-neutral (Eq. 3). Nonetheless, these
two steps must occur in two separate vessels because silica, which represents about 15% of coal,
reacts with CaO to create a slag and this would have deleterious effects on the gasification
vessel.
C + 2H2 CH4 +75 kJ (1)
CH4 + CaO + 2H2O CaCO3 + 4H2 –75 kJ (2)
C + CaO + 2H2O(l) CaCO3 + 2H2 + 0.6 kJ (3)
Electric power can be generated from the product hydrogen in a high temperature fuel
cell. A calcination reaction, driven by excess heat derived from the high temperature fuel cell,
regenerates the CaO from CaCO3 (Eq. 4) and produces a stream of pure CO2 (Yegulalp et al
2000).
CaCO3 + 178.8 kJ CaO + CO2 (4)
Although the ZEC process was designed for coal, a similar process could be conceived
for other hydrocarbon feedstocks such as biomass or solid waste (Figure 11). MSW has a non-
recyclable component comprising roughly 60% of its total, which has been shown to have the
approximate hydrocarbon chemical composition C6H10O4 (Themelis and Kim 2000). The net
exothermic reaction from the simultaneous hydrogasification of this waste supplemented with
calcium oxide can be expressed as:
ZEWTE:
C6H10O4 + 6CaO + 8H2O 6CaCO3 + 13H2 -175 kJ/mol
40
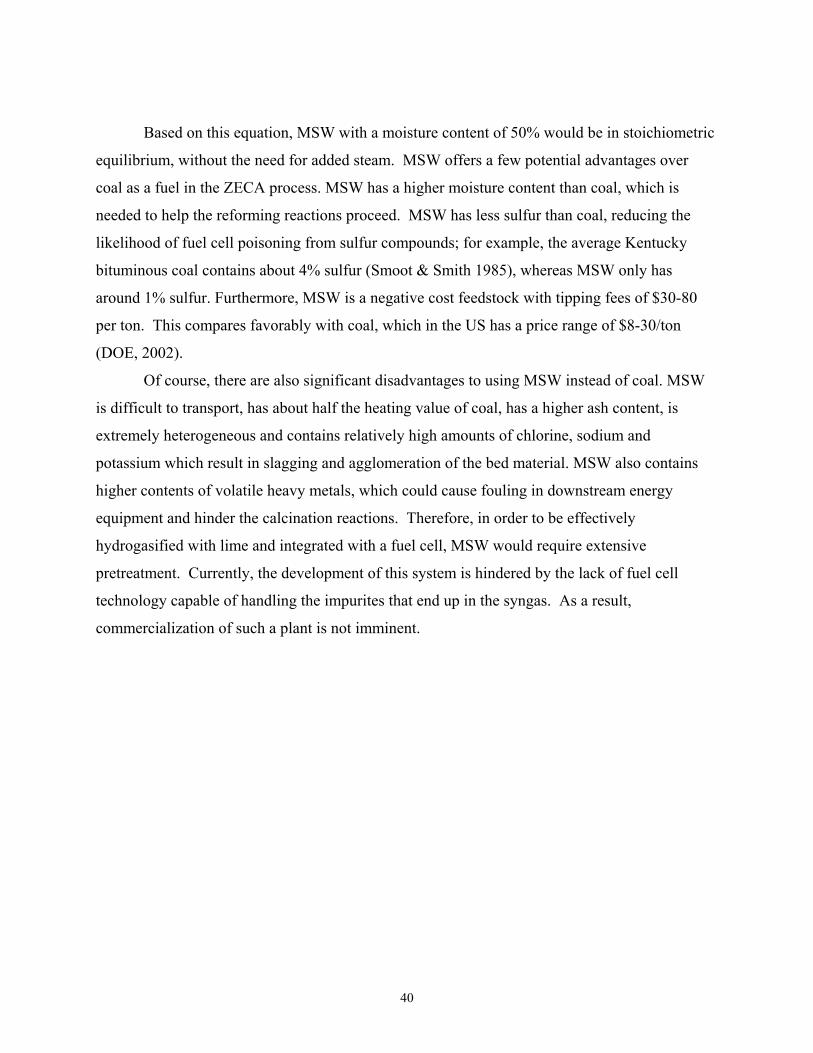
Based on this equation, MSW with a moisture content of 50% would be in stoichiometric
equilibrium, without the need for added steam. MSW offers a few potential advantages over
coal as a fuel in the ZECA process. MSW has a higher moisture content than coal, which is
needed to help the reforming reactions proceed. MSW has less sulfur than coal, reducing the
likelihood of fuel cell poisoning from sulfur compounds; for example, the average Kentucky
bituminous coal contains about 4% sulfur (Smoot & Smith 1985), whereas MSW only has
around 1% sulfur. Furthermore, MSW is a negative cost feedstock with tipping fees of $30-80
per ton. This compares favorably with coal, which in the US has a price range of $8-30/ton
(DOE, 2002).
Of course, there are also significant disadvantages to using MSW instead of coal. MSW
is difficult to transport, has about half the heating value of coal, has a higher ash content, is
extremely heterogeneous and contains relatively high amounts of chlorine, sodium and
potassium which result in slagging and agglomeration of the bed material. MSW also contains
higher contents of volatile heavy metals, which could cause fouling in downstream energy
equipment and hinder the calcination reactions. Therefore, in order to be effectively
hydrogasified with lime and integrated with a fuel cell, MSW would require extensive
pretreatment. Currently, the development of this system is hindered by the lack of fuel cell
technology capable of handling the impurites that end up in the syngas. As a result,
commercialization of such a plant is not imminent.
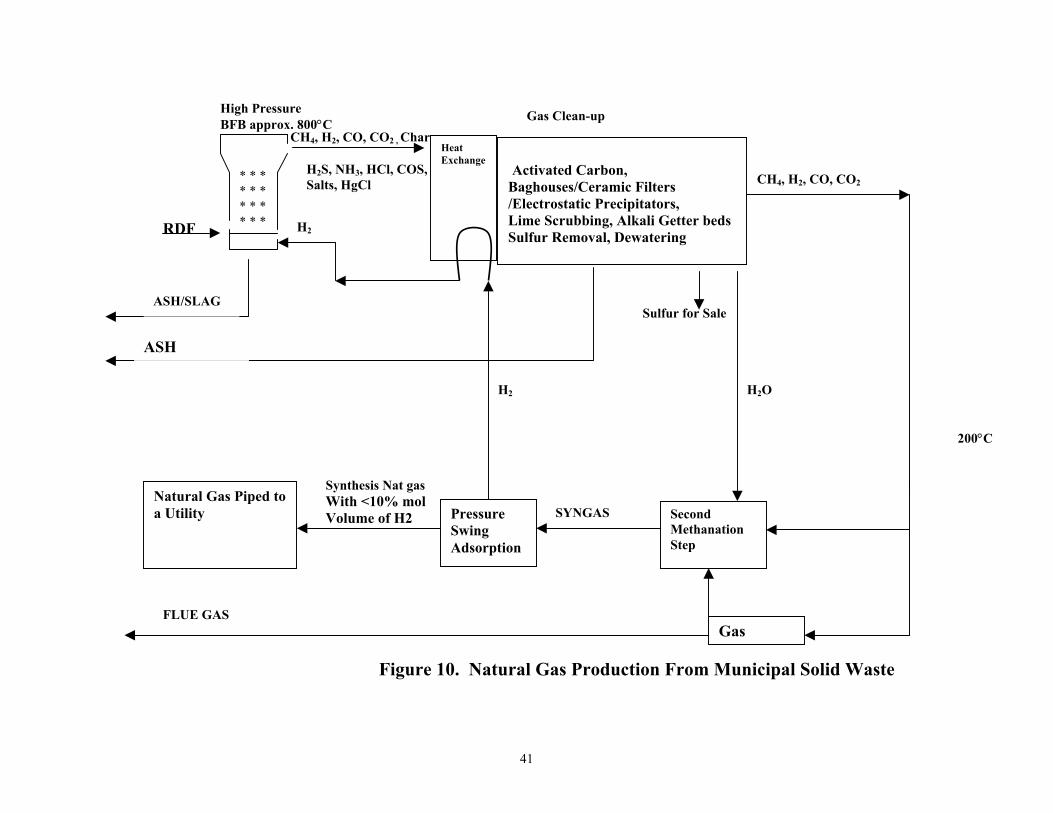
41
ASH/SLAG
CH4, H2, CO, CO2 , Char
H2S, NH3, HCl, COS, Salts, HgCl
Activated Carbon, Baghouses/Ceramic Filters /Electrostatic Precipitators, Lime Scrubbing, Alkali Getter bedsSulfur Removal, Dewatering
Gas Clean-up
ASH
CH4, H2, CO, CO2
RDF
SYNGAS Natural Gas Piped to a Utility
Sulfur for Sale
* * * * * * * * * * * * H2
Gas
Heat Exchange
Second MethanationStep
FLUE GAS
Synthesis Nat gas With <10% mol Volume of H2
High Pressure BFB approx. 800°C
H2O H2
200°C
Gas Clean-up
Figure 10. Natural Gas Production From Municipal Solid Waste
Pressure Swing Adsorption
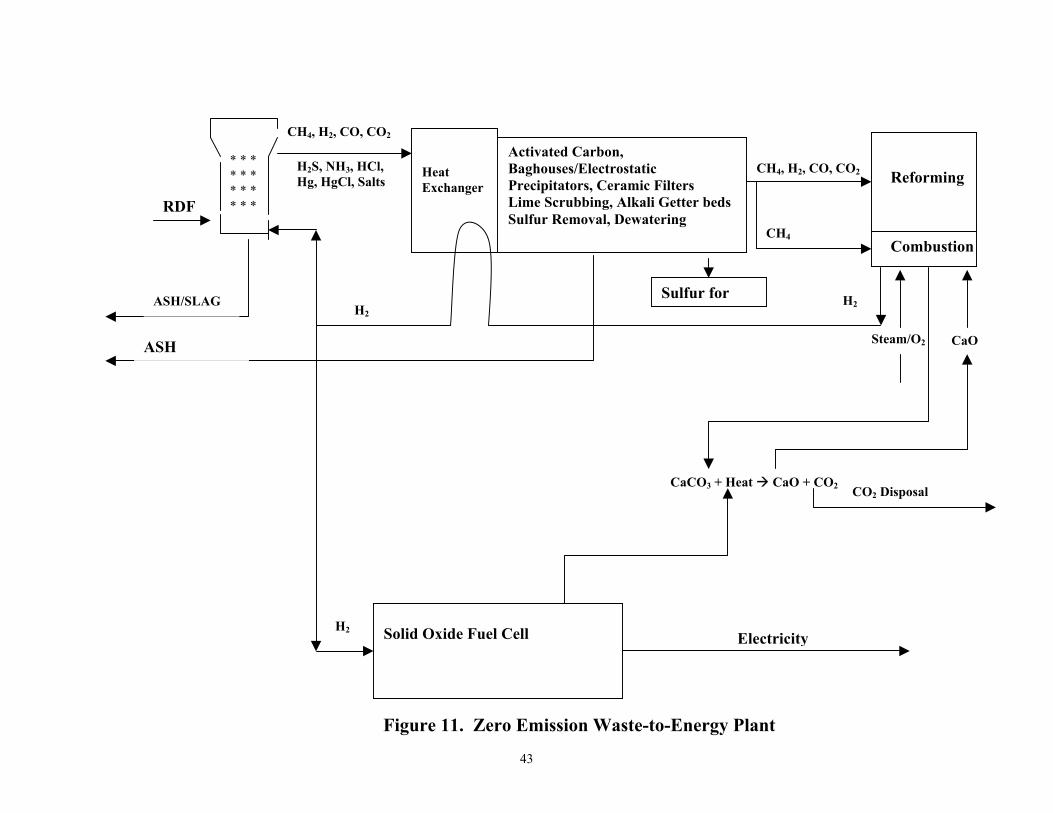
43
ASH/SLAG
CH4, H2, CO, CO2
H2S, NH3, HCl, Hg, HgCl, Salts
Activated Carbon, Baghouses/Electrostatic Precipitators, Ceramic Filters Lime Scrubbing, Alkali Getter bedsSulfur Removal, Dewatering
ASH
CH4, H2, CO, CO2
Steam/O2 CaO
Combustion
CaCO3 + Heat CaO + CO2 CO2 Disposal
Reforming
H2 Solid Oxide Fuel Cell
Electricity
CH4
RDF
Sulfur for
* * * * * * * * * * * *
Heat Exchanger
H2 H2
Figure 11. Zero Emission Waste-to-Energy Plant
44
9.0 Conclusions A solution to the waste problems confronted by municipalities no doubt requires a
strategy that integrates several technologies including, waste reduction, recycling, landfilling and
waste-to-energy. According to the chemical composition of MSW, a maximum of 40% are
paper, plastics, metal and glass suitable for recycling (Life After Fresh Kills, 2001). The
remaining quantity that is not recyclable has a heating value roughly half that of coal. Yet most
of this essentially renewable, negatively priced energy feedstock is transported to landfills,
despite several studies that have shown conclusively that landfilling is the most environmentally
degrading means to treat waste. Waste-to-energy, which converts the non-recyclable and
combustible portion of the waste to electricity, reduces the amount of materials sent to landfills,
prevents air/water contamination, improves recycling rates and lessens the dependence on fossil
fuels for power generation. The two most viable forms of waste-to-energy are combustion and
gasification.
Combustion is a well-established practice, currently handling 36 million tons of MSW
annually in the US and generating electricity that would require the equivalent of 1.6 billion
gallons of fuel oil (Life After Fresh Kills, 2001). If all of the MSW in the US were combusted,
the total energy production would account for close to 3% of the total electricity supply in the
US. During combustion, dioxins (PCDD/PCDFs) form as flue gases leave the primary
combustion chamber and cool to 300-650 °C. Over the past decade, dioxin emissions from U.S.
WTE plants have been greatly reduced from 4000 g/year in 1990 to 400 g/year (i.e. 11 grams per
million tons of MSW combusted, in 1999, IWSA). Nevertheless, strong environmental and
political opposition to any dioxin release remains and has stifled the further expansion of the
industry considerably over the last decade. In NYC, for example, former Mayor Rudolph
Guliani placed a ban on all new waste incinerators within New York City.
One alternative to combustion, as discussed in this paper, is MSW gasification.
Gasification is a process that devolatilizes solid or liquid hydrocarbons, and converts them into a
low or medium BTU gas. Gasification has several distinct advantages over traditional
combustion of MSW. It takes place in a low oxygen environment that limits the formation of
dioxins and large quantities of SOx and NOx. Furthermore, it requires just a fraction of the
stoichiometric amount of oxygen necessary for combustion. As a result, the volume of process
gas is low, requiring smaller and less expensive gas cleaning equipment. The lower gas volume
45
also means a higher partial pressure of contaminants in the off-gas, which will favor more
complete particle condensation and capture according to chemical thermodynamics: ∆G= -
RTln(P0/P1). Gasification also generates a synthesis gas that can be integrated with combined
cycle turbines, reciprocating engines and potentially fuel cells that produce electricity more than
twice as efficiently as conventional steam boilers.
Despite these benefits, there are significant concerns about gasification on a large scale.
The most difficult operational problem results from the formation of heavy organic compounds
referred to as tars. These tars cause significant fouling in downstream gas cleaning processes
and energy conversion devices. As a result, finding cost-effective and thermally efficient gas
cleaning techniques for the remaining syngas constituents that include halogens, acid gases,
volatilized heavy metals and alkaline substances remain difficult.
A comparison of two commercially viable gasification technologies and two combustion
technologies already in operation, indicate that gasification can be an environmentally superior
and cost competitive technology with combustion. Per ton of waste treated, gasification
generates more electricity, has a lower up-front capital cost and is more effective at reducing
pollutants in the flue gas. Yet the high operational costs associated with maintaining
gasification systems result in a slightly higher overall cost per ton of waste treated.
As gasification evolves as an industry there are several key areas that could potentially
reduce capital and operating expenses and further reduce environmental impact. The most
obvious way is to improve removal of the harmful constituents of the synthesis gas. Better
catalysts and system designs that more thoroughly eliminate tars in the product gas will have
several advantages. It will allow more reliability and longer operational ability of gasifiers and
turbines. Furthermore, it will enable high temperature gas clean-up technologies that offer the
benefit of increased chemical to electricity efficiencies, and result in increased energy revenues.
Alternatively, high temperature gas cleaning technologies, such as improved alkali “getter beds”
and more durable filters that can more readily tolerate tars in the product gas stream will also
improve operational efficiencies.
Another area that would increase the viability of waste gasficiation is the improvement of
waste sorting and pre-treatment methods. Processing of raw MSW to a more homogeneous RDF
fuel with a lower non-combustible component permits a decrease in the overall bed air-to-fuel
ratio below the stoichiometric point, lowering the bed temperature. Under these conditions, a
46
very large fraction of the organic refuse component breaks down into volatile components
maximizing energy production. Creating a true RDF cost effectively remains one of the most
difficult tasks in thermochemical conversion of solid waste. It involves a large amount of
mechanical processing and close supervision, which greatly impact operating costs and can
account for as much as 40% of the total plant capital costs. If too much metal and glass are
allowed to pass through into the gasifier, the heating value of the RDF decreases and there can be
constant operational problems and plant shutdowns making the plants costly and unreliable. If
shredding and sorting of the waste can be made simpler and more effective, gasification would
become even more advantageous. Similarly, waste gasification will be most successful in
communities where there is good recycling practice. A better job of recycling glass and food
wastes by city residents will improve the gasification reactions. It should be noted that energy
recovery from waste is not in competition with recycling, but rather its complement in a sound
waste management plan
In the future, gasification with pure oxygen or pure hydrogen (hydrogasification) may
provide better alternatives to the air blown or indirectly heated gasification systems described in
this report. This depends greatly on reducing the costs associated with oxygen and hydrogen
production and improvements in refractory linings in order to handle higher temperatures. Pure
oxygen could be used to generate higher temperatures, and thus promote thermal catalytic
destruction of organics within the fuel gas. Hydrogasification is appealing because it also
effectively cracks tars within the primary gasifying vessel. Hydrogasification also promotes the
formation of a methane rich gas that can be piped to utilities without any modifications to
existing pipelines or gas turbines, and can be reformed into hydrogen or methanol for use with
fuel cells. The advantages and costs of piping CH4 should be further explored in populated areas
where siting and permitting of WTE plants are especially difficult.
Converting Municipal Solid Waste (MSW) to energy has the environmental advantages
of reducing the number of landfills, preventing water/air contamination, and lessening the
dependence on oil and other fossil fuels for power generation. Gasification is a WTE technology
that can be cost competitive with combustion and offers the potential for superior environmental
performance. However, before it can be considered to be a clear-cut solution for waste disposal
in large municipalities, its long-term reliability must be demonstrated.
47
References ASME (2002). “An evaluation of the cost of incinerating wastes containing PVC”. http://www.asme.org/research/imw/wastecost.pdf Babcock and Wilcox (1992), “Steam”, 40th ed. Chapter 16: Atmospheric Pressure Fluidized-Bed Boilers, Babcock and Wilcox, Barberton., OH. Bain, R. Overend, R., Craig, K. (1996), “Biomass-Fired Power Generation”, National Renewable Energy Laboratory, Golden CO. Bridgwater, A.V. and Evans, G.D., 1993, “An assessment of thermochemical systems for processing biomass and refuse”, ETSU B/T1/00207/REP Buekens A., Huang, H. (1998), “Comparative evaluation of techniques for controlling the formation and emission of chlorinated dioxins/furans in municipal solid waste incineration”. Journal of Hazardous Materials. Columbia University (2001). Life After Fresh Kills: Moving Beyond New York City’s Current Waste Management Plan. Policy, Technical and Environmental Considerations. Craig, K., Mann, M. (2002). “Cost and Performance Analysis of Three Integrated Biomass Combined Cycle Power Systems.” National Renewable Energy Laboratory, Golden, CO. Dayton, D.C. (2001) “Fuel Cell Integration – A Study of the Impacts of Gas Quality and Impurities.” National Renewable Energy Laboratory. Golden, CO. NREL/MP-510-30298 Denison, R.A. (1996) “Environmental life-cycle comparisons of recycling, landfilling, and Incineration” Annual Reviews of Energy and Environment, Vol. 21 191-237. ECN Web site (2002). http://www.ecn.nl/phyllis/ Elliott, D.C. (1988). “Relation of Reaction Time and Temperature to Chemical Composition of Pyrolysis Oils,” ACS Symposium Series 376, Pyrolysis Oils from Biomass. EREN (2002). “Gasification Based Biomass” http://www.eren.doe.gov/power/pdfs/bio_gasification.pdf ETIS Web site (1999). “Characterization of Alkali Metal Emission from Fuels and Samples Collected from Fluidized Bed Gasification.” Paper No. FBC99-0125 http://www.etis.net/balpyo/15icfbc/99-0125.PDF
48
Evans, R.J., Milne, T.A (1997). “Chemistry of Tar Formation and Maturation in the Thermochemical Conversion of Biomass.” Developments in Thermochemical Biomass Conversion, Vol. 2. Feldmann, H.F. (1973) “A process for converting solid wastes to pipeline gas.” US Patent 3,3773,187 Fuel Cell Handbook 5th Edition (2000). Report prepared by EG&G Services, Parsons, Inc. and Science Applications International Corporation under contract no. DE-AM26-99FT40575 for the U.S. Department of Energy, National Energy Technology Laboratory, October 2000. Hollenbacher, R.H. (1992). “Biomass Combustion Technologies in the United States,” Biomass Combustion Conference, Reno, Nevada, US DOE Western Regional Bimass energy Program. Integrated Waste Services Association (IWSA) Web Site (2000). www.wte.org Kreith, F. (1994). Handbook of Solid Waste Management. McGraw-Hill, Inc. Korsgren, J.G. et al. (1999). “Characterization of Alkali Metal emission from fuels and samples collected from Fluidized bed gasification.” Proceedings of the15th annual conference on fluidized bed combustion. Savannah, GA. Krigmont, H (1999). “IBGCC power generation concept: A gateway for a cleaner future. Allied Environmental Technologies.” White Paper. http://www.alentecinc.com/papers/IGCC/ADVGASIFICATION.pdf Miles, T.R., et al., Alkali Deposits Found in Biomass Power Plants. (1996) “A preliminary Investigation of Their Extent and Nature.” National Renewable Energy Laboratory, Golden, CO: NREL/TP-433-8142 Milne, T.A., Evans, R.J., (1998). “Biomass Gasifier Tars: Their Nature, Formation, and Conversions.” National Renewable Energy Laboratory, Golden, CO. NREL/TP-570-25357. Miranda, M., Hale, B. (1999). “Re-Covering All the Bases: A Comparison of Landfills and Resource Recovery Facilities in Puerto Rico.” Nickolas School of the Environment, Duke University.
Morris, M. (1998). “Electricity Production from Solid Waste Fuels Using advanced Gasification Technologies.” TPS Termiska Processer AB. www.tps.se
Niessen, W., Markes., C et al. (1996). “Evaluation of Gasification and Novel Thermal Processes for the treatment of Municipal Solid Waste.” National Renewable Energy Laboratory, Golden, CO. NREL/TP-430-21612.
49
Orr, D., Maxwell, D. (2000) “A comparison of gasification and incineration of hazardous wastes.” Radian International, LLC. DCN 99.803931.02. http://www.gasification.org/Radian_20Final_20Report.PDF Reed, T.B., Gaur, S. (1998) “Survey of Biomass Gasification—1998,” Volume 1 Gasifier Projects and Manufacturers around the World, Golden, CO: The National Renewable Energy Laboratory and The Biomass Energy Foundation, Inc. Schultz, H. (2000). “A Bright Future for Renewable Energy Based on Waste.” International Directory of Waste Management. http://www.jxj.com/yearbook/iswa/2000/bright_future_schultz.html Scottish Agricultural Website (2002) http://www.sac.ac.uk/envsci/External/WillowPower/Conversn.htm SCS Engineers. (1992) New York City Waste Composition Study,1989-1990
Smoot., L.D., Smith, P.J., (1985). Coal Combustion and Gasification. Plenum Press, New York.
Spliethoff, H (2001). “Status of Biomass Gasification for Power Production.” IFRF Combustion Journal. Article Number 200109. http://www.journal.ifrf.net/library/november2001/200109spliethoff.pdf
Tchobanoglous, G., Theisen, H., and Vigil, S. (1993) “Integrated Solid Waste Management” Chapter 4, McGraw-Hill, New York.
Themelis, N.J., Kim., Y.H., Brady M.H. (2002). “Energy Recovery from New York City Solid Wastes.” IWSA
Themelis, N.J. , Kim, Y.H (2002) “Energy & Material Balances in a large-scale aerobic bioconversion.”
Themelis, N.J., Gregory, A.F. (2001). “Sources and Material Balance of Mercury in the New York-New Jersey Harbor.” Report to the NY Academy of Sciences.
Uil, H., Mozafarrian, M., et. al. (2000) “New and Advanced Processes for Biomass Gasification.” Netherlands Energy Research Foundation (ECN). http://www.ket.kth.se/rolando/paper/22_denUil.pdf
Yegulalp, T.M., Lackner, K.S., Ziock., H.J. (2000) “A review of emerging technologies for sustainable us of coal for power generation.” Environmental Issues and Management of Waste in Energy and Mineral Production.
Zevenhoven and Kilpenin. (2001) “Trace Elements, Alkali Metals.” Chapter 8. http://www.hut.fi/~rzevenho/tracalk.PDF

50