fy2013 financial results - brp
TRANSCRIPT
BRP Inc. - FY14 Q1 1
June 13, 2013
BRP Inc.
Fiscal 2014 Q1 Update
BRP Inc. - FY14 Q1 2
Forward-Looking Statements
Certain statements in this presentation about the Company’s current and future plans, expectations and intentions, results, levels of activity,
performance, goals or achievements or any other future events or developments constitute forward-looking statements. The words “may”, “will”,
“would”, “should”, “could”, “expects”, “plans”, “intends”, “trends”, “indications”, “anticipates”, “believes”, “estimates”, “predicts”, “likely” or
“potential” or the negative or other variations of these words or other comparable words or phrases, are intended to identify forward-looking
statements.
Forward-looking statements are based on estimates and assumptions made by the Company in light of its experience and perception of historical
trends, current conditions and expected future developments, as well as other factors that the Company believes are appropriate and reasonable in
the circumstances, but there can be no assurance that such estimates and assumptions will prove to be correct. Many factors could cause the
Company’s actual results, level of activity, performance or achievements or future events or developments to differ materially from those
expressed or implied by the forward-looking statements, including, without limitation, the following factors, which are discussed in greater detail in
the “Risk Factors” section of the Supplemented PREP Prospectus dated May 21, 2013: impact of adverse economic conditions on consumer
spending; decline in social acceptability of the Company’s products; fluctuations in foreign currency exchange rates; high levels of indebtedness;
unavailability of additional capital; unfavourable weather conditions; seasonal sales fluctuations; the Company’s ability to comply with product
safety, health, environmental and noise pollution laws; dependence on dealers, suppliers, financing sources and other strategic partners who may
be sensitive to economic conditions; large fixed cost base; inability of dealers and distributors to secure adequate access to capital; supply
problems, termination or interruption of supply arrangements or increases in the cost of materials; restrictive covenants in the Company’s
financing and other material agreements; competition in product lines; loss of members of management team or employees who possess
specialized market knowledge and technical skills; inability to maintain and enhance reputation and brands; adverse determination in any
significant product liability claim against the Company; significant product repair and/or replacement due to product warranty claims or product
recalls; reliance on a network of independent dealers and distributors to manage the retail distribution of products; dependence on customer
relationships for the sale of original equipment manufacturer products; unsuccessful management of inventory; risks associated with international
operations; inability to enhance existing products and develop and market new products; protection of intellectual property; failure of information
technology systems; declining prices for used versions of products and oversupply by competitors; unsuccessful execution of manufacturing
strategy; actual results may differ from financial outlook; changes in tax laws and unanticipated tax liabilities; higher fuel costs; deterioration in
relationships with employees; pension plan liabilities; natural disasters; failure to carry proper insurance coverage; no prior public market for
subordinate voting shares; volatile market price for subordinate voting shares; no current plans to pay dividends; public company expenses;
conduct of business through subsidiaries; significant influence by principal shareholders; and future sales of shares by principal shareholders,
directors, officers or senior management of the Company.
The purpose of the forward-looking statements is to provide the reader with a description of management’s expectations regarding the Company’s
financial performance and may not be appropriate for other purposes; readers should not place undue reliance on forward-looking statements
made herein. Furthermore, unless otherwise stated, the forward-looking statements contained in this presentation are made as of the date of this
presentation, and the Company has no intention and undertakes no obligation to update or revise any forward-looking statements, whether as a
result of new information, future events or otherwise, except as required by applicable securities regulations. The forward-looking statements
contained in this presentation are expressly qualified by this cautionary statement.
BRP Inc. - FY14 Q1 3
BRP Inc.
Fiscal 2014 Q1 Update
José Boisjoli PRESIDENT & CEO
BRP Inc. - FY14 Q1 4
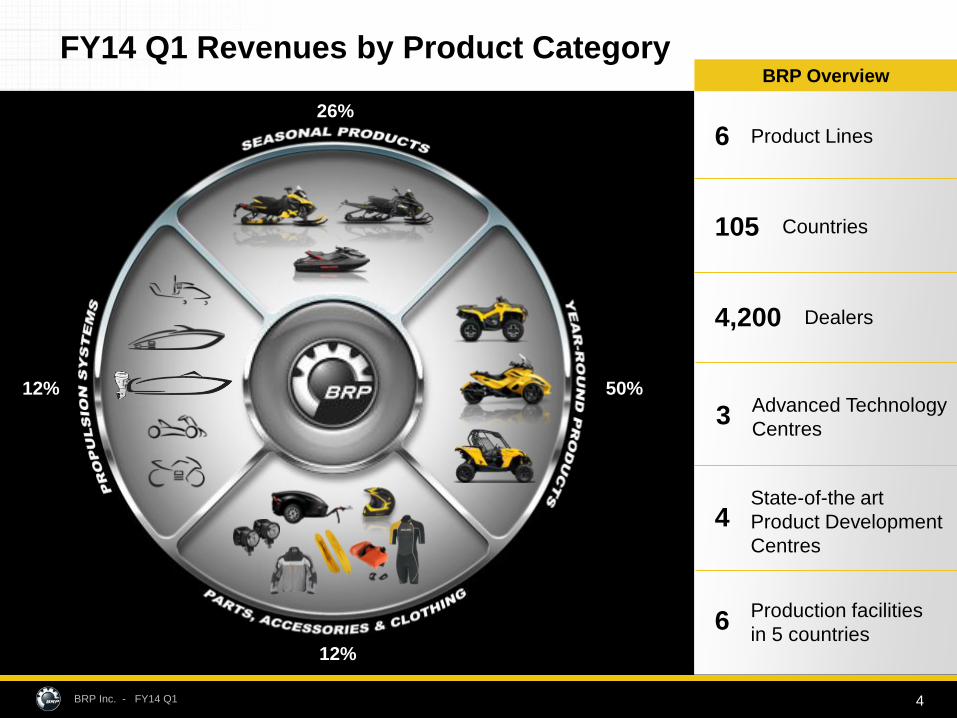
26%
12%
12% 50%
FY14 Q1 Revenues by Product Category
4,200 Dealers
105 Countries
6 Product Lines
4 State-of-the art
Product Development
Centres
6 Production facilities
in 5 countries
3 Advanced Technology
Centres
BRP Overview
BRP Inc. - FY14 Q1 5
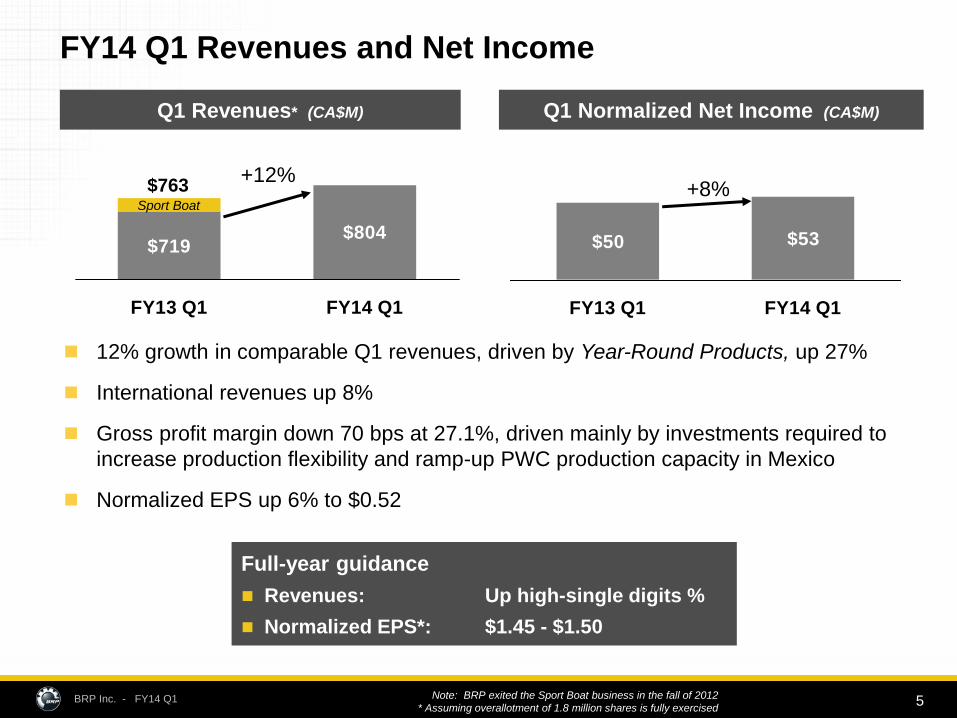
FY14 Q1 Revenues and Net Income
$804$719
FY13 Q1 FY14 Q1
$50 $53
FY13 Q1 FY14 Q1
Q1 Revenues* (CA$M) Q1 Normalized Net Income (CA$M)
+12% +8%
12% growth in comparable Q1 revenues, driven by Year-Round Products, up 27%
International revenues up 8%
Gross profit margin down 70 bps at 27.1%, driven mainly by investments required to
increase production flexibility and ramp-up PWC production capacity in Mexico
Normalized EPS up 6% to $0.52
Full-year guidance
Revenues: Up high-single digits %
Normalized EPS*: $1.45 - $1.50
$763 Sport Boat
Note: BRP exited the Sport Boat business in the fall of 2012
* Assuming overallotment of 1.8 million shares is fully exercised
BRP Inc. - FY14 Q1 6
FY14 Q1 Business Highlights
Ended the snowmobile season with low dealer inventory worldwide and strong
dealer orders for Model Year 14 (MY14)
Industry retail sales of Personal Watercraft (PWC), Motorcycles and Outboard
Engines (OE) were impacted by abnormally low temperatures
Despite spring weather impact, BRP Q1 N.A. retail sales of Seasonal and
Year-Round products were up 6% overall
Double digit retail growth for Can-Am Recreational Side-by-Side Vehicles
(SSV) and Roadsters
First deliveries of Maverick SSV in Q1 and very good sell-through at
dealerships
Construction of our second Mexican site, in Queretaro, is on schedule
North America dealer network expansion going as planned
Subsequent to April 30, successfully completed IPO and repaid US$258M of
Term Facility
BRP Inc. - FY14 Q1 7
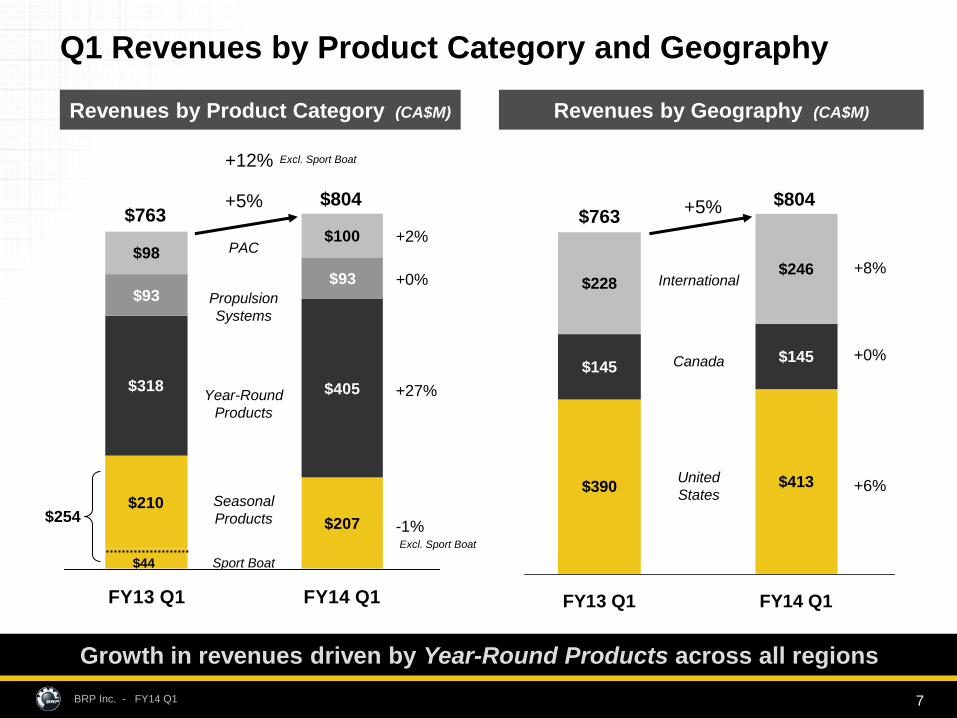
Q1 Revenues by Product Category and Geography
$210
$207
$318 $405
$93$93
$98$100
FY13 Q1 FY14 Q1
Revenues by Product Category (CA$M) Revenues by Geography (CA$M)
Seasonal
Products
Year-Round
Products
Propulsion
Systems
PAC
$763 $804
-1%
+27%
+0%
+2%
+12%
$390 $413
$145$145
$228$246
FY13 Q1 FY14 Q1
United
States
Canada
International
$763 $804
+6%
+0%
+8%
Growth in revenues driven by Year-Round Products across all regions
Sport Boat
Excl. Sport Boat
+5% +5%
$44
$254
Excl. Sport Boat
BRP Inc. - FY14 Q1 8
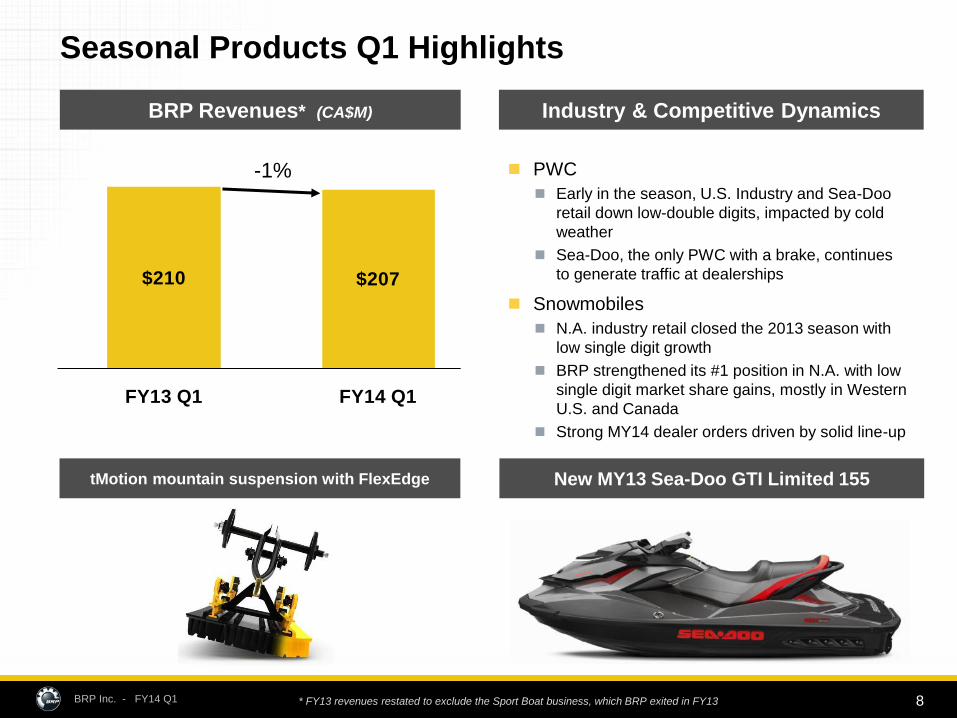
Seasonal Products Q1 Highlights
BRP Revenues* (CA$M) Industry & Competitive Dynamics
PWC
Early in the season, U.S. Industry and Sea-Doo
retail down low-double digits, impacted by cold
weather
Sea-Doo, the only PWC with a brake, continues
to generate traffic at dealerships
Snowmobiles
N.A. industry retail closed the 2013 season with
low single digit growth
BRP strengthened its #1 position in N.A. with low
single digit market share gains, mostly in Western
U.S. and Canada
Strong MY14 dealer orders driven by solid line-up
tMotion mountain suspension with FlexEdge New MY13 Sea-Doo GTI Limited 155
$210 $207
FY13 Q1 FY14 Q1
-1%
* FY13 revenues restated to exclude the Sport Boat business, which BRP exited in FY13
BRP Inc. - FY14 Q1 9
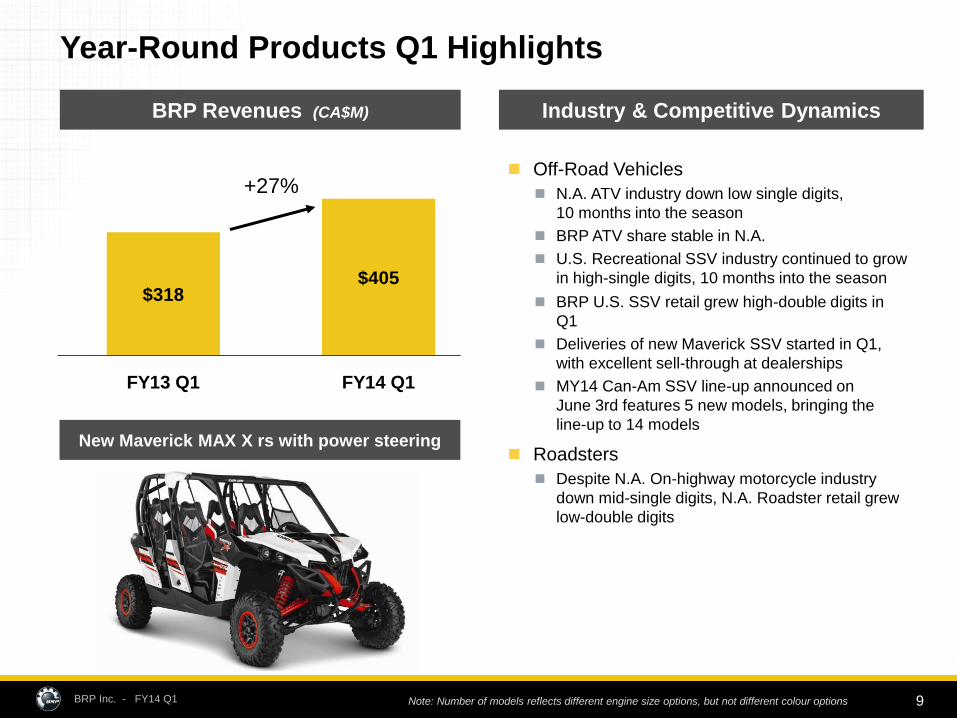
Year-Round Products Q1 Highlights
$318$405
FY13 Q1 FY14 Q1
BRP Revenues (CA$M) Industry & Competitive Dynamics
+27% Off-Road Vehicles
N.A. ATV industry down low single digits,
10 months into the season
BRP ATV share stable in N.A.
U.S. Recreational SSV industry continued to grow
in high-single digits, 10 months into the season
BRP U.S. SSV retail grew high-double digits in
Q1
Deliveries of new Maverick SSV started in Q1,
with excellent sell-through at dealerships
MY14 Can-Am SSV line-up announced on
June 3rd features 5 new models, bringing the
line-up to 14 models
Roadsters
Despite N.A. On-highway motorcycle industry
down mid-single digits, N.A. Roadster retail grew
low-double digits
New Maverick MAX X rs with power steering
Note: Number of models reflects different engine size options, but not different colour options
BRP Inc. - FY14 Q1 10
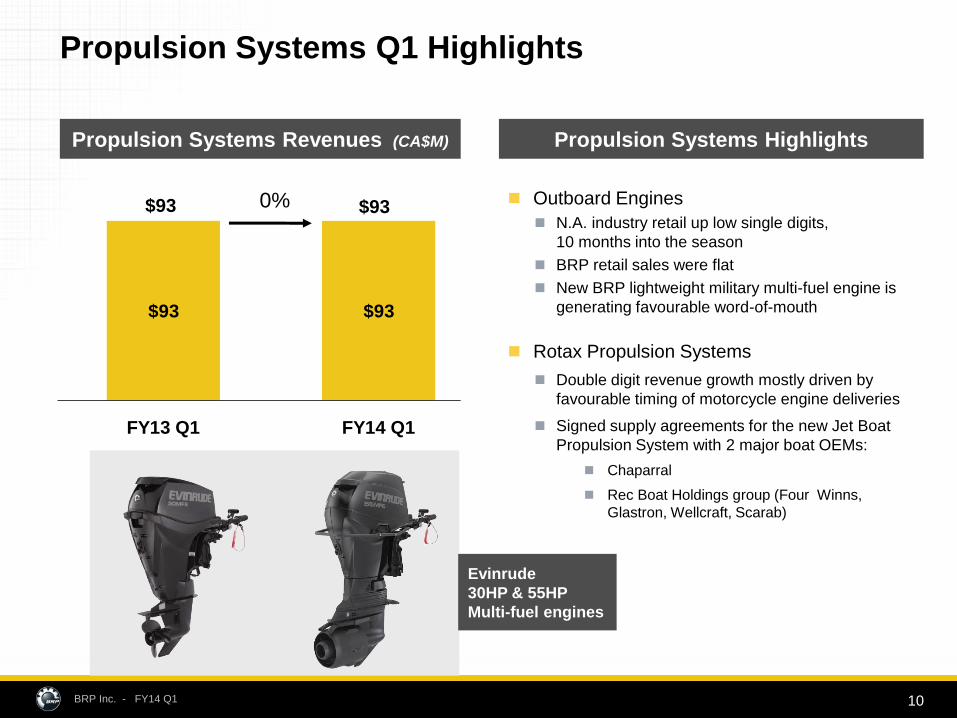
Propulsion Systems Q1 Highlights
$93 $93
FY13 Q1 FY14 Q1
Propulsion Systems Revenues (CA$M) Propulsion Systems Highlights
$93 $93 Outboard Engines
N.A. industry retail up low single digits,
10 months into the season
BRP retail sales were flat
New BRP lightweight military multi-fuel engine is
generating favourable word-of-mouth
Rotax Propulsion Systems
Double digit revenue growth mostly driven by
favourable timing of motorcycle engine deliveries
Signed supply agreements for the new Jet Boat
Propulsion System with 2 major boat OEMs:
Chaparral
Rec Boat Holdings group (Four Winns,
Glastron, Wellcraft, Scarab)
Evinrude
30HP & 55HP
Multi-fuel engines
0%
BRP Inc. - FY14 Q1 11
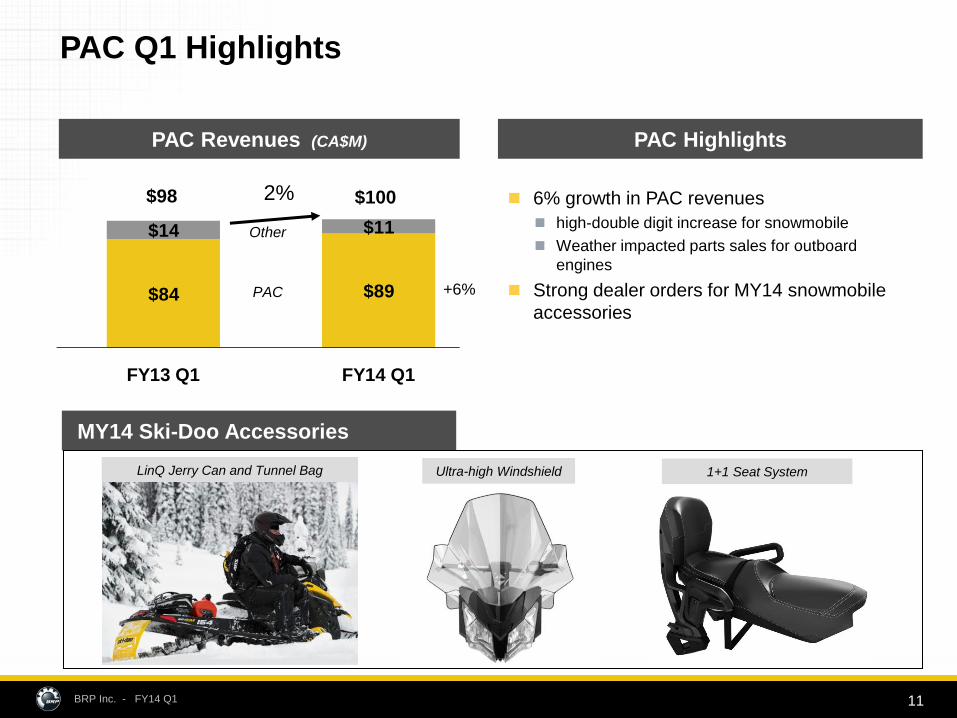
PAC Q1 Highlights
$84 $89
$14 $11
FY13 Q1 FY14 Q1
PAC Revenues (CA$M) PAC Highlights
6% growth in PAC revenues
high-double digit increase for snowmobile
Weather impacted parts sales for outboard
engines
Strong dealer orders for MY14 snowmobile
accessories
MY14 Ski-Doo Accessories
PAC
Other
$98 $100 2%
+6%
1+1 Seat System Ultra-high Windshield LinQ Jerry Can and Tunnel Bag
BRP Inc. - FY14 Q1 12
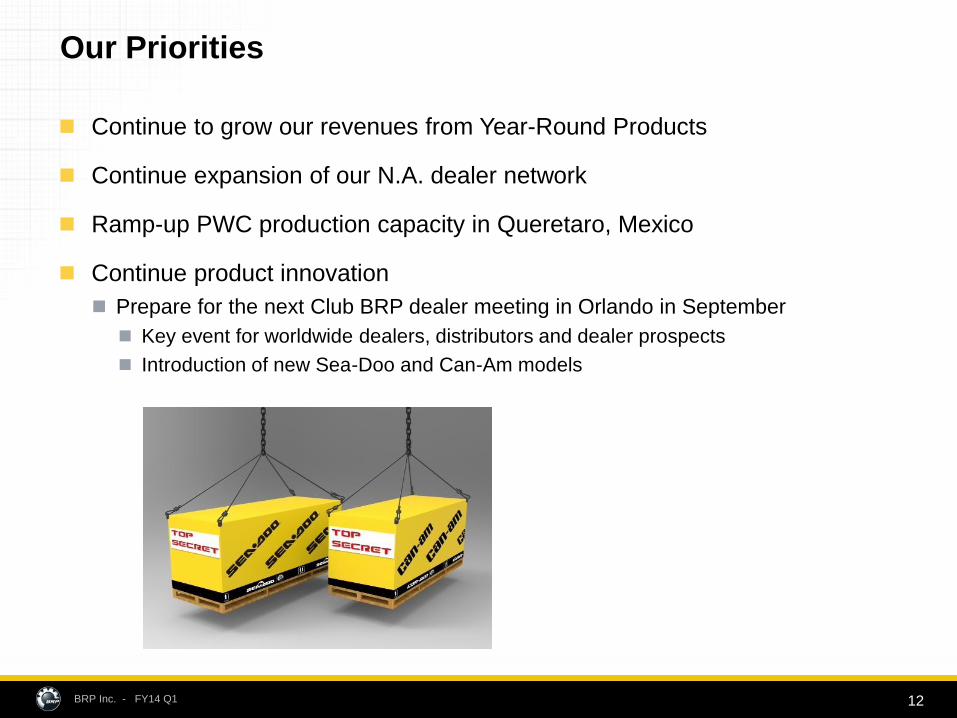
Our Priorities
Continue to grow our revenues from Year-Round Products
Continue expansion of our N.A. dealer network
Ramp-up PWC production capacity in Queretaro, Mexico
Continue product innovation
Prepare for the next Club BRP dealer meeting in Orlando in September
Key event for worldwide dealers, distributors and dealer prospects
Introduction of new Sea-Doo and Can-Am models
BRP Inc. - FY14 Q1 13
BRP Inc.
Fiscal 2014 Q1 Update
Claude Ferland CHIEF FINANCIAL OFFICER
BRP Inc. - FY14 Q1 14
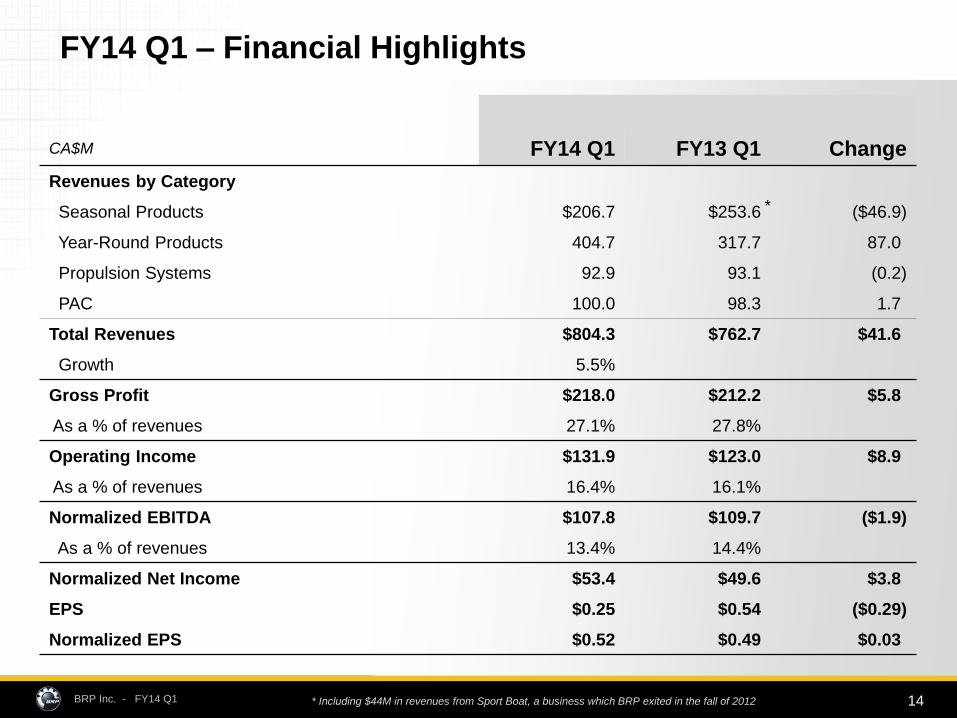
FY14 Q1 – Financial Highlights
CA$M FY14 Q1 FY13 Q1 Change
Revenues by Category
Seasonal Products $206.7 $253.6 ($46.9)
Year-Round Products 404.7 317.7 87.0
Propulsion Systems 92.9 93.1 (0.2)
PAC 100.0 98.3 1.7
Total Revenues $804.3 $762.7 $41.6
Growth 5.5%
Gross Profit $218.0 $212.2 $5.8
As a % of revenues 27.1% 27.8%
Operating Income $131.9 $123.0 $8.9
As a % of revenues 16.4% 16.1%
Normalized EBITDA $107.8 $109.7 ($1.9)
As a % of revenues 13.4% 14.4%
Normalized Net Income $53.4 $49.6 $3.8
EPS $0.25 $0.54 ($0.29)
Normalized EPS $0.52 $0.49 $0.03
* Including $44M in revenues from Sport Boat, a business which BRP exited in the fall of 2012
*
BRP Inc. - FY14 Q1 15
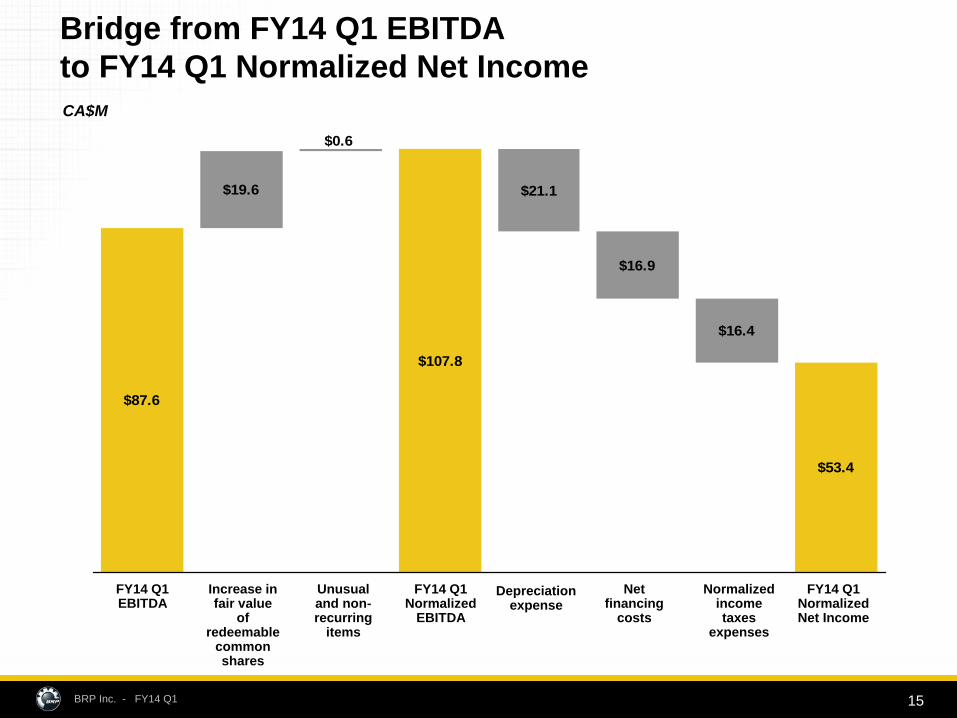
Bridge from FY14 Q1 EBITDA
to FY14 Q1 Normalized Net Income
CA$M
$87.6
$107.8
$53.4
$19.6 $21.1
$16.9
$16.4
$0.6
EBITDA Fair value Non-rec Norm EBITDA Depreciation Fin cost Inc tax adj Norm N IncFY14 Q1 EBITDA
Increase in fair value
of redeemable
common shares
Unusual and non-recurring
items
FY14 Q1 Normalized
EBITDA
Depreciation expense
Net financing
costs
Normalizedincome taxes
expenses
FY14 Q1 Normalized Net Income
BRP Inc. - FY14 Q1 16
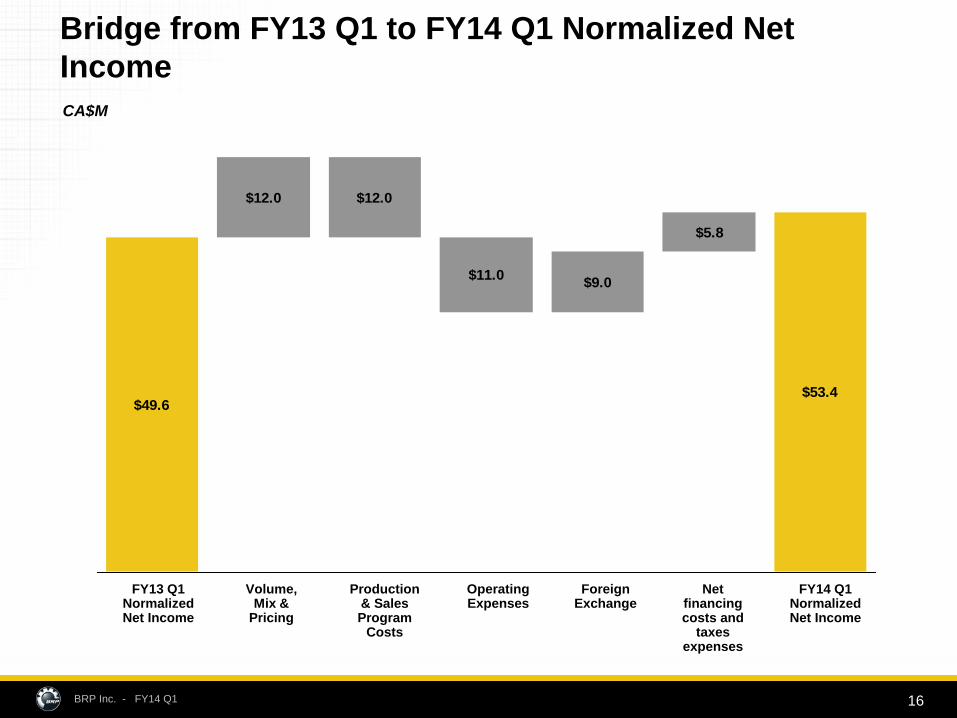
Bridge from FY13 Q1 to FY14 Q1 Normalized Net
Income
$49.6$53.4
$12.0 $12.0
$11.0$9.0
$5.8
FY13 VMP Prod costs Opex FX Others FY14FY13 Q1 Normalized Net Income
Volume, Mix &
Pricing
Production & Sales Program
Costs
Operating Expenses
Foreign Exchange
Net financing costs and
taxes expenses
FY14 Q1 Normalized Net Income
CA$M
BRP Inc. - FY14 Q1 17
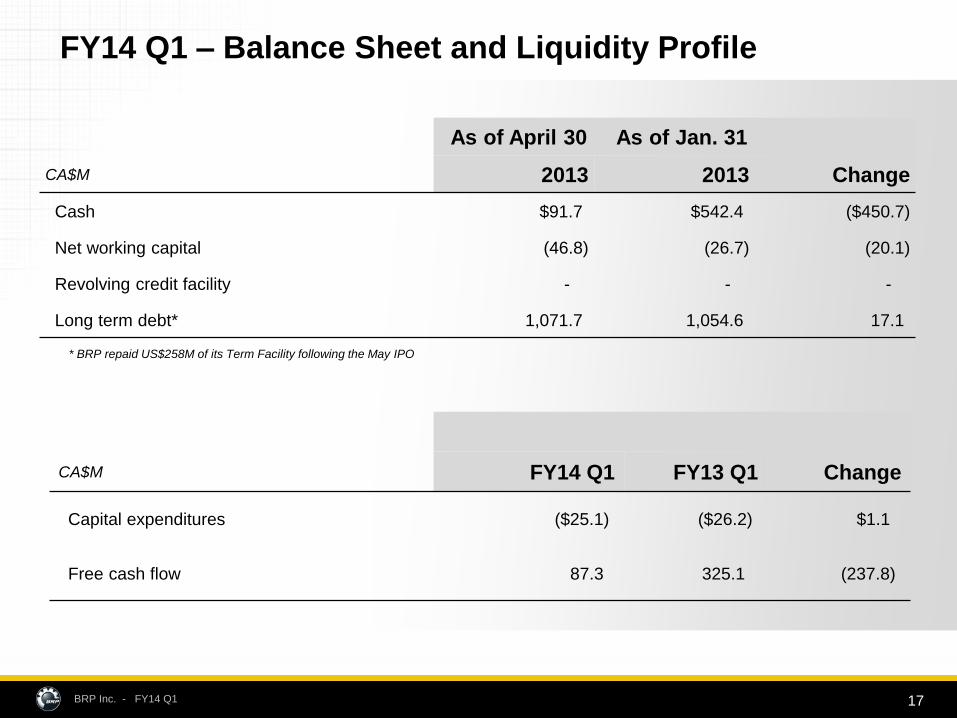
FY14 Q1 – Balance Sheet and Liquidity Profile
As of April 30 As of Jan. 31
CA$M 2013 2013 Change
Cash $91.7 $542.4 ($450.7)
Net working capital (46.8) (26.7) (20.1)
Revolving credit facility - - -
Long term debt* 1,071.7 1,054.6 17.1
* BRP repaid US$258M of its Term Facility following the May IPO
CA$M FY14 Q1 FY13 Q1 Change
Capital expenditures ($25.1) ($26.2) $1.1
Free cash flow 87.3 325.1 (237.8)
BRP Inc. - FY14 Q1 18
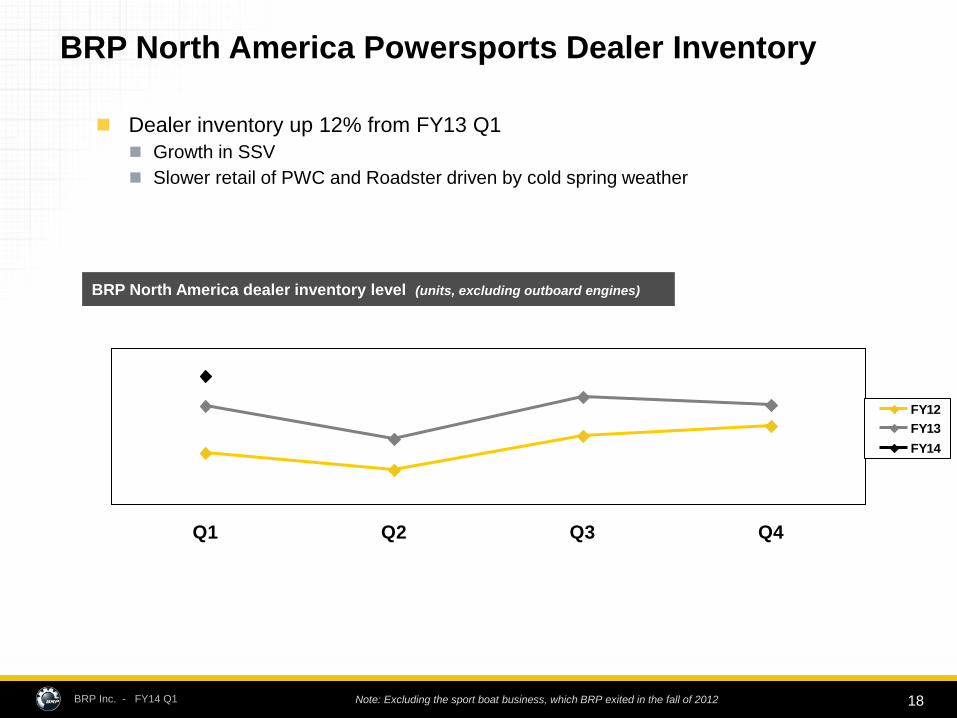
BRP North America Powersports Dealer Inventory
Dealer inventory up 12% from FY13 Q1
Growth in SSV
Slower retail of PWC and Roadster driven by cold spring weather
Q1 Q2 Q3 Q4
FY12
FY13
FY14
BRP North America dealer inventory level (units, excluding outboard engines)
Note: Excluding the sport boat business, which BRP exited in the fall of 2012
BRP Inc. - FY14 Q1 19
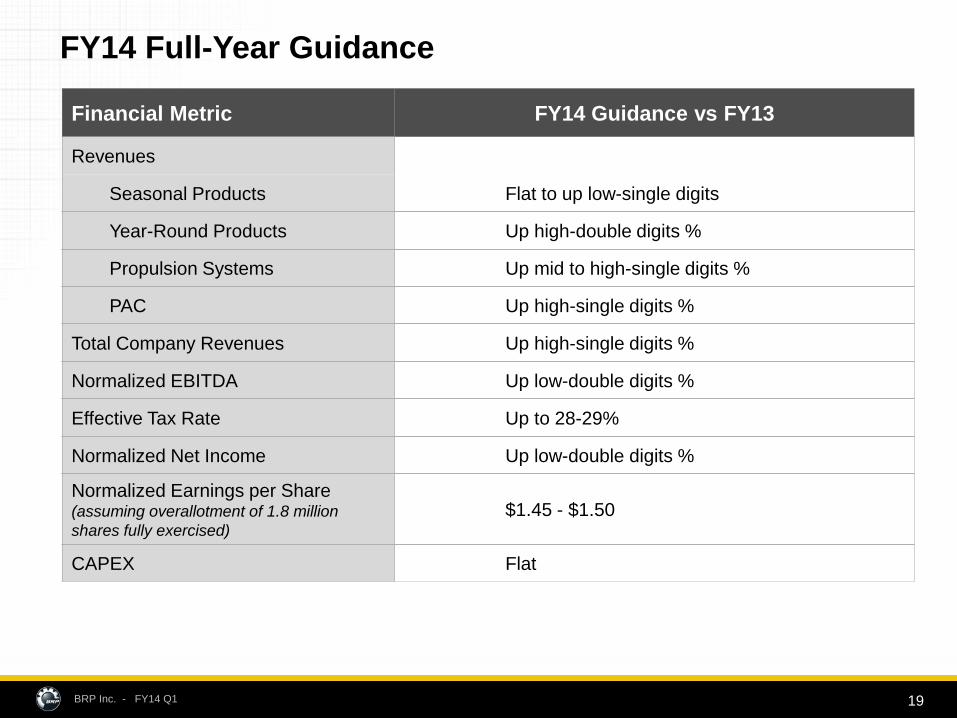
FY14 Full-Year Guidance
Financial Metric FY14 Guidance vs FY13
Revenues
Seasonal Products Flat to up low-single digits
Year-Round Products Up high-double digits %
Propulsion Systems Up mid to high-single digits %
PAC Up high-single digits %
Total Company Revenues Up high-single digits %
Normalized EBITDA Up low-double digits %
Effective Tax Rate Up to 28-29%
Normalized Net Income Up low-double digits %
Normalized Earnings per Share (assuming overallotment of 1.8 million
shares fully exercised)
$1.45 - $1.50
CAPEX Flat
BRP Inc. - FY14 Q1 20
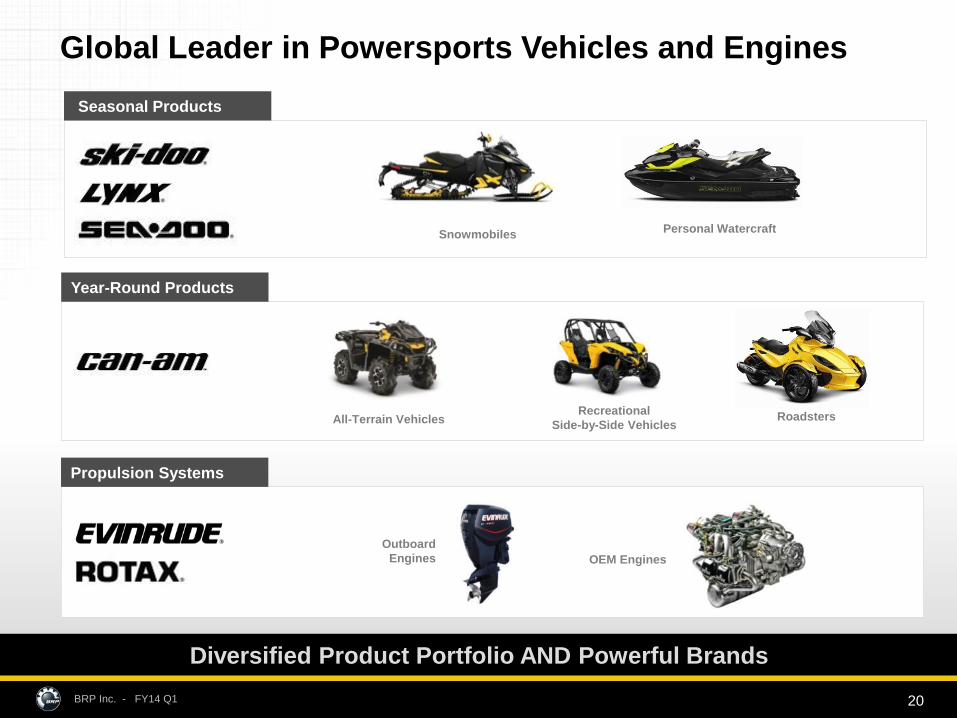
Global Leader in Powersports Vehicles and Engines
Outboard
Engines
OEM Engines
Propulsion Systems
Snowmobiles
Seasonal Products
Personal Watercraft
Year-Round Products
All-Terrain Vehicles Recreational
Side-by-Side Vehicles Roadsters
Diversified Product Portfolio AND Powerful Brands

BRP Inc. - FY14 Q1 21