fy2004 consolidated financial results for the year …€¦ · fy2004 consolidated financial...
TRANSCRIPT
FY2004 Consolidated Financial Results For the Year Ended March 31, 2005
English Translation from the Original Japanese-Language DocumentApril 28, 2005
Company Name : Mazda Motor Corporation (Headquartered in Hiroshima, Japan/Tokyo Stock Exchange/Code No. 7261)URL : http://www.mazda.co.jpRepresentative Person : Hisakazu Imaki, Representative Director, President and CEOContact Person : Tetsuya Fujimoto, General Manager, Accounting Department, Phone (082) 282-1111BOD Meeting : Meeting of the board of directors for consolidated account settlement held on April 28, 2005Parent Company, etc. : Mazda has no parent company. Ford Motor Company owns 33.7% voting interest of Mazda.US GAAP Adoption : The United States generally accepted accounting principles not adopted
1. Consolidated Financial Highlights (April 1, 2004 through March 31, 2005) (1) Consolidated Financial Results
(in Japanese yen rounded to millions, except amounts per share)Sales Operating Income/(Loss) Ordinary Income/(Loss)
million yen % million yen % million yen %
FY2004 2,695,564 (7.6) 82,947 18.2 73,056 25.9 FY2003 2,916,130 23.3 70,174 38.5 58,029 42.5
Net Income/(Loss) Net Income/(Loss) Ordinary Income Ordinary IncomeNet Income/(Loss) per Share per Share (Diluted) Return on Equity to Total Assets to Sales
million yen % yen yen % % %
FY2004 45,772 35.0 37.63 32.41 18.7 4.1 2.7 FY2003 33,901 40.5 27.84 23.98 16.3 3.3 2.0Notes: 1) Equity in net income of unconsolidated subsidiaries and affiliated companies FY2004 9,963 million yen
FY2003 9,199 million yen 2) Average number of shares outstanding (on a consolidated basis) FY2004 1,216,245,150 shares
FY2003 1,217,692,196 shares 3) Accounting change: None.
the fiscal year-end.
(2) Consolidated Financial PositionTotal Assets Shareholders' Equity Equity Ratio Equity per Share
million yen million yen % Yen
FY2004 15.1 220.22FY2003 12.4 182.91Notes: Number of shares issued and outstanding at year end (on a consolidated basis): FY2004 1,216,130,686 shares
FY2003 1,217,013,683 shares
(3) Consolidated Cash FlowsCash Flows from Cash Flows from Cash Flows from Ending Cash &
Operating Activities Investing Activities Financing Activities Cash Equivalentsmillion yen million yen million yen million yen
FY2004 133,735 (97,835) (96,124) 214,639FY2003 92,379 (43,251) (52,794) 272,231
(4) Scope of Consolidation and Equity Method Consolidated subsidiaries 53 companies Unconsolidated subsidiaries accounted for by the equity method 0 companies Affiliates accounted for by the equity method 12 companies
(5) Changes in Scope of Consolidation and Equity Method Consolidation (Addition) 1 company Equity method (Addition) 1 company (Exclusion) 3 companies (Exclusion) 1 company
2. FY2005 Consolidated Financial Forecast (April 1, 2005 through March 31, 2006)Net Sales Ordinary Income/(Loss) Net Income/(Loss)
million yen million yen million yen
Full YearReference: Net income per share for the full year 45.23 yen The financial projection is the judgment of our management based on the information presently available. By nature, such financial projection is subject to uncertainty and a risk. Therefore, we advise against making an investment decision by solely relying on this projection. Variables thatcould affect the actual financial results include, but are not limited to, economic environments related to our business areas and fluctuations inyen-to-dollar and other exchange rates. For further information on the above financial projection, please refer to page 9 of Supplementary Information.
82,000 55,000
4) Changes in sales, operating income, ordinary income, and net income from the previous period are shown in percentage.
1,767,8461,795,573
267,815222,605
5) Consolidated financial results for FY2003 include 15 months of operations for those consolidated overseas subsidiaries that changed
2,840,000
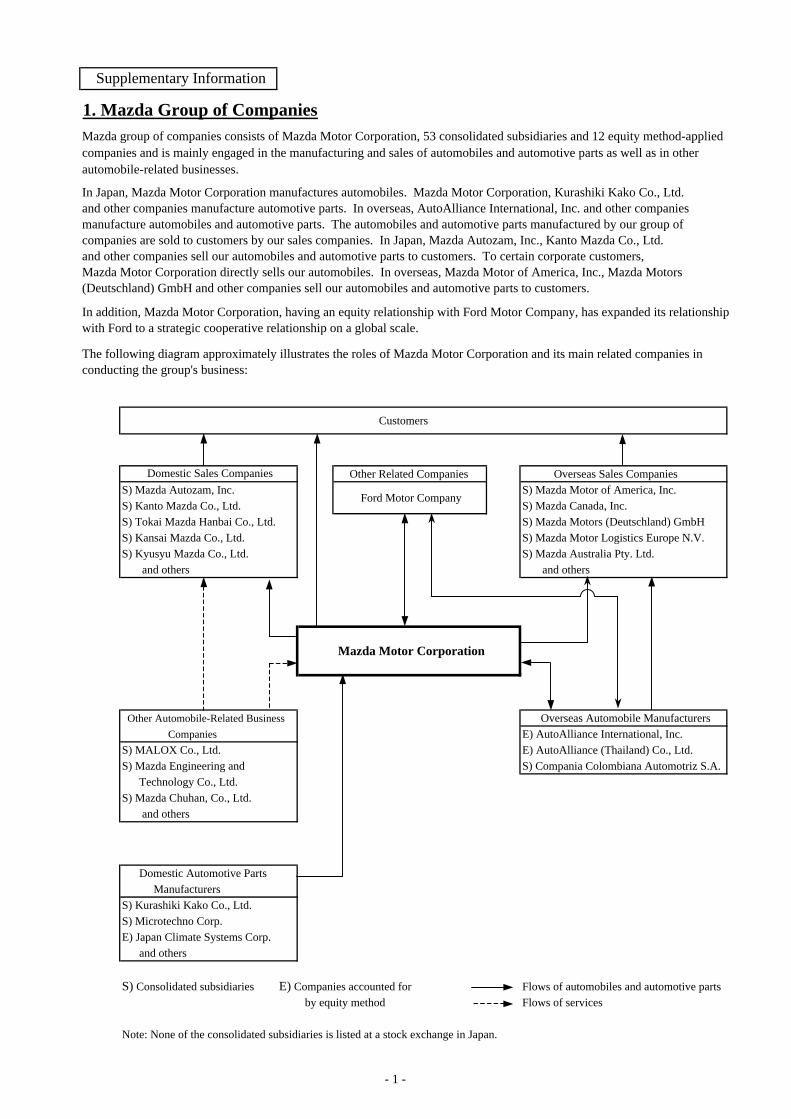
1. Mazda Group of CompaniesMazda group of companies consists of Mazda Motor Corporation, 53 consolidated subsidiaries and 12 equity method-appliedcompanies and is mainly engaged in the manufacturing and sales of automobiles and automotive parts as well as in otherautomobile-related businesses.
In Japan, Mazda Motor Corporation manufactures automobiles. Mazda Motor Corporation, Kurashiki Kako Co., Ltd.and other companies manufacture automotive parts. In overseas, AutoAlliance International, Inc. and other companiesmanufacture automobiles and automotive parts. The automobiles and automotive parts manufactured by our group of companies are sold to customers by our sales companies. In Japan, Mazda Autozam, Inc., Kanto Mazda Co., Ltd.and other companies sell our automobiles and automotive parts to customers. To certain corporate customers, Mazda Motor Corporation directly sells our automobiles. In overseas, Mazda Motor of America, Inc., Mazda Motors (Deutschland) GmbH and other companies sell our automobiles and automotive parts to customers.
In addition, Mazda Motor Corporation, having an equity relationship with Ford Motor Company, has expanded its relationshipwith Ford to a strategic cooperative relationship on a global scale.
The following diagram approximately illustrates the roles of Mazda Motor Corporation and its main related companies in conducting the group's business:
Customers
Other Related Companies Overseas Sales CompaniesS) Mazda Autozam, Inc. S) Mazda Motor of America, Inc. S) Kanto Mazda Co., Ltd. S) Mazda Canada, Inc. S) Tokai Mazda Hanbai Co., Ltd. S) Mazda Motors (Deutschland) GmbHS) Kansai Mazda Co., Ltd. S) Mazda Motor Logistics Europe N.V.S) Kyusyu Mazda Co., Ltd. S) Mazda Australia Pty. Ltd. and others and others
Mazda Motor Corporation
Other Automobile-Related Business Overseas Automobile Manufacturers Companies E) AutoAlliance International, Inc.S) MALOX Co., Ltd. E) AutoAlliance (Thailand) Co., Ltd. S) Mazda Engineering and S) Compania Colombiana Automotriz S.A. Technology Co., Ltd.S) Mazda Chuhan, Co., Ltd. and others
Domestic Automotive Parts ManufacturersS) Kurashiki Kako Co., Ltd. S) Microtechno Corp. E) Japan Climate Systems Corp. and others S) Consolidated subsidiaries E) Companies accounted for Flows of automobiles and automotive parts
by equity method Flows of services
Note: None of the consolidated subsidiaries is listed at a stock exchange in Japan.
Domestic Sales Companies
Supplementary Information
Ford Motor Company
- 1 -
- 2 -
2. Management Policy 1) Our Corporate Vision, Mission and Values
Mazda’s Corporate Vision is comprised of a “Vision” (corporate objectives) along with a statement of “Mission” (roles and responsibilities) and “Value” (the values Mazda seeks to produce). These principles are helping express the ways in which Mazda and Mazda’s employees understand their roles and responsibilities as they press towards the achievement of these aims. Through the realization of this Corporate Vision, we aim to consistently augment corporate value, which we view as being closely linked to securing profits for our shareholders. Vision : To create new value, excite and delight our customers through the best automotive products
and services. Mission : With passion, pride and speed, we actively communicate with our customers to deliver
insightful automotive products and services that exceed their expectations. Value : We value integrity, customer focus, creativity, efficient and nimble actions and respect highly
motivated people and team sprit. We positively support environmental matters, safety and society. Guided by these values, we provide superior rewards to all people associated with Mazda.
2) Our Policy on Distribution of Earnings
Our policy on distribution of earnings is to declare dividends by carefully considering each fiscal year’s financial results and business environment. Our intent is to provide our stockholders with dividends on a stable basis. Our policy on earnings retained in the company is to utilize the financial resources to enhance our business competitiveness, e.g., capital investments in facilities and equipment and investments in research and development.
3) Our Mid-Term Plan
Mazda Group has realized a trend of steady profit increases by promoting product-led growth with a strong brand strategy under it’s “Millennium Plan” established in November 2000. A new mid-term plan “Mazda Momentum” was announced in November 2004. Under this plan the company will identify further actions that will build a strong foundation for the future while at the same time, sustaining its present momentum. Four key measures are being implemented under Mazda Momentum. 1. Reinforcement of Research & Development 2. Strengthening of key markets 3. Enhancement of global efficiencies and synergies 4. Leverage of human resources Mazda Group has enjoyed a unique heritage as a company with strong engineering prowess and intends to build on that strength by increasing investment in research and development in key areas such as environmental preservation, safety, and information technology. In order to strengthen key markets, sixteen new models will be introduced in the next two years. In addition distribution networks across the globe will be strengthened. Customer satisfaction will be an area of special focus. Our objective in the area of global efficiencies and synergies is to ensure our R&D, manufacturing, purchasing, and logistics activities are globally competitive on quality and cost. We will improve efficiencies globally
- 3 -
through enhanced global sourcing, supply chain management, and the implementation of ABC Phase 2, which is focused on commodity cycle plans. The ongoing development of our employees will continue to be a key enabler for success. We plan to strengthen our management capability, develop people globally and provide an environment that values individuals and fosters creativity. This will allow us to maximize the contribution of our human resources and create an energetic, and dynamic Mazda. The financial objectives during Mazda Momentum, which targeted by the end of FY2006 are as follows. Consolidated Wholesales 1.25 million units Operating Profit Over 100 Billion Yen Net Debt/Equity Ratio Below 100%
4) Our Challenges
In the short-term, the business environment will remain uncertain. Although the global economic outlook shows a sign of recovery, some industries, especially manufacturing, are expected to experience slower recovery due to high oil, steel and other material prices. The automotive industry is likely to remain intensely competitive, as the major manufacturers continue to offer technology to meet regulation, develop next generation technology, introduce a variety of new models, and offer high levels of marketing expenditure to support sales. Under the severe circumstances in each market where competition gets tougher, we, Mazda Motor Corporation and its group companies, are sure to achieve continuous high-profit growth by implementing various measures of “Mazda Momentum”.
5) Basic Philosophy of Corporate Governance and Implementation of Related Measures
Mazda, a company having corporate auditors, is aware that the enrichment of corporate governance is one of the most important tasks for management and is actively implementing various measures to this end. In addition to bodies prescribed by law such as the general meeting of stockholders, the board of directors and the board of auditors, an executive committee has been established. Executive committee meetings are held to propose and debate important company-wide policies and measures and to report on information necessary for business management. Other advisory bodies that assist the president with decision-making have also been established. The company has introduced the executive officer system. By promoting the separation of execution and management, the effectiveness of the board of directors as a supervisory body has been enhanced. Debate by the board has been enhanced, and by delegating authority to the executive officer level, decision-making has been speeded up. In these ways we are working to further improve management efficiency. As of the end of March, 2005, the company has nine directors and thirty executive officers some of which serve as directors as well. The company has also established a Management Advisory Committee composed of outside notable figures and Mazda’s directors. The committee meets four times a year. The company gets a wide range of opinions from a broad, global perspective from the committee members, who possess unsurpassed specialized knowledge and insight in their fields of expertise. Their opinions will be reflected in Mazda’s management and enhance transparency.
- 4 -
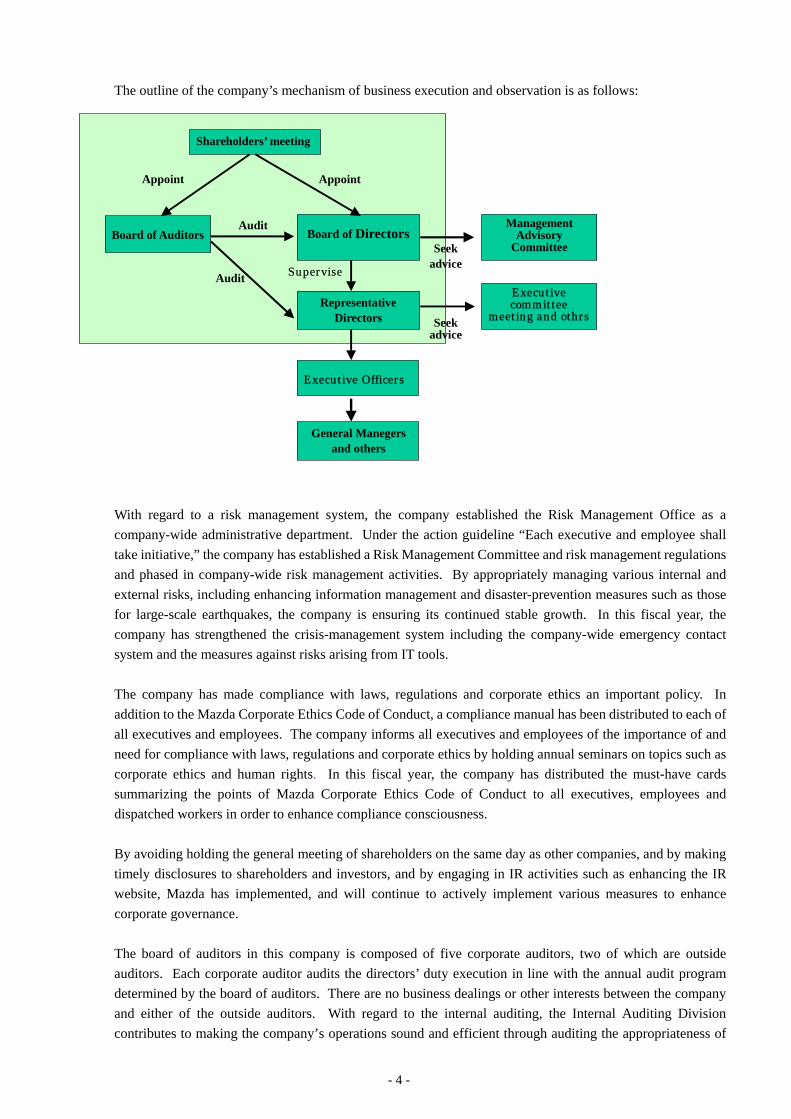
The outline of the company’s mechanism of business execution and observation is as follows:
With regard to a risk management system, the company established the Risk Management Office as a company-wide administrative department. Under the action guideline “Each executive and employee shall take initiative,” the company has established a Risk Management Committee and risk management regulations and phased in company-wide risk management activities. By appropriately managing various internal and external risks, including enhancing information management and disaster-prevention measures such as those for large-scale earthquakes, the company is ensuring its continued stable growth. In this fiscal year, the company has strengthened the crisis-management system including the company-wide emergency contact system and the measures against risks arising from IT tools. The company has made compliance with laws, regulations and corporate ethics an important policy. In addition to the Mazda Corporate Ethics Code of Conduct, a compliance manual has been distributed to each of all executives and employees. The company informs all executives and employees of the importance of and need for compliance with laws, regulations and corporate ethics by holding annual seminars on topics such as corporate ethics and human rights. In this fiscal year, the company has distributed the must-have cards summarizing the points of Mazda Corporate Ethics Code of Conduct to all executives, employees and dispatched workers in order to enhance compliance consciousness. By avoiding holding the general meeting of shareholders on the same day as other companies, and by making timely disclosures to shareholders and investors, and by engaging in IR activities such as enhancing the IR website, Mazda has implemented, and will continue to actively implement various measures to enhance corporate governance. The board of auditors in this company is composed of five corporate auditors, two of which are outside auditors. Each corporate auditor audits the directors’ duty execution in line with the annual audit program determined by the board of auditors. There are no business dealings or other interests between the company and either of the outside auditors. With regard to the internal auditing, the Internal Auditing Division contributes to making the company’s operations sound and efficient through auditing the appropriateness of
Shareholders’ meeting
Board of Auditors Board of Directors
Representative Directors
Appoint Appoint
Executive committee
meeting and othrs
Audit Supervise
Executive Officers
Audit
General Manegers and others
Management Advisory
Committee Seek advice
Seek advice
- 5 -
operations of the company and its affiliate companies concerning their business goals, policies and plans as well as laws and regulations. Further, Azusa Audit Corporation having concluded the audit contract with this company performs the accounting audit. The certified public accountants having performed the company’s accounting audit are Mr. Mitsunori Amo, Mr. Hiroshi Takahashi and Mr. Kohei Komatsubara, all of which belong to Azusa & Co. Moreover, the supplementary staffs of the accounting audit are other three certified public accountants, three accountant assistants and another staff. The board of auditors, the corporate auditors, the Internal Audit Div. and Azusa & Co. are keeping coordination with each other, such as holding periodic meetings.
6) Information about Parent Company and Other Companies Having a Significant
Voting Interest
Mazda has no parent company. However, Ford Motor Company has a significant portion of Mazda’s voting interest as follows:
Name of the Company Having a Significant Voting Interest: Ford Motor Company Percentage of Voting Interest: 33.7% Names of Stock Exchanges Ford Motor Company is listed: The New York Stock Exchange The Pacific Exchange Euronext The Deutsche Borse The Schweizer Borse The London Stock Exchange Note 1: Ford’s 33.7% voting interest is indirect.
Note 2: Ford Automotive International Holding, S.L., a 100% subsidiary of Ford Motor Company, directly invests in Mazda.
Our Relationship with Ford Motor Company and Our Position in the Ford Group In July 1979, Mazda Motor Corporation reached the following agreement with Ford Motor Company: a) Mazda to acquire Ford Kogyo Co., Ltd., a subsidiary of Ford Motor Company and b) Mazda to issue Ford new shares amounting to 25% of Mazda’s total issued shares after the acquisition. In December 1993, Ford and Mazda strengthened their relationship and agreed to build a global strategic alliance. In April 1996, agreement was reached to further strengthen this strategic relationship. In May of the same year, Mazda issued new shares to Ford by third-party allotment. As a result, the holding ratio of Ford to Mazda increased to 33.4%. The strengthening of the Mazda-Ford relationship has enabled both companies to coordinate their strategies in all areas, including product development, manufacturing and the distribution of vehicles. The competitiveness of both companies has been enhanced by improving efficiency and achieving greater economies of scale through effective utilization of resources and the development of each company as a supply source for the other. At the same time, the alliance between Ford and Mazda aims to improve the independent partner profit through pursuing synergy in variety of areas. Mazda continues to maintain its distinct identity and independence in management. Auto Alliance International, Inc. and Auto Alliance Thailand Co., Ltd. are jointly operated by Mazda and Ford.
Related Party Transactions Information on related party transactions will be separately disclosed as soon as it becomes available.
- 6 -
3. Financial Results, Position and Projection
1) Financial Results and Position
During FY2004, in Japan, private consumption continued to be positive in some realms and the economy showed signs of moderate recovery with the increase of corporate capital investment, expansion of production led by export business, and corporate profit improvement, while there were some ambiguous economical factors such as inflation of oil and material prices, including steel. In the U.S., although the economy is stable it does not warrant optimism due to soaring oil prices and the depreciation of the US dollar. In Europe and other major markets, the economies have begun showing signs of recovery. In China, there was a slow down of economic growth due to the recent financial restraint policy.
Automotive sales in Japan totaled to 5.82 million units, down 1.1% from the previous fiscal year. Although the micro-car market expanded substantially, the total number of registered vehicles decreased substantially. In the U.S., industry sales were 16.70 million units, up 0.7% from the previous fiscal year, while Europe was 17.84 million units, up 1.9%. In China, industry sales were 5.15 million units, up 6.2 % from the previous fiscal year, but the rate of growth has declined.
New Product Under these economic conditions, Mazda Group made solid results thanks to a continued product-led growth strategy. In June 2004, Mazda Verisa was launched in Japan. The model was designed to respond to diversifying customer needs, values and lifestyles. In November, the vehicle won the “Best Value Award”, a special award presented by the 2004-2005 Japan Car of the Year jury. In addition to several upgraded models with exterior and interior refinements, and safety equipment, and special-edition models to strengthen the competitiveness, Mazda also launched the new Titan commercial vehicle in June, the new Carol micro mini in September, and the new Premacy in February 2005. Premacy, a fully remodeled minivan, is a flexible function vehicle that offers great drivability with dynamic and sophisticated styling consistent with Mazda’s product DNA.
Production Structure In support of our product-led growth, in May 2004, Mazda re-opened Ujina Plant No.2 (U2), a plant that had been closed for 2 years and 8 months. The production line was renewed for significantly increasing production capacity and embracing the following concepts: “Environmentally and People Friendly Production Line”, “High Quality Concurrent Production Line” and “Flexible Production Line.” It has become Mazda’s symbol of its state-of-the-art, highly efficient and flexible production plants. As U2 reopened, production of BU vehicles at Hiroshima Plant No.1 (F) was terminated in April of 2004.
The Hofu Plant, where Mazda Axela (Mazda3) is produced, has been at full production capacity. In November, capacity was increased in response to strong market demand, resulting in more than 320,000 units of Mazda3 production. Fire in the Paint Shop of Ujina Plant No.1 Mazda’s Ujina Plant No. 1(U1) paint shop suffered damage from a fire that broke out in December 2004. To minimize the loss of production due to the fire, the U2 paint shop and other company's painting facilities were used in the early months of 2005 to continue vehicle assembly at U1. The paint operation restarted in late April 2005, completing both vehicle assembly and paint operation to take place in U1.
- 7 -
Sales Structure As for sales activities, Mazda is promoting reinforcement of its sales networks. In Japan, Mazda is promoting to increase sales outlets in metropolitan areas. In the U.S., Mazda is proceeding to increase exclusive dealers and strengthening dealer sales. The exclusivity level at the end of FY2004 was 33 percent, on track to achieve the target of 50 percent exclusivity by the end of FY2006. In Europe, Mazda established national sales companies in Sweden and Norway.
China Market Mazda has made a substantial progress in China in this fiscal year, developing various measures to achieve 300,000 sales volume in 2010. To strengthen the sales, Mazda, First Auto Works (FAW) and FAW Car Co. Limited, a FAW subsidiary, established a joint-venture national sales company “FAW Mazda Motor Sales Co., Ltd” which started operations in March 2005. In addition, Mazda announced in January 2005, that it would participate in the project by Ford Motor Company and Changan Automotive Group to build a new manufacturing plant in Nanjing. The construction of the plant was started in January 2005, and will be completed within two years. In January 2005, Mazda also established a new wholly owned subsidiary, Mazda Motor (Shanghai) Business Management & Consulting Co., Ltd., to help coordinate all facets of Mazda’s business in China, from production to sales.
ABC Cost Reduction Activities During the past three fiscal years, Mazda Group has pursued a 25-percent cost reduction objective for key commodities under Mazda’s Achieve Best Cost (ABC) Initiative. This initiative was successfully completed in FY2004 and the objective successfully accomplished.
Environmental Protection Mazda is actively working on measures to improve the environment. In October 2004, Mazda began road testing the Hydrogen RX-8, a dual-fuel test vehicle that can run on either of hydrogen and gasoline.
In addition, with the re-start of the U2 in May 2004, and U1 paint shop in April 2005, the Mazda’s three layer wet paint system was introduced that is higher in quality and more friendly to the environment. As a result, introducing this system to U1 completes the extension of the same paint system to all Mazda plants in Japan. The three layer wet paint system technology was awarded the “Climate Change Action Minister for the Environment Award 2004” in a category of technology & product development, and “Minister of Economy, Trade and Industry Award” as an excellent case of implementation of energy saving 2004.
Synergies with Ford Mazda celebrated its 25-year partnership with Ford Motor Company in November 2004. In the last 25 years, Mazda has strengthened its role within the Ford Group. Mazda is now the global lead for large, in-line four cylinder engines and substantially increased technology sharing. We are also taking the global lead on the shared technology development for the current CD car and the next generation global B-car. At the same time, both Mazda and Ford continue to strengthen cooperation in the areas of distribution, logistics, and information systems.
Financial Performance Turning to Mazda’s performance in this fiscal year, retail volume in the Japanese market totaled 286,000 units, up 2.4% compared with the prior fiscal year, reflecting the successful introduction of new models, including Mazda Verisa and Premacy. Total share, including micro-mini vehicles, was 4.9%, up 0.2
- 8 -
points from the last year.
Mazda’s retail volumes and market shares in the major overseas markets were as follows. In the U.S., Mazda’s retail volume totaled 264,000 units, down 3.3% from the last year, primarily due to the lower performance of aging trucks and sport utility vehicles, partially offset by the successful performance of Mazda3. Market share was unchanged at 1.6%. In Europe, retail volume was up 9.0% to 273,000 units, and market share was up 0.1 point to 1.5%, reflecting in particular the successful performance of Mazda3 that was introduced in the fall of 2003. Consolidated wholesales in this fiscal year totaled 1,104,000 units, an increase of 28,000 units or 2.6% year-over-year after excluding the impact of the fiscal year-end change for the consolidated overseas subsidiaries last year.1 Turning to financial results, on a consolidated basis, sales revenue was ¥2,695.6 billion, an increase of ¥120.9 billion or 4.7% year-over-year after excluding the impact of the fiscal year-end change for consolidated overseas subsidiaries last year.2 Operating income was up ¥12.7 billion or 18.2% to ¥82.9 billion, the highest operating income in Mazda’s history. This best-ever performance reflected strong sales of Mazda3, primarily in European and North American markets. Ordinary income was ¥73.1 billion, up ¥15.1 billion or 25.9%. Net income was ¥45.8 billion, up ¥11.9 billion or 35.0%, the highest net income in Mazda’s history. Consolidated cash flow (operating and investing activities) was ¥35.9 billion. While net cash provided by operating activities was ¥133.7 billion, reflecting higher profits from strong operations, net cash used in investing activities amounted to ¥97.8 billion due to the termination of the real estate trust contract that was entered into in 1999 in addition to investments in production facilities and equipment. Also, net cash used in financing activities amounted to ¥96.1 billion primarily due to the repayment of loans and redemption of bonds. Net debt (gross debt less cash and cash equivalents) was ¥313.5 billion, ¥44.6 billion lower than at March 31, 2004. Gross debt was ¥528.1 billion, down ¥102.3 billion from the prior year-end. Mazda focused on improving the efficiency of its facility investments. Investments related to new products, rationalization and labor-saving measures for production facilities, research and development on new technologies and products totaled ¥67.9 billion on a consolidated basis, ¥22.3 billion higher than the last year. Mazda’s financing activities in this fiscal year included ¥80 billion long-term syndicated bank borrowing, ¥40 billion each in July and August of 2004, as well as ¥10 billion long-term borrowing from Development Bank of Japan in December of 2004.
Dividends and the Decrease of the Legal Reserves Our present plan is to declare a year-end dividend of 3 yen per share for this fiscal year, an increase of 1 yen per share from the prior year, in light of improved performance in sales, operating income and ordinary income that are all higher than the last year.
1 The consolidated operating results for the year ended March 31, 2004 consisted of 15 months of operations for the major consolidated overseas subsidiaries due to the fiscal year-end change from December 31 to March 31.
2 Ibid.
- 9 -
Also, both for the source of dividends as well as preparing for the flexible reaction in case of the business environment changes, we plan to transfer ¥74.2 billion from the capital reserve to the other capital surplus within the capital surplus (additional paid-in capital) and ¥15.8 billion from the earned surplus reserve to the unappropriated retained earnings within the earned surplus (retained earnings) in the shareholders’ equity section of the unconsolidated balance sheet.
The unanticipated problems caused by a fire at the U1 paint shop have been swiftly and successfully addressed. Our paint operations restarted in late April 2005. We will strenuously continue to endeavor to strengthen our initiatives for better quality and safety, considering our local community and environment.
2) Financial Projection
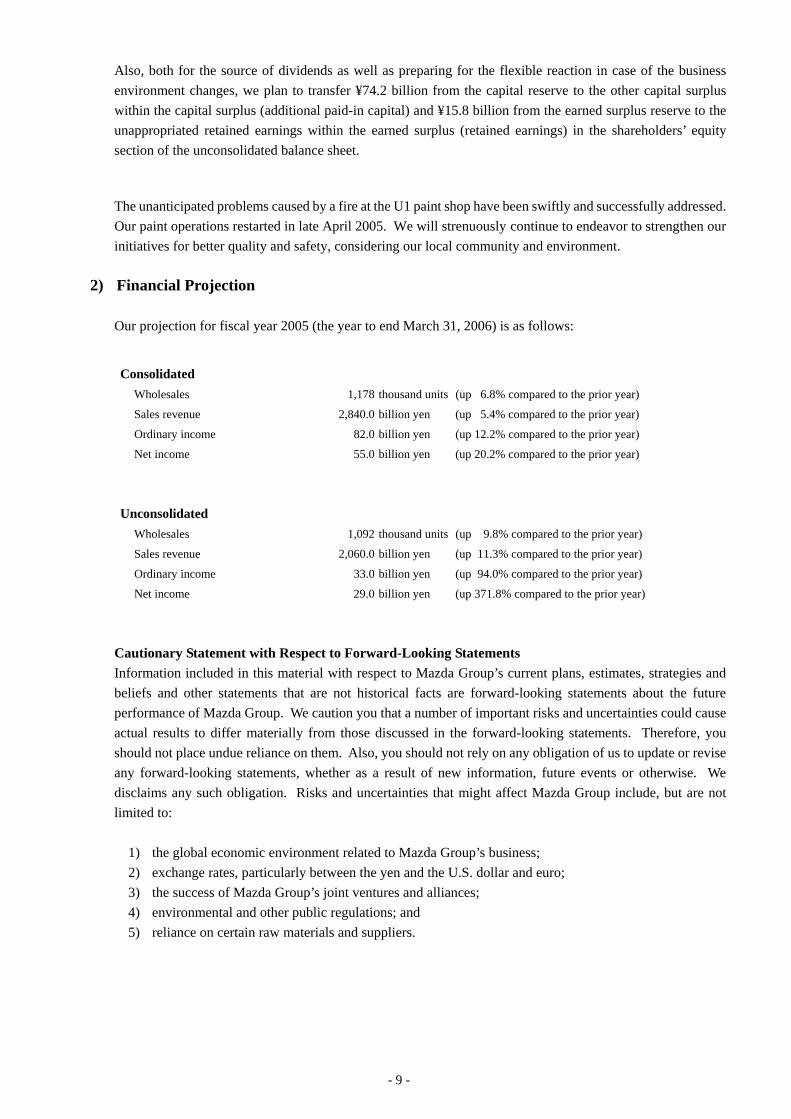
Our projection for fiscal year 2005 (the year to end March 31, 2006) is as follows:
Consolidated
Wholesales 1,178 thousand units (up 6.8% compared to the prior year)
Sales revenue 2,840.0 billion yen (up 5.4% compared to the prior year)
Ordinary income 82.0 billion yen (up 12.2% compared to the prior year)
Net income 55.0 billion yen (up 20.2% compared to the prior year)
Unconsolidated Wholesales 1,092 thousand units (up 9.8% compared to the prior year)
Sales revenue 2,060.0 billion yen (up 11.3% compared to the prior year)
Ordinary income 33.0 billion yen (up 94.0% compared to the prior year)
Net income 29.0 billion yen (up 371.8% compared to the prior year)
Cautionary Statement with Respect to Forward-Looking Statements
Information included in this material with respect to Mazda Group’s current plans, estimates, strategies and beliefs and other statements that are not historical facts are forward-looking statements about the future performance of Mazda Group. We caution you that a number of important risks and uncertainties could cause actual results to differ materially from those discussed in the forward-looking statements. Therefore, you should not place undue reliance on them. Also, you should not rely on any obligation of us to update or revise any forward-looking statements, whether as a result of new information, future events or otherwise. We disclaims any such obligation. Risks and uncertainties that might affect Mazda Group include, but are not limited to:
1) the global economic environment related to Mazda Group’s business; 2) exchange rates, particularly between the yen and the U.S. dollar and euro; 3) the success of Mazda Group’s joint ventures and alliances; 4) environmental and other public regulations; and 5) reliance on certain raw materials and suppliers.
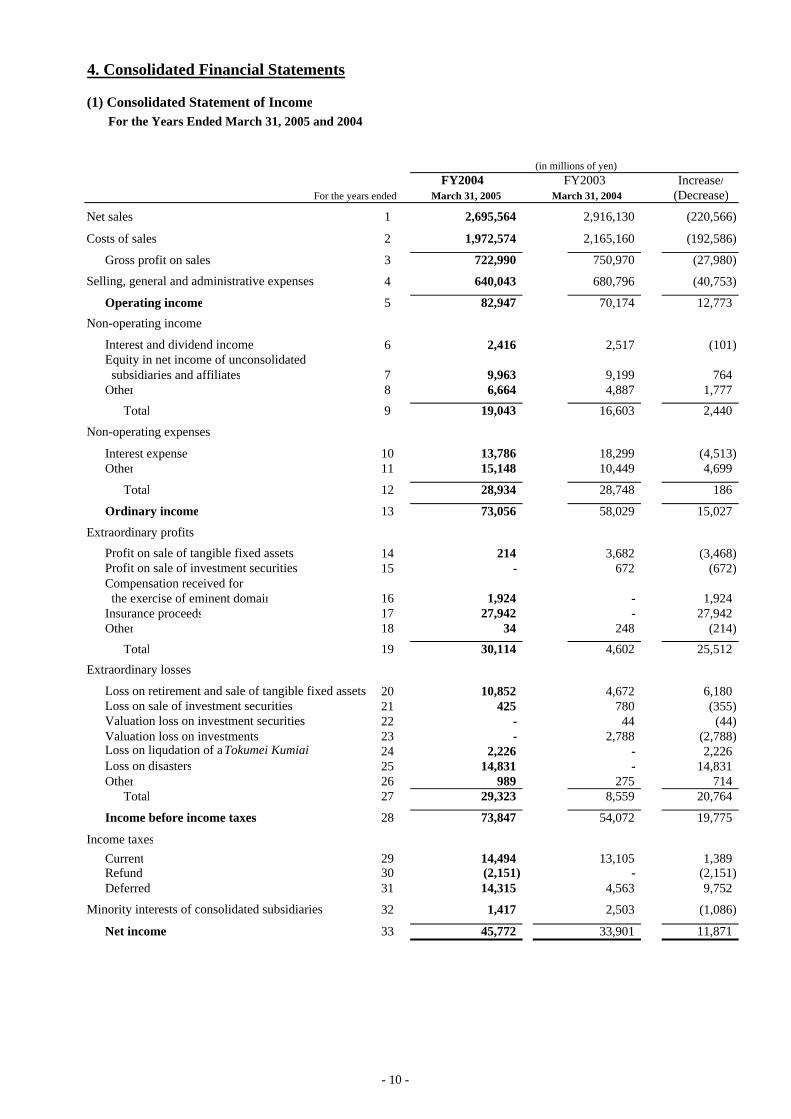
4. Consolidated Financial Statements
(1) Consolidated Statement of Income For the Years Ended March 31, 2005 and 2004
FY2004 FY2003 Increase/For the years ended (Decrease)
Net sales 1 2,695,564 2,916,130 (220,566)
Costs of sales 2 1,972,574 2,165,160 (192,586)
Gross profit on sales 3 722,990 750,970 (27,980)
4 640,043 680,796 (40,753)
Operating income 5 82,947 70,174 12,773
6 2,416 2,517 (101)
subsidiaries and affiliates 7 9,963 9,199 764Other 8 6,664 4,887 1,777
Total 9 19,043 16,603 2,440
Interest expense 10 13,786 18,299 (4,513)Other 11 15,148 10,449 4,699
Total 12 28,934 28,748 186
Ordinary income 13 73,056 58,029 15,027
14 214 3,682 (3,468)15 - 672 (672)
Compensation received for the exercise of eminent domain 16 1,924 - 1,924Insurance proceeds 17 27,942 - 27,942Other 18 34 248 (214)
Total 19 30,114 4,602 25,512
20 10,852 4,672 6,18021 425 780 (355)22 - 44 (44)
Valuation loss on investments 23 - 2,788 (2,788)24 2,226 - 2,22625 14,831 - 14,831
Other 26 989 275 714Total 27 29,323 8,559 20,764
Income before income taxes 28 73,847 54,072 19,775
Current 29 14,494 13,105 1,389Refund 30 (2,151) - (2,151)Deferred 31 14,315 4,563 9,752
32 1,417 2,503 (1,086)
Net income 33 45,772 33,901 11,871
(in millions of yen)
Selling, general and administrative expenses
Non-operating income
March 31, 2005 March 31, 2004
Interest and dividend income
Minority interests of consolidated subsidiaries
Loss on liqudation of a Tokumei KumiaiLoss on disasters
Loss on retirement and sale of tangible fixed assets Loss on sale of investment securities Valuation loss on investment securities
Income taxes
Equity in net income of unconsolidated
Non-operating expenses
Extraordinary losses
Extraordinary profits Profit on sale of tangible fixed assets Profit on sale of investment securities
- 10 -
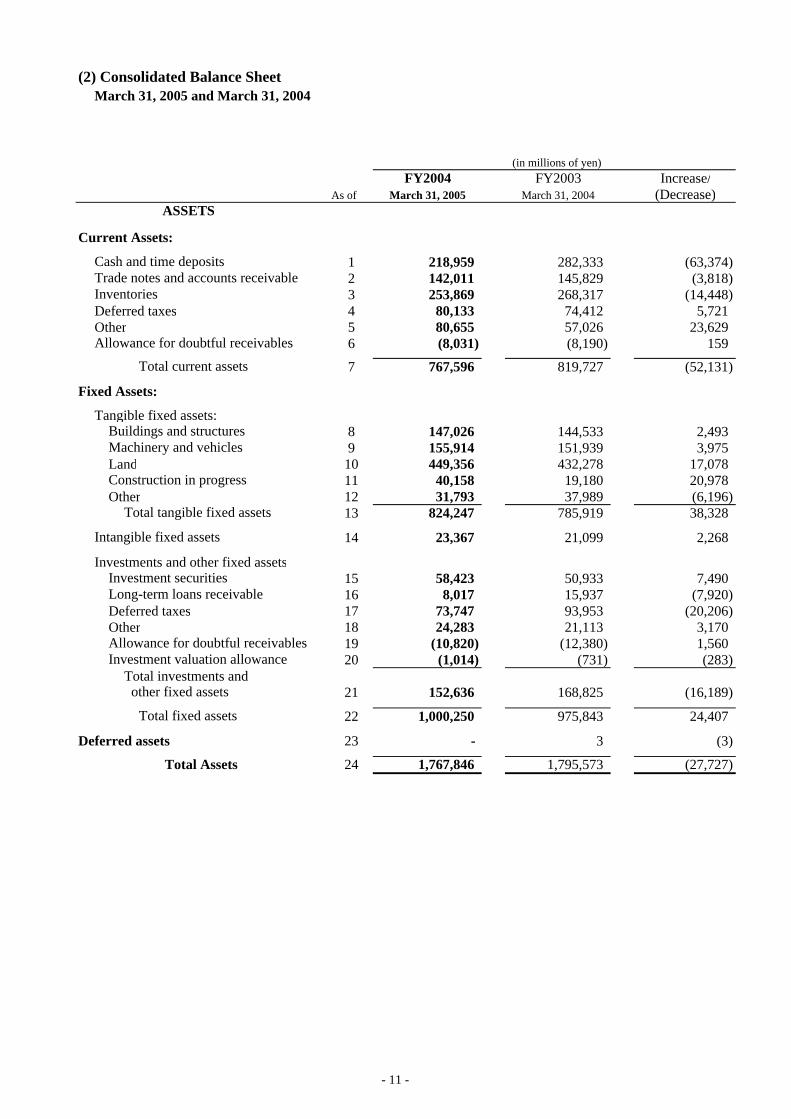
(2) Consolidated Balance SheetMarch 31, 2005 and March 31, 2004
FY2004 FY2003 Increase/As of March 31, 2005 March 31, 2004 (Decrease)
ASSETS
Current Assets:
1 218,959 282,333 (63,374)2 142,011 145,829 (3,818)3 253,869 268,317 (14,448)
Deferred taxes 4 80,133 74,412 5,721Other 5 80,655 57,026 23,629
6 (8,031) (8,190) 159
7 767,596 819,727 (52,131)
Fixed Assets:
Tangible fixed assets: 8 147,026 144,533 2,4939 155,914 151,939 3,975
Land 10 449,356 432,278 17,07811 40,158 19,180 20,978
Other 12 31,793 37,989 (6,196)13 824,247 785,919 38,328
14 23,367 21,099 2,268
Investments and other fixed assets15 58,423 50,933 7,49016 8,017 15,937 (7,920)
Deferred taxes 17 73,747 93,953 (20,206)Other 18 24,283 21,113 3,170
19 (10,820) (12,380) 1,56020 (1,014) (731) (283)
Total investments and 21 152,636 168,825 (16,189)
22 1,000,250 975,843 24,407
Deferred assets 23 - 3 (3)
Total Assets 24 1,767,846 1,795,573 (27,727)
(in millions of yen)
Cash and time deposits Trade notes and accounts receivable Inventories
Allowance for doubtful receivables
Total current assets
Buildings and structures Machinery and vehicles
Construction in progress
Total tangible fixed assets
Intangible fixed assets
Investment securities
Total fixed assets
Long-term loans receivable
Allowance for doubtful receivables Investment valuation allowance
other fixed assets
- 11 -
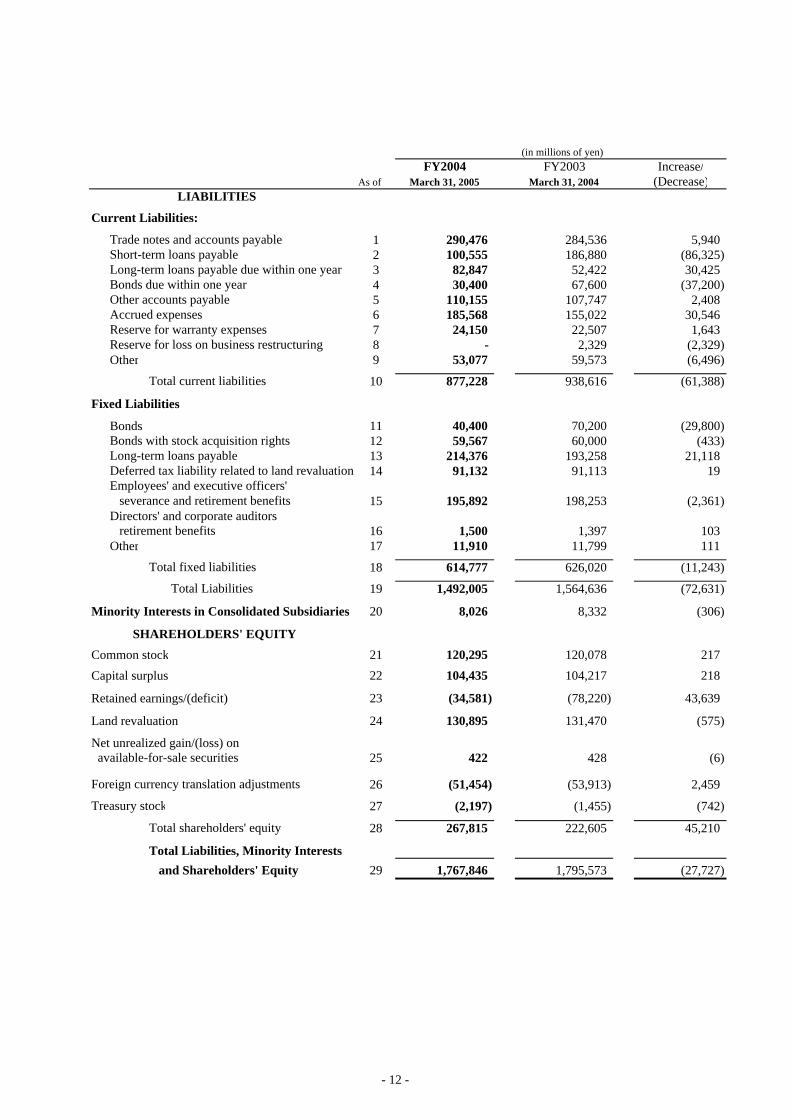
FY2004 FY2003 Increase/As of March 31, 2005 March 31, 2004 (Decrease)
LIABILITIES
Current Liabilities:
1 290,476 284,536 5,9402 100,555 186,880 (86,325)3 82,847 52,422 30,4254 30,400 67,600 (37,200)5 110,155 107,747 2,4086 185,568 155,022 30,5467 24,150 22,507 1,6438 - 2,329 (2,329)
Other 9 53,077 59,573 (6,496)
10 877,228 938,616 (61,388)
Fixed Liabilities
Bonds 11 40,400 70,200 (29,800)12 59,567 60,000 (433)13 214,376 193,258 21,11814 91,132 91,113 19
15 195,892 198,253 (2,361)Directors' and corporate auditors
16 1,500 1,397 103Other 17 11,910 11,799 111
18 614,777 626,020 (11,243)
19 1,492,005 1,564,636 (72,631)
20 8,026 8,332 (306)
SHAREHOLDERS' EQUITYCommon stock 21 120,295 120,078 217Capital surplus 22 104,435 104,217 218
Retained earnings/(deficit) 23 (34,581) (78,220) 43,639
Land revaluation 24 130,895 131,470 (575)
Net unrealized gain/(loss) on 25 422 428 (6)
26 (51,454) (53,913) 2,459
27 (2,197) (1,455) (742)
28 267,815 222,605 45,210
Total Liabilities, Minority Interests 29 1,767,846 1,795,573 (27,727)
(in millions of yen)
Total fixed liabilities
Total Liabilities
Minority Interests in Consolidated Subsidiaries
Employees' and executive officers' severance and retirement benefits
retirement benefits
Total current liabilities
Bonds with stock acquisition rights Long-term loans payable
and Shareholders' Equity
available-for-sale securities
Foreign currency translation adjustments
Treasury stock
Total shareholders' equity
Deferred tax liability related to land revaluation
Other accounts payable Accrued expenses Reserve for warranty expenses Reserve for loss on business restructuring
Trade notes and accounts payable Short-term loans payable Long-term loans payable due within one year Bonds due within one year
- 12 -
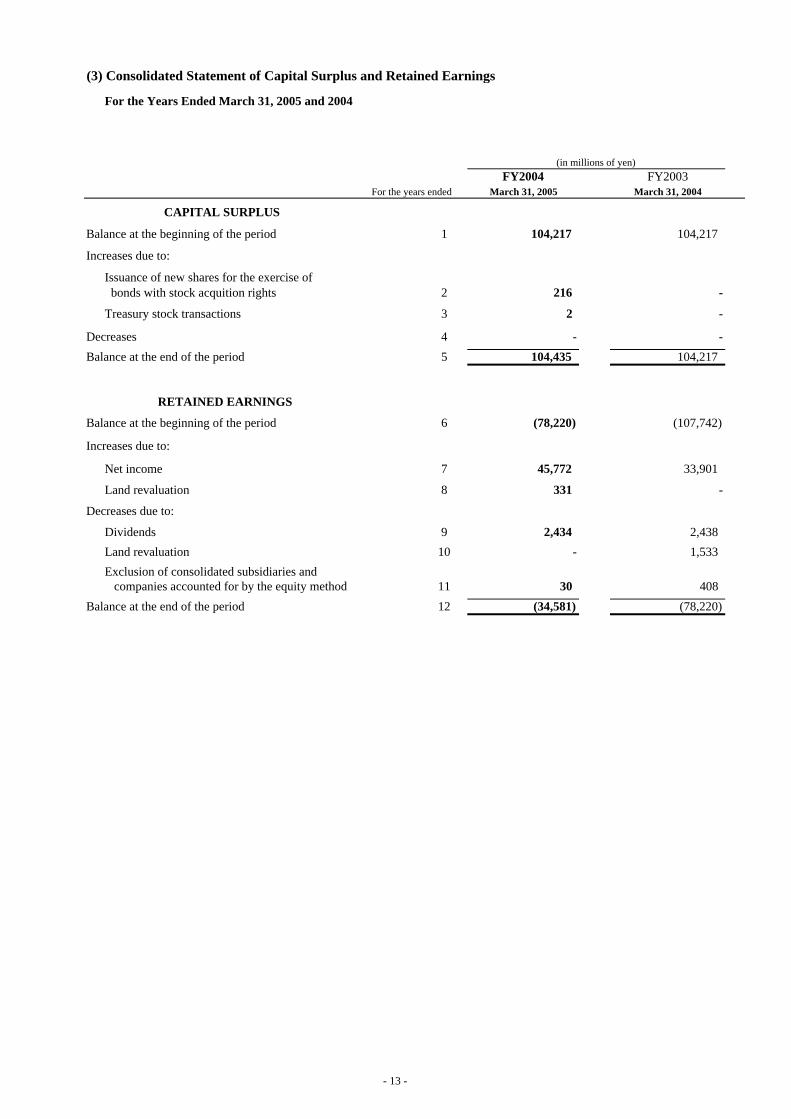
(3) Consolidated Statement of Capital Surplus and Retained Earnings
For the Years Ended March 31, 2005 and 2004
(in millions of yen)FY2004 FY2003
For the years ended March 31, 2005 March 31, 2004
CAPITAL SURPLUS
Balance at the beginning of the period 1 104,217 104,217
Increases due to:
Issuance of new shares for the exercise of bonds with stock acquition rights 2 216 -
Treasury stock transactions 3 2 -
Decreases 4 - -Balance at the end of the period 5 104,435 104,217
RETAINED EARNINGS
Balance at the beginning of the period 6 (78,220) (107,742)
Increases due to:
Net income 7 45,772 33,901
Land revaluation 8 331 -
Decreases due to:
Dividends 9 2,434 2,438Land revaluation 10 - 1,533Exclusion of consolidated subsidiaries and
companies accounted for by the equity method 11 30 408Balance at the end of the period 12 (34,581) (78,220)
- 13 -
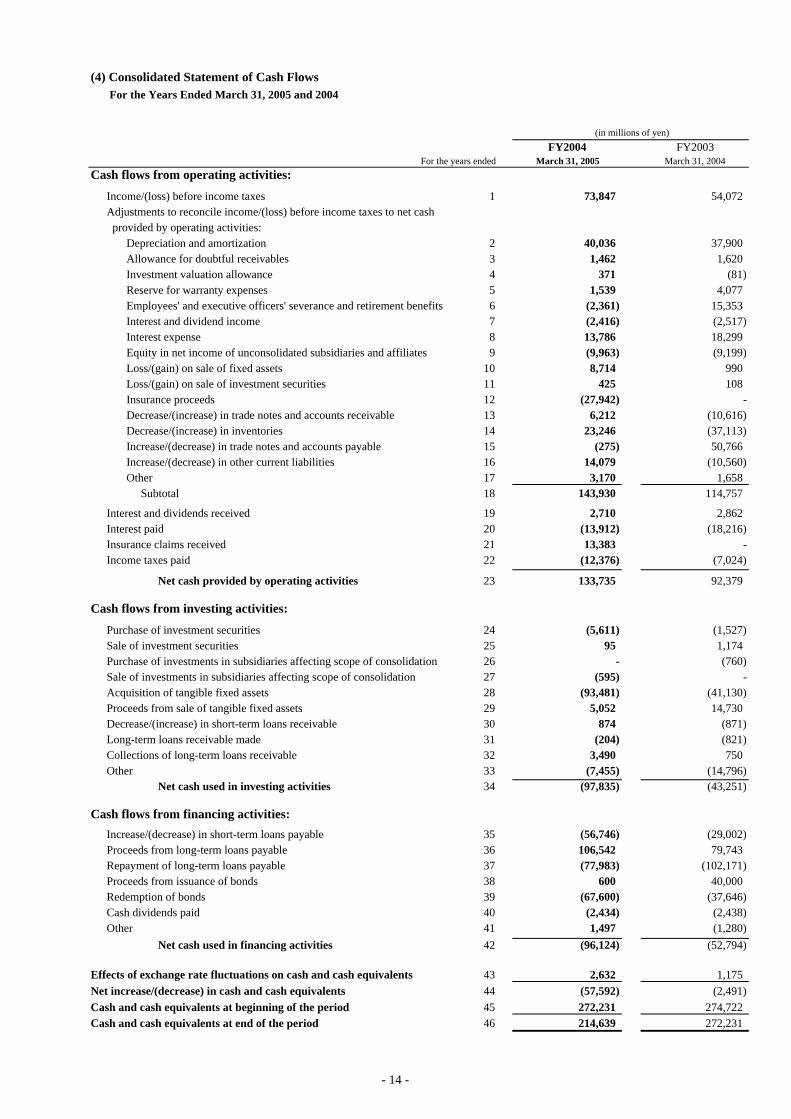
(4) Consolidated Statement of Cash Flows For the Years Ended March 31, 2005 and 2004
FY2004 FY2003For the years ended March 31, 2005 March 31, 2004
Cash flows from operating activities:Income/(loss) before income taxes 1 73,847 54,072Adjustments to reconcile income/(loss) before income taxes to net cash provided by operating activities:
Depreciation and amortization 2 40,036 37,900Allowance for doubtful receivables 3 1,462 1,620Investment valuation allowance 4 371 (81)Reserve for warranty expenses 5 1,539 4,077Employees' and executive officers' severance and retirement benefits 6 (2,361) 15,353Interest and dividend income 7 (2,416) (2,517)Interest expense 8 13,786 18,299Equity in net income of unconsolidated subsidiaries and affiliates 9 (9,963) (9,199)Loss/(gain) on sale of fixed assets 10 8,714 990Loss/(gain) on sale of investment securities 11 425 108Insurance proceeds 12 (27,942) -Decrease/(increase) in trade notes and accounts receivable 13 6,212 (10,616)Decrease/(increase) in inventories 14 23,246 (37,113)Increase/(decrease) in trade notes and accounts payable 15 (275) 50,766Increase/(decrease) in other current liabilities 16 14,079 (10,560)Other 17 3,170 1,658 Subtotal 18 143,930 114,757
Interest and dividends received 19 2,710 2,862Interest paid 20 (13,912) (18,216)Insurance claims received 21 13,383 -Income taxes paid 22 (12,376) (7,024)
Net cash provided by operating activities 23 133,735 92,379
Cash flows from investing activities:Purchase of investment securities 24 (5,611) (1,527)Sale of investment securities 25 95 1,174Purchase of investments in subsidiaries affecting scope of consolidation 26 - (760)Sale of investments in subsidiaries affecting scope of consolidation 27 (595) -Acquisition of tangible fixed assets 28 (93,481) (41,130)Proceeds from sale of tangible fixed assets 29 5,052 14,730Decrease/(increase) in short-term loans receivable 30 874 (871)Long-term loans receivable made 31 (204) (821)Collections of long-term loans receivable 32 3,490 750Other 33 (7,455) (14,796)
Net cash used in investing activities 34 (97,835) (43,251)
Cash flows from financing activities:Increase/(decrease) in short-term loans payable 35 (56,746) (29,002)Proceeds from long-term loans payable 36 106,542 79,743Repayment of long-term loans payable 37 (77,983) (102,171)Proceeds from issuance of bonds 38 600 40,000Redemption of bonds 39 (67,600) (37,646)Cash dividends paid 40 (2,434) (2,438)Other 41 1,497 (1,280)
Net cash used in financing activities 42 (96,124) (52,794)
Effects of exchange rate fluctuations on cash and cash equivalents 43 2,632 1,175Net increase/(decrease) in cash and cash equivalents 44 (57,592) (2,491)Cash and cash equivalents at beginning of the period 45 272,231 274,722Cash and cash equivalents at end of the period 46 214,639 272,231
(in millions of yen)
- 14 -
- 15 -
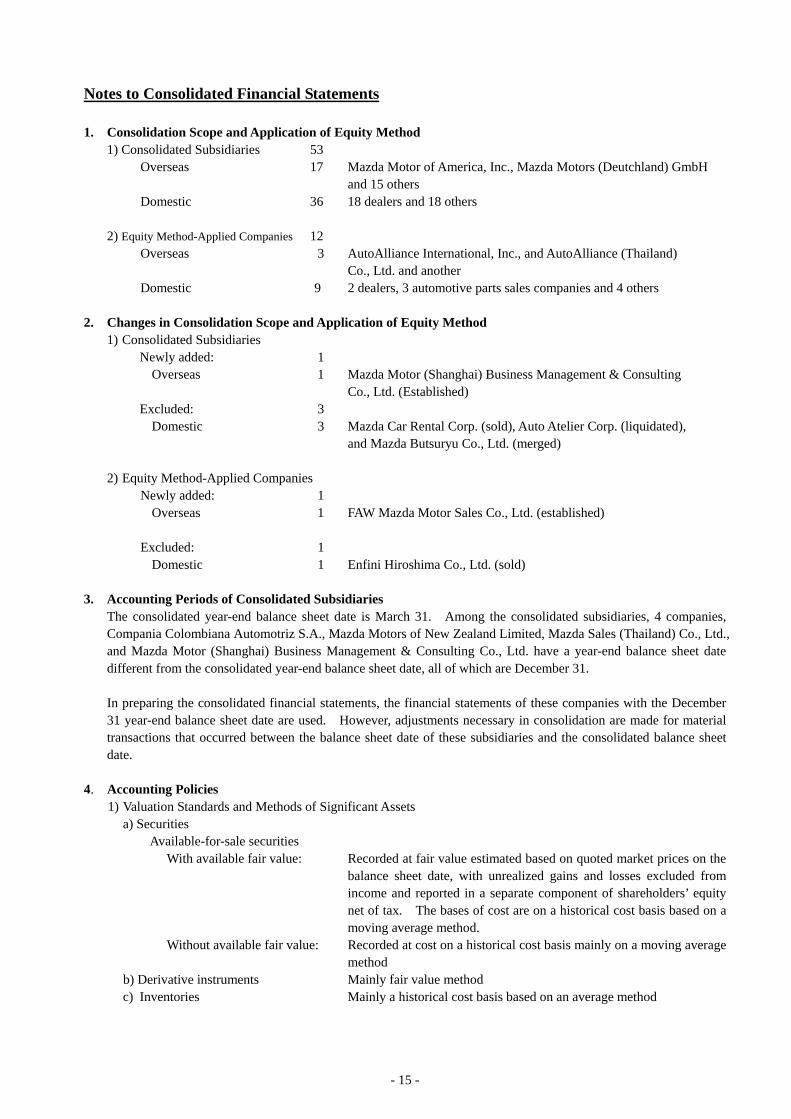
Notes to Consolidated Financial Statements 1. Consolidation Scope and Application of Equity Method
1) Consolidated Subsidiaries 53 Overseas 17 Mazda Motor of America, Inc., Mazda Motors (Deutchland) GmbH and 15 others Domestic 36 18 dealers and 18 others 2) Equity Method-Applied Companies 12 Overseas 3 AutoAlliance International, Inc., and AutoAlliance (Thailand) Co., Ltd. and another Domestic 9 2 dealers, 3 automotive parts sales companies and 4 others
2. Changes in Consolidation Scope and Application of Equity Method 1) Consolidated Subsidiaries Newly added: 1 Overseas 1 Mazda Motor (Shanghai) Business Management & Consulting Co., Ltd. (Established) Excluded: 3
Domestic 3 Mazda Car Rental Corp. (sold), Auto Atelier Corp. (liquidated), and Mazda Butsuryu Co., Ltd. (merged)
2) Equity Method-Applied Companies Newly added: 1 Overseas 1 FAW Mazda Motor Sales Co., Ltd. (established) Excluded: 1
Domestic 1 Enfini Hiroshima Co., Ltd. (sold)
3. Accounting Periods of Consolidated Subsidiaries The consolidated year-end balance sheet date is March 31. Among the consolidated subsidiaries, 4 companies, Compania Colombiana Automotriz S.A., Mazda Motors of New Zealand Limited, Mazda Sales (Thailand) Co., Ltd., and Mazda Motor (Shanghai) Business Management & Consulting Co., Ltd. have a year-end balance sheet date different from the consolidated year-end balance sheet date, all of which are December 31. In preparing the consolidated financial statements, the financial statements of these companies with the December 31 year-end balance sheet date are used. However, adjustments necessary in consolidation are made for material transactions that occurred between the balance sheet date of these subsidiaries and the consolidated balance sheet date.
4. Accounting Policies 1) Valuation Standards and Methods of Significant Assets
a) Securities Available-for-sale securities With available fair value: Recorded at fair value estimated based on quoted market prices on the
balance sheet date, with unrealized gains and losses excluded from income and reported in a separate component of shareholders’ equity net of tax. The bases of cost are on a historical cost basis based on a moving average method.
Without available fair value: Recorded at cost on a historical cost basis mainly on a moving average method
b) Derivative instruments Mainly fair value method c) Inventories Mainly a historical cost basis based on an average method
- 16 -
2) Depreciation and Amortization Methods of Significant Fixed Assets a) Tangible Fixed Assets
Mainly straight-line method. Useful lives and residual values are estimated by a method equivalent to the provisions of the Japanese income tax law.
b) Intangible Fixed Assets Straight-line method with periods of useful life estimated by a method equivalent to the provisions of the Japanese income tax law. Software for internal use is amortized on a straight-line basis over the period of internal use, i.e., 5 years.
3) Standards for Recognition of Reserves
a) Reserve for warranty expenses Reserve for warranty expenses provides for after-sales expenses of products (vehicles). The amount is estimated per product warranty provisions and actual costs incurred in the past, taking future prospects into consideration.
b) Employees’ and executive officers’ severance and retirement benefits
Employees’ and executive officers’ severance and retirement benefits provide for the costs of severance and retirement benefits to employees and executive officers. For employees’ severance and retirement benefits, the amount estimated to have been incurred as of the end of the current fiscal year is recognized based on the estimated amount of liabilities for severance and retirement benefits and the estimated fair value of the pension plan assets at the end of the current fiscal year. The recognition of prior service cost is deferred on the straight-line basis over a period equal to or less than the average remaining service period of employees at the time such cost is incurred (mainly 12 years). The recognition of actuarial differences is also deferred on the straight-line basis over a period equal to or less than the average remaining service period of employees at the time such gains or losses are realized (mainly 13 years). The amortization of net gains or losses starts from the fiscal year immediately following the year in which such gains or losses are realized. For executive officers’ retirement benefits, the liability is provided for the amount that would be required if all the eligible executive officers retired at the balance sheet date. (Additional Information) In connection with the enactment of the Japanese Welfare Pension Insurance Law, Mazda Motor Corporation (“the Company”) and certain domestic consolidated subsidiaries obtained the approval of exemption from the benefits related to future employee service under the substitutional portion from the Ministry of Health, Labor and Welfare on March 26, 2004. Estimated plan assets to be returned to the government at March 31, 2005 were 138,133 million yen. If the estimated plan assets had been returned to the government on March 31, 2005 and the transitional measurement of accounting standard for employees’ retirement benefits as stipulated in the Accounting Committee Report No. 13, Article 44-2 (the Japanese Institute of Certified Public Accountants) had been adopted, the effect of the adoption on the consolidated statement of income for the year ended March 31, 2005 would have been to increase the extraordinary profits by 58,696 million yen.
c) Directors’ and corporate auditors’ retirement benefits
Directors’ and corporate auditors’ retirement benefits provide for the payment of retirement benefits to directors and corporate auditors. The equivalent of the amount that would be required by the internal corporate policy if all the directors and corporate auditors retired at the end of this fiscal year is recognized.
d) Allowance for doubtful receivables Allowance for doubtful receivables provides for the losses from bad debt. The amount estimated to be uncollectible is recognized. For receivables at an ordinary risk, the amount is estimated based on the past default ratio. For receivables at a high risk and receivables from debtors under bankruptcy proceedings, the amount is estimated based on the financial standing of the debtor.
- 17 -
e) Investment valuation allowance Investment valuation allowance provides for losses from investments. The amount is estimated in light of the financial standings of the investee companies.
4) Accounting policies of foreign consolidated subsidiaries Among the foreign consolidated subsidiaries, Compania Colombiana Automotriz S.A. prepares its financial statements based on the accounting principles generally accepted in Colombia to reflect adjustments for the country’s inflationary economy and changing prices.
5) Foreign currency translation
Receivables and payables denominated in foreign currencies are translated into Japanese yen at the exchange rate on the fiscal year end; gains and losses in foreign currency translation are included in the income of the current period. Balance sheets of consolidated overseas subsidiaries are translated into Japanese yen at the rates on the fiscal year ends of the subsidiaries’ accounting periods except for shareholders’ equity accounts, which are translated at the historical rates. Income statements of consolidated overseas subsidiaries are translated at average rates of the subsidiaries’ fiscal years, with the translation differences prorated and included in the shareholders’ equity as foreign currency translation adjustments and minority interests.
6) Accounting for Leases
Lease transactions other than those finance leases with an unconditional title transfer clause are accounted for by the method equivalent to rental transactions.
7) Accounting for Hedging Activities
Full-deferral hedge accounting is applied. Also, for certain interest swap contracts that are used as hedges and meet certain hedging criteria, the net amount to be paid or received under the interest swap contract is added to or deducted from the interest on the assets or liabilities for which the swap contract was executed. Forward exchange contracts designated as hedging a foreign-currency-denominated loan receivable are translated into yen at the fixed exchange rate stipulated in the contract.
8) Other significant accounting policies in the preparation of the consolidated financial statements Accounting for Consumption Taxes: Tax-excluding method
5.Valuation of Assets and Liabilities of Consolidated Subsidiaries The assets and liabilities of consolidated subsidiaries are valued at fair value at the time of acquisition and are carried at fair value.
6. Amortization of Goodwill
Goodwill is amortized on a straight-line basis over a period (primarily 5 years) during which each investment is expected to generate benefits.
7. Appropriation of Retained Earnings
The appropriation of retained earnings by a consolidated subsidiary is reflected in the consolidated statement of capital surplus and retained earnings when such appropriation is made by resolution of the shareholders of the subsidiary.
8. Cash and Cash Equivalents in the Consolidated Statement of Cash Flows
Cash and cash equivalents consist of cash on hand, bank deposits that can be readily withdrawn, and short-term, highly liquid investments with maturities of three months or less at the time of acquisition that present insignificant risk of changes in value.
- 18 -
Additional Information 1. Synchronization of Fiscal Year-End of Overseas Consolidated Subsidiaries with Consolidated Fiscal
Year-End Until the year ended March 31, 2003, in consolidating the overseas subsidiaries, which had a year-end different from the consolidated year-end of March 31, the financial statements of each of these subsidiaries were used with adjustments necessary in consolidation for material transactions that occurred between the year-end of the above subsidiaries and the consolidated year-end. Commencing in the year ended March 31, 2004, however, in order to better administer and disclose consolidated financial results, the fiscal year-end of 13 consolidated overseas subsidiaries, including Mazda Motor of America, Inc., Mazda Canada, Inc., Mazda Motors (Deutschland) GmbH, and Mazda Australia Pty. Ltd., was changed to match the consolidated fiscal year-end of March 31. Accordingly, the consolidated operating results for the year ended March 31, 2004 consisted of 15 months of operations from January 1, 2003 to March 31, 2004 for those consolidated overseas subsidiaries.
2. Real Estate Trust Contract In September of 1999, the Company entered into a real estate trust contract. The beneficial ownership of property was transferred to a Tokumei Kumiai, and the real estate was leased back to the Company. The real estate includes an educational facility, a research and development facility, distribution centers, and stores of domestic dealers. In September of 2004, however, the Company terminated the real estate trust contract and the lease contract of the real estate.
The loss incurred on the termination of the Tokumei Kumiai agreement, amounting to 2,226 million yen, was included in the extraordinary losses as the loss on liquidation of a Tokumei Kumiai in the statement of income for the year ended March 31, 2005.
Footnotes(in millions of yen)
FY2004 FY2003
As of / For the years ended March 31, 2005 March 31, 2004
Consolidated Balance Sheet
1. Accumulated depreciation on tangible fixed assets 1,051,002 1,089,121
2. In accordance with the Law to Partially Revise the Land Revaluation Law
(Law No. 19, enacted on March 31, 2001), land owned by Mazda for business uses
was revalued. The unrealized gains on the revaluation are included in the shareholders'
equity as "Land Revaluation" for the amount net of deferred taxes.
The deferred taxes on the unrealized gains are included in the liabilities as "Deferred
Tax Liability Related to Land Revaluation".
Timing of revaluation: As of March 31, 2001
Method of revaluation:
The fair value of land is determined based on official notice prices that are
assessed and published by the Commissioner of the National Tax Administration,
as stipulated in Article 2-4 of the Ordinance Implementing the Law
Concerning Land Revaluation (Article 119 of 1998 Cabinet Order,
promulgated on March 31, 1998). Reasonable adjustments, including those
for the timing of assessment, are made to the official notice prices.
The amount of difference between the aggregate fair value of the revalued land
as of the end of this period and that at the time of revaluation as stipulated in
Article 10 of the Land Revaluation Law is:
71,914 million yen
3. Assets offered as collateral and collateralized loans
Assets offered as collateral 464,396 473,072
Collateralized loans 164,893 235,984
4. Contingent liabilities for guarantee and similar agreements 46,407 49,804
5. Notes and other receivables discounted
Discounted notes receivable 826 672
Factoring of receivables with recourse 8,567 8,851
Consolidated Statement of Operations
The aggregate amounts of research and development expenses 90,841 87,807
Of the insurance proceeds recognized in the extraordinary profits for the year ended March 31, 2005, the amount of 25,399
million yen was for the fire incident at Ujina No. 1 Plant that occurred on December 15, 2004. Also, of the loss on disasters
recognized in the extraordinary losses for the year ended March 31, 2005, the amount of 12,613 million yen was for the
fire incident.
- 19 -
(in millions of yen)
FY2004 FY2003As of / For the years ended March 31, 2005 March 31, 2004
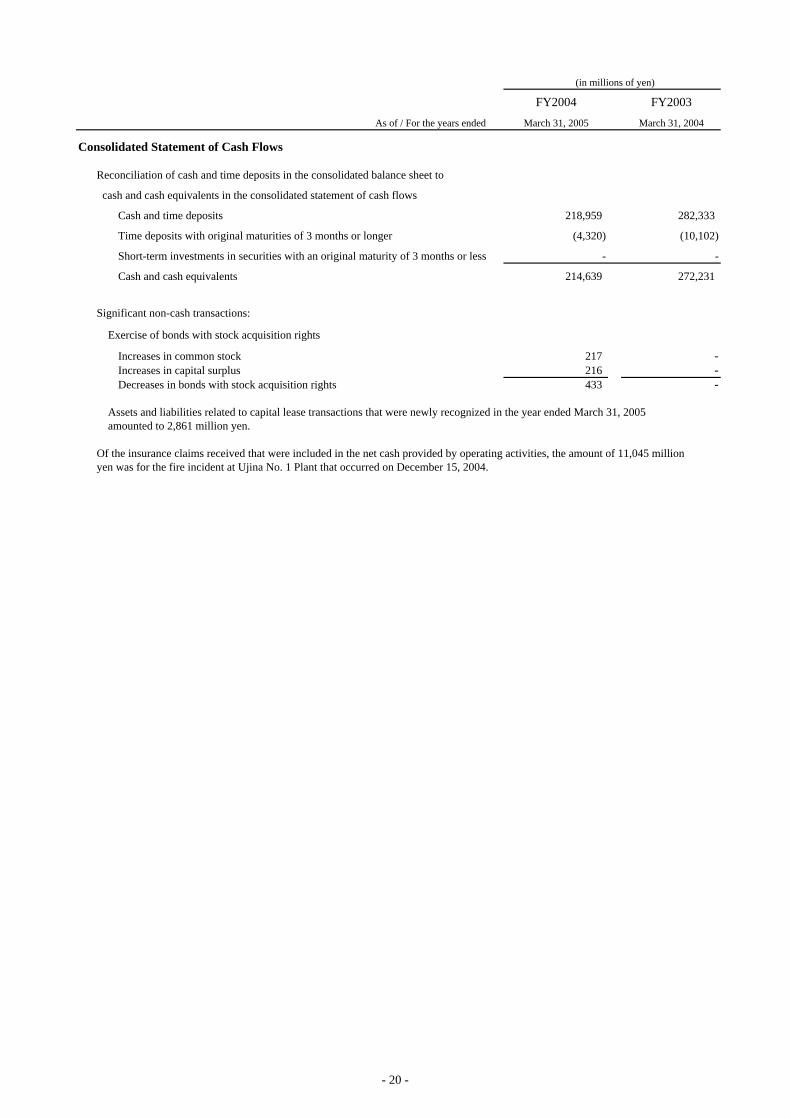
Consolidated Statement of Cash Flows
Reconciliation of cash and time deposits in the consolidated balance sheet to
cash and cash equivalents in the consolidated statement of cash flows
Cash and time deposits 218,959 282,333
Time deposits with original maturities of 3 months or longer (4,320) (10,102)
Short-term investments in securities with an original maturity of 3 months or less - -
Cash and cash equivalents 214,639 272,231
Significant non-cash transactions:
Exercise of bonds with stock acquisition rights
Increases in common stock 217 -Increases in capital surplus 216 -Decreases in bonds with stock acquisition rights 433 -
Assets and liabilities related to capital lease transactions that were newly recognized in the year ended March 31, 2005 amounted to 2,861 million yen.
Of the insurance claims received that were included in the net cash provided by operating activities, the amount of 11,045 millionyen was for the fire incident at Ujina No. 1 Plant that occurred on December 15, 2004.
- 20 -
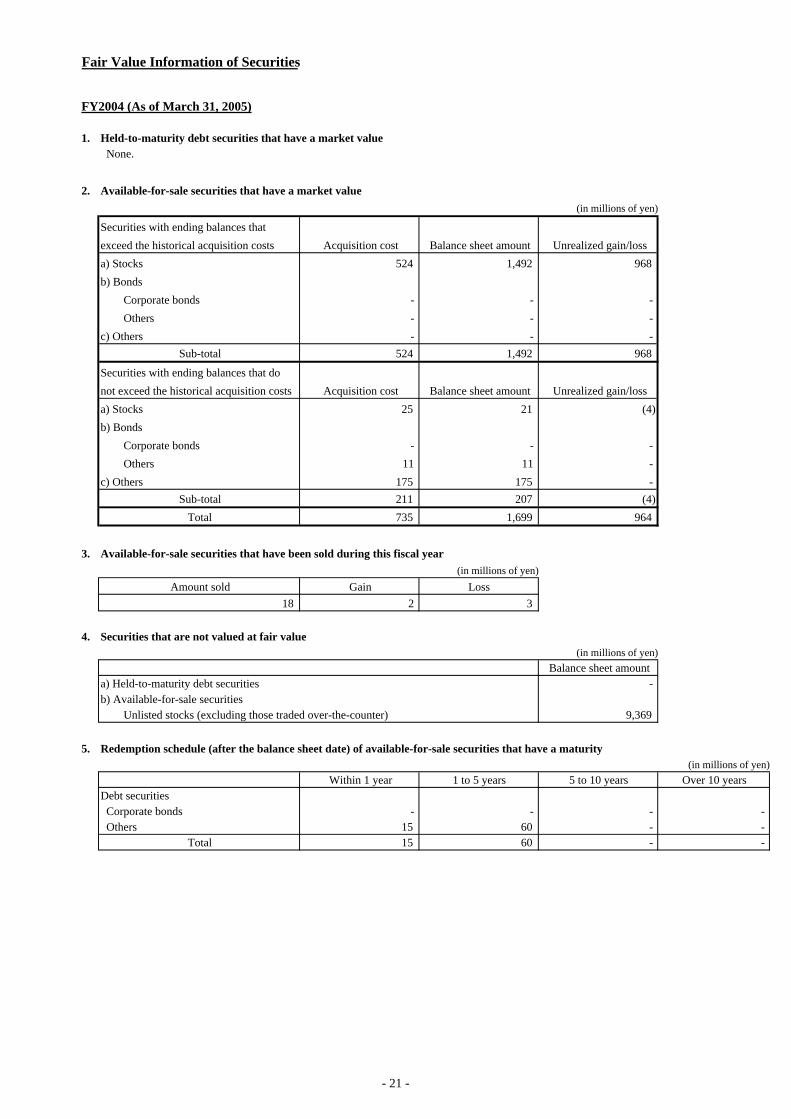
Fair Value Information of Securities
FY2004 (As of March 31, 2005)
1. Held-to-maturity debt securities that have a market value None.
2. Available-for-sale securities that have a market value(in millions of yen)
Securities with ending balances thatexceed the historical acquisition costs Acquisition cost Balance sheet amount Unrealized gain/lossa) Stocks 524 1,492 968b) Bonds Corporate bonds - - - Others - - - c) Others - - -
Sub-total 524 1,492 968
Securities with ending balances that donot exceed the historical acquisition costs Acquisition cost Balance sheet amount Unrealized gain/lossa) Stocks 25 21 (4)b) Bonds Corporate bonds - - - Others 11 11 - c) Others 175 175 -
Sub-total 211 207 (4)Total 735 1,699 964
3. Available-for-sale securities that have been sold during this fiscal year (in millions of yen)
Amount sold Gain Loss18 2 3
4. Securities that are not valued at fair value(in millions of yen)
Balance sheet amounta) Held-to-maturity debt securities - b) Available-for-sale securities Unlisted stocks (excluding those traded over-the-counter) 9,369
5. Redemption schedule (after the balance sheet date) of available-for-sale securities that have a maturity(in millions of yen)
Within 1 year 1 to 5 years 5 to 10 years Over 10 yearsDebt securities Corporate bonds - - - - Others 15 60 - -
Total 15 60 - -
- 21 -

Fair Value Information of Securities
FY2003 (As of March 31, 2004)
1. Held-to-maturity debt securities that have a market value None.
2. Available-for-sale securities that have a market value(in millions of yen)
Securities with ending balances thatexceed the historical acquisition costs Acquisition cost Balance sheet amount Unrealized gain/lossa) Stocks 505 1,515 1,010b) Bonds Corporate bonds - - - Others 10 11 1c) Others - - -
Sub-total 515 1,526 1,011
Securities with ending balances that donot exceed the historical acquisition costs Acquisition cost Balance sheet amount Unrealized gain/lossa) Stocks 58 47 (11)b) Bonds Corporate bonds - - - Others - - - c) Others 117 117 -
Sub-total 175 164 (11)Total 690 1,690 1,000
3. Available-for-sale securities that have been sold during this fiscal year (in millions of yen)
Amount sold Gain Loss644 142 48
4. Securities that are not valued at fair value(in millions of yen)
Balance sheet amounta) Held-to-maturity debt securities - b) Available-for-sale securities Unlisted stocks (excluding those traded over-the-counter) 8,959
5. Redemption schedule (after the balance sheet date) of available-for-sale securities that have a maturity(in millions of yen)
Within 1 year 1 to 5 years 5 to 10 years Over 10 yearsDebt securities Corporate bonds - - - - Others 4 63 - -
Total 4 63 - -
- 22 -
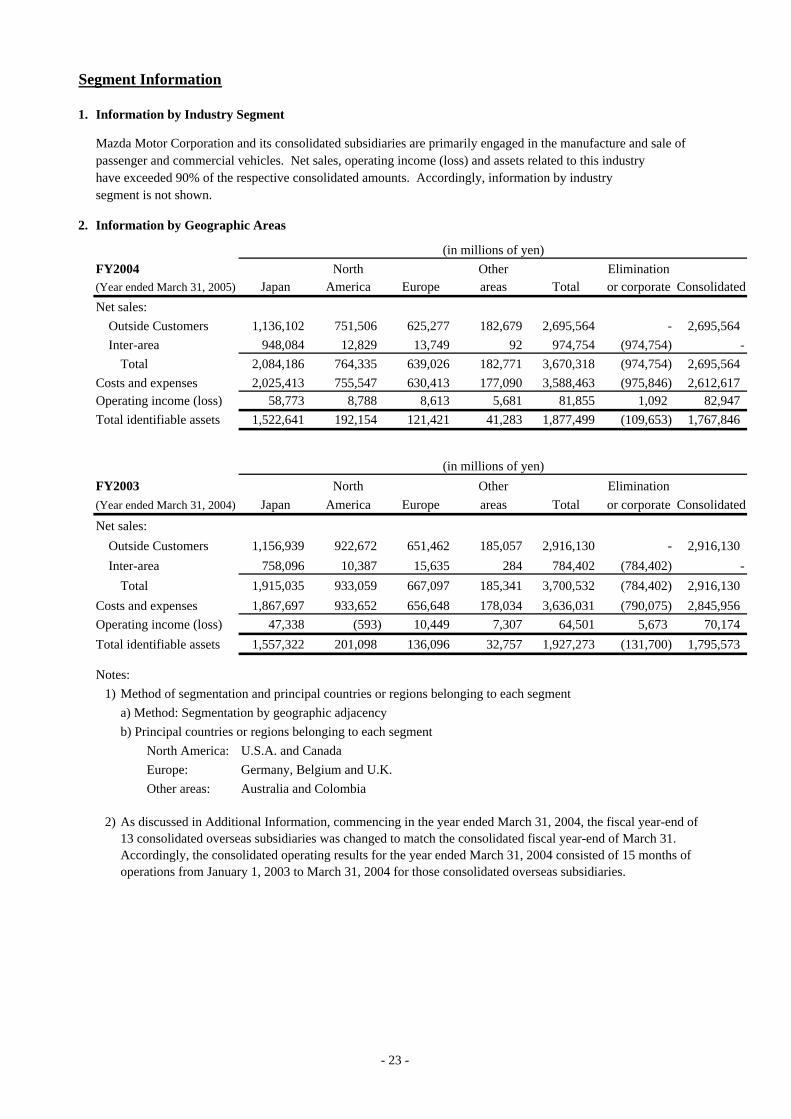
Segment Information
1. Information by Industry Segment
Mazda Motor Corporation and its consolidated subsidiaries are primarily engaged in the manufacture and sale of passenger and commercial vehicles. Net sales, operating income (loss) and assets related to this industryhave exceeded 90% of the respective consolidated amounts. Accordingly, information by industrysegment is not shown.
2. Information by Geographic Areas
(in millions of yen)FY2004 North Other Elimination(Year ended March 31, 2005) Japan America Europe areas Total or corporate ConsolidatedNet sales:
Outside Customers 1,136,102 751,506 625,277 182,679 2,695,564 - 2,695,564Inter-area 948,084 12,829 13,749 92 974,754 (974,754) -
Total 2,084,186 764,335 639,026 182,771 3,670,318 (974,754) 2,695,564Costs and expenses 2,025,413 755,547 630,413 177,090 3,588,463 (975,846) 2,612,617Operating income (loss) 58,773 8,788 8,613 5,681 81,855 1,092 82,947Total identifiable assets 1,522,641 192,154 121,421 41,283 1,877,499 (109,653) 1,767,846
(in millions of yen)FY2003 North Other Elimination(Year ended March 31, 2004) Japan America Europe areas Total or corporate ConsolidatedNet sales:
Outside Customers 1,156,939 922,672 651,462 185,057 2,916,130 - 2,916,130Inter-area 758,096 10,387 15,635 284 784,402 (784,402) -
Total 1,915,035 933,059 667,097 185,341 3,700,532 (784,402) 2,916,130Costs and expenses 1,867,697 933,652 656,648 178,034 3,636,031 (790,075) 2,845,956Operating income (loss) 47,338 (593) 10,449 7,307 64,501 5,673 70,174Total identifiable assets 1,557,322 201,098 136,096 32,757 1,927,273 (131,700) 1,795,573
Notes:1) Method of segmentation and principal countries or regions belonging to each segment
a) Method: Segmentation by geographic adjacencyb) Principal countries or regions belonging to each segment North America: U.S.A. and Canada Europe: Germany, Belgium and U.K. Other areas: Australia and Colombia
2) As discussed in Additional Information, commencing in the year ended March 31, 2004, the fiscal year-end of 13 consolidated overseas subsidiaries was changed to match the consolidated fiscal year-end of March 31.Accordingly, the consolidated operating results for the year ended March 31, 2004 consisted of 15 months of operations from January 1, 2003 to March 31, 2004 for those consolidated overseas subsidiaries.
- 23 -
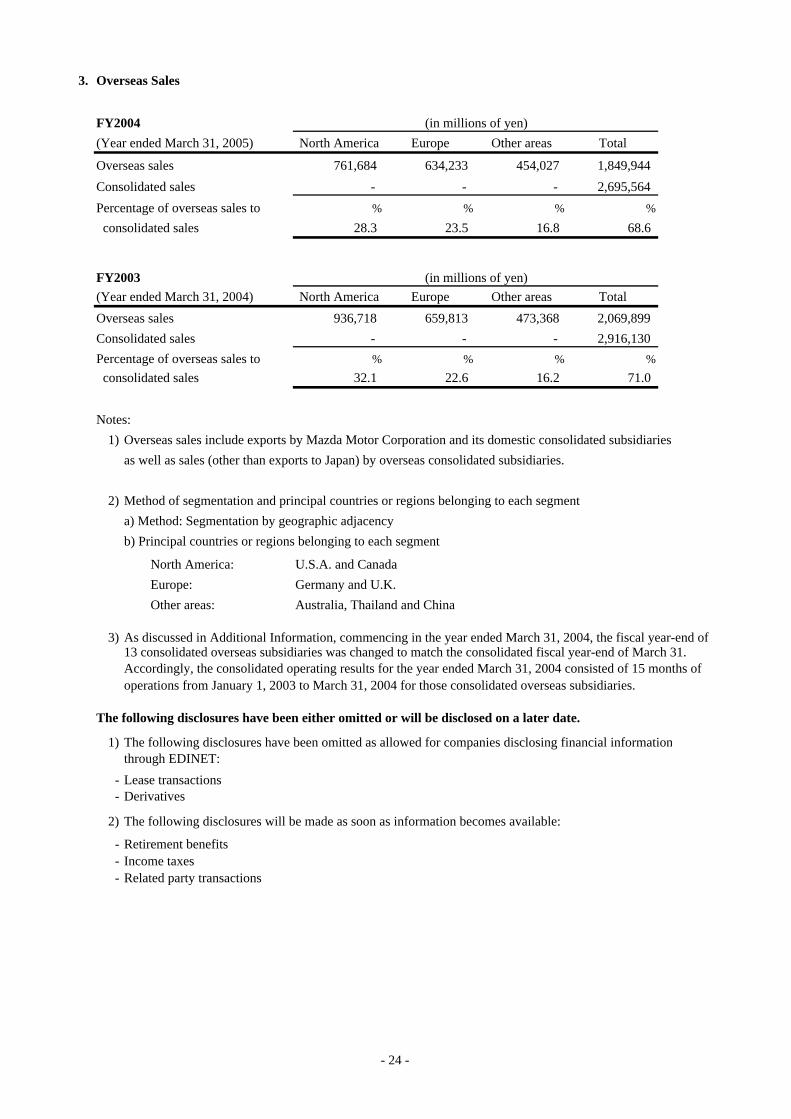
3. Overseas Sales
FY2004(Year ended March 31, 2005) North America Europe Other areas Total
Overseas sales 761,684 634,233 454,027 1,849,944Consolidated sales - - - 2,695,564Percentage of overseas sales to % % % %
consolidated sales 28.3 23.5 16.8 68.6
FY2003(Year ended March 31, 2004) North America Europe Other areas TotalOverseas sales 936,718 659,813 473,368 2,069,899Consolidated sales - - - 2,916,130Percentage of overseas sales to % % % % consolidated sales 32.1 22.6 16.2 71.0
Notes:1) Overseas sales include exports by Mazda Motor Corporation and its domestic consolidated subsidiaries
as well as sales (other than exports to Japan) by overseas consolidated subsidiaries.
2) Method of segmentation and principal countries or regions belonging to each segmenta) Method: Segmentation by geographic adjacencyb) Principal countries or regions belonging to each segment
North America: U.S.A. and Canada Europe: Germany and U.K. Other areas: Australia, Thailand and China
3) As discussed in Additional Information, commencing in the year ended March 31, 2004, the fiscal year-end of 13 consolidated overseas subsidiaries was changed to match the consolidated fiscal year-end of March 31.Accordingly, the consolidated operating results for the year ended March 31, 2004 consisted of 15 months of operations from January 1, 2003 to March 31, 2004 for those consolidated overseas subsidiaries.
The following disclosures have been either omitted or will be disclosed on a later date.
1) The following disclosures have been omitted as allowed for companies disclosing financial informationthrough EDINET:
- Lease transactions- Derivatives
2) The following disclosures will be made as soon as information becomes available:
- Retirement benefits- Income taxes- Related party transactions
(in millions of yen)
(in millions of yen)
- 24 -
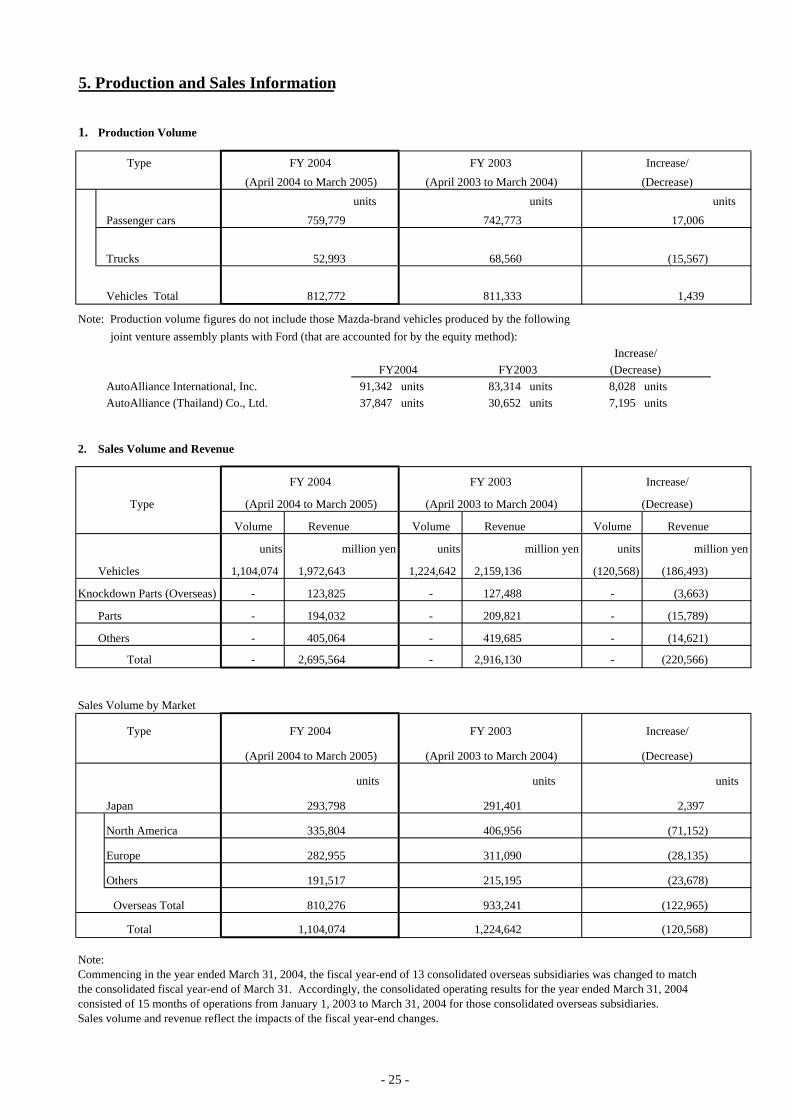
5. Production and Sales Information
1. Production Volume
Type
units units unitsPassenger cars 759,779 742,773 17,006
Trucks 52,993 68,560 (15,567)
Vehicles Total 812,772 811,333 1,439
Note: Production volume figures do not include those Mazda-brand vehicles produced by the following joint venture assembly plants with Ford (that are accounted for by the equity method):
Increase/ FY2004 FY2003 (Decrease)
AutoAlliance International, Inc. 91,342 units 83,314 units 8,028 unitsAutoAlliance (Thailand) Co., Ltd. 37,847 units 30,652 units 7,195 units
2. Sales Volume and Revenue
Type
Volume Revenue Volume Revenue Volume Revenue
units million yen units million yen units million yen
1,104,074 1,972,643 1,224,642 2,159,136 (120,568) (186,493)
- 123,825 - 127,488 - (3,663)
- 194,032 - 209,821 - (15,789)
- 405,064 - 419,685 - (14,621)
Total - 2,695,564 - 2,916,130 - (220,566)
Sales Volume by Market
Type
units units units
Japan 293,798 291,401 2,397
North America 335,804 406,956 (71,152)
Europe 282,955 311,090 (28,135)
Others 191,517 215,195 (23,678)
Overseas Total 810,276 933,241 (122,965)
Total 1,104,074 1,224,642 (120,568)
Note:Commencing in the year ended March 31, 2004, the fiscal year-end of 13 consolidated overseas subsidiaries was changed to matchthe consolidated fiscal year-end of March 31. Accordingly, the consolidated operating results for the year ended March 31, 2004consisted of 15 months of operations from January 1, 2003 to March 31, 2004 for those consolidated overseas subsidiaries.Sales volume and revenue reflect the impacts of the fiscal year-end changes.
Vehicles
Parts
Others
FY 2004(April 2004 to March 2005) (April 2003 to March 2004)
(April 2003 to March 2004)
FY 2004 FY 2003
(April 2004 to March 2005) (April 2003 to March 2004)
FY 2003 Increase/
(Decrease)
Knockdown Parts (Overseas)
Increase/(Decrease)
Increase/
(Decrease)
FY 2004
(April 2004 to March 2005)
FY 2003
- 25 -
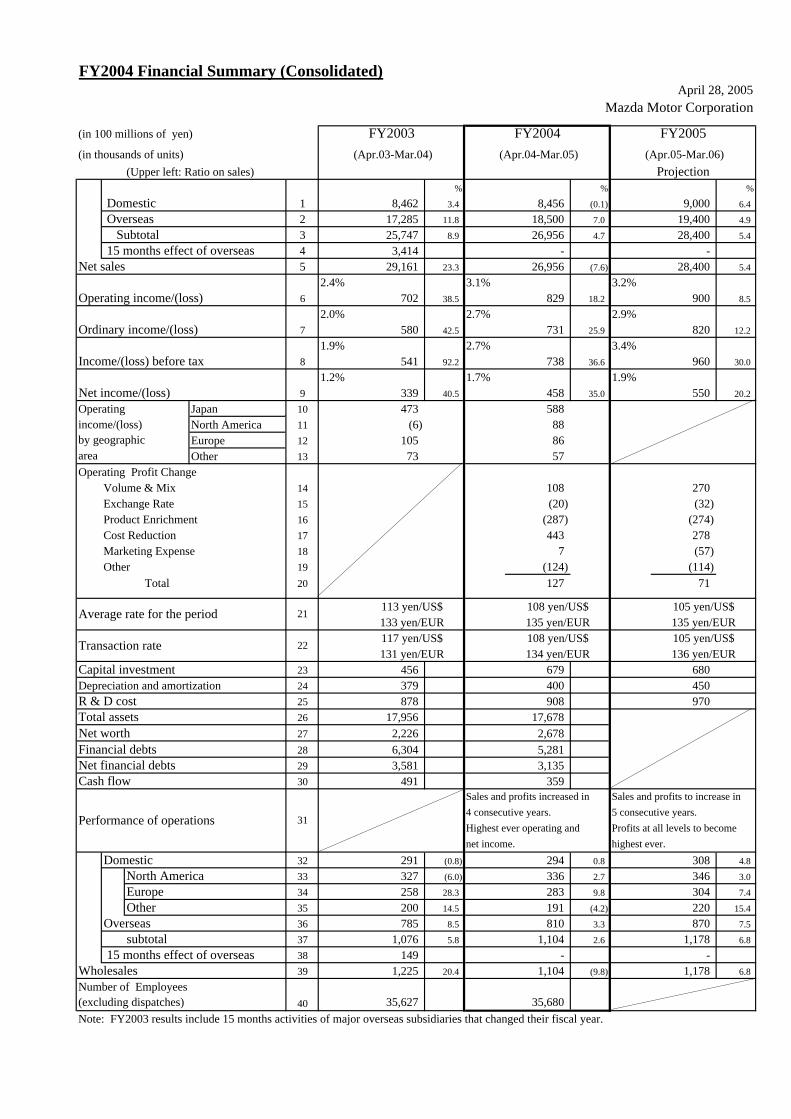
FY2004 Financial Summary (Consolidated)April 28, 2005
Mazda Motor Corporation
(in 100 millions of yen) FY2003 FY2004(in thousands of units) (Apr.03-Mar.04) (Apr.04-Mar.05)
(Upper left: Ratio on sales)% % %
Domestic 1 8,462 3.4 8,456 (0.1) 9,000 6.4
Overseas 2 17,285 11.8 18,500 7.0 19,400 4.9
Subtotal 3 25,747 8.9 26,956 4.7 28,400 5.4
15 months effect of overseas 4 3,414 - - Net sales 5 29,161 23.3 26,956 (7.6) 28,400 5.4
2.4% 3.1% 3.2%Operating income/(loss) 6 702 38.5 829 18.2 900 8.5
2.0% 2.7% 2.9%Ordinary income/(loss) 7 580 42.5 731 25.9 820 12.2
1.9% 2.7% 3.4%Income/(loss) before tax 8 541 92.2 738 36.6 960 30.0
1.2% 1.7% 1.9%Net income/(loss) 9 339 40.5 458 35.0 550 20.2
Operating Japan 10 473 588income/(loss) North America 11 (6) 88by geographic Europe 12 105 86area Other 13 73 57Operating Profit Change
Volume & Mix 14 108 270Exchange Rate 15 (20) (32)Product Enrichment 16 (287) (274)Cost Reduction 17 443 278Marketing Expense 18 7 (57)Other 19 (124) (114)
Total 20 127 71
Capital investment 23 456 679 680Depreciation and amortization 24 379 400 450R & D cost 25 878 908 970Total assets 26 17,956 17,678Net worth 27 2,226 2,678Financial debts 28 6,304 5,281Net financial debts 29 3,581 3,135Cash flow 30 491 359
Domestic 32 291 (0.8) 294 0.8 308 4.8
North America 33 327 (6.0) 336 2.7 346 3.0
Europe 34 258 28.3 283 9.8 304 7.4
Other 35 200 14.5 191 (4.2) 220 15.4
Overseas 36 785 8.5 810 3.3 870 7.5
subtotal 37 1,076 5.8 1,104 2.6 1,178 6.8
15 months effect of overseas 38 149 - - Wholesales 39 1,225 20.4 1,104 (9.8) 1,178 6.8
Number of Employees(excluding dispatches) 35,627 35,680Note: FY2003 results include 15 months activities of major overseas subsidiaries that changed their fiscal year.
40
31
117 yen/US$131 yen/EUR
FY2005 (Apr.05-Mar.06)
Projection
Sales and profits increased in
108 yen/US$ 105 yen/US$134 yen/EUR 136 yen/EUR
135 yen/EUR 135 yen/EUR
Transaction rate
Performance of operations
133 yen/EUR113 yen/US$21
22
108 yen/US$ 105 yen/US$Average rate for the period
highest ever.Highest ever operating and
Sales and profits to increase in5 consecutive years.Profits at all levels to become
net income.
4 consecutive years.