fy15 2nd quarter financial results 2014年度第2四半期...
TRANSCRIPT

1
2014年度 第2四半期 決算説明会FY15 2nd Quarter Financial Results
Honda Motor Co., Ltd.October 28, 2014
CR-V(North America)

2
- FY15 2nd Quarter Financial Results - FY15 Financial Forecast - Dividend
Tetsuo IwamuraExecutive Vice President
Topics

Results SummaryOperating income for the second quarter was 164.4 billion yen due mainly to- Increased competitiveness in the North American and
Japanese automobile markets- Positive impact of new automobile model introductions in Asia- Continuous cost reduction efforts
3
1,000
2,000
3,000
1,000
1,200
1,400
1,900
2,200
2,500
2,800
600
700
800
9002,743
869 8801,295 1,286
2,890.23,014.7
0
50
100
150
200171.4 164.4
2,585
0
50
100
150
200
120.3141.8
Outline of FY15 2nd Quarter Results Summary (Consolidated)
2nd Quarter Results FY14 and FY15
Consolidated Unit Sales Net Sales / Operating IncomeUnit (thousand) Yen (billion)
FY14 FY15
Net Sales Operating IncomeMotorcycles Automobiles Power Products Net Income *1For *1, please refer to footnotes on page 34
4
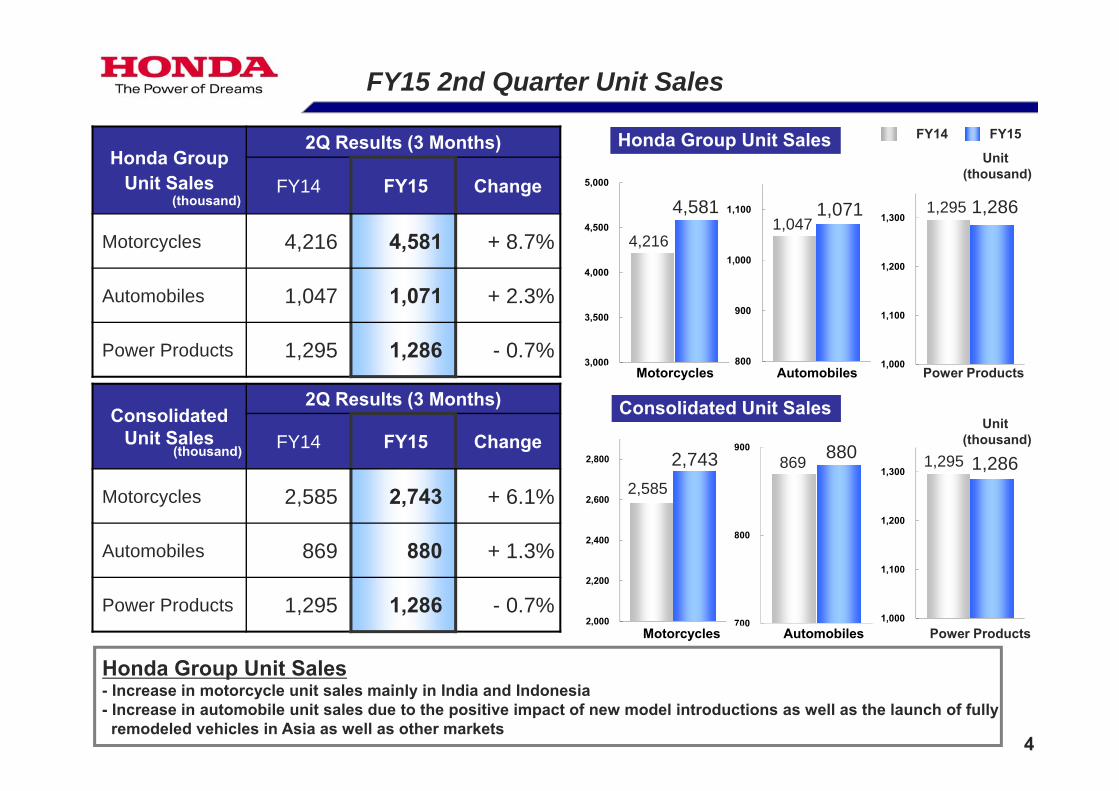
Honda Group Unit Sales
2Q Results (3 Months)
FY14 FY15 Change
Motorcycles 4,216 4,581 + 8.7%
Automobiles 1,047 1,071 + 2.3%
Power Products 1,295 1,286 - 0.7%
Consolidated Unit Sales
2Q Results (3 Months)
FY14 FY15 Change
Motorcycles 2,585 2,743 + 6.1%
Automobiles 869 880 + 1.3%
Power Products 1,295 1,286 - 0.7%
3,000
3,500
4,000
4,500
5,000
800
900
1,000
1,100
1,000
1,100
1,200
1,300
2,000
2,200
2,400
2,600
2,800
700
800
900
4,216
4,5811,047
1,071 1,295 1,286
2,585
2,743 869 880
1,000
1,100
1,200
1,3001,295 1,286
FY15 2nd Quarter Unit Sales
(thousand)
(thousand)
Honda Group Unit Sales
Consolidated Unit Sales
Unit (thousand)
Unit (thousand)
Motorcycles Automobiles Power Products
Motorcycles Automobiles Power Products
FY14 FY15
Honda Group Unit Sales- Increase in motorcycle unit sales mainly in India and Indonesia- Increase in automobile unit sales due to the positive impact of new model introductions as well as the launch of fully
remodeled vehicles in Asia as well as other markets

6.5%5.9%
7.6%
5.3%
6.6%
5.5%
4%
6%
8%
1Q 2Q 3Q 4Q
FY14FY15
184.9 171.4
228.5
165.2
198.0
164.4
0
50
100
150
200
250
1Q 2Q 3Q 4Q
FY14FY15
5
Financial Results2Q Results (3 Months)
FY14 FY15 Change
Net Sales 2,890.2 3,014.7 + 4.3%
Operating Income 171.4 164.4 - 4.1%
Operating Margin 5.9% 5.5% - 0.4pt
Income before income taxes 165.5 179.8 + 8.6%
Equity in income of affiliates 31.6 22.7 - 28.2%
Net Income 120.3 141.8 + 17.9%
EPS (Yen) 66.79 78.73 + 11.94
US Dollar 99 104 Yen down by 5 yen
Euro 131 138 Yen down by 7 yen
FY15 2nd Quarter Financial Results (Consolidated)
Yen (billion)
Average Rates (Yen)
Operating Income
*2
*1
For *1 and *2, please refer to footnotes on page 34
Yen (billion) Operating Margin
Financial Summary- Net sales and other operating revenue increased by 4.3% mainly due to a rise in motorcycle and automobile unit sales as well as the positive impact of foreign exchange effects
- Operating income decreased by 4.1% mostly due to a decrease in income associated with changes in sales volume and model mix and increased R&D expenses, despite cost reduction efforts and positive FOREX effects
- Net income increased by 17.9%

6
Financial ResultsSix Month Results
FY14 FY15 ChangeNet sales 5,724.3 6,003.0 + 4.9%Operating income 356.4 362.4 + 1.7%
Operating margin 6.2% 6.0% - 0.2ptIncome before income taxes 337.6 378.6 + 12.2%Equity in income of affiliates 63.4 61.3 - 3.3%Net Income *1 242.8 288.4 + 18.8%
EPS (Yen) *2 134.75 160.02 + 25.27
US Dollar 99 103 Yen down by4 yen
Euro 130 139 Yen down by9 yen
Honda Group Unit Sales(Consolidated Unit Sales)
Six Month ResultsFY14 FY15 Change
Motorcycles 8,270(4,956)
8,718(5,200)
+ 5.4%(+ 4.9%)
Automobiles 2,046(1,727)
2,132(1,775)
+ 4.2%(+ 2.8%)
Power Products 2,884(2,884)
2,796(2,796)
- 3.1%(- 3.1%)
FY15 Six Months Financial Results (Consolidated)
(thousand)
Yen (billion)
For *1 and *2, please refer to footnotes on page 34Average Rates (Yen)
7
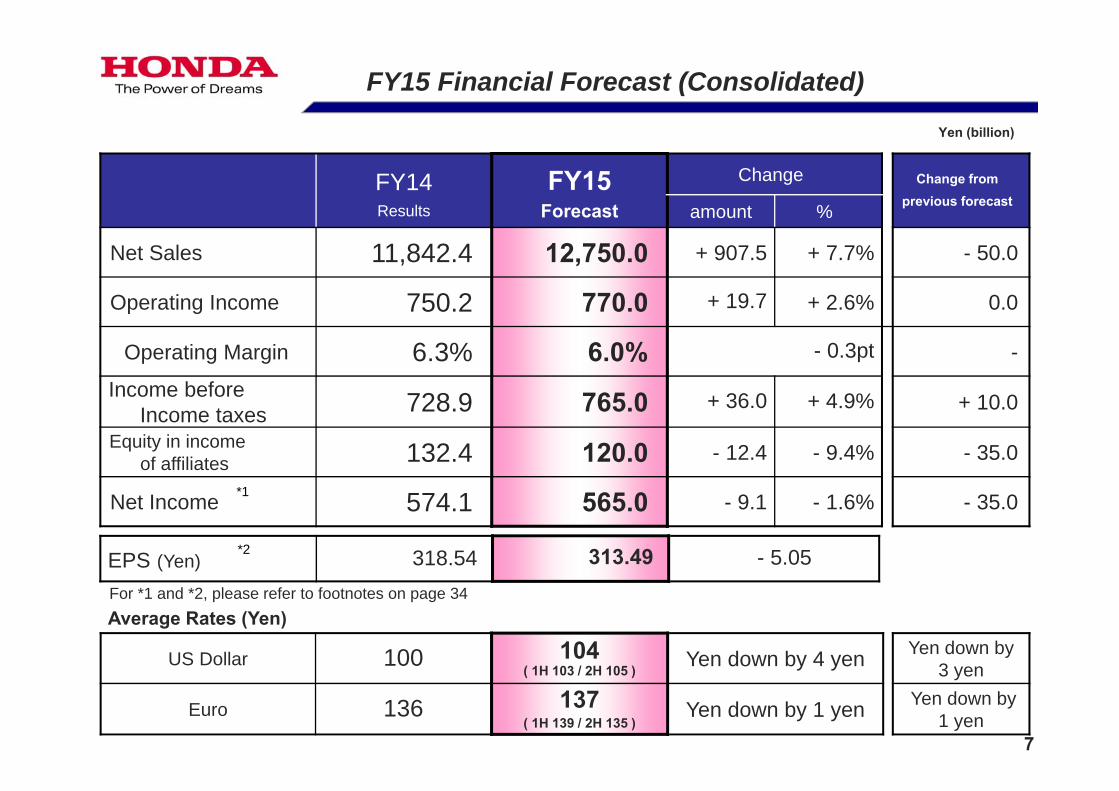
FY14Results
FY15Forecast
Change Change from previous forecastamount %
Net Sales 11,842.4 12,750.0 + 907.5 + 7.7% - 50.0
Operating Income 750.2 770.0 + 19.7 + 2.6% 0.0
Operating Margin 6.3% 6.0% - 0.3pt -
Income beforeIncome taxes 728.9 765.0 + 36.0 + 4.9% + 10.0
Equity in incomeof affiliates 132.4 120.0 - 12.4 - 9.4% - 35.0
Net Income 574.1 565.0 - 9.1 - 1.6% - 35.0
EPS (Yen) 318.54 313.49 - 5.05
US Dollar 100 104( 1H 103 / 2H 105 ) Yen down by 4 yen Yen down by
3 yen
Euro 136 137( 1H 139 / 2H 135 )
Yen down by 1 yen Yen down by1 yen
FY15 Financial Forecast (Consolidated)
*1
*2
For *1 and *2, please refer to footnotes on page 34Average Rates (Yen)
Yen (billion)

8
FY14Results
FY15Forecast
Change Change from previousforecastamount %
Net sales 3,488.3 3,500.0 + 11.6 + 0.3% - 140.0
Operating income 125.6 120.0 - 5.6 - 4.5% - 20.0
Operating Margin 3.6% 3.4% - 0.2pt - 0.4pt
Ordinary income 345.9 355.0 + 9.0 + 2.6% 0.0
Net income 262.9 285.0 + 22.0 + 8.4% + 5.0
US Dollar 100 104( 1H 103 / 2H 105 ) Yen down by 4 yen Yen down by
3 yen
Euro 136 137( 1H 139 / 2H 135 )
Yen down by 1 yen Yen down by1 yen
Average Rates (Yen)
FY15 Financial Forecast (Parent Company Only)Yen (billion)
9
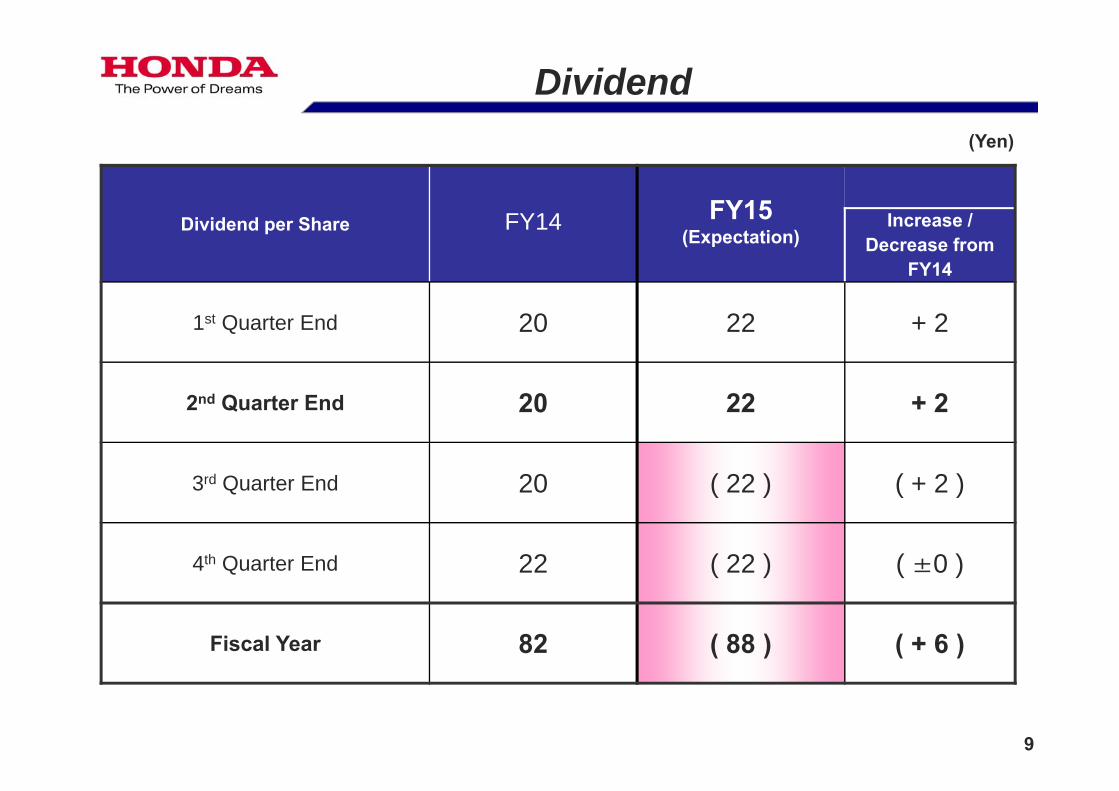
Dividend per Share FY14 FY15(Expectation)
Increase / Decrease from
FY14
1st Quarter End 20 22 + 2
2nd Quarter End 20 22 + 2
3rd Quarter End 20 ( 22 ) ( + 2 )
4th Quarter End 22 ( 22 ) ( ±0 )
Fiscal Year 82 ( 88 ) ( + 6 )
Dividend(Yen)

10
Topics
- FY15 2nd Quarter and Six Months Financial Results- Net Sales and Other Operating Revenue- Change in Income before Income Taxes- Business & Geographical Segment Information- Equity in Income of Affiliates- Capital Expenditure
- FY15 Financial Forecast
Kohei TakeuchiOperating Officer and DirectorChief Financial Officer
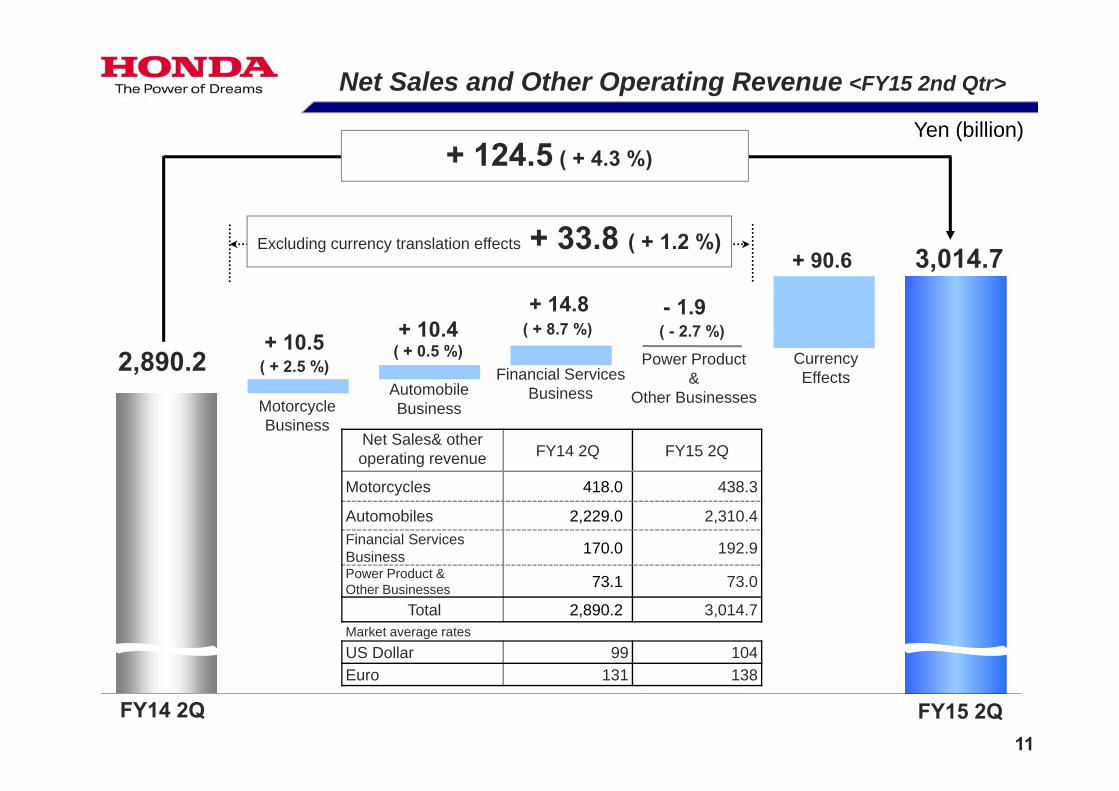
( + 2.5 %)( + 0.5 %)
( + 8.7 %) ( - 2.7 %)
Excluding currency translation effects + 33.8 ( + 1.2 %)
2,890.2+ 10.5 + 10.4
+ 14.8 - 1.9
+ 90.6 3,014.7
+ 124.5 ( + 4.3 %)
Net Sales& other operating revenue FY14 2Q FY15 2Q
Motorcycles 418.0 438.3
Automobiles 2,229.0 2,310.4Financial Services Business 170.0 192.9Power Product &Other Businesses 73.1 73.0
Total 2,890.2 3,014.7Market average ratesUS Dollar 99 104Euro 131 138
11
Net Sales and Other Operating Revenue <FY15 2nd Qtr>
Yen (billion)
AutomobileBusiness
Financial ServicesBusiness
MotorcycleBusiness
Currency Effects
Power Product&
Other Businesses
FY14 2Q FY15 2Q
( + 3.7 %)
( + 2.2 %) ( + 9.2%) ( - 3.1 %)
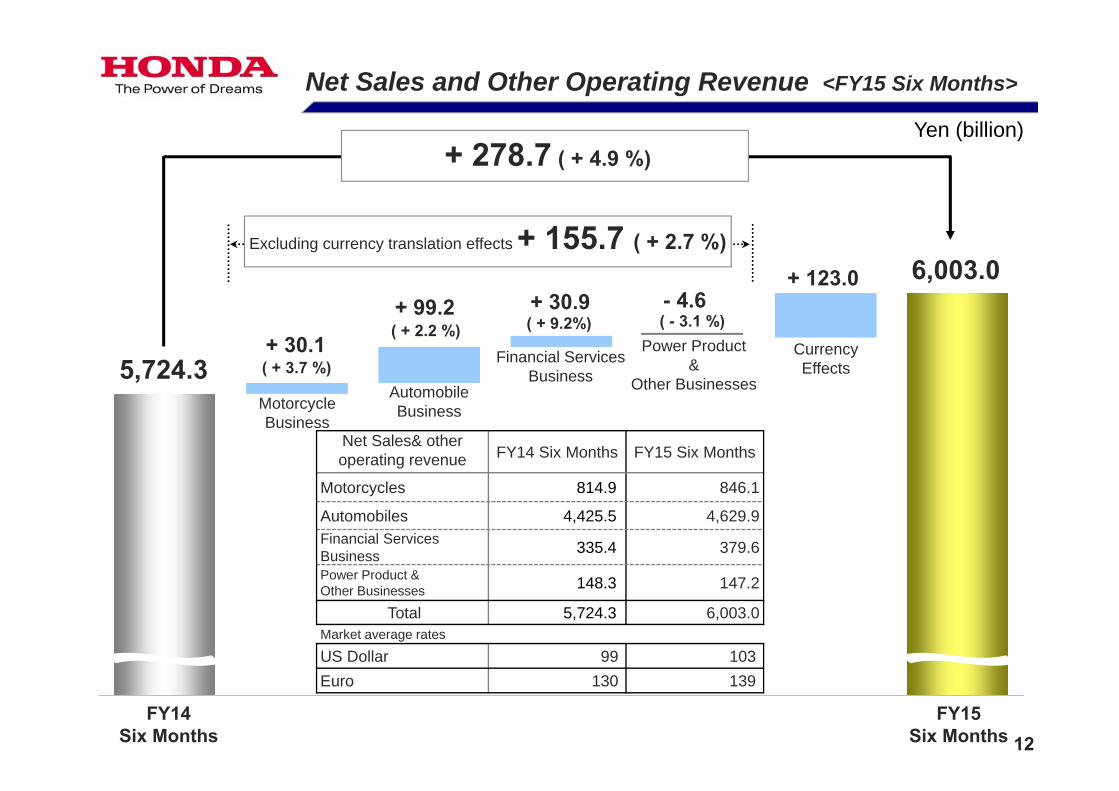
Excluding currency translation effects + 155.7 ( + 2.7 %)
5,724.3+ 30.1
+ 99.2 + 30.9 - 4.6 + 123.0 6,003.0
+ 278.7 ( + 4.9 %)
Net Sales& other operating revenue FY14 Six Months FY15 Six Months
Motorcycles 814.9 846.1
Automobiles 4,425.5 4,629.9Financial Services Business 335.4 379.6
Power Product &Other Businesses 148.3 147.2
Total 5,724.3 6,003.0Market average rates
US Dollar 99 103Euro 130 139
12
Net Sales and Other Operating Revenue <FY15 Six Months>
AutomobileBusiness
Financial ServicesBusiness
MotorcycleBusiness
Currency Effects
Power Product&
Other Businesses
FY14Six Months
FY15Six Months
Yen (billion)
13
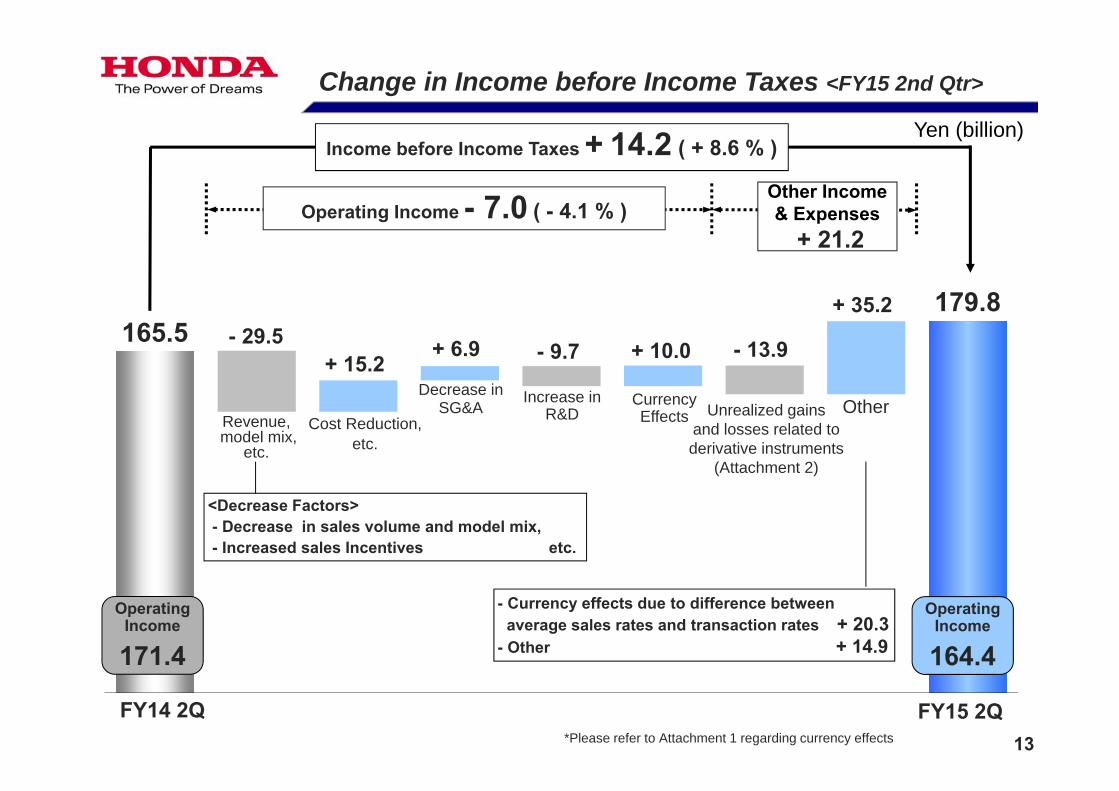
Income before Income Taxes + 14.2 ( + 8.6 % )
165.5179.8
- 29.5+ 15.2
+ 6.9 - 9.7 + 10.0 - 13.9
+ 35.2
Operating Income - 7.0 ( - 4.1 % )Other Income& Expenses
+ 21.2
Operating Income
171.4
Operating Income
164.4
Change in Income before Income Taxes <FY15 2nd Qtr>
Yen (billion)
FY14 2Q FY15 2Q*Please refer to Attachment 1 regarding currency effects
Revenue,model mix,
etc.
Cost Reduction,etc.
Decrease inSG&A
Increase inR&D
CurrencyEffects OtherUnrealized gains
and losses related toderivative instruments
(Attachment 2)
<Decrease Factors>- Decrease in sales volume and model mix,- Increased sales Incentives etc.
- Currency effects due to difference between average sales rates and transaction rates + 20.3
- Other + 14.9
14
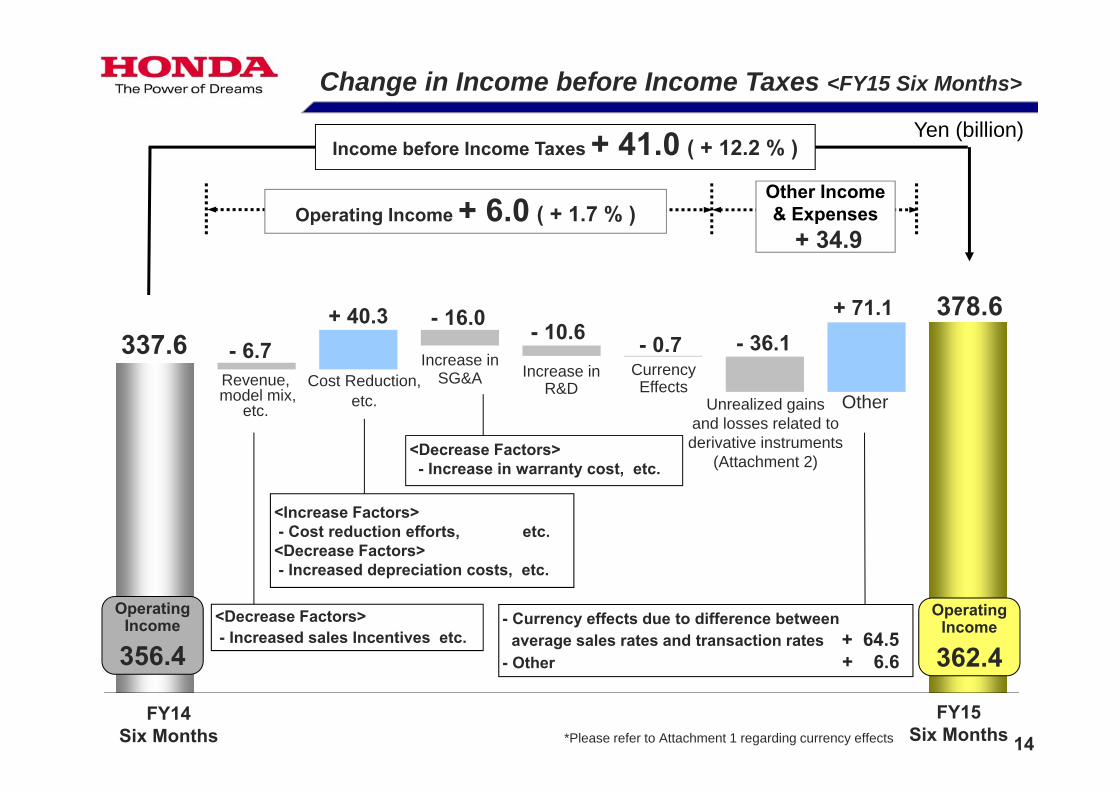
Income before Income Taxes + 41.0 ( + 12.2 % )
378.6- 6.7
+ 40.3 - 16.0 - 10.6 - 0.7 - 36.1+ 71.1
Operating Income + 6.0 ( + 1.7 % )Other Income& Expenses
+ 34.9
337.6
Operating Income
356.4
Operating Income
362.4
Change in Income before Income Taxes <FY15 Six Months>
Yen (billion)
FY14Six Months
FY15Six Months*Please refer to Attachment 1 regarding currency effects
Revenue,model mix,
etc.
Cost Reduction,etc.
Increase inSG&A Increase in
R&DCurrencyEffects
OtherUnrealized gainsand losses related toderivative instruments
(Attachment 2)
<Decrease Factors>- Increased sales Incentives etc.
<Increase Factors>- Cost reduction efforts, etc.
<Decrease Factors>- Increased depreciation costs, etc.
<Decrease Factors>- Increase in warranty cost, etc.
- Currency effects due to difference between average sales rates and transaction rates + 64.5
- Other + 6.6

4,054 4,216 4,251
4,500
4,137
4,581
3,600
3,800
4,000
4,200
4,400
4,600
4,800
Japan 54 63 52 57 48 50North
America 62 68 63 83 62 69Europe 52 38 27 49 60 47
Asia 3,479 3,536 3,678 3,843 3,593 3,998Other
Regions 407 511 431 468 374 417Total 4,054 4,216 4,251 4,500 4,137 4,581
+ 365( + 8.7 % )
15
Motorcycle - Honda Group Unit Sales(Motorcycles + All-Terrain Vehicles, etc.)
Unit (Thousand)
Activa (India)
1Q 2Q 3Q 4Q 1Q 2QFY14 FY15
<Asia>・ India: Increased sales of Activa series・Indonesia: Increased sales of BeAT-FI, Vario Series・Vietnam: Increase in sales of Wave Series<Other Regions>・Brazil: Decrease in sales of CG150FAN

42.5 45.5 34.5 42.9 43.9 38.1
10.7% 10.9%
8.6%9.6%
10.8%
8.7%
-4%
-2%
0%
2%
4%
6%
8%
10%
12%
14%
0
30
60
90
120
150
FY14 FY151Q 2Q 3Q 4Q 1Q 2Q
Honda GroupUnit Sales
(Consolidated Unit Sales)
4,054(2,371)
4,216(2,585)
4,251(2,657)
4,500(2,730)
4,137(2,457)
4,581(2,743)
Net Sales 396.8 418.0 400.1 448.5 407.7 438.3( + 4.9 % )
( - 16.3 % )
16
Unit (thousand)Yen (billion)
1Q 2Q 3Q 4Q 1Q 2QFY14 FY15
+ 20.2 (Currency Effect + 9.7) Operating IncomeOperating Margin
Yen (billion)
<Decrease Factors>- Increased SG&A expenses, etc
Motorcycle Business Net Sales/Operating Income (Margin)

999 1,047 1,082 1,195
1,061 1,071
700
800
900
1,000
1,100
1,200
1,300Honda MOBILIO
(India)
Japan 140 180 216 282 202 176North
America 459 447 465 386 445 434Europe 40 40 38 51 40 45
Asia 285 309 287 405 316 350Other
Regions 75 71 76 71 58 66Total 999 1,047 1,082 1,195 1,061 1,071
+ 24( + 2.3 % )
17
Automobiles - Honda Group Unit Sales
Unit (thousand)
1Q 2Q 3Q 4Q 1Q 2QFY14 FY15
・ Positive impact of Honda MOBILIOintroduction in Indonesia
・ Positive impact of Honda MOBILIO and CITYintroductions in India
・ Decrease in sales volume in Thailand, United States and Japan

96.3 80.1154.2
72.9 99.8 79.1
4.4%3.6%
6.5%
3.1%4.3%
3.4%
0%
2%
4%
6%
8%
10%
12%
14%
0
100
200
300
400( + 3.7 % )
( - 1.3 % )
FY14 FY151Q 2Q 3Q 4Q 1Q 2Q
Honda GroupUnit Sales
(Consolidated Unit Sales)
999(858)
1,047(869)
1,082(900)
1,195(933)
1,061(895)
1,071(880)
Net Sales 2,200.9 2,233.1 2,377.7 2,383.0 2,323.7 2,316.4
18
Automobile Business Net Sales/Operating Income (Margin)Unit (thousand)Yen (billion)
Operating IncomeOperating Margin
Yen (billion) + 83.3 (Currency Effect + 70.9)
1Q 2Q 3Q 4Q 1Q 2QFY14 FY15
<Increase Factors>- Increased Cost reduction efforts,- Decreased SG&A expenses, etc
<Decrease Factors>- Increased incentive spending,- Increased R&D expenses, etc
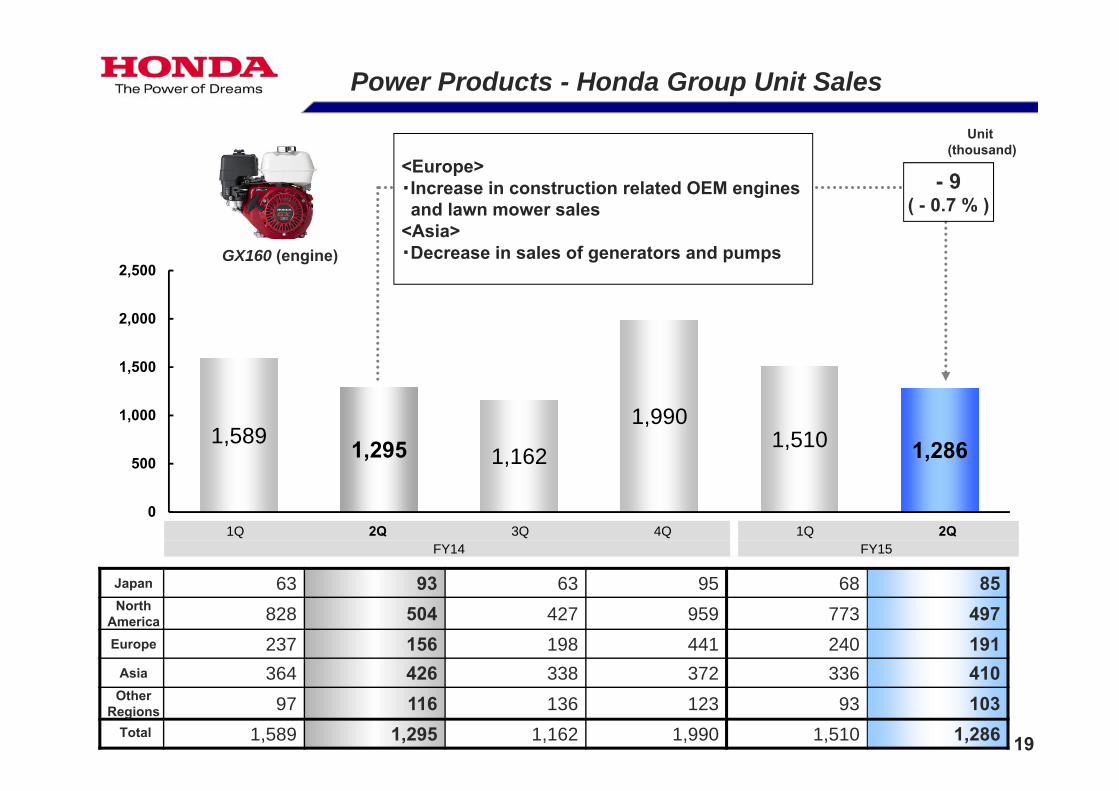
1,589 1,295 1,162
1,990 1,510 1,286
0
500
1,000
1,500
2,000
2,500
Japan 63 93 63 95 68 85North
America 828 504 427 959 773 497Europe 237 156 198 441 240 191
Asia 364 426 338 372 336 410Other
Regions 97 116 136 123 93 103Total 1,589 1,295 1,162 1,990 1,510 1,286
GX160 (engine)
- 9( - 0.7 % )
19
Power Products - Honda Group Unit Sales
Unit (thousand)
1Q 2Q 3Q 4Q 1Q 2QFY14 FY15
<Europe>・Increase in construction related OEM engines and lawn mower sales
<Asia>・Decrease in sales of generators and pumps

1.3 -0.8
-2.8 0.5
2.3 -1.0
1.7%
-1.1%
-3.7%
0.7%
3.1%
-1.4%
-5%
0%
5%
10%
-10
0
10
20
FY14 FY151Q 2Q 3Q 4Q 1Q 2Q
Honda GroupUnit Sales
(Consolidated Unit Sales)
1,589(1,589)
1,295(1,295)
1,162(1,162)
1,990(1,990)
1,510(1,510)
1,286(1,286)
Net Sales 77.9 75.9 78.6 85.6 77.0 75.4( - 0.7 % )
20
1Q 2Q 3Q 4Q 1Q 2QFY14 FY15
Unit (thousand)Yen (billion)
Operating IncomeOperating Margin
Yen (billion) - 0.5 (Currency Effect + 1.8 )
<Increase Factors>- Cost reduction efforts, etc
<Decrease Factors>- Increased SG&A expenses, etc
Power Product & Other Businesses Net Sales/Operating Income (Margin)
FY14 FY151Q 2Q 3Q 4Q 1Q 2Q
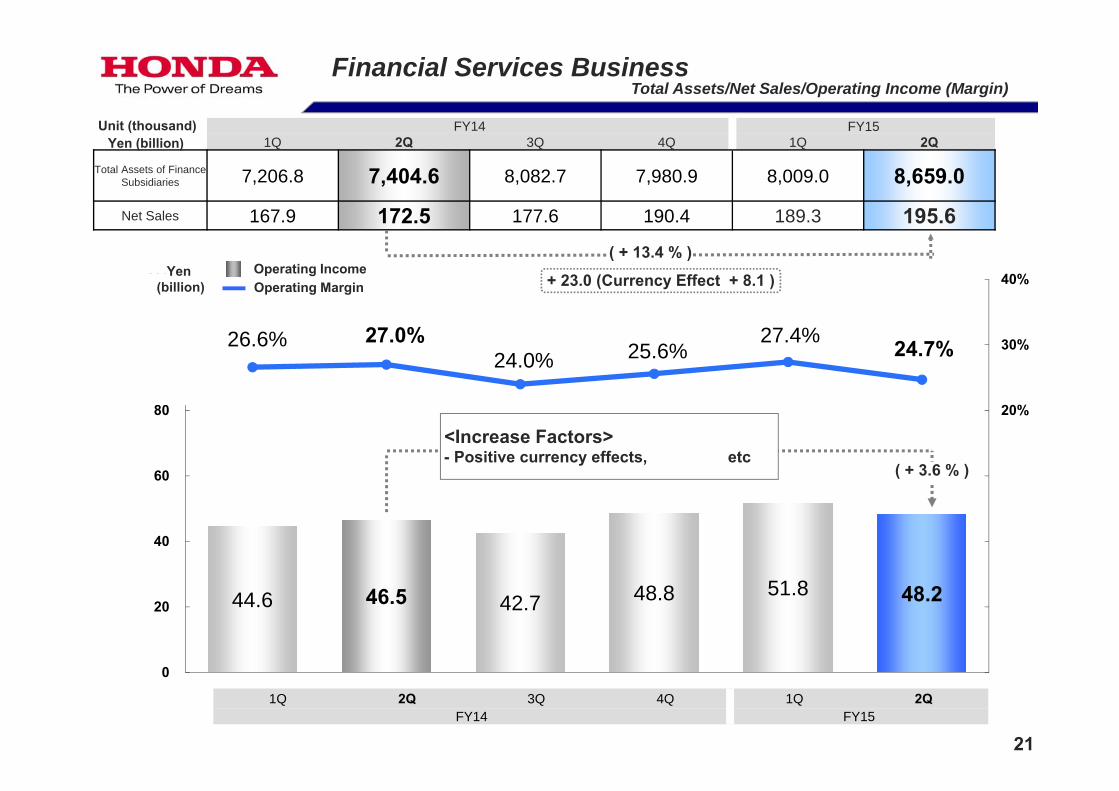
Total Assets of Finance Subsidiaries 7,206.8 7,404.6 8,082.7 7,980.9 8,009.0 8,659.0Net Sales 167.9 172.5 177.6 190.4 189.3 195.6
44.6 46.5 42.7 48.8 51.8 48.2
26.6% 27.0%24.0% 25.6%
27.4% 24.7%
-20%
-10%
0%
10%
20%
30%
40%
0
20
40
60
80
100
120
( + 13.4 % )
( + 3.6 % )
21
Financial Services BusinessTotal Assets/Net Sales/Operating Income (Margin)
Unit (thousand)Yen (billion)
Operating IncomeOperating Margin
Yen (billion) + 23.0 (Currency Effect + 8.1 )
<Increase Factors>- Positive currency effects, etc
1Q 2Q 3Q 4Q 1Q 2QFY14 FY15

22
88.1
176.5
0.5
91.2 82.1
178.9
1.3 100.0
-50
0
50
100
150
200
- 6.8 % + 9.7 %
(10.8 %)
(4.0 %)
(0.3 %)
(26.8 %)
(0.9 %)(26.0 %)
(3.9 %)
(9.7 %)
+ 1.4 %+ 144.5 %
Net Sales/Operating Income (Margin) by Business Segment <FY15 Six Months >
Motorcycle Business
Automobile Business
Power Product and Other
Businesses
Financial Services Business
Six Months Six Months Six Months Six Months
FY14 FY15 FY14 FY15 FY14 FY15 FY14 FY15
Honda GroupUnit Sales
(Consolidated Unit Sales)
8,270 8,718 2,046 2,132 2,884 2,796 - -(4,956) (5,200) (1,727) (1,775) (2,884) (2,796) (-) (-)
Net Sales 814.9 846.1 4,434.1 4,640.2 153.9 152.4 340.5 384.9
Unit (thousand)Yen (billion)
Operating Income : Yen (billion) Operating Margin : (%)
Six Months Six Months Six Months Six Months
FY14 FY15 FY14 FY15 FY14 FY15 FY14 FY15
23
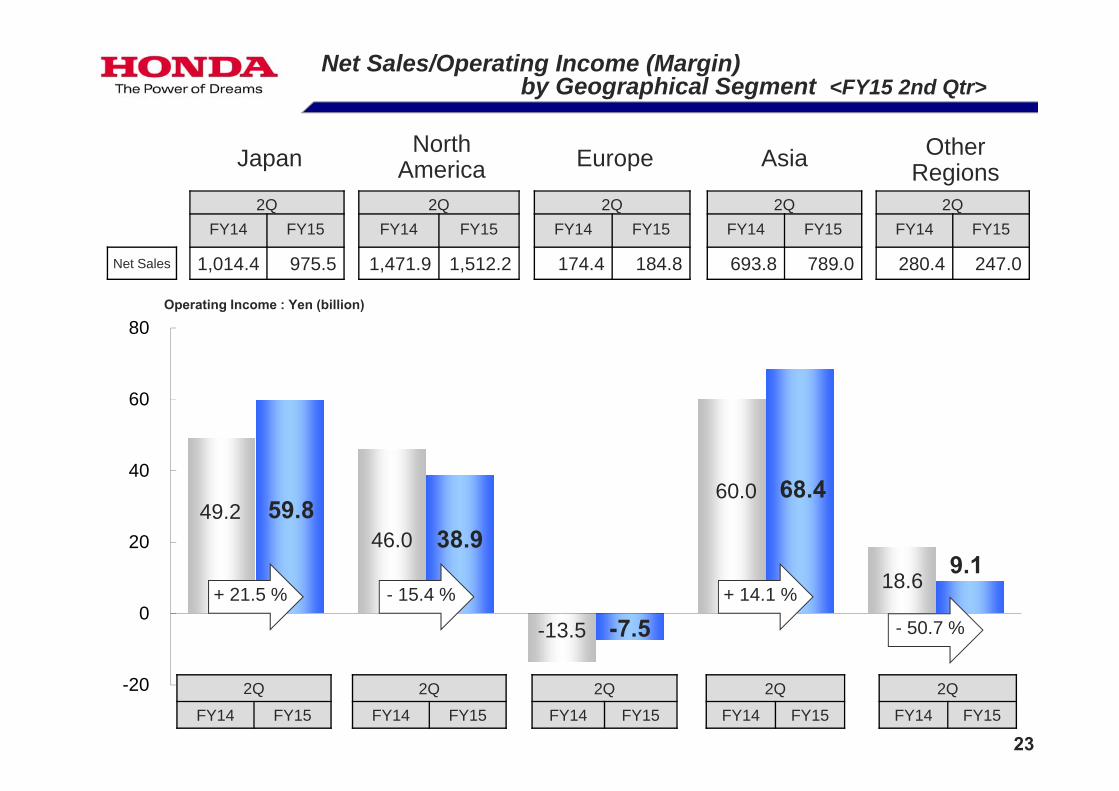
49.2 46.0
-13.5
60.0
18.6
59.8 38.9
-7.5
68.4
9.1
-20
0
20
40
60
80
+ 21.5 % - 15.4 % + 14.1 %
- 50.7 %
Net Sales/Operating Income (Margin) by Geographical Segment <FY15 2nd Qtr>
Japan North America Europe Asia Other
Regions2Q 2Q 2Q 2Q 2Q
FY14 FY15 FY14 FY15 FY14 FY15 FY14 FY15 FY14 FY15
Net Sales 1,014.4 975.5 1,471.9 1,512.2 174.4 184.8 693.8 789.0 280.4 247.0
2Q 2Q 2Q 2Q 2QFY14 FY15 FY14 FY15 FY14 FY15 FY14 FY15 FY14 FY15
Operating Income : Yen (billion)
24
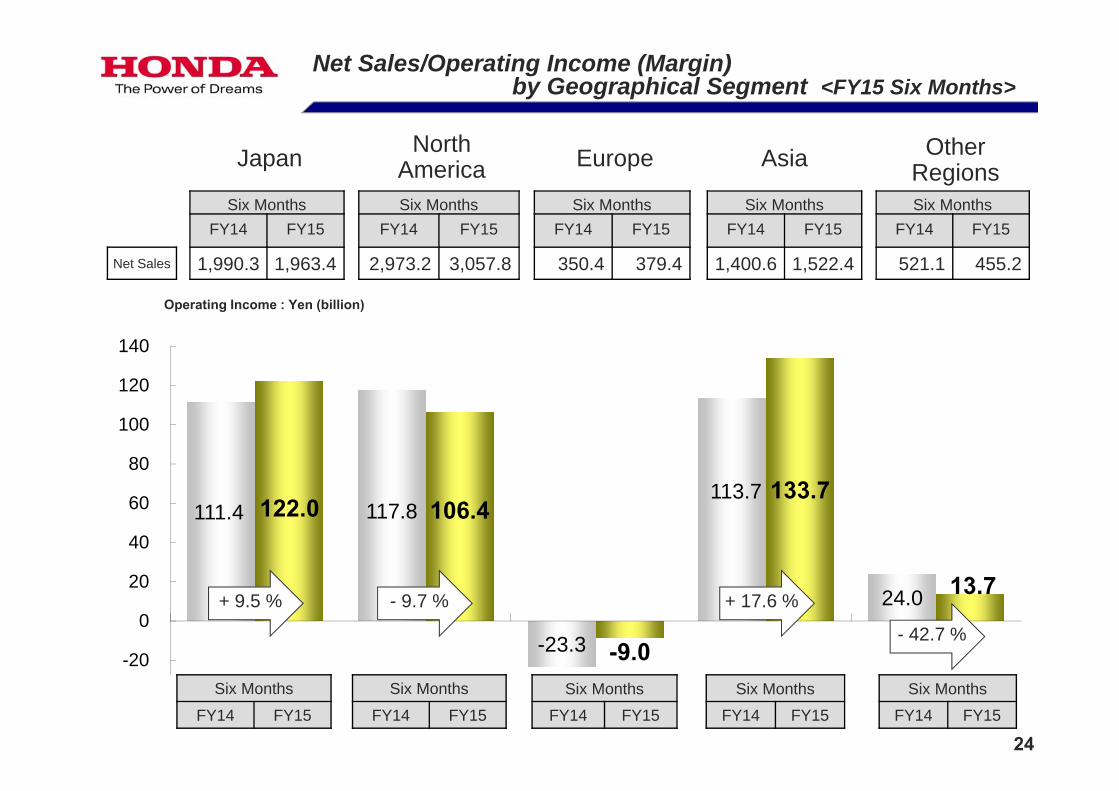
111.4 117.8
-23.3
113.7
24.0
122.0 106.4
-9.0
133.7
13.7
-60
-40
-20
0
20
40
60
80
100
120
140
+ 9.5 % - 9.7 % + 17.6 %
- 42.7 %
Japan North America Europe Asia Other
RegionsSix Months Six Months Six Months Six Months Six Months
FY14 FY15 FY14 FY15 FY14 FY15 FY14 FY15 FY14 FY15
Net Sales 1,990.3 1,963.4 2,973.2 3,057.8 350.4 379.4 1,400.6 1,522.4 521.1 455.2
Operating Income : Yen (billion)
Six Months Six Months Six Months Six Months Six MonthsFY14 FY15 FY14 FY15 FY14 FY15 FY14 FY15 FY14 FY15
Net Sales/Operating Income (Margin) by Geographical Segment <FY15 Six Months>
25
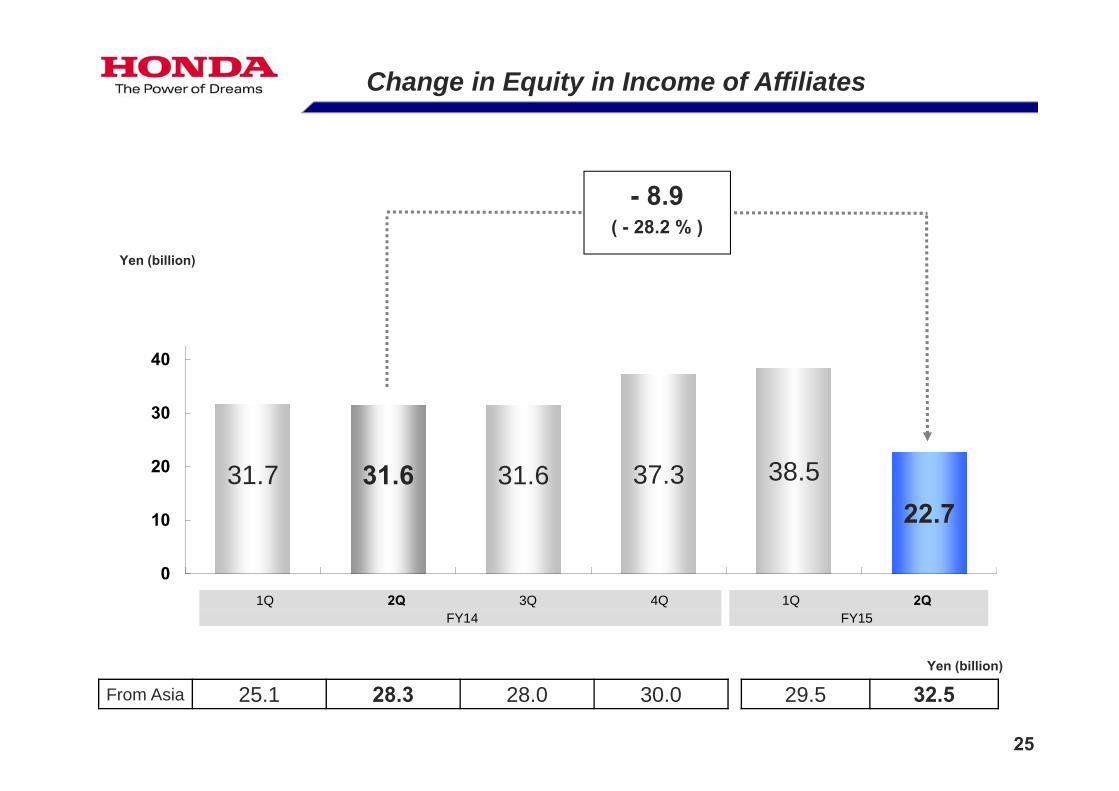
31.7 31.6 31.6 37.3 38.522.7
0
10
20
30
40
50
60
70 - 8.9( - 28.2 % )
From Asia 25.1 28.3 28.0 30.0 29.5 32.5
Change in Equity in Income of Affiliates
Yen (billion)
1Q 2Q 3Q 4Q 1Q 2QFY14 FY15
Yen (billion)
26
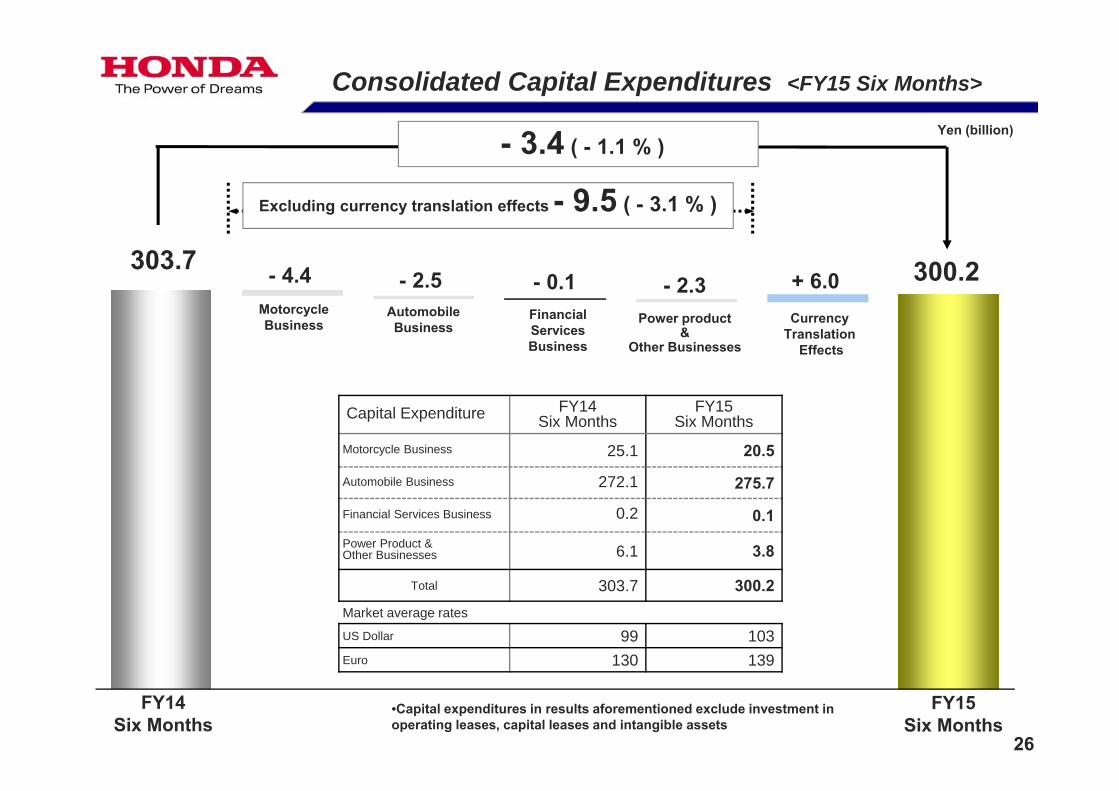
- 2.5303.7 - 4.4 - 0.1 - 2.3 + 6.0 300.2
- 3.4 ( - 1.1 % )
Capital Expenditure FY14 Six Months
FY15 Six Months
Motorcycle Business 25.1 20.5
Automobile Business 272.1 275.7
Financial Services Business 0.2 0.1Power Product & Other Businesses 6.1 3.8
Total 303.7 300.2Market average rates
US Dollar 99 103Euro 130 139
Excluding currency translation effects - 9.5 ( - 3.1 % )
Consolidated Capital Expenditures <FY15 Six Months>
Yen (billion)
MotorcycleBusiness
AutomobileBusiness
FinancialServicesBusiness
Power product&
Other Businesses
Currency Translation
Effects
•Capital expenditures in results aforementioned exclude investment inoperating leases, capital leases and intangible assets
FY14Six Months
FY15Six Months

27
- FY15 2nd Quarter and Six Months Financial Results- Net Sales and Other Operating Revenue- Change in Income before Income Taxes- Business & Geographical Segment Information- Equity in Income of Affiliates- Capital Expenditure
- FY15 Financial Forecast
Topics
28
FY15PreviousForecast
FY15RevisedForecast
ChangeFY15
PreviousForecast
FY15RevisedForecast
ChangeFY15
PreviousForecast
FY15RevisedForecast
Change
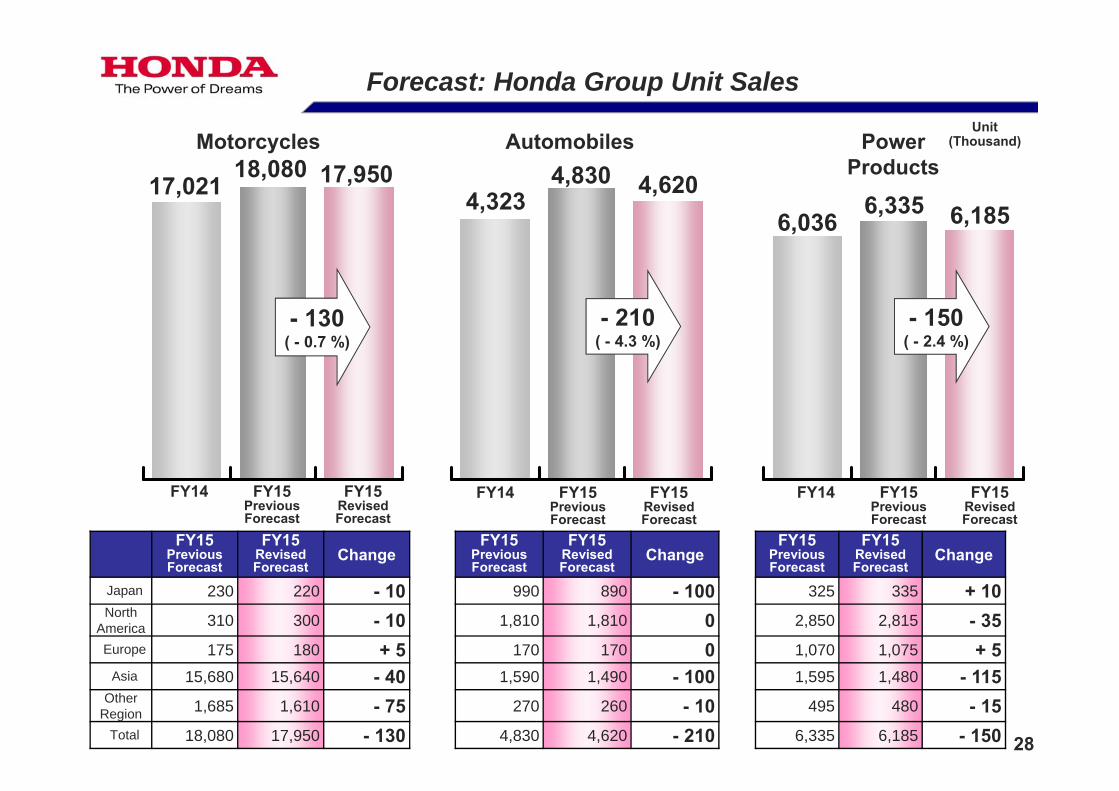
Japan 230 220 - 10 990 890 - 100 325 335 + 10North
America 310 300 - 10 1,810 1,810 0 2,850 2,815 - 35Europe 175 180 + 5 170 170 0 1,070 1,075 + 5
Asia 15,680 15,640 - 40 1,590 1,490 - 100 1,595 1,480 - 115Other
Region 1,685 1,610 - 75 270 260 - 10 495 480 - 15Total 18,080 17,950 - 130 4,830 4,620 - 210 6,335 6,185 - 150
17,02118,080 17,950
4,3234,830 4,620
6,0366,335 6,185
- 130( - 0.7 %)
- 150( - 2.4 %)
- 210( - 4.3 %)
Forecast: Honda Group Unit Sales
AutomobilesMotorcycles Power Products
Unit(Thousand)
FY14 FY15PreviousForecast
FY15RevisedForecast
FY14 FY15PreviousForecast
FY15RevisedForecast
FY14 FY15PreviousForecast
FY15RevisedForecast

29
10,34310,915 10,850 3,560
3,870 3,760 6,036 6,335 6,185
- 65( - 0.6 %)
- 110( - 2.8 %)
FY15PreviousForecast
FY15RevisedForecast
ChangeFY15
PreviousForecast
FY15RevisedForecast
ChangeFY15
PreviousForecast
FY15RevisedForecast
Change
Japan 230 220 - 10 980 880 - 100 325 335 + 10North
America 310 300 - 10 1,810 1,810 0 2,850 2,815 - 35Europe 175 180 + 5 170 170 0 1,070 1,075 + 5
Asia 8,515 8,540 + 25 640 640 0 1,595 1,480 - 115Other
Region 1,685 1,610 - 75 270 260 - 10 495 480 - 15Total 10,915 10,850 - 65 3,870 3,760 - 110 6,335 6,185 - 150
- 150( - 2.4 %)
Forecast: Consolidated Unit Sales
AutomobilesMotorcycles Power Products
Unit(Thousand)
FY14 FY15PreviousForecast
FY15RevisedForecast
FY14 FY15PreviousForecast
FY15RevisedForecast
FY14 FY15PreviousForecast
FY15RevisedForecast

30
FY14Results
FY15Forecast
Change Change from previous forecastamount %
Net Sales 11,842.4 12,750.0 + 907.5 + 7.7% - 50.0
Operating Income 750.2 770.0 + 19.7 + 2.6% 0.0
Operating Margin 6.3% 6.0% - 0.3pt -
Income beforeIncome taxes 728.9 765.0 + 36.0 + 4.9% + 10.0
Equity in incomeof affiliates 132.4 120.0 - 12.4 - 9.4% - 35.0
Net Income 574.1 565.0 - 9.1 - 1.6% - 35.0
EPS (Yen) 318.54 313.49 - 5.05
US Dollar 100 104( 1H 103 / 2H 105 ) Yen down by 4 yen Yen down by
3 yen
Euro 136 137( 1H 139 / 2H 135 )
Yen down by 1 yen Yen down by1 yen
FY15 Financial Forecast (Consolidated)
*1
*2
For *1 and *2, please refer to footnotes on page 34Average Rates (Yen)
Yen (billion)
31
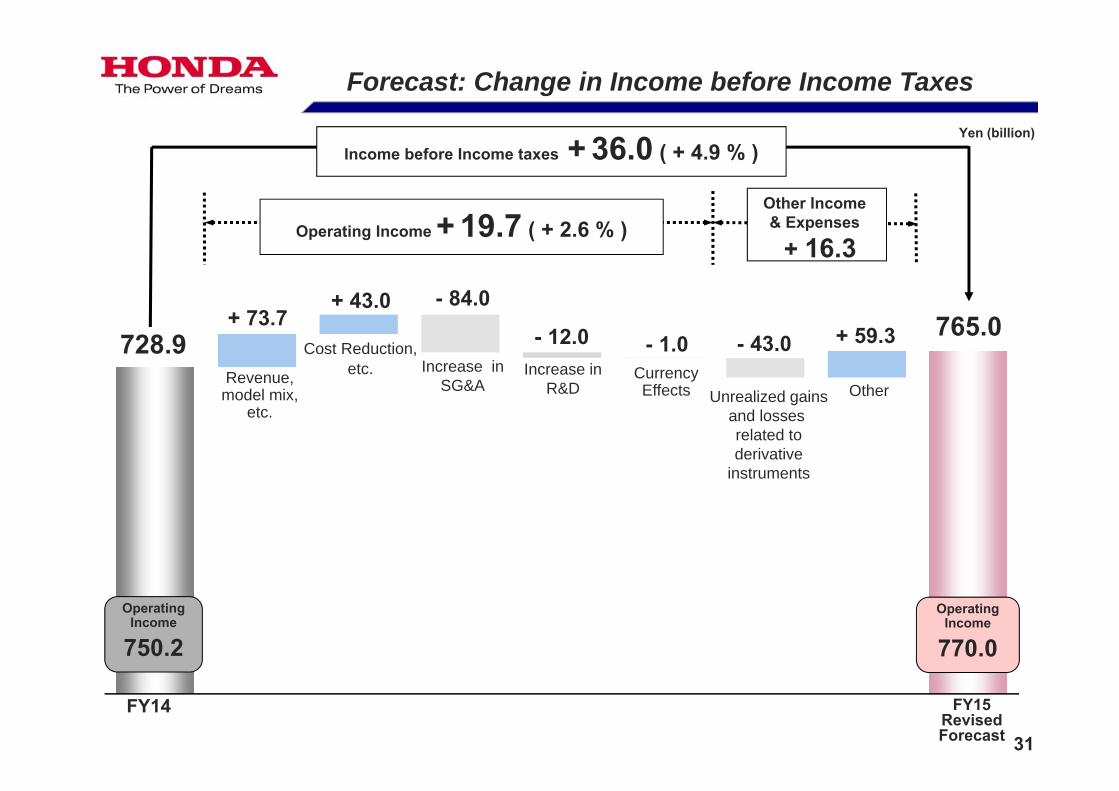
Income before Income taxes + 36.0 ( + 4.9 % )
728.9 765.0+ 73.7+ 43.0 - 84.0
- 12.0 - 1.0 - 43.0 + 59.3
Operating Income + 19.7 ( + 2.6 % )Other Income & Expenses
+ 16.3
Operating Income
770.0
Operating Income
750.2
Forecast: Change in Income before Income Taxes
FY15RevisedForecast
FY14
Revenue,model mix,
etc.
Cost Reduction, etc. Increase in
SG&AIncrease in
R&DCurrency Effects Unrealized gains
and losses related toderivative
instruments
Other
Yen (billion)
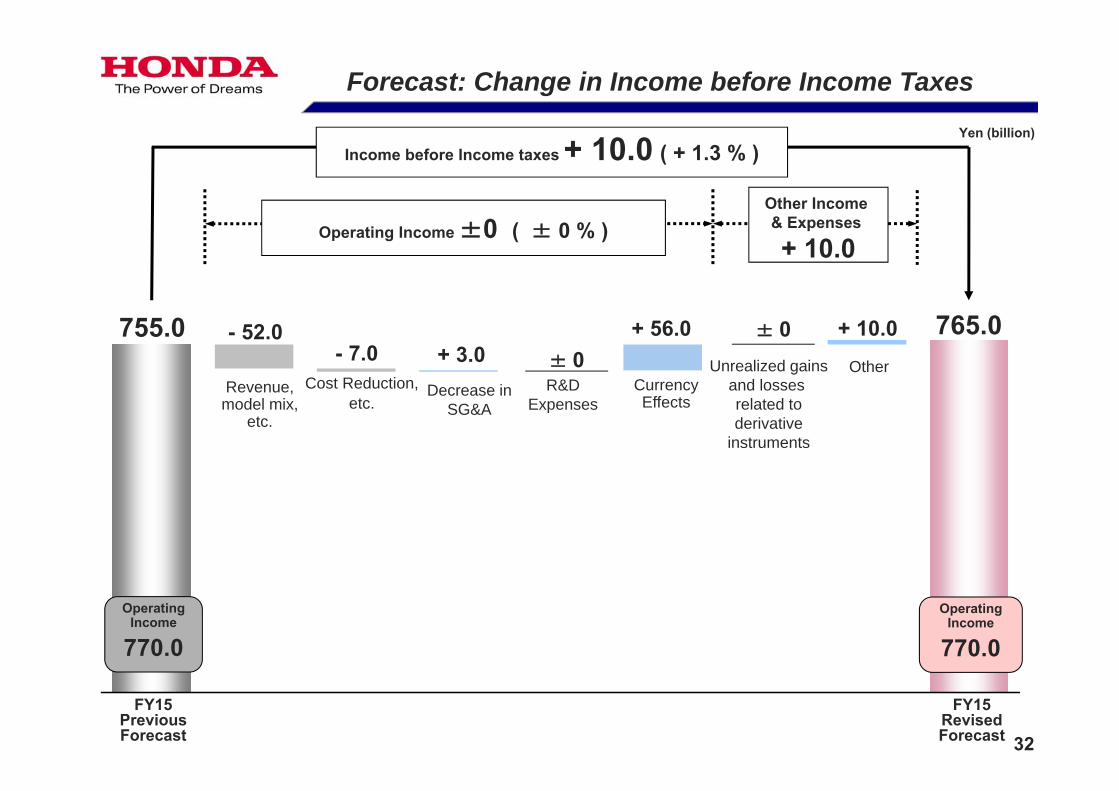
755.0 765.0
Operating Income ±0 ( ± 0 % )Other Income & Expenses
+ 10.0
Income before Income taxes + 10.0 ( + 1.3 % )
Operating Income
770.0
Operating Income
770.0
+ 56.0- 7.0
32
- 52.0+ 3.0 ± 0
+ 10.0
FY15PreviousForecast
FY15RevisedForecast
Revenue,model mix,
etc.
Cost Reduction, etc.
Decrease inSG&A
R&DExpenses
Currency Effects
Unrealized gainsand losses related toderivative
instruments
Other
Yen (billion)
Forecast: Change in Income before Income Taxes
± 0
33
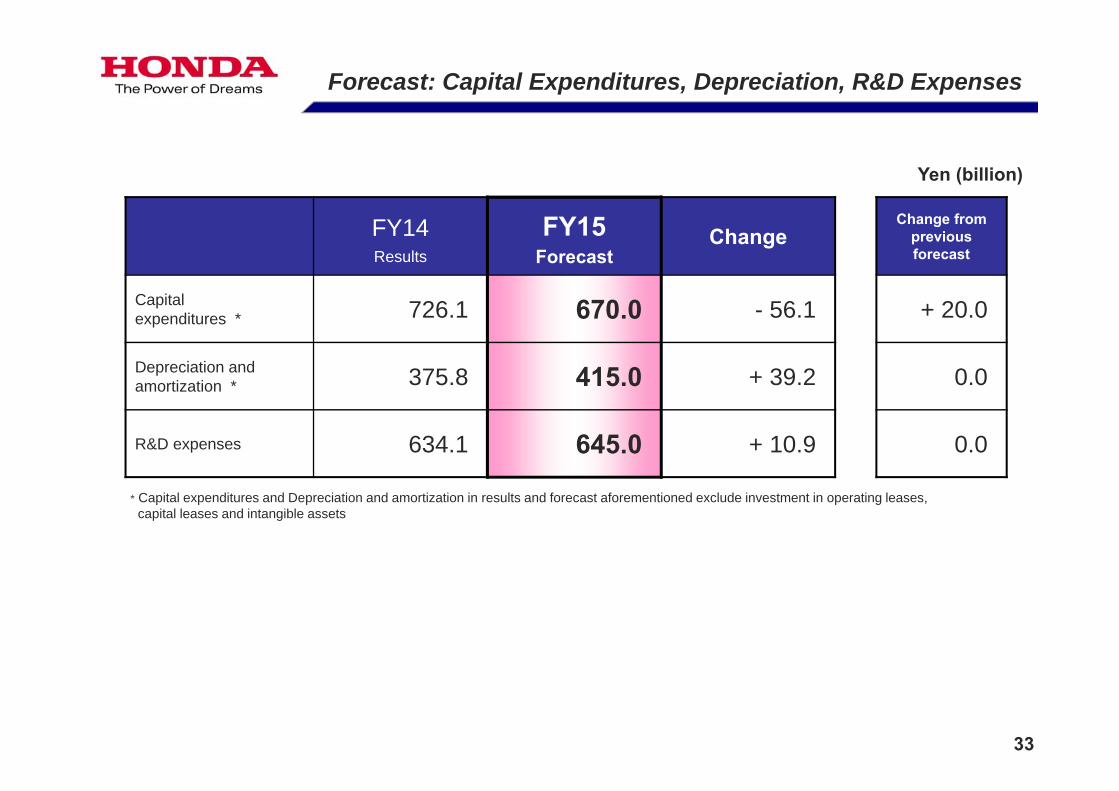
FY14Results
FY15Forecast
ChangeChange from
previousforecast
Capitalexpenditures * 726.1 670.0 - 56.1 + 20.0
Depreciation andamortization * 375.8 415.0 + 39.2 0.0
R&D expenses 634.1 645.0 + 10.9 0.0
Forecast: Capital Expenditures, Depreciation, R&D Expenses
Yen (billion)
* Capital expenditures and Depreciation and amortization in results and forecast aforementioned exclude investment in operating leases, capital leases and intangible assets

Caution with Respect to Forward-Looking Statements:This slide contains forward-looking statements about the performance of Honda, which are based on management’s assumptions and beliefs taking into account information currently available to it. Therefore, please be advised that Honda’s actual results could differ materially from those described in these forward-looking statements as a result of numerous factors, including general economic conditions in Honda’s principal markets and foreign exchange rates between the Japanese yen and the U.S. dollar, the Euro and other major currencies, as well as other factors detailed from time to time.Accounting standards: Our consolidated financial standards are prepared in conformity with U.S. generally accepted accounting principles.Notice on the Factors for Increases and Decreases in Income:With respect to the discussion above of the change in operating income, management has identified the factors set forth below and used what it believes to be a reasonable method to analyze the respective changes in such factors. Each of these factors is explained below. Management has analyzed changes in these factors at the levels of the Company and its material consolidated subsidiaries.(1)“Foreign currency effects” consist of translation adjustments, which come from the translation of the currency offoreign subsidiaries’ financial statements into Japanese Yen, and foreign currency adjustments, which result fromforeign-currency-denominated sales, which, at the levels of the Company and those consolidated subsidiaries whichhave been analyzed, primarily relate to the following currencies: U.S. dollar, Canada dollar, Euro, GBP, BRL andJapanese Yen.(2) With respect to “cost reduction and effects of raw material cost fluctuations”, management has analyzed costreduction and effects of raw material cost fluctuations at the levels of the Company and its material foreignmanufacturing subsidiaries in North America, Europe and other regions.(3) With respect to “changes in net sales and model mix”, management has analyzed changes in sales volume and in themix of product models sold in major markets which have resulted in increases/decreases in profit, as well as certainother reasons for increases/decreases in net sales and cost of sales.(4) With respect to “selling, general and administrative expenses”, management has analyzed reasons for anincrease/decrease in selling, general and administrative expenses from the previous fiscal year net of currencytranslation effects.(5) With respect to “research and development expenses”, management has analyzed reasons for an increase/decreasein research and development expenses from the previous fiscal year net of currency translation effects.*1 Net income attributable to Honda Motor Co., Ltd.*2 Basic net income attributable to Honda Motor Co., Ltd. per share
Basic net income attributable to Honda Motor Co., Ltd., per share is calculated based on weighted average number of shares outstanding as shown below: - 2nd Quarter FY14: 1,802,295,000 (approx), FY15: 1,802,289,000 (approx) (page 5)- Six Months FY14: 1,802,295,000 (approx), FY15: 1,802,290,000 (approx) (page 6)- Fiscal Year FY14: 1,802,294,000 (approx), FY15: 1,802,289,000 (approx) (pages 7 and 30) 34

35
36
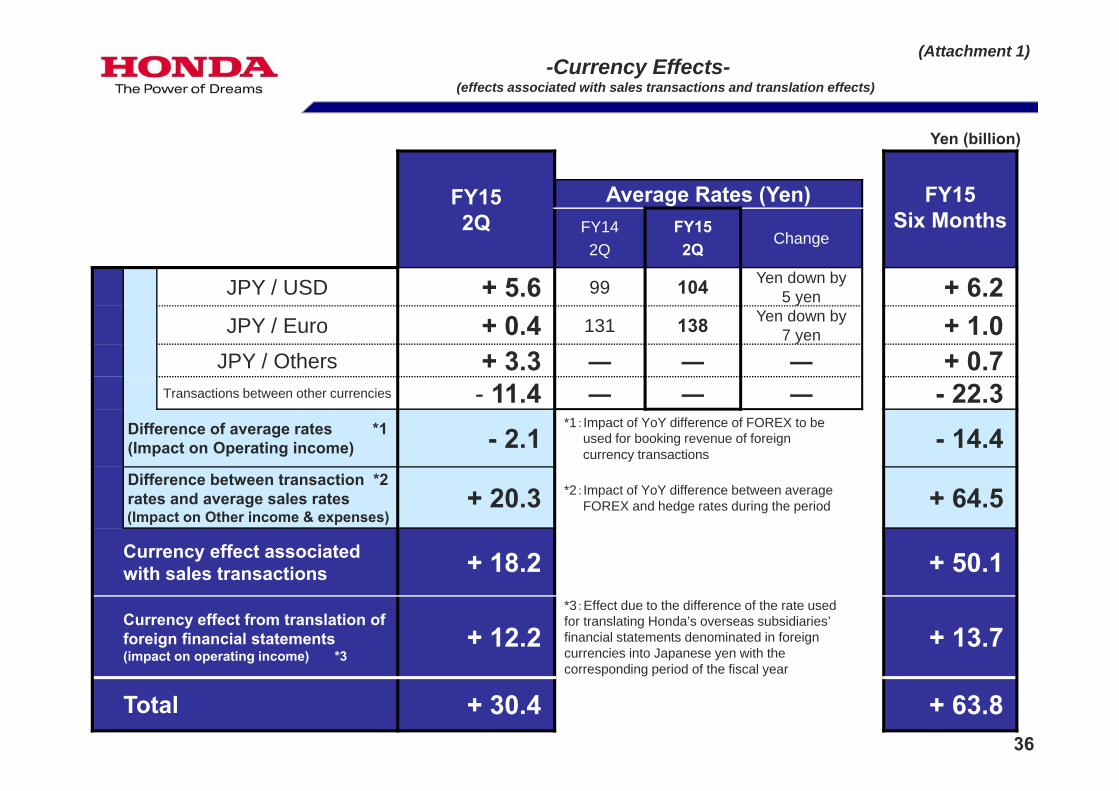
FY152Q
FY15Six Months
Average Rates (Yen)FY142Q
FY152Q
Change
JPY / USD + 5.6 99 104 Yen down by5 yen + 6.2
JPY / Euro + 0.4 131 138 Yen down by7 yen + 1.0
JPY / Others + 3.3 ― ― ― + 0.7Transactions between other currencies - 11.4 ― ― ― - 22.3
Difference of average rates *1(Impact on Operating income) - 2.1
*1:Impact of YoY difference of FOREX to be used for booking revenue of foreign currency transactions
- 14.4Difference between transaction *2 rates and average sales rates (Impact on Other income & expenses)
+ 20.3 *2:Impact of YoY difference between average FOREX and hedge rates during the period + 64.5
Currency effect associated with sales transactions + 18.2 + 50.1
Currency effect from translation of foreign financial statements (impact on operating income) *3
+ 12.2*3:Effect due to the difference of the rate used for translating Honda’s overseas subsidiaries’ financial statements denominated in foreign currencies into Japanese yen with the corresponding period of the fiscal year
+ 13.7
Total + 30.4 + 63.8
(Attachment 1)-Currency Effects-
(effects associated with sales transactions and translation effects)
Yen (billion)
37
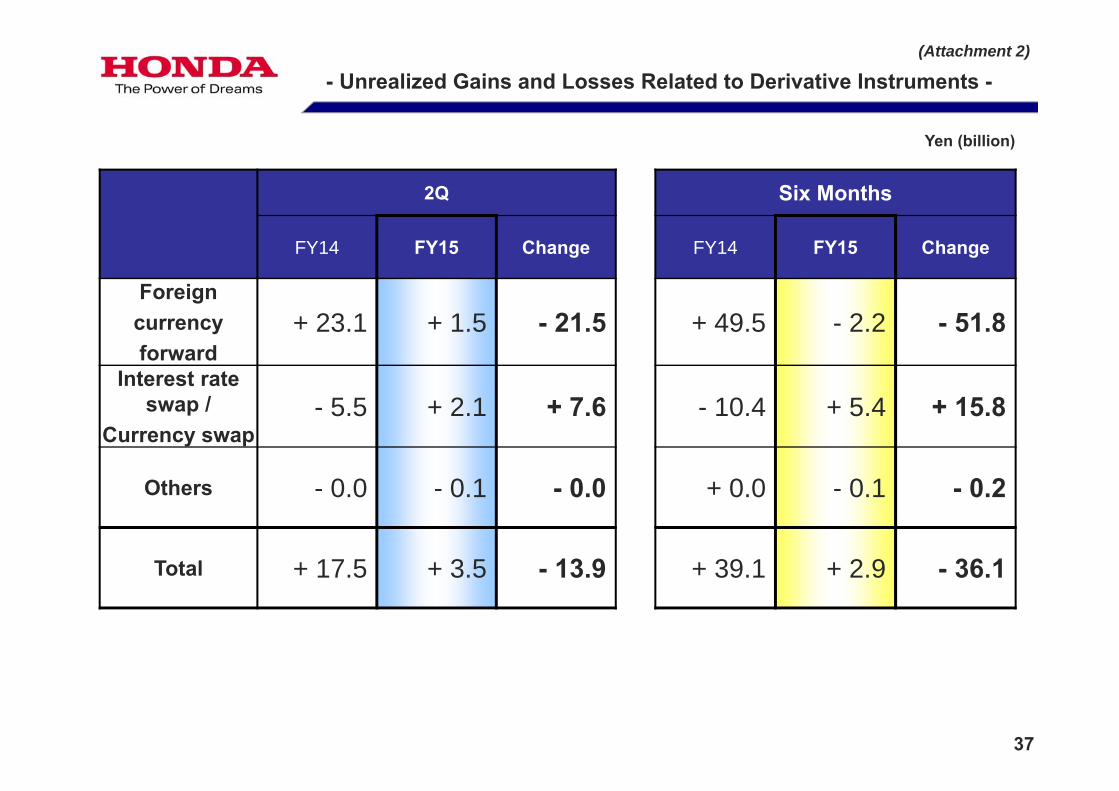
2Q Six Months
FY14 FY15 Change FY14 FY15 Change
Foreigncurrencyforward
+ 23.1 + 1.5 - 21.5 + 49.5 - 2.2 - 51.8
Interest rate swap /
Currency swap- 5.5 + 2.1 + 7.6 - 10.4 + 5.4 + 15.8
Others - 0.0 - 0.1 - 0.0 + 0.0 - 0.1 - 0.2
Total + 17.5 + 3.5 - 13.9 + 39.1 + 2.9 - 36.1
- Unrealized Gains and Losses Related to Derivative Instruments -(Attachment 2)
Yen (billion)

38
+ 398.4 - 338.7
- 153.7+ 27.6
1,148.6 1,082.1
Net change - 66.4
+ 415.5 - 385.2
- 136.3+ 33.1
1,180.01,107.0
Free cash flow+ 30.2
Net change - 72.9
Net Cash639.7
Net Cash569.1
Net Cash539.6
Net Cash583.2
Capital expenditures*1 - 354.0Other - 31.2
Dividends paid - 70.2Others - 66.0
Net income + 207.2Equity in income of affiliates
- 63.4Depreciation + 215.9Other + 55.7
Free cash flow+ 59.6
- Cash Flows of Non-financial Services Businesses -(Attachment 3)
FY14 Six Months
FY15 Six Months
Cash & Cash equivalents at beginning of the FY14
Cash flows fromoperating activities
Cash flows from investing activities Cash flows from
financing activitiesEffect of exchange rate changes on
cash and cash equivalents
Cash & cash equivalents at end of the period
Yen (billion)
*1 This includes Purchases of intangible assets
Cash flows fromoperating activities
Cash flows from investing activities Cash flows from
financing activitiesEffect of exchange rate changes on
cash and cash equivalents
Cash & Cash equivalents at beginning of the FY15
Net income + 239.0Equity in income of affiliates
- 61.3Depreciation + 233.9Other - 13.2
Capital expenditures*1 - 348.3Other + 9.5
Dividends paid - 79.3Others - 77.4
*1 This includes Purchases of intangible assetsCash & cash equivalents
at end of the period