fy 2018 budget presentation
TRANSCRIPT
ecomaine.org
March 16, 2017
2
FY 2018 Budget Presentation

ecomaine.org
Revenues up $1.3 MM or 7% (Favorable Recycling Markets)
Cash Expenses down $.7 MM or 4% (Natural Gas Usage, Payroll, & Contingency)
Non Operating Income is up $.4 MM (Favorable Investment Returns)
Revenue Less Expense is projected to be -$950,000 which is favorable to the budget by $2.4 MM or 72%
3
ecomaine.org
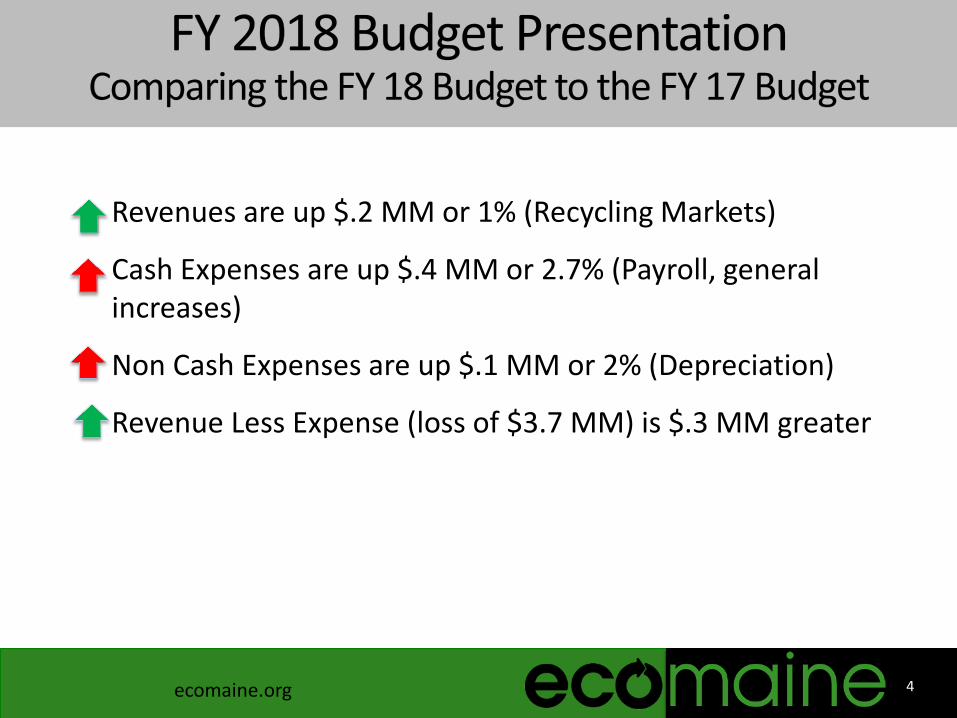
Revenues are up $.2 MM or 1% (Recycling Markets)
Cash Expenses are up $.4 MM or 2.7% (Payroll, general increases)
Non Cash Expenses are up $.1 MM or 2% (Depreciation)
Revenue Less Expense (loss of $3.7 MM) is $.3 MM greater
4
ecomaine.org
Historical Trendsand Projections
5
Revenue, Volume, Unit Values
ecomaine.org
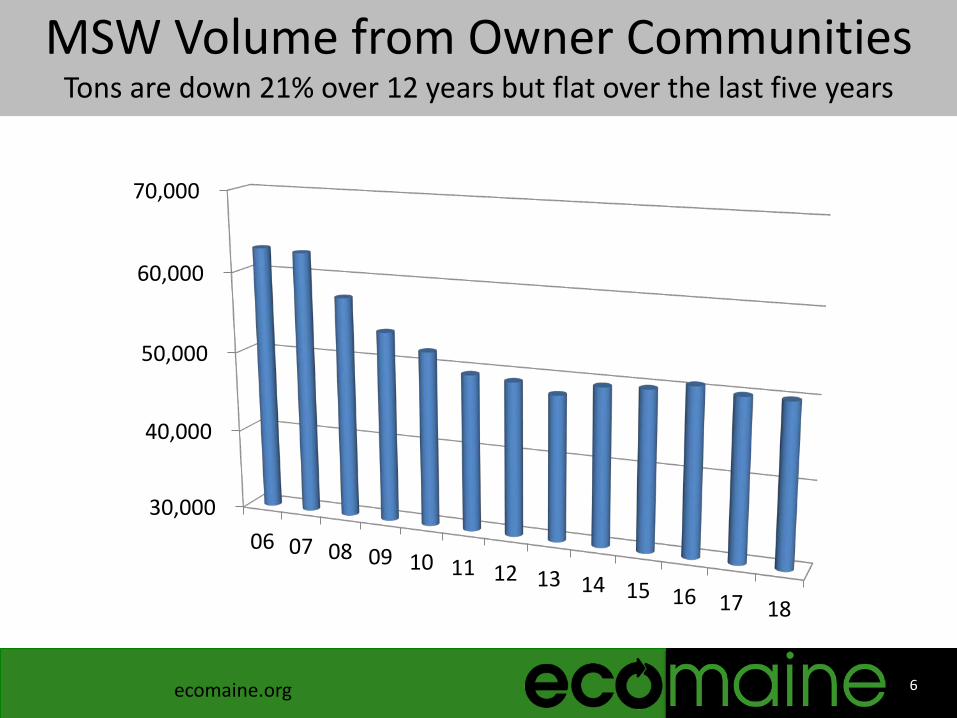
MSW Volume from Owner CommunitiesTons are down 21% over 12 years but flat over the last five years
30,000
40,000
50,000
60,000
70,000
06 07 08 09 10 11 12 13 14 15 16 17 18
6
ecomaine.org
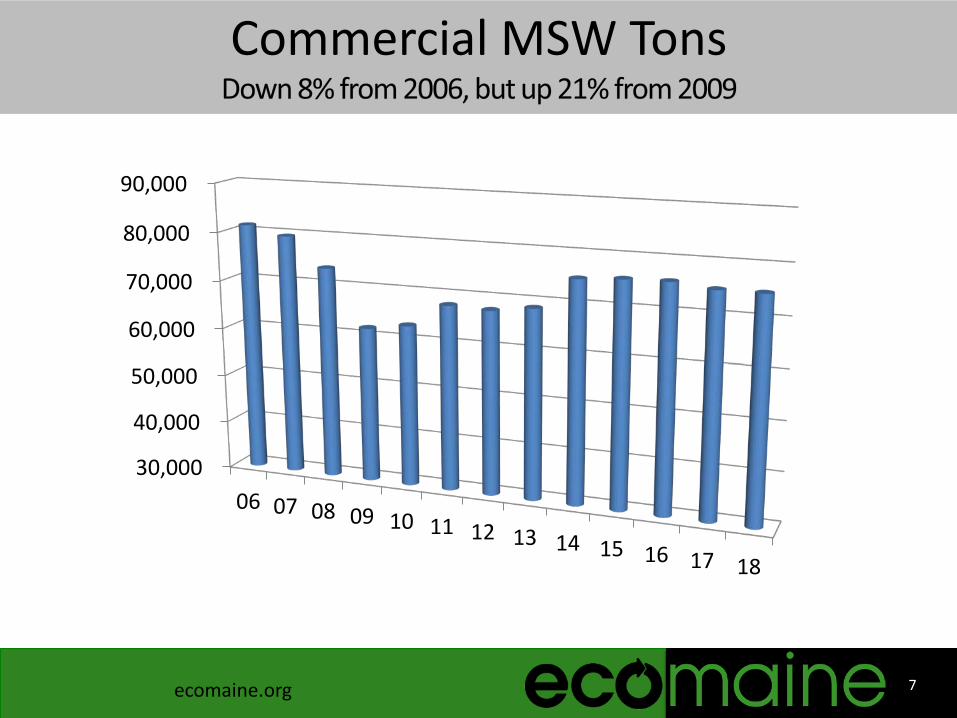
Commercial MSW Tons
30,000
40,000
50,000
60,000
70,000
80,000
90,000
06 07 08 09 10 11 12 13 14 15 16 17 18
7
ecomaine.org
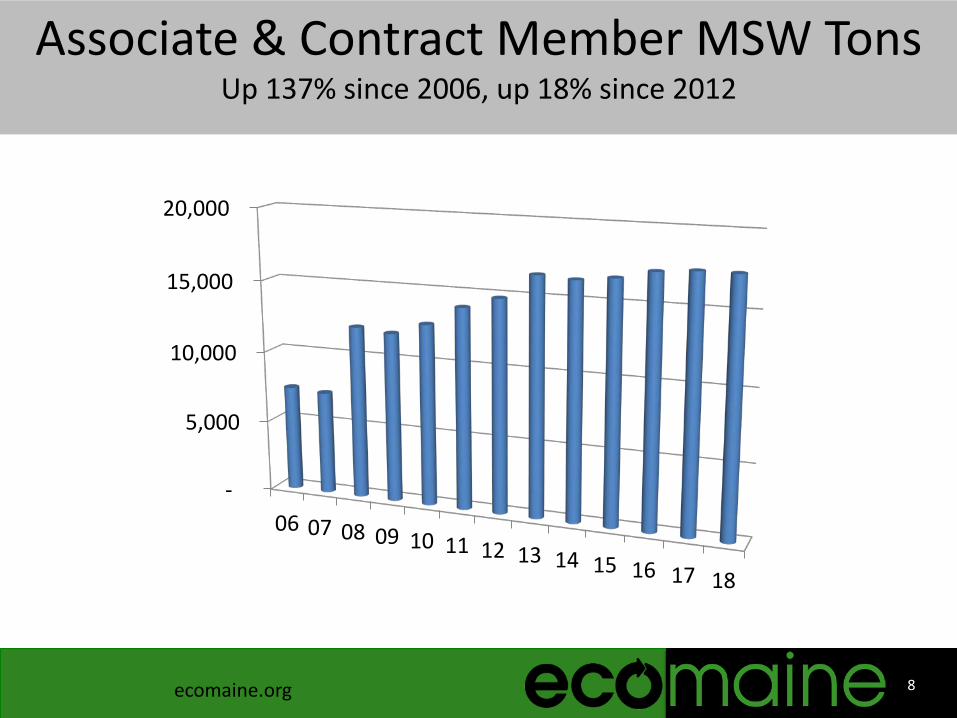
Associate & Contract Member MSW TonsUp 137% since 2006, up 18% since 2012
8
-
5,000
10,000
15,000
20,000
06 07 08 09 10 11 12 13 14 15 16 17 18

ecomaine.org
Spot Market MSW Tons – Adjusting to Meet Capacity Requirements
-
10,000
20,000
30,000
40,000
50,000
60,000
70,000
06 07 08 09 10 11 12 13 14 15 16 17 18
9

ecomaine.org
Overall Solid Waste Tons
100,000 110,000 120,000 130,000 140,000 150,000 160,000 170,000 180,000 190,000
06 07 08 09 10 11 12 13 14 15 16 17 18
10
ecomaine.org
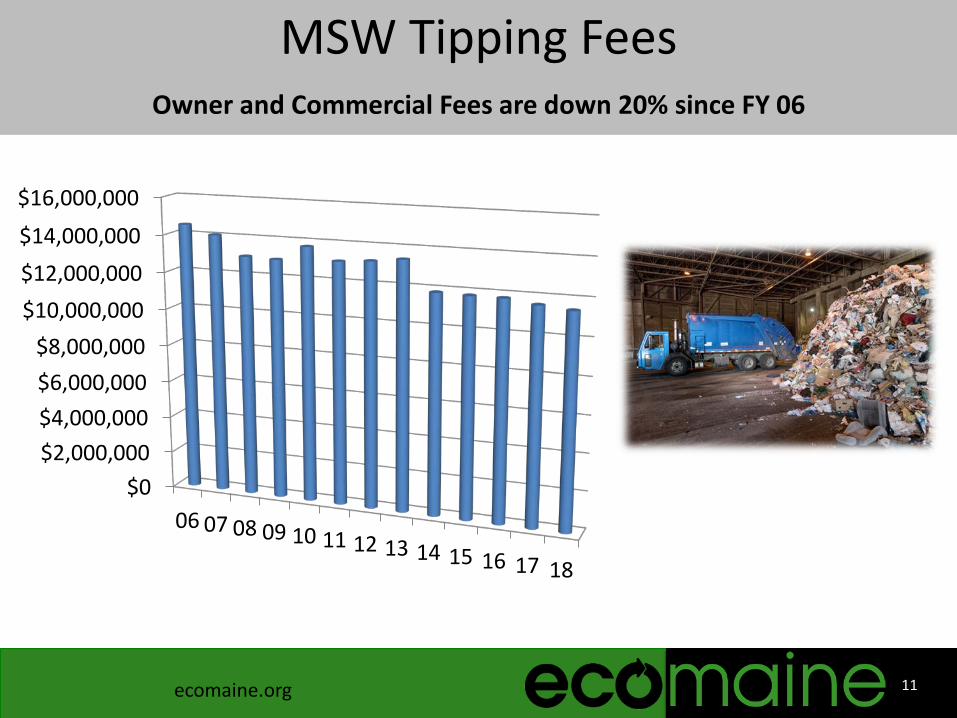
MSW Tipping FeesOwner and Commercial Fees are down 20% since FY 06
$0$2,000,000$4,000,000$6,000,000$8,000,000
$10,000,000$12,000,000$14,000,000
$16,000,000
06 07 08 09 10 11 12 13 14 15 16 17 18
11
ecomaine.org
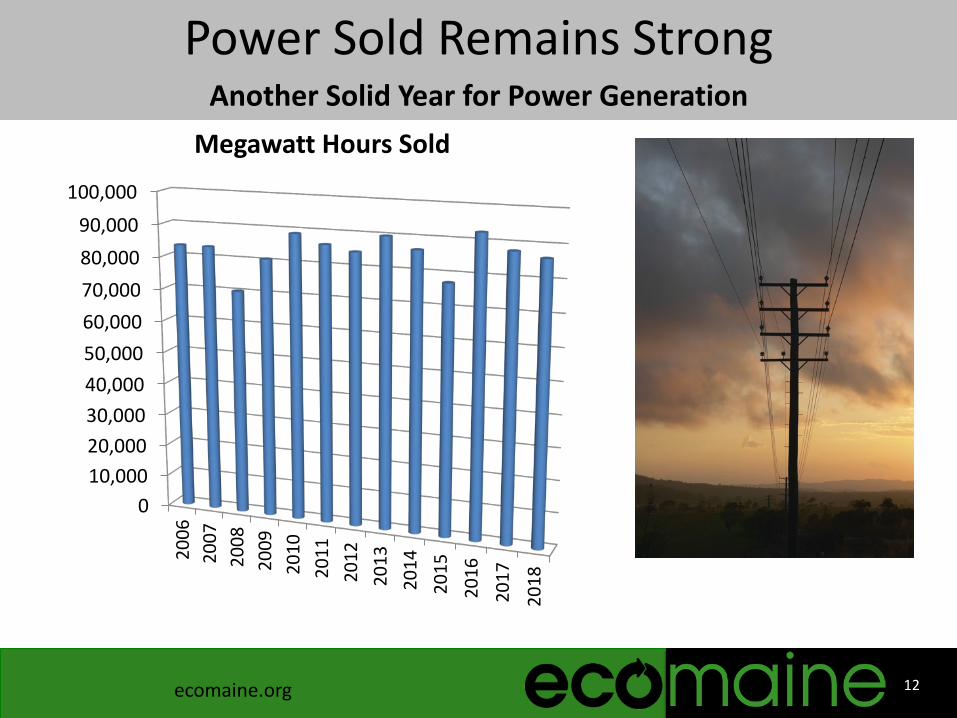
Power Sold Remains Strong
010,00020,00030,00040,00050,00060,00070,00080,00090,000
100,00020
0620
0720
0820
0920
1020
1120
1220
1320
1420
1520
1620
17
2018
Megawatt Hours Sold
Another Solid Year for Power Generation
12
ecomaine.org
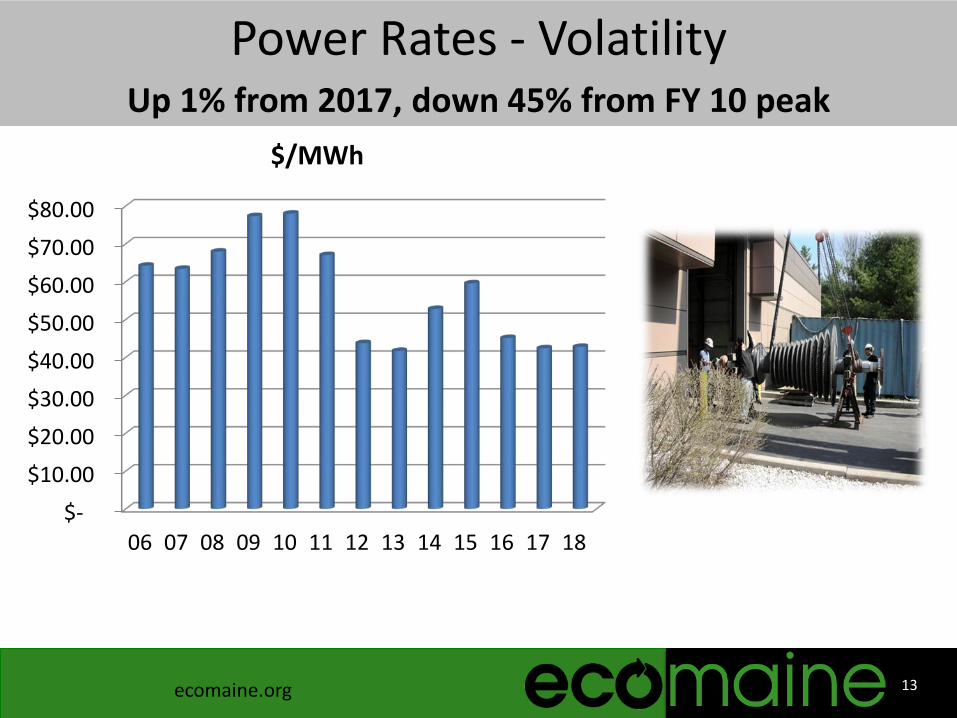
Power Rates - Volatility
$-
$10.00
$20.00
$30.00
$40.00
$50.00
$60.00
$70.00
$80.00
06 07 08 09 10 11 12 13 14 15 16 17 18
$/MWh
Up 1% from 2017, down 45% from FY 10 peak
13
ecomaine.org
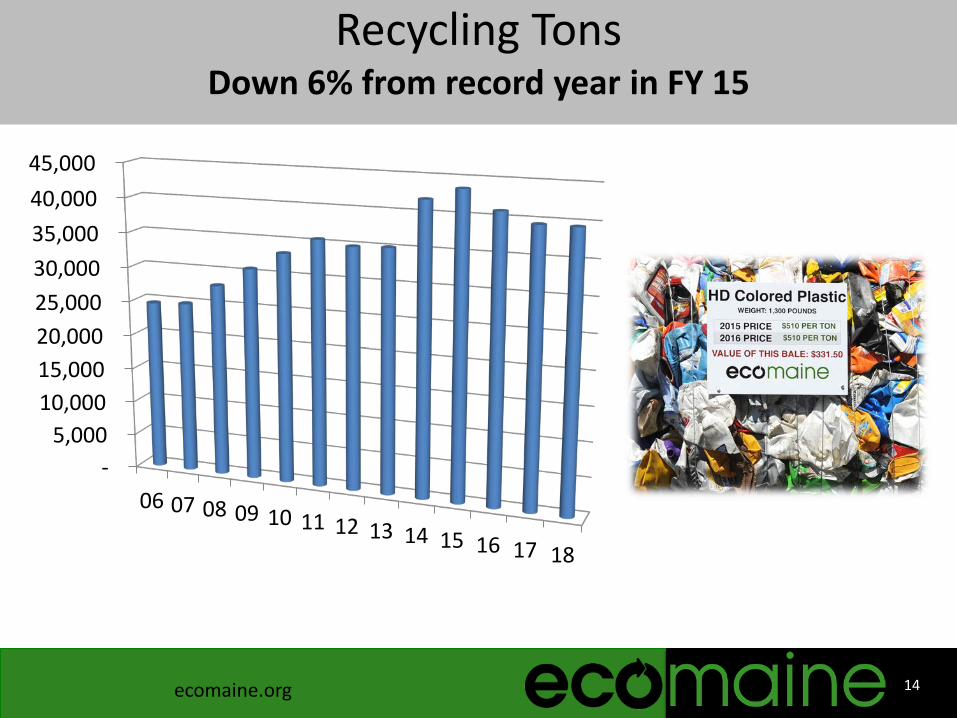
Recycling TonsDown 6% from record year in FY 15
- 5,000
10,000 15,000 20,000 25,000 30,000 35,000 40,000 45,000
06 07 08 09 10 11 12 13 14 15 16 17 18
14
ecomaine.org
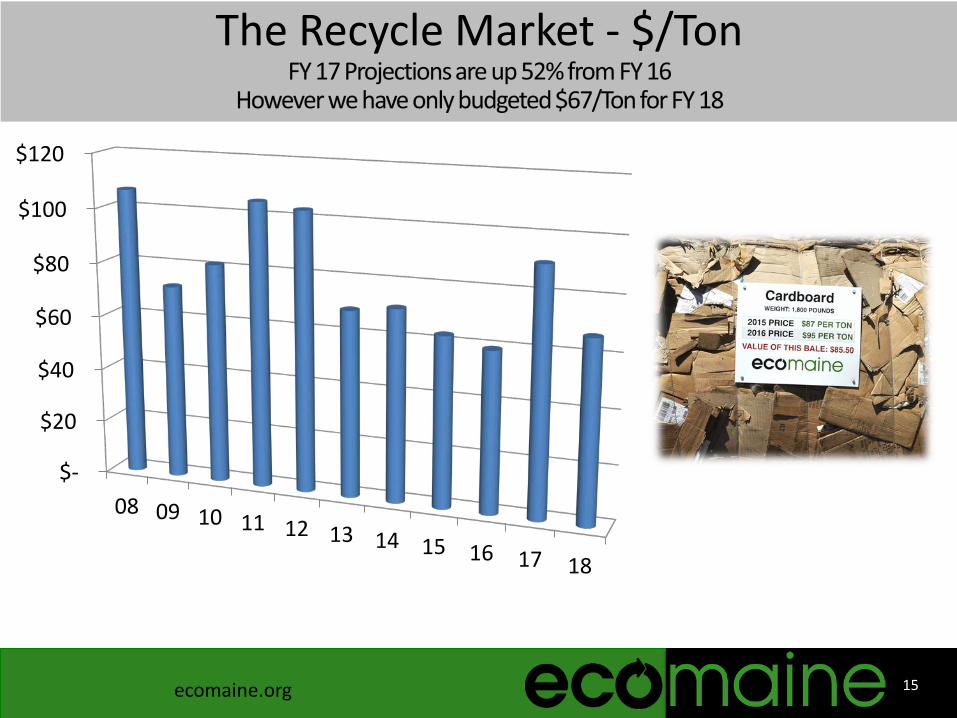
The Recycle Market - $/Ton
$-
$20
$40
$60
$80
$100
$120
08 09 10 11 12 13 14 15 16 17 18
15

ecomaine.org
The Recycle Market – Total RevenueFY 17 Revenue will be up 47% from FY 16
$-
$500,000
$1,000,000
$1,500,000
$2,000,000
$2,500,000
$3,000,000
$3,500,000
$4,000,000
08 09 10 11 12 13 14 15 16 17 18
16
ecomaine.org
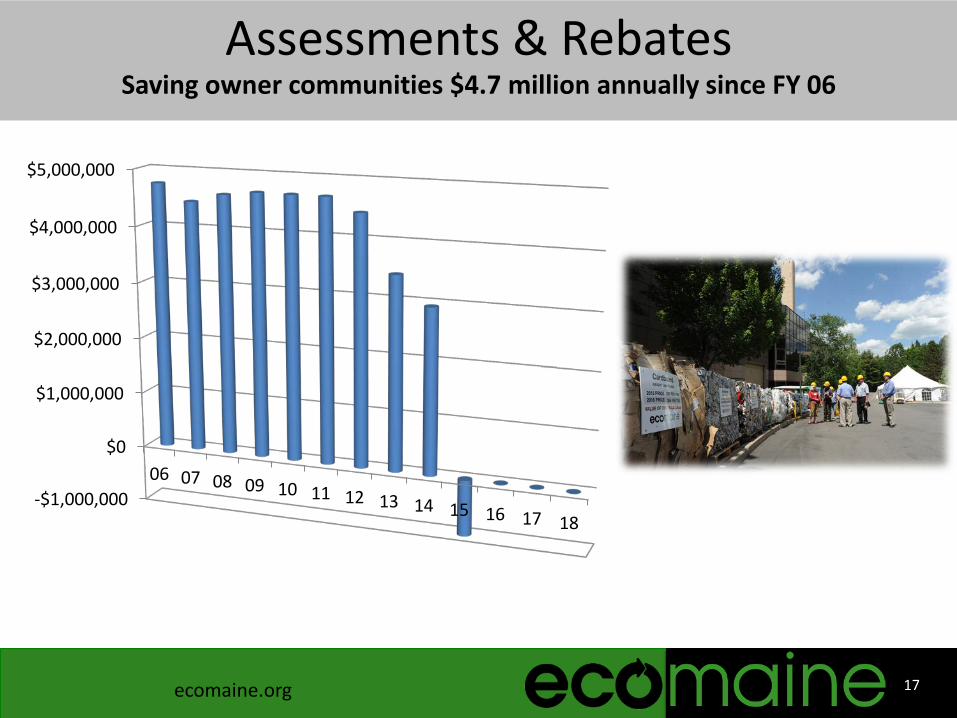
Assessments & Rebates Saving owner communities $4.7 million annually since FY 06
-$1,000,000
$0
$1,000,000
$2,000,000
$3,000,000
$4,000,000
$5,000,000
06 07 08 09 10 11 12 13 14 15 16 17 18
17
ecomaine.org
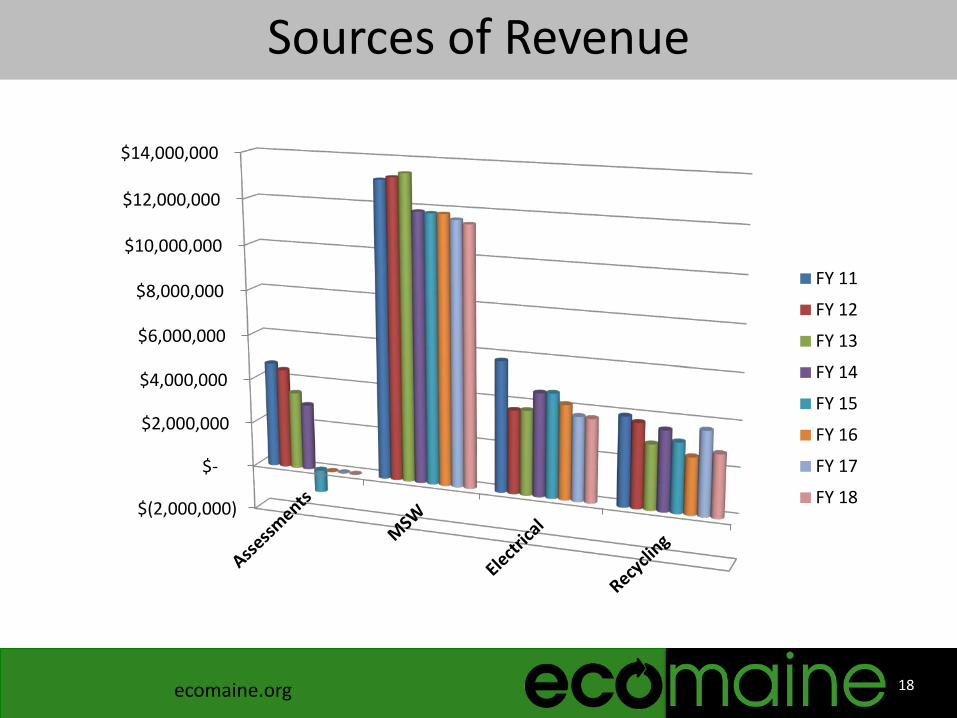
Sources of Revenue
$(2,000,000)
$-
$2,000,000
$4,000,000
$6,000,000
$8,000,000
$10,000,000
$12,000,000
$14,000,000
FY 11
FY 12
FY 13
FY 14
FY 15
FY 16
FY 17
FY 18
18
ecomaine.org
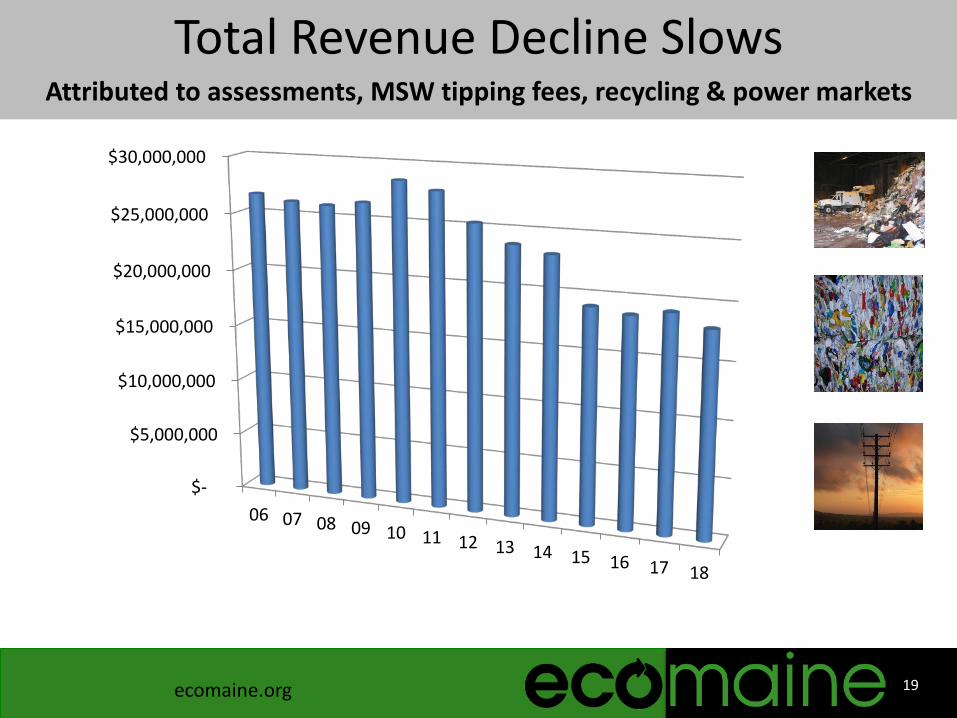
Total Revenue Decline SlowsAttributed to assessments, MSW tipping fees, recycling & power markets
$-
$5,000,000
$10,000,000
$15,000,000
$20,000,000
$25,000,000
$30,000,000
06 07 08 09 10 11 12 13 14 15 16 17 18
19

ecomaine.org
Historical Trendsand Projections
20
Operating Costs & Capital Spending
ecomaine.org
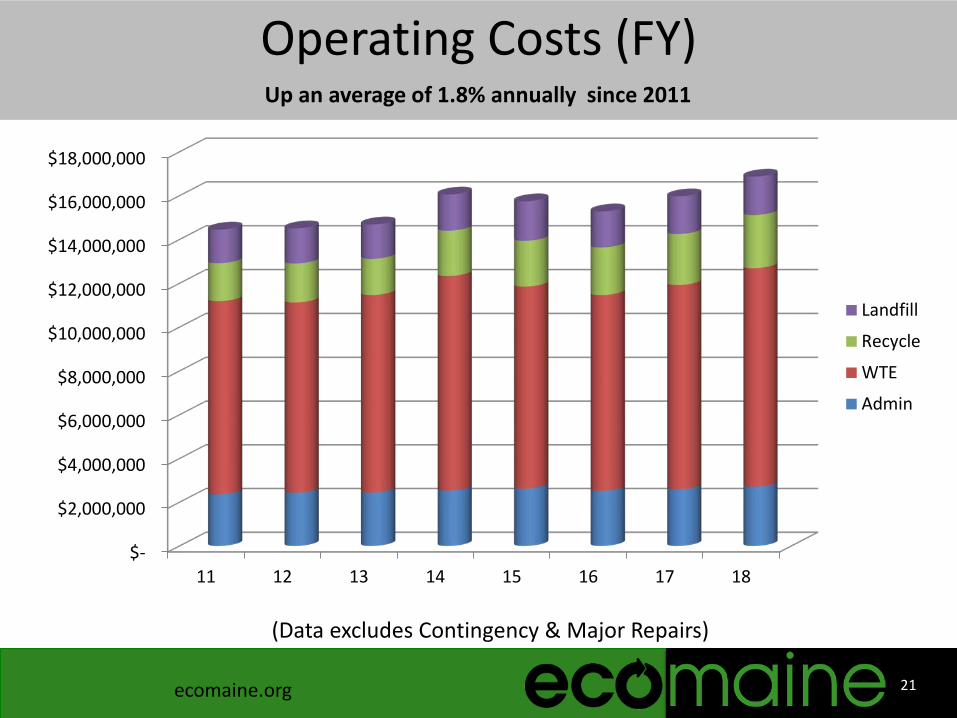
Operating Costs (FY)
$-
$2,000,000
$4,000,000
$6,000,000
$8,000,000
$10,000,000
$12,000,000
$14,000,000
$16,000,000
$18,000,000
11 12 13 14 15 16 17 18
Landfill
Recycle
WTE
Admin
(Data excludes Contingency & Major Repairs)
21
Up an average of 1.8% annually since 2011

ecomaine.org
Major Repairs – FY 18Total $420,000
Turbine Minor Inspection $100,000 Tipping hall repairs 80,000 Cooling tower inspection and repair 50,000 Biannual relay calibration 40,000 Paving repairs – WTE 25,000 Loader Tires 25,000 Excavate detention pond 20,000 Misc. Cat Walks 20,000 Ammonia monitoring 15,000 Overhead Door Replacement 15,000 Paving – Recycle 15,000 Remove Obsolete Dust Collectors 15,000 Total $420,000
22

ecomaine.org
Capital Projects – FY 18
ESP Rebuild $1,400,000 ESP Casing Repairs 600,000 Refuse Crane Replacement 575,000
480 volt switchgear 475,000 Other equipment upgrades - Recycle 300,000 WTE Facility Process Improvements –Engineering
250,000
Boiler Inconel Work 250,000 Superheater Tube Replacements. 150,000
Design/permit Landfill East expan 150,000
Geomembrane cover 115,000
Total $4.5 million of investments
23
ecomaine.org
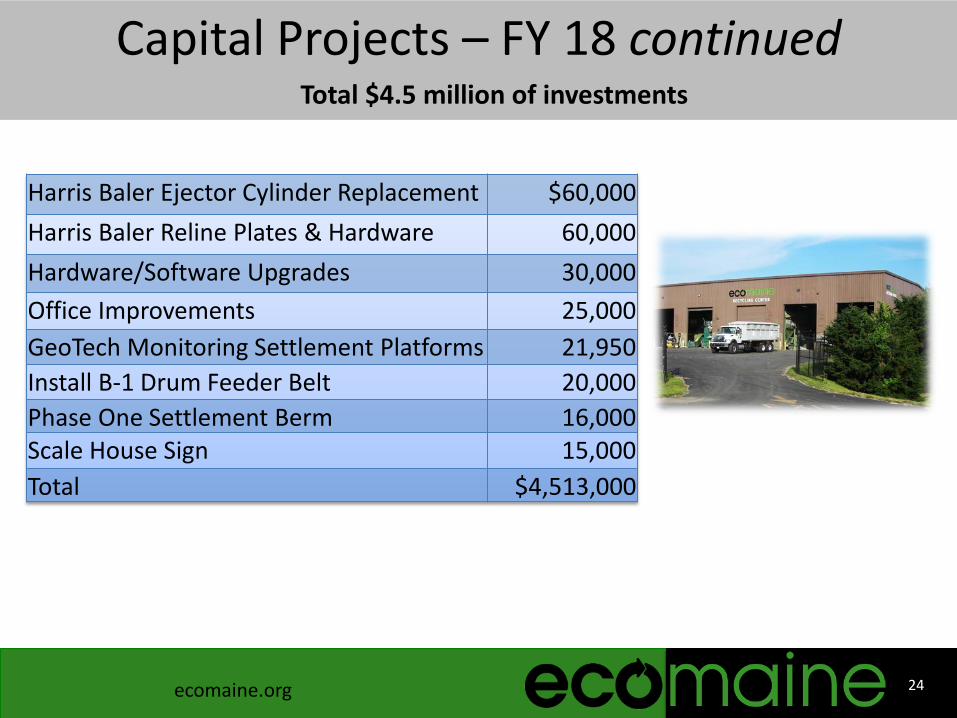
Capital Projects – FY 18 continued
Harris Baler Ejector Cylinder Replacement $60,000 Harris Baler Reline Plates & Hardware 60,000 Hardware/Software Upgrades 30,000 Office Improvements 25,000 GeoTech Monitoring Settlement Platforms 21,950 Install B-1 Drum Feeder Belt 20,000 Phase One Settlement Berm 16,000 Scale House Sign 15,000 Total $4,513,000
Total $4.5 million of investments
24

ecomaine.org
FY 17 Budget compared to the FY 17 Projections
FY 17 Budget compared to the FY 18 Budget
FY 17 Forecast compared to the FY 18 Budget
25
Comparisons
ecomaine.org
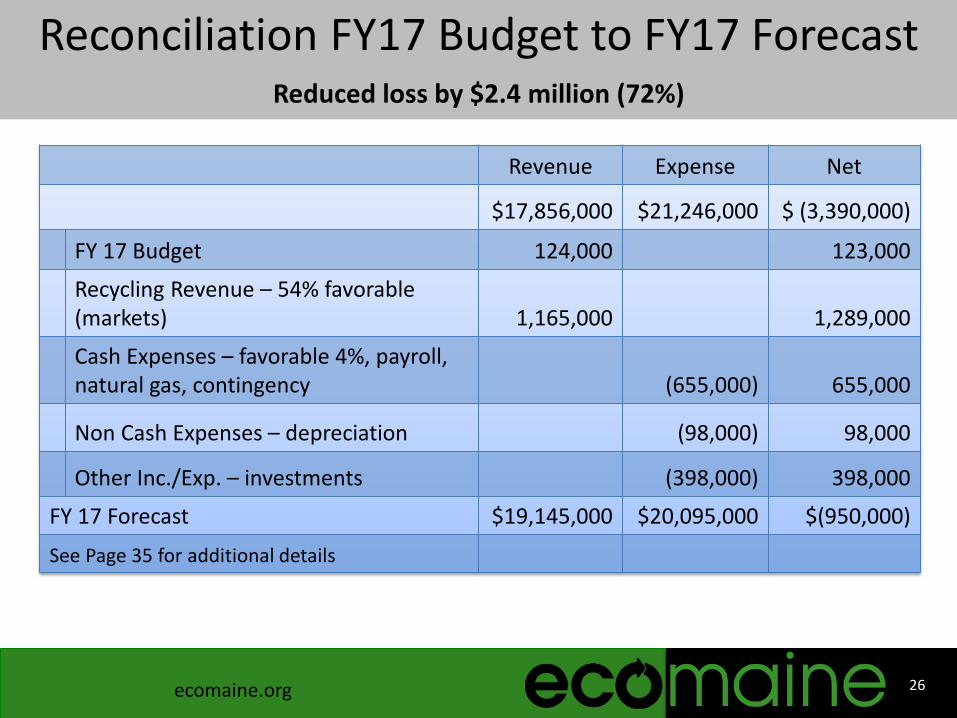
Reconciliation FY17 Budget to FY17 Forecast Reduced loss by $2.4 million (72%)
Revenue Expense Net
$17,856,000 $21,246,000 $ (3,390,000)
FY 17 Budget 124,000 123,000
Recycling Revenue – 54% favorable(markets) 1,165,000 1,289,000
Cash Expenses – favorable 4%, payroll, natural gas, contingency (655,000) 655,000
Non Cash Expenses – depreciation (98,000) 98,000
Other Inc./Exp. – investments (398,000) 398,000
FY 17 Forecast $19,145,000 $20,095,000 $(950,000)
See Page 35 for additional details
26

ecomaine.org
Reconciliation FY17 Budget to FY18 BudgetThe FY 18 Loss of $3.7 million is unfavorable to the FY17 Budget by $.3 million
27
Revenue Expense Net
FY 17 Budget $17,856,000 $21,246,000 $ (3,390,000)
MSW Revenue – flat (23,000) (23,000)
Electrical Revenue – unfavorable 1% (volume) (34,000) (34,000)
Recycling Revenue – favorable 9% (markets) 232,000 232,000
Cash Expenses – unfavorable 3% - 443,000 (443,000)
Non Cash Expenses – Depreciation 98,000 (98,000)
Other Inc./Exp. – interest (19,000) 19,000
FY 18 Budget $18,034,000 $21,769,000 ($3,735,000)
See Page 36 for additional details

ecomaine.org
Reconciliation FY17 Forecast to FY18 BudgetThe FY 18 Loss of $3.7 million is unfavorable to the FY17 Forecast by $2.8 million
28
Revenue Expense Net
FY 17 Forecast $19,145,000 $20,095,000 $ (950,000)
MSW Revenue – unfavorable 1% (Average Spot & Commercial Rates) (147,000) (156,000)
Recycle Revenue – unfavorable 25%(Markets) (934,000) (934,000)
Electrical Revenue – unfavorable 1% (volume sold down 2% - minor turbine outage ) (32,000) (32,000)
Cash Expenses – unfavorable 7% - (Payroll filled positions, major repairs , food waste) 1,098,000 (1,098,000)
Non Cash Expenses – Depreciation 196,000 (196,000)
Other Income/Expense – Investments (379,000) 379,000
FY 18 Budget $18,034,000 $21,769,000 ($3,735,000)
See Page 37 for additional details
ecomaine.org
Cash Generated – Revenues less Expenses on a cash basis
Debt Repayment – Payments made each year to reduce debt
Cash Used in Investing – Capital Expenditures, Assets Sold & Investment Income
Cash Balances at Year end – Check book and investments
Long Term Debt Balance – Total owed as of year end
29
Cash Position

ecomaine.org
Statement of Cash Balances – Key Items Cash generated from operations is down 92% from FY 11 and Long Term Debt
Payments have been eliminated while capital spending remains volatile
$-
$2,000,000
$4,000,000
$6,000,000
$8,000,000
$10,000,000
$12,000,000
$14,000,000
Cash GeneratedDebt Repayment
Cash Used inInvesting
FY 11
FY 12
FY 13
FY 14
FY 15
FY 16
FY 17
FY 18
30
ecomaine.org
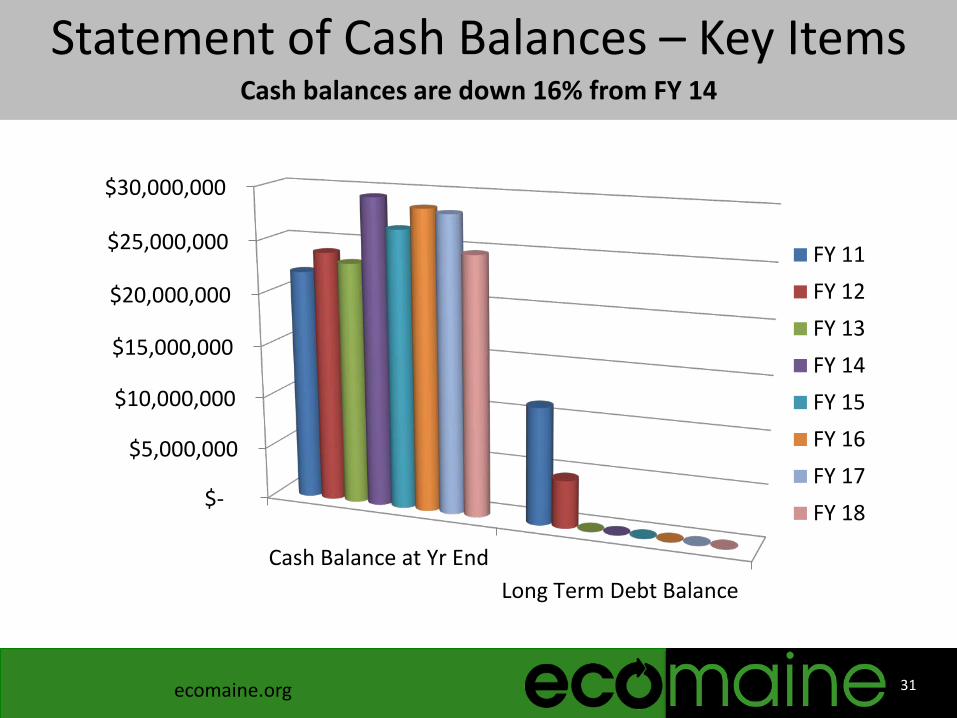
Statement of Cash Balances – Key ItemsCash balances are down 16% from FY 14
$-
$5,000,000
$10,000,000
$15,000,000
$20,000,000
$25,000,000
$30,000,000
Cash Balance at Yr EndLong Term Debt Balance
FY 11FY 12FY 13FY 14FY 15FY 16FY 17FY 18
31

ecomaine.org
Our projections for 2017 are that Revenue Less Expenses will be a loss of $950,000. This will be $2.4 million (or 72%) favorable to budget. Why? Recycle Revenues far exceeded our budget projections for FY 17 and
improved our financial position by $1.3 million. Operating costs were $.7 million below budget and investment returns were $.4 million favorable.
When comparing the 2017 and the 2018 operating budgets our operating costs are up 2.7% and revenues are up 1%.
While our cash position remains strong, like FY 17, our revenues are not expected to cover expenses in FY 18 when you include depreciation.
Cash Balances will decrease by $.4 million in 2017 to $28.1 million and will decrease another $3.5 million in FY 18 to $24.6 million, down 16% from the peak in FY 14.
We need to carefully monitor our cash position as markets for recyclables, electricity, and trash remain volatile as do our capital needs. During our 5 year financial review this fall, adjustments may need to be considered.
32
ecomaine.org
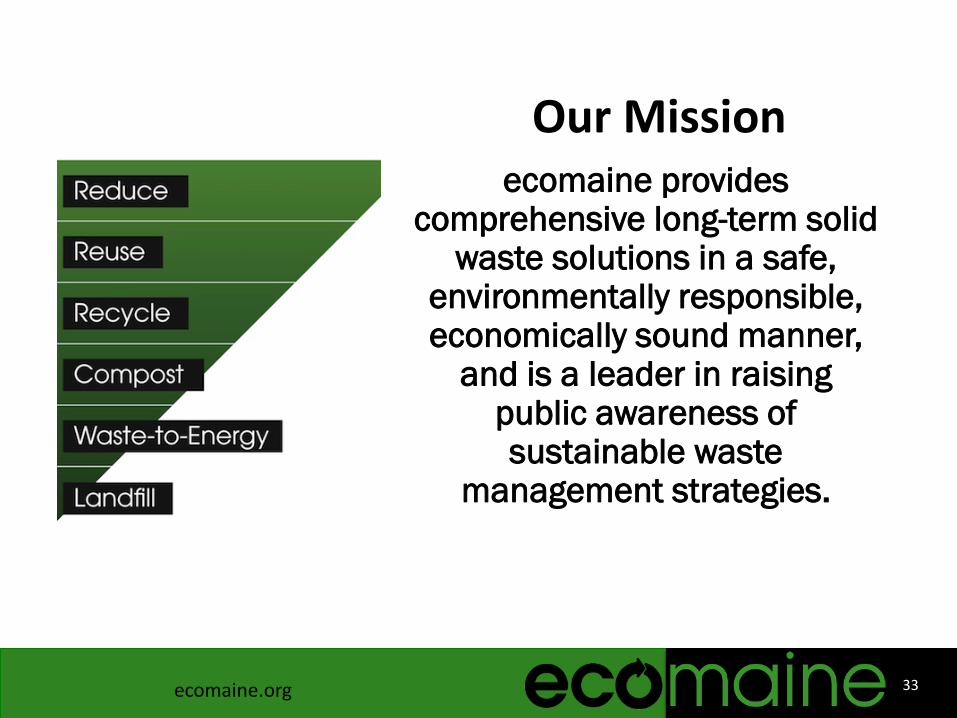
ecomaine provides comprehensive long-term solid
waste solutions in a safe, environmentally responsible, economically sound manner,
and is a leader in raising public awareness of sustainable waste
management strategies.
Our Mission
33