fuzzy clustering based segmentation of vertebrae … · fuzzy clustering based segmentation of...
TRANSCRIPT

International Journal of Fuzzy Logic Systems (IJFLS) Vol.6, No.2,April 2016
DOI : 10.5121/ijfls.2016.6202 23
FUZZY CLUSTERING BASED SEGMENTATION OF
VERTEBRAE IN T1-WEIGHTED SPINAL MR IMAGES
Jiyo.S.Athertya and G.Saravana Kumar
Department of Engineering Design, IIT-Madras, Chennai, India
ABSTRACT
Image segmentation in the medical domain is a challenging field owing to poor resolution and limited
contrast. The predominantly used conventional segmentation techniques and the thresholding methods
suffer from limitations because of heavy dependence on user interactions. Uncertainties prevalent in an
image cannot be captured by these techniques. The performance further deteriorates when the images are
corrupted by noise, outliers and other artifacts. The objective of this paper is to develop an effective robust
fuzzy C- means clustering for segmenting vertebral body from magnetic resonance image owing to its
unsupervised form of learning. The motivation for this work is detection of spine geometry and proper
localisation and labelling will enhance the diagnostic output of a physician. The method is compared with
Otsu thresholding and K-means clustering to illustrate the robustness.The reference standard for validation
was the annotated images from the radiologist, and the Dice coefficient and Hausdorff distance measures
were used to evaluate the segmentation.
KEYWORDS
Vertebra segmentation, MRI, fuzzy clustering, labelling
1.INTRODUCTION
Image segmentation is a fundamental building block in an image analysis tool kit. Segmentation
of medical images is in itself an arduous process where the images are prone to be affected by
noise and artifacts. Automatic segmentation of medical images is a difficult task as medical
images are complex in nature and rarely posses simple linear feature characteristic. Further, the
output of segmentation algorithm is affected due to partial volume effect, intensity inhomogeneity
in case of magnetic resonance (MR) images.
Spine is the most complex load bearing structure in our entire human body.It is made up of 26
irregular bones connected in such a way that flexible curvedstructure results. The vertebral
column is about 70cm long in an average adult and has5 major divisions. Seven vertebrae found
in the neck region, constitutethe cervical part, the next 12 are the thoracic vertebrae and 5
supporting the lower back are the lumbar vertebrae. Inferior to these, is the sacrum that articulates
with the hipbones of pelvis. The tiny coccyx terminates the entire column. Intervertebral discacts
as a shock absorber and allow the spine to extend. These are thickest inthe lumbar and cervical
regions, enhancing the flexibility in these regions. Its degenerationis relatively a common
phenomena with aging due to wear and tear and is the major cause for back pain[1]. Herniated
disc, spinalstenosis and degenerative discs are a few of the types, to mention. These can be
imaged andstudied from MRI scans and this modality of imaging is prescribed most commonly
for patients with excruciatingback pain. MR imaging of spine is formallyidentified with IR
(Inversion Recovery), T1and T2 weighted images. While water content appears bright in T2(in
medical lingo, its hyper intense which is clearly seen in the spinal canal), the same appears dark
(hypo intense) in T1 images.MR can detectearly signs of bone marrow degeneration with high

International Journal of Fuzzy Logic Systems (IJFLS) Vol.6, No.2,April 2016
24
spatial resolution where fat and water protons are found in abundance. These changes named as
Modic changes can be diagnosed using MR imaging [1]. Degenerated L5 vertebrae and the
associated intensity changes that are prevalent particularly in end plates are shown in fig 1. While
degenerative changes are a biological phenomena occurring in spinal structure that are imaged
using radiological equipment, certain irrelevant processes are also captured. These constitute the
artefacts caused due to intensity inhomogeneity as shown in fig 2. The segmentation process is
highly affected by these complexities present in MR images. Accurate diagnosis remains a
challenge without manual intervention in segmenting the vertebral features. Robust automatic
segmentation of vertebrae from MR images would be a pre requisite for diagnosis using computer
methods. The current work deals with segmentation of vertebrae from MR image using fuzzy c-
means (FCM) clustering for identification and labelling of individual vertebral structures. The
segmented output can be refined further and used for classification of degenerative state as well
as to diagnose deformities.
Figure 1. Degenerated L5
vertebra in MR sagittal
plane
Figure 2. Intensity inhomogeneity captured in lumbar vertebrae
2. LITERATURE
The commonly used segmentation methods are global thresholding, multilevel thresholding and
supervised clustering techniques. In intensity thresholding, the level determined from the grey-
level histogram of the image. The distribution of intensities in medical images, especially in MRI
images is random, and hence global thresholding methods fail due to lack of determining optimal
threshold. In addition, intensity thresholding methods have disadvantage of spatial uncertainty as
the pixel location information is ignored [2]. An edge detection scheme can be used for
identifying contour boundaries of the region of interest (ROI). The guarantee of these lines being
contiguous is very sleek. Also, these methods usually require computationally expensive post-
processing to obtain hole free representation of the objects.
A graph based approach for MRI vertebral body segmentation is proposed in [3].Here anNyström
approximation is used for reducing the processing speed of normalized cut (NCut) method. These
methods maximise the similarity within a subset and dissimilarity between two subsets in an
image. Proposed by Malik and Shi, the problem reduces to solving the generalised Eigen vector
that involves a diagonal matrix and a weighted matrix that is formed using the feature strength of
the image. The computationally intensive calculation of the Eigen vectors is simplified using
Nyström approximation that calculates the diagonal matrix using few random samples and then

International Journal of Fuzzy Logic Systems (IJFLS) Vol.6, No.2,April 2016
25
extends the solution to the complete set. Pre-processing is done using anisotropic diffusion that
provides a coil corrected output.
A semiautomatic classification of spine disorders namely disc herniation, degeneration and spinal
stenosis is presented in [4]. For the case of disc degeneration classification, the authors have
captured MRI response in T2 weighted images. A decrease in mean intensity denotes the level of
degeneration and is classified via Pfirmann scale. Disc segmentation is done using gradient vector
flow (GVF) on the pre-processed imagesfollowed by skeletonization. From the mid-point, a
vertical axis is drawn, to mark the length. Changes in length as well as intensity leads to
classification of abnormalities in disc. Since 90% of herniation [5] happen in Lumbar region, the
processing deals with discs located in the lumbosacral area. For disc herniation, evaluation is
done on contour extracted from axial slice. The classification of herniated discs is either extrusion
or protrusion(focal based or broad based).
A quasi automatic segmentation method for intervertebral disc (IVD) is given in [6]. The only
intervention being, initial point selection for evolving an elliptical contour to be deformed by
snakes. The final refinement of region of interest is done using FCM. A new energy term called
the geometric energy is included with active contour evolving equation that models the shape of
disc and restricts it to a certain limit. In this case, since IVD resemble elliptical structure, the
contour evolution is curtailed when it goes beyond the mentioned shape. Classification of discs is
done using Adaboost classifier while validation is performed using Dice similarity coefficient and
root mean square error (RMSE) between ground truth and segmented disc.
The region growing methods extend the thresholding by integrating it with connectivity by means
of an intensity similarity measure. These methods assume an initial seed position and using
connected neighbourhood, expand the intensity column over surrounding regions. However, they
are highly sensitive to initial seeds and noise. In classification-based segmentation method, FCM
algorithm [7], is more effective with considerable amount of benefits. Unlike hard clustering
methods, like K-means algorithm, which assign pixels exclusively to one cluster, the FCM
algorithm allows pixels to have dependence with multiple clusters with varying degree of
memberships and thus more reasonable in real applications. Using intuitionistic fuzzy clustering
(IFC), where apart from membership functions (MF), non membership values are also defined,
[8]have segmented MR images of brain. The heuristic based segmentation also considers the
hesitation degree for each pixel. A similar study on generic grey scale images is put forth in [9]
where the IFC combines several MF's to address the uncertainty in choosing the best MF.
Detection of Modic changes (MC) can significantly contribute to the lesion detection on the bone
marrow. It can also be associated with disc herniation [1]. It has been shown that the higher the
severity of Modic changes, greater is level of herniation. Automating the process of classification
and detection can in turn lessen the burden of manual demarcation of MC levels for a radiologist.
It can as well provide an accurate percentage of degeneration based on intensity change in signal
compared to the normal level.While a very few articles have been reported in the MR
segmentation of vertebral bodies [10][11][12] because of the complexities involved in delineating
VB's, our focus is on utilising the fuzzy logic for accurately isolating them. The article proposes a
FCM based method to segment vertebral bodies (VB) with morphological post processing. Also
the VB's are labelled which can reduce the burden of radiologist while classifying the
degenerations involved.

International Journal of Fuzzy Logic Systems (IJFLS) Vol.6, No.2,April 2016
26
3. METHODS
The proposed method is schematically depicted in fig. 3. The input image(s) have been collected
from Apollo Speciality Hospitals,Chennai after going through a formal ethical clearance process.
The T1 weighted images, served as the initial dataset for the proposed algorithm. Initially the
image is smoothed using the edge preserving anisotropic diffusion filter. This pre-processing
serves the dual purpose of removing inhomogeneity and as an enhancer as well.
Figure 3. Schematic of the proposed segmentation method
3.1. Fuzzy C-Means Clustering
The FCM[2]has been broadly used invarious pattern and image processing studies [10]–[12].
According to FCM algorithm, the clustering of a dataset can be obtained by minimizing an
objective function J for a known number of clusters:
� = ∑ ∑ ����
����� �� − �� �, 1 ≤ � < ∞ (1)
where ;
k is any real number known as the weighting factor, ���is degree of membership of �� in the
cluster j, ��is theithof p-dimensional measured intensity data, �� is the p-dimensional center of the
jthcluster, ‖∗‖ is any norm expressing the similarity between measured intensity data and center,
and N represents number of pixels while M represents the number of cluster centers. Fuzzy
clustering is performed through an iterative optimisation of objective function shown in Eq. (1)
with update of membership function uijand cluster centersvj as given in Eq. (2). The algorithm is
terminated when maxij{uij at t+1 - uijat t} ≤ ϵ which is between 0 and 1.
��� = 1
∑ ���� !"�� !#
�$%
('())+�
�� = ∑ ,�"' ��-
�.)∑ ,�"
'-�.)
(2)
Input image
Pre-Processing Fuzzy
clustering
Morphological
processing
Labelling

International Journal of Fuzzy Logic Systems (IJFLS) Vol.6, No.2,April 2016
27
3.2. Post Processing and Labelling
A series of morphological operations are executed for extracting the vertebral bodies (VB) from
the clustered output. Hole filling is the preliminary step followed by an erosion to remove islands.
An area metric is used to extract only Vertebrae from surrounding muscular region Shape
analysis [13] reveals that the aspect ratio of VB varies between 1.5 and 2. This helps in isolating
the ligaments and spinal muscles associated with the spine in the region of interest.The segmented
vertebrae are labelled using the connected component entity. Each VB is identified with a group
number. Starting from L5 (Lumbar), the vertebrae are labelled successively till L1. If the sacrum
remains due to improper segmentation, it can be eliminated based on aspect ration or area criteria.
A colour schematic is also presented for visual calibration.
3.3. Validation
The proposed method was validated using Dice coefficient (DC) and Hausdorff distance (HD).
The reference standard for comparison was the annotated images from the radiologist. DC
measures the set agreement as described in following equations, where the images constitute the
two sets. The generalized HD provides a means of determining the similarity between two binary
images. The two parameters used for matching the resemblance between the given images are,
• Maximum distance of separation between points, yet that can still be considered close.
• The fraction that determines how much one point set is far apart from the other.
/(0, 1) = �|3∩5||3|6|5| (Dice Coefficient)
/(0, 1) = 78�9:∈3
{7=>9?∈5
{@(8, A)BB (Hausdorff Distance)
where, a, b are points from the images A,B respectively.
4. RESULTS AND DISCUSSION
The method is tested on sagittal cross-section of T1-weighted MR images of spine.The goal is to
segment the vertebral bodies from the muscular background and label them accordingly.In total
16 patient data (MR images) were used for this study. The patients complained of mild lower
back pain and are in the age group between 45-60. The population included 8 female and 8 male.
The results from FCM were compared with the segmentation using Otsu thresholding and K-
means clustering is presented in the subsequent sections.
4.1. Illustration of Methodology
One of the patients MR sagittal slice of spine considered for the current study is shown in fig 4(a)
and the proposed methodology of FCM for segmentation and labelling of vertebrae is illustrated
in fig 4(b-d). After the pre-processing stage, the enhanced input is clustered using the FCM
technique followed by a set of morphological operations (the results are shown in fig.
4(b)).Automatic labeling of vertebrae is usually performed to reduce the manual effort put in by
the radiologist. It can be seen from fig 4(c) and (d), the labeled vertebrae and its color scheme can
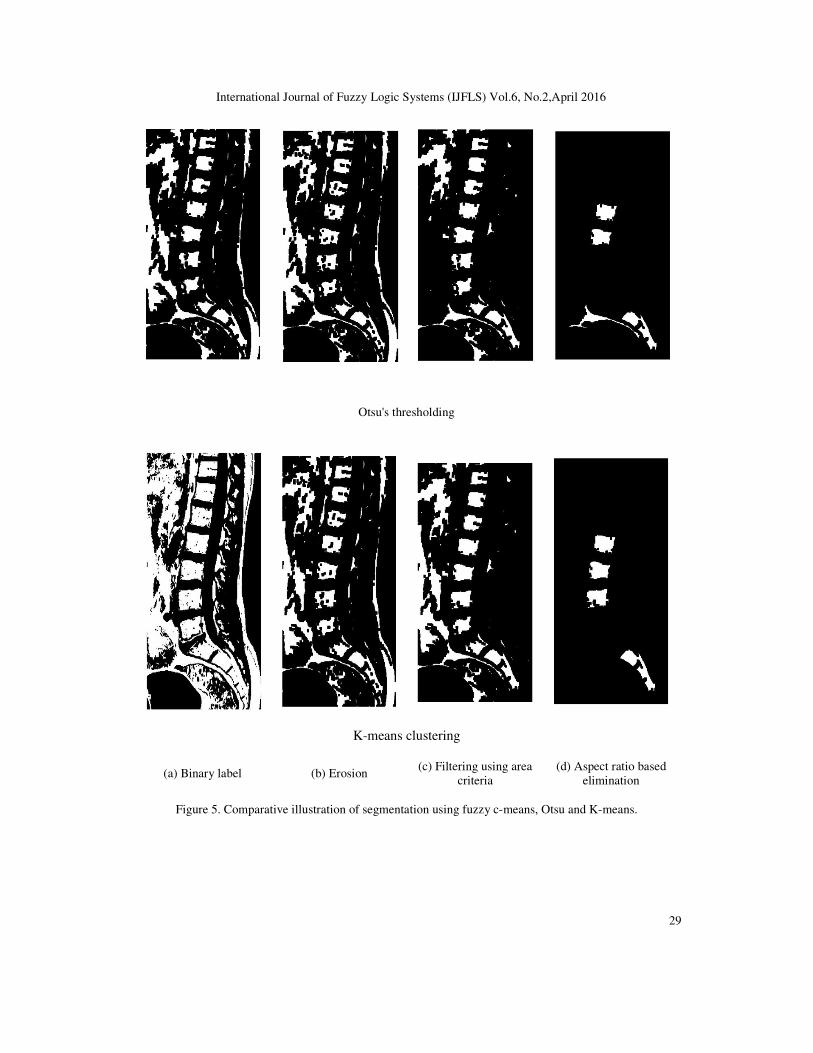
help in better diagnosis. The intermediate steps involve various morphological operations that are
depicted in fig 5. It can be seen that, the fuzzy clustering provides a closer disjoint VB's owing to

International Journal of Fuzzy Logic Systems (IJFLS) Vol.6, No.2,April 2016
28
which one can erode the muscular region and thus arrive at delineating the same. Also shown in
fig 5. are the output obtained using Otsu thresholding and K means clustering with the
intermediate steps. An image overlay of the input and segmented output using FCM for all the 16
cases considered for the study is presented in fig 6.
(a) Input image (b) Segmented output (c) Labeled image (d) Color code
Figure 4. MR segmentation and labeling.
Fuzzy c-means clustering
International Journal of Fuzzy Logic Systems (IJFLS) Vol.6, No.2,April 2016
29
Otsu's thresholding
K-means clustering
(a) Binary label (b) Erosion (c) Filtering using area
criteria
(d) Aspect ratio based
elimination
Figure 5. Comparative illustration of segmentation using fuzzy c-means, Otsu and K-means.

International Journal of Fuzzy Logic Systems (IJFLS) Vol.6, No.2,April 2016
30
Case I Case II Case III Case IV
Case V Case VI Case VII Case VIII
Case IX Case X Case XI Case XII
Case XIII Case XIV Case XV Case XVI
Figure 6. Overlay of segmented image with input for various case studies

International Journal of Fuzzy Logic Systems (IJFLS) Vol.6, No.2,April 2016
31
4.2. Comparative Analysis
A comparative studyon performances of Otsu thresholding, k-means clustering and the FCM was
conducted based on DC and HD metric as compared to the gold standard segmentation by
radiologist. While a DC metric should be as close to unity, HD on the contrary, has to be low for
achieving accurate segmentation results. Statistical analysis of these metric for the results
obtained for the 16 cases considered for the study was performed. A descriptive statistical
analysis was carried and the results tabulated in table I and II. It can be observed that the Fuzzy
method provides better DC value (closer to 1) and HD value (closer to 0) than compared to the
rest thus affirming the robustness in segmentation. The result of the study is illustrated in the form
of box plot in figures 7 and 8. It is inferred from the plot that fuzzy clustering outperforms the
other two methods chosen for comparison. FCM also shows lower variance and thus indicating
robustness. Otsu thresholding has a relatively large variance in DC metric. In the case of HD
metric, K-means has a larger variance.
Table I . Descriptive statistics for DC Validation metric
N Mean SD SEM
Otsu thresholding 16 0.31674 0.14542 0.03635
K means clustering 16 0.78621 0.05227 0.01307
Fuzzy c means clustering 16 0.8672 0.0407 0.01017
Table II . Descriptive statistics for HD Validation metric
N Mean SD SEM
Otsu thresholding 16 13.76807 2.80003 0.70001
K means clustering 16 8.5913 2.56782 0.64195
Fuzzy c means clustering 16 5.40424 1.12019 0.28005
Figure 7. Comparative analysis of methods using Dice coefficient

International Journal of Fuzzy Logic Systems (IJFLS) Vol.6, No.2,April 2016
32
Figure 8. Comparative analysis of methods using Hausdorff distance
4.3.Time Complexity The computational time taken for the proposed algorithm is compared against time expended by
Otsu thresoldingand K-means clustering and tabulated in table III. It can be seen that mean time
for fuzzy clustering is almost 5 times the time taken by Otsu thresholding and K-means
clustering. However, since the operation is executed in seconds, it is deduced that additional
computational burden might not play a significant role and is justified due to the higher quality of
results obtained using FCM. The result of the analysis are also shown as box plot in figure 9.
Table III . Descriptive statistics for computational time
N Mean SD SEM
Otsu thresholding 16 0.00235 8.26735E-4 2.06684E-4
K means clustering 16 1.27684 0.35717 0.08929
Fuzzy c means clustering 16 5.61202 0.80793 0.20198
4.4. Failure Case
The method was tested on several images and in some images the segmentation failed to provide
quality results. The transverse and spinous processes are a part of vertebral bodies. Thus, when
they start emerging, with disruption in intensity as well as structure, the fuzzy clustering method
fails to adapt to the complex topology. Apart from this, the presence of anterior and posterior
ligaments also significantly affects the results of the segmentation. Fig. 10. shows the results of
segmentation of one such case where the ROI has not been delineated clearly. It should be noted
that the other competing methods considered for the study namely, Otsu thresholding as well as
K-means clustering were also not successful in proving the segmentation in these cases.

International Journal of Fuzzy Logic Systems (IJFLS) Vol.6, No.2,April 2016
33
Figure 9. Box plot featuring the computational time elapsed (in seconds)
Figure 10. A failure case of proposed segmentation
5. CONCLUSIONS
In this paper, a FCM algorithm followed by morphological operations and labelling has been
presented for segmentation of vertebra from spine MR images. It is compared with the simple K-
means clustering and Otsu thresholding scheme. The study included 16 patient dataset
constituting 8 female and 8 male T1-weighted MR images of spine for comparison and validation.
Upon validation, it is observed that the FCM method gives improved segmentation results as
compared to the counterparts. Time complexity of the methods is also presented. As a part of

International Journal of Fuzzy Logic Systems (IJFLS) Vol.6, No.2,April 2016
34
future work, we would like improve the method by incorporating intuitionistic fuzzy clustering
scheme and also extract features from the segmented VB for classifying various deformity.
ACKNOWLEDGEMENTS
The first author would like to thank the Department of Science and Technology [DST], India, for
supporting the research through INSPIRE fellowship
REFERENCES
[1] H. B. Albert, P. Kjaer, T. S. Jensen, J. S. Sorensen, T. Bendix, and C. Manniche, “Modic changes,
possible causes and relation to low back pain,” Med. Hypotheses, vol. 70, no. 2, pp. 361–368, 2008.
[2] S. R. Kannan, S. Ramathilagam, a. Sathya, and R. Pandiyarajan, “Effective fuzzy c-means based
kernel function in segmenting medical images,” Comput. Biol. Med., vol. 40, no. 6, pp. 572–579,
2010.
[3] J. Carballido-Gamio, S. J. Belongie, and S. Majumdar, “Normalized cuts in 3-D for spinal MRI
segmentation.,” IEEE Trans. Med. Imaging, vol. 23, no. 1, pp. 36–44, Jan. 2004.
[4] S. Ruiz-españa and E. Arana, “Semiautomatic computer-aided classification of degenerative lumbar
spine disease in magnetic resonance imaging,” Comput. Biol. Med., 2015.
[5] C. Dora, M. R. Schmid, A. Elfering, M. Zanetti, J. Hodler, and N. Boos, “Lumbar disk herniation: do
MR imaging findings predict recurrence after surgical diskectomy?,” Radiology, vol. 235, no. 2, pp.
562–567, 2005.
[6] I. Castro-Mateos, J. M. Pozo, A. Lazary, and A. F. Frangi, “2D segmentation of intervertebral discs
and its degree of degeneration from T2-weighted magnetic resonance images,” Spie Med. Imaging
Comput. Aided Diagnosis, vol. 9035, no. figure 1, p. 903517, 2014.
[7] T. Chaira, “A novel intuitionistic fuzzy C means clustering algorithm and its application to medical
images,” Appl. Soft Comput. J., vol. 11, no. 2, pp. 1711–1717, 2011.
[8] Y. K. Dubey and M. M. Mushrif, “Segmentation of brain MR images using intuitionistic fuzzy
clustering algorithm,” Proc. Eighth Indian Conf. Comput. Vision, Graph. Image Process. - ICVGIP
’12, pp. 1–6, 2012.
[9] V. P. Ananthi, P. Balasubramaniam, and C. P. Lim, “Segmentation of gray scale image based on
intuitionistic fuzzy sets constructed from several membership functions,” Pattern Recognit., vol. 47,
no. 12, pp. 3870–3880, 2014.
[10] I. Ben Ayed, K. Punithakumar, and R. Minhas, “Vertebral Body Segmentation in MRI via Convex
Relaxation and Distributipn Matching,” MICCAI, pp. 520–527, 2012.
[11] P. D. Barbieri, G. V. Pedrosa, A. J. M. Traina, and M. H. Nogueira-Barbosa, “Vertebral Body
Segmentation of Spine MR Images Using Superpixels,” 2015 IEEE 28th Int. Symp. Comput. Med.
Syst., pp. 44–49, 2015.
[12] M. Lootus, T. Kadir, and A. Zisserman, “Vertebrae Detection and Labelling in Lumbar MR Images,”
Lect. Notes Comput. Vis. Biomech., vol. 17, pp. 219–230, 2014.
[13] C. kong chui Bing Nan li, “Integrating spatial fuzzy clustering with level set methods for automated
medical image segmentation,” Comput. Biol. Med., 2011.
[14] I. Nedeljkovic, “Image Classification Based on Fuzzy Logic,” pp. 1–6, 2004.
[15] M. Gong, Y. Liang, J. Shi, W. Ma, and J. Ma, “Fuzzy C-means clustering with local information and
kernel metric for image segmentation,” IEEE Trans. Image Process., vol. 22, no. 2, pp. 573–584,
2013.