fundamental characterization of asphalt mixtures: warm mix
TRANSCRIPT
Louisiana State UniversityLSU Digital Commons
LSU Master's Theses Graduate School
2012
Fundamental characterization of asphalt mixtures:warm mix asphalt technologies in flexible pavementsystemsBHANU VIJAY VALLABHULouisiana State University and Agricultural and Mechanical College, [email protected]
Follow this and additional works at: https://digitalcommons.lsu.edu/gradschool_theses
Part of the Civil and Environmental Engineering Commons
This Thesis is brought to you for free and open access by the Graduate School at LSU Digital Commons. It has been accepted for inclusion in LSUMaster's Theses by an authorized graduate school editor of LSU Digital Commons. For more information, please contact [email protected].
Recommended CitationVALLABHU, BHANU VIJAY, "Fundamental characterization of asphalt mixtures: warm mix asphalt technologies in flexible pavementsystems" (2012). LSU Master's Theses. 337.https://digitalcommons.lsu.edu/gradschool_theses/337
FUNDAMENTAL CHARACTERIZATION OF ASPHALT MIXTURES: WARM MIX
ASPHALT TECHNOLOGIES IN FLEXIBLE PAVEMENT SYSTEMS
A Thesis
Submitted to the Graduate Faculty of the
Louisiana State University and
Agricultural and Medical College
in partial fulfillment of the
requirements for the degree of
Master of Science in Civil Engineering
in
The Department of Civil and Environmental Engineering
by
Bhanu Vijay Vallabhu
B.E., Osmania University, Hyderabad, India, 2008
December 2012
ii
ACKNOWLEDGEMENTS
I consider the completion of this research as dedication and support of a group of people
rather than my individual effort. I wish to express my gratitude to everyone that assisted me in
fulfilling this research project.
First of all, I would like to express my sincere thanks and appreciation to my academic
advisor Professor Louay N. Mohammad for his support, guidance, encouragement, and help
throughout the course of this work. I am grateful to him for his acceptance of me as his graduate
research assistant and providing me the opportunity to enhance my knowledge in the field of
Transportation Engineering.
I would like to thank Dr. Mostafa Elseifi, and Dr. Marwa Hassan for their assistance in
the research work, and for serving on my advisory committee. Their cooperation, guidance and
patience have been invaluable.
My thanks to Amar Raghavendra, William Bill King Jr., Samuel Cooper III, Craig
Johnson, Kabir Sharear, Nachiketa Patel and Patrick Icenogle can never be enough in mere
words. They helped me in every possible way all through the project. Without their guidance and
cooperation I could not have finished the work. I would like to acknowledge the Louisiana
Transportation Research Center (LTRC) for the great research facilities provided. Thanks are
due to Sam Cooper Jr, Dr. Minkyum Kim, William L. Gueho, Patrick Frazier for their valuable
assistance.
I would like to acknowledge my friends and co-workers Paul, Farshad, Justin, Vivek,
James for their priceless support and contributions for this research.

iii
Last but not the least; I would like to express my gratitude to my parents Narasimha Rao
and Tulasi, my uncle Vasu, and my sister and brother, for their never ending support. Their
constant encouragement, patience, sacrifice and moral support saw me through the finish.
iv
TABLE OF CONTENTS
ACKNOWLEDGEMENTS ............................................................................................................ II
LIST OF TABLES ....................................................................................................................... VII
LIST OF FIGURES ...................................................................................................................... IX
ABSTRACT ............................................................................................................................... XIII
CHAPTER 1 : INTRODUCTION ................................................................................................ 15
1.1 Introduction ......................................................................................................................... 15
1.2 Background ......................................................................................................................... 16
1.3 Problem Statement .............................................................................................................. 18
1.4 Objectives ............................................................................................................................ 19
1.5 Scope ................................................................................................................................... 19
1.6 Outline ................................................................................................................................. 20
CHAPTER 2 : LITERATURE REVIEW ..................................................................................... 22
2.1 WMA Classification ............................................................................................................ 22
2.1.1 Foaming Techniques ..................................................................................................... 22
2.1.2 Organic or Wax Additives ............................................................................................ 24
2.1.3 Chemical Additives ...................................................................................................... 24
2.1.4 WMA Technologies Evaluated .................................................................................... 24
2.2 Previous Research Studies on Performance of Different WMA Technologies .................. 26
2.3 Previous Research Studies on Environmental and Economic Benefits .............................. 30
CHAPTER 3 : MEHTODOLOGY ............................................................................................... 32
3.1 Introduction ......................................................................................................................... 32
3.2 Field Projects ....................................................................................................................... 32
3.3 Asphalt Mixture Design ...................................................................................................... 33
3.4 Specimen Preparation .......................................................................................................... 39
3.4.1 Specimen Modifications ............................................................................................... 44
v
3.5 Laboratory Mechanistic Tests ............................................................................................. 53
3.5.1 High Temperature Mechanistic Tests ........................................................................... 54
3.5.1a Dynamic Modulus Test ............................................................................................... 54
3.5.1b Flow Number Test ...................................................................................................... 57
3.5.1c Loaded Wheel Test ..................................................................................................... 59
3.5.2 Intermediate Temperature Mechanistic Tests............................................................... 61
3.5.2a Indirect Tensile Strength Test ..................................................................................... 61
3.5.2b Semi-Circular Bend Test ............................................................................................ 65
3.5.2c Dissipated Creep Strain Energy Test .......................................................................... 67
3.5.2d Beam Fatigue Test ...................................................................................................... 70
3.5.3 Low Temperature Mechanistic Tests ........................................................................... 73
3.5.3a Thermal Stress Restrained Specimen Test .................................................................. 73
3.5.4 Durability ...................................................................................................................... 75
3.5.4a Modified Lottman Test ............................................................................................... 75
3.6 Economic and Environmental Performance of Warm Mix Asphalt ................................... 76
3.6.1 Introduction .................................................................................................................. 76
3.6.2 Environmental Performance of WMA ......................................................................... 78
3.6.3 Life-Cycle Assessment ................................................................................................. 80
3.6.4 Cost and Energy Savings .............................................................................................. 81
CHAPTER 4 : DISCUSSION OF RESULTS .............................................................................. 83
4.1 Introduction ......................................................................................................................... 83
4.2 Statistical Analysis .............................................................................................................. 84
4.3 Mixture Characterization Test Results ................................................................................ 85
4.3.1 High Temperature Mechanistic Tests ........................................................................... 85
4.3.1.1 Dynamic Modulus Test Results ................................................................................. 85
4.3.1.2 Flow Number Test ................................................................................................... 100
4.3.1.3 Loaded Wheel Tracking Test Results ...................................................................... 105
4.3.2 Intermediate Temperature Mechanistic Tests............................................................. 111
4.3.2.1 Indirect Tensile Strength Test Results ..................................................................... 111
4.3.2.2 Semi-Circular Bend (SCB) Test Results ................................................................. 116
4.3.2.3 Dissipated Creep Strain Energy (DCSE) Test ......................................................... 120
4.3.2.4 Beam Fatigue Test ................................................................................................... 123
4.3.3 Low Temperature Mechanistic Tests ......................................................................... 126
4.3.3.1 Thermal Stress Restrained Specimen Test .............................................................. 126
vi
4.3.4 Durability .................................................................................................................... 129
4.3.4.1 Modified Lottman Test ............................................................................................ 129
4.4 Statistical Ranking of the Asphalt Mixtures ..................................................................... 132
4.5 Correlation between Performance Properties .................................................................... 134
4.6 Cost and Energy Analysis ................................................................................................. 138
4.6.1 Economic Impacts ...................................................................................................... 138
4.6.2 Environmental Impacts ............................................................................................... 139
4.6.3 Life Cycle Assessment ............................................................................................... 139
CHAPTER 5 : CONCLUSIONS AND RECOMMENDATIONS ............................................. 142
5.1 Summary and Conclusions ................................................................................................ 142
5.2 Recommendations ............................................................................................................. 146
REFERENCES ........................................................................................................................... 147
APPENDIX: MECHANISTIC TEST RESULTS ...................................................................... 154
VITA ........................................................................................................................................... 201
vii
LIST OF TABLES
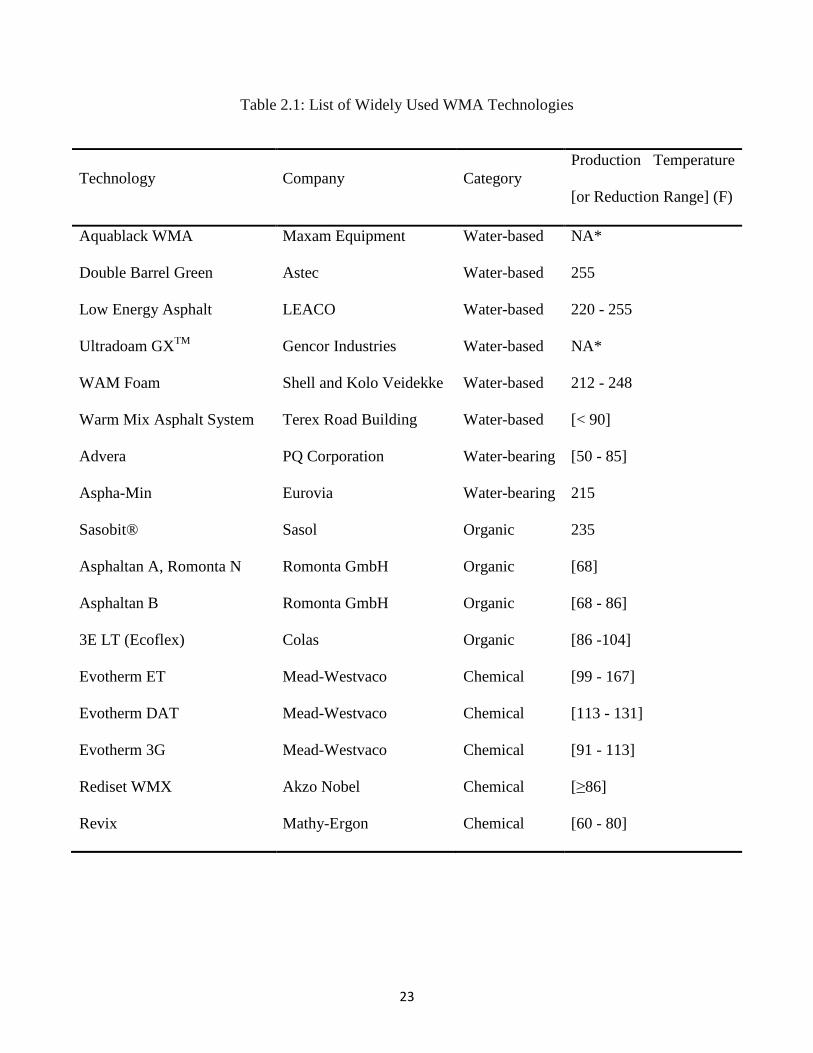
Table 2.1: List of Widely Used WMA Technologies ................................................................... 23
Table 3.1: Field Projects and Mixture Details .............................................................................. 34
Table 3.2: Louisiana Specification Requirements and Test Results of PG70-22M Binder .......... 36
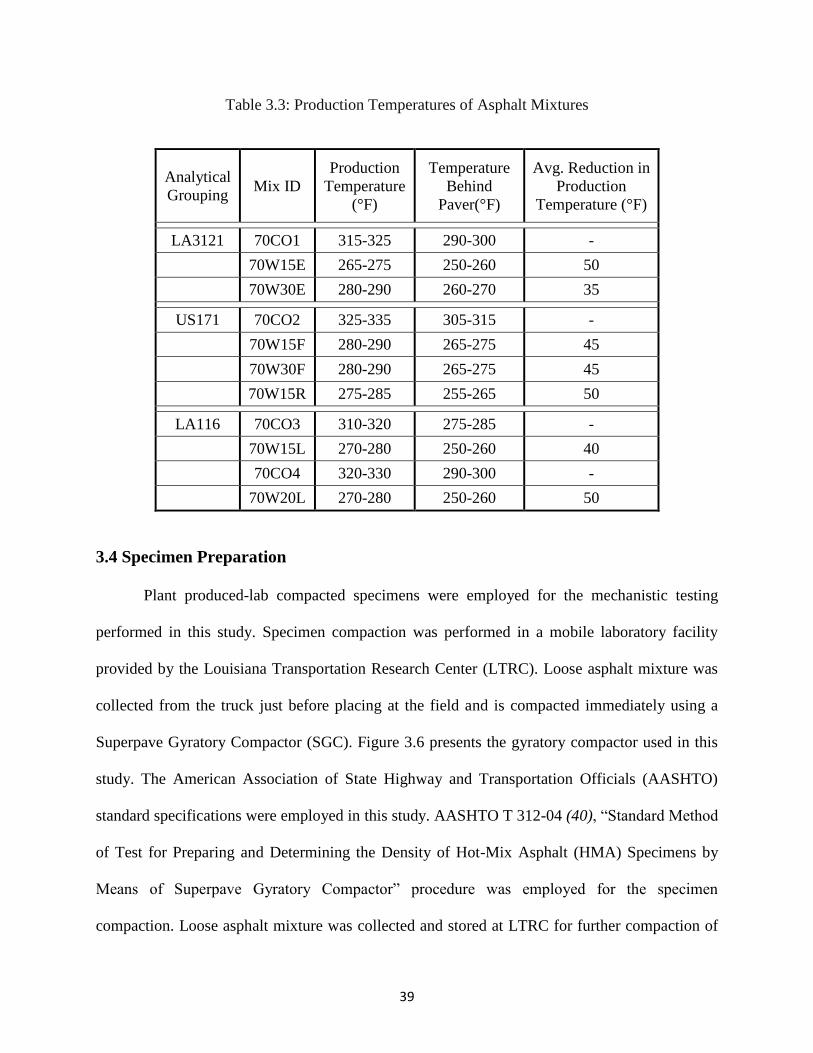
Table 3.3: Production Temperatures of Asphalt Mixtures............................................................ 39
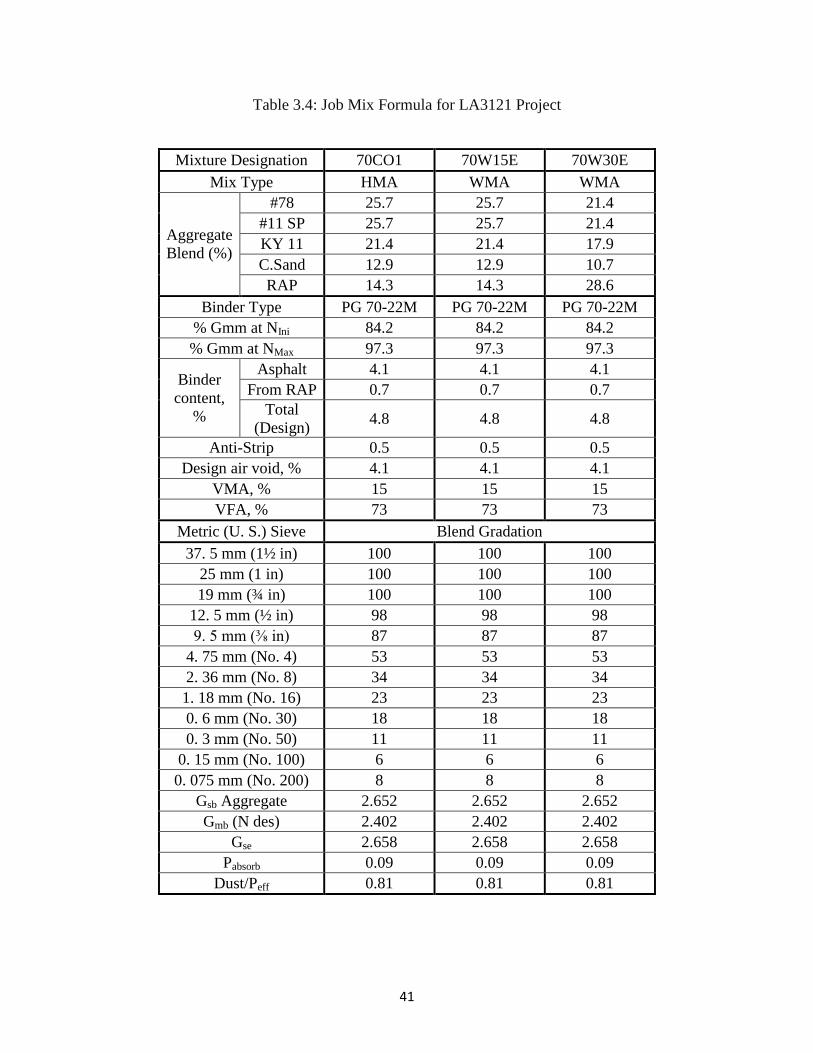
Table 3.4: Job Mix Formula for LA3121 Project ......................................................................... 41
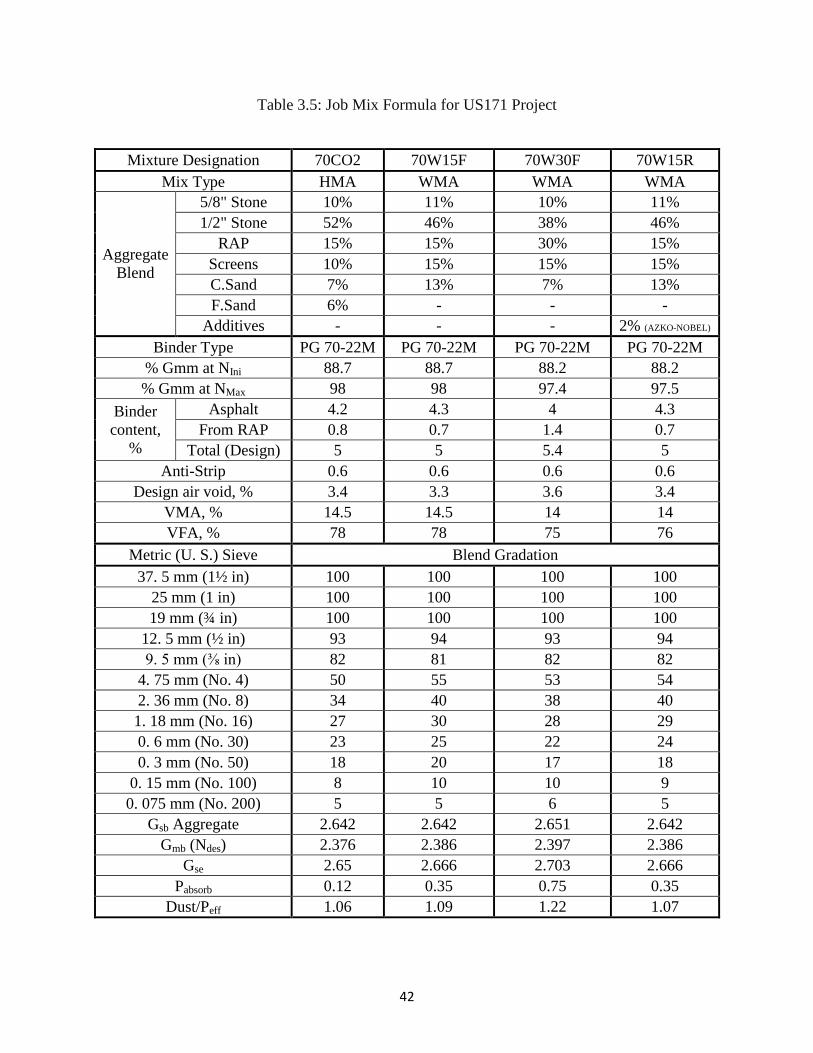
Table 3.5: Job Mix Formula for US171 Project ........................................................................... 42
Table 3.6: Job Mix Formula for LA116 Project ........................................................................... 43
Table 3.7: Test Factorial ............................................................................................................... 52
Table 3.8: Laboratory Mechanistic Tests...................................................................................... 53
Table 4.1: Statistical Analyses on Dynamic Test Data and Rut Factor ........................................ 99
Table 4.2: Statistical Analyses on Dynamic Test Data and Fatigue Factor ................................ 101
Table 4.3: Statistical Analyses on Flow Number Results for LA3121 Project .......................... 103
Table 4.4: Statistical Analyses on Flow Number Results for US171 Project ............................. 104
Table 4.5: Statistical Analyses on Flow Number Results for LA116 Project ............................ 105
Table 4.6: Statistical Analyses on LWT Results for LA3121 Project ........................................ 108
Table 4.7: Statistical Analyses on LWT Results for US171 Project .......................................... 109
Table 4.8: Statistical Analyses on LWT Results for LA116 Project .......................................... 109
Table 4.9: LWT Test Results: Creep Slope and Post Compaction Slope ................................... 110
Table 4.10: Statistical Analyses on ITS Test Results for LA3121 Project ................................. 115
Table 4.11: Statistical Analyses on ITS Test Results for US171Project .................................... 116
Table 4.12: Statistical Analyses on ITS Test Results for LA116 Project ................................... 116
Table 4.13: SCB Test Results and Statistical Analyses .............................................................. 117
viii
Table 4.14: DCSE Test Results .................................................................................................. 121
Table 4.15: Fatigue Curve Fitting Coefficients (Power Model Form) ....................................... 126
Table 4.16: Modified Lottman Test Results ............................................................................... 130
Table 4.17: Overall Statistical Ranking of the Asphalt Mixtures ............................................... 133
Table 4.18: Criteria for Goodness of Fit Statistical Parameters ................................................. 135
Table 4.19: Fuel Savings in Field Projects and Average Energy Cost Comparison ................... 139
ix
LIST OF FIGURES
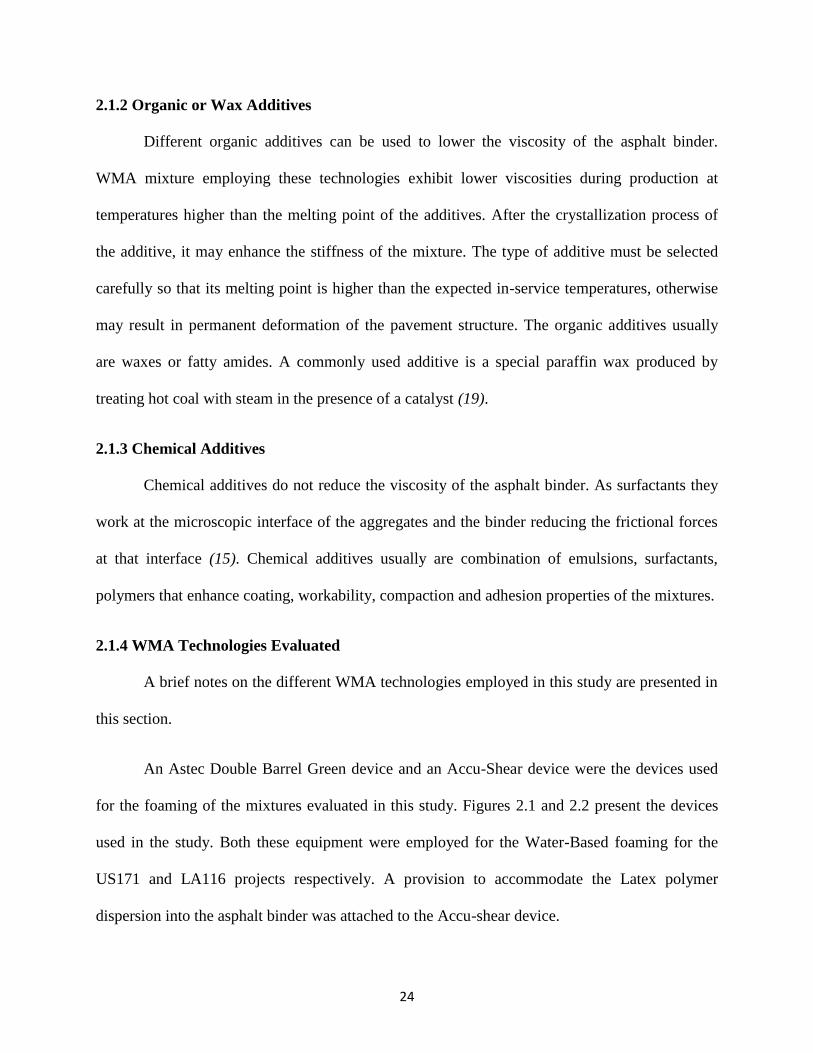
Figure 2.1: Astec Double Barrel Green Foaming Device ............................................................. 25
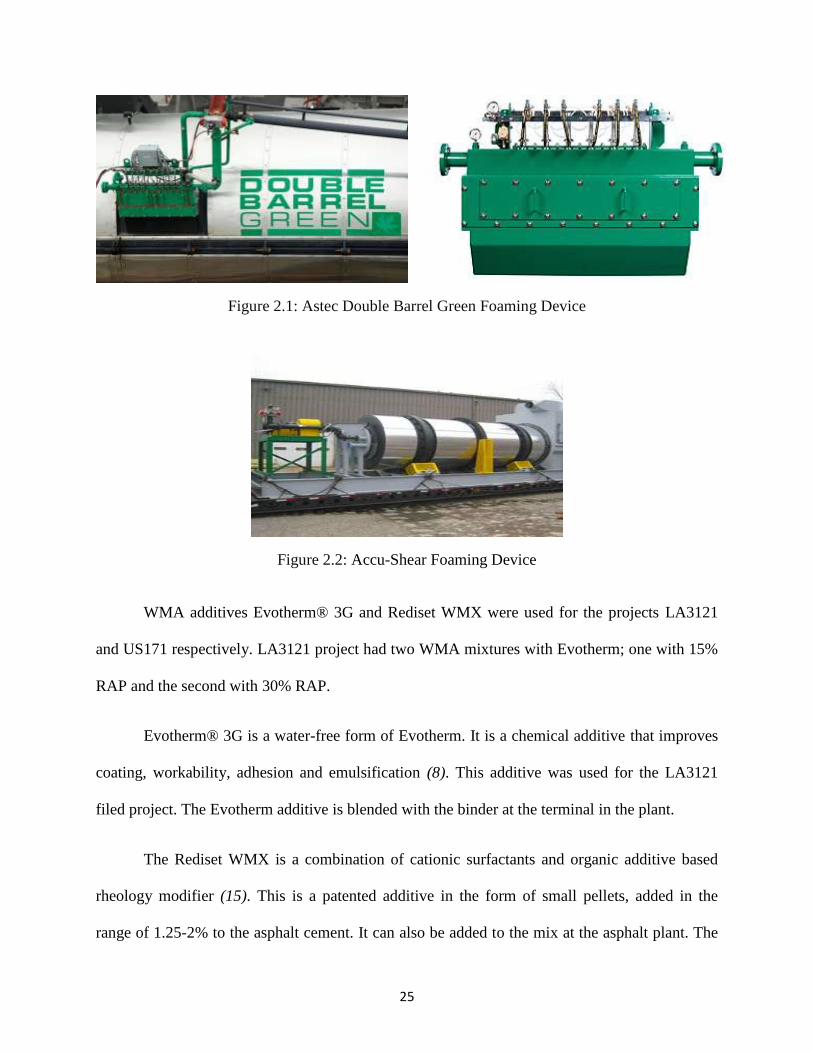
Figure 2.2: Accu-Shear Foaming Device...................................................................................... 25
Figure 3.1: Field Project Locations ............................................................................................... 33
Figure 3.2: Aggregate Gradation for LA3121 Project .................................................................. 37
Figure 3.3: Aggregate Gradation for US171 Project .................................................................... 37
Figure 3.4: Aggregate Gradation for LA116 Project .................................................................... 38
Figure 3.5: Aggregate Gradation for LA116 Project .................................................................... 38
Figure 3.6: Superpave Gyratory Compactor (SGC) ..................................................................... 40
Figure 3.7: Linear Kneading Compactor ...................................................................................... 44
Figure 3.8: Specimens After Compaction ..................................................................................... 45
Figure 3.9: Sample Coring Using a Portable Coring Device ........................................................ 46
Figure 3.10: Sample Trimming and Grinding Operation.............................................................. 46
Figure 3.11: Parallel Surface Check ............................................................................................. 47
Figure 3.12: Pressure Machine for Attaching Studs ..................................................................... 48
Figure 3.13: Metallic Clamp and LVDT Setup ............................................................................ 48
Figure 3.14: SCB Specimen Fabrication ...................................................................................... 49
Figure 3.15: Attaching Targets onto DCSE Specimen ................................................................. 50
Figure 3.16: Stress-Strain Response in Dynamic Modulus Test .................................................. 55
Figure 3.17: Universal Testing Machine (UTM) and SPT Apparatus .......................................... 56
Figure 3.18: Typical Unconfined Dynamic Modulus Test Setup ................................................. 57
Figure 3.19: Typical Permanent Deformation Curve and Computation of Flow Number ........... 59
Figure 3.20: Hamburg Wheel Tracking Device ............................................................................ 60
x
Figure 3.21: Typical LWT Test Output ........................................................................................ 61
Figure 3.22: Load Application for ITS Test ................................................................................. 62
Figure 3.23: ITS Test Set-up ......................................................................................................... 64
Figure 3.24: Toughness Index Computation ................................................................................. 64
Figure 3.25: SCB Test Setup and Specimen Configuration ......................................................... 66
Figure 3.26: Loading and Failure of Specimen During SCB Test ................................................ 66
Figure 3.27: Typical Load Deflection Curves from SCB Test ..................................................... 67
Figure 3.28: DCSE Test Setup ...................................................................................................... 69
Figure 3.29: DCSE On-Sample Instrumentation ......................................................................... 69
Figure 3.30: DCSE Calculation Procedure ................................................................................... 70
Figure 3.31: Beam Fatigue Test Setup .......................................................................................... 71
Figure 3.32: Typical Modulus versus Cycles Plot from Beam Fatigue Test ................................ 73
Figure 3.33: TSRST Test Setup .................................................................................................... 74
Figure 3.34: Humboldt Testing Apparatus for Modified Lottman Test ....................................... 76
Figure 3.35: Emission Measurements ........................................................................................... 80
Figure 4.1: Dynamic Modulus Isotherms at -10 °C ...................................................................... 86
Figure 4.2: Dynamic Modulus Isotherms at 4.4 °C ...................................................................... 86
Figure 4.3: Dynamic Modulus Isotherms at 25.0 °C .................................................................... 87
Figure 4.4: Dynamic Modulus Isotherms at 37.8 °C .................................................................... 87
Figure 4.5: Dynamic Modulus Isotherms at 54.4 °C .................................................................... 88
Figure 4.6: Phase Angles with respect to Dynamic Modulus ....................................................... 89
Figure 4.7: Phase Angle Isotherms at -10 °C ................................................................................ 90
Figure 4.8: Phase Angle Isotherms at 4.4 °C ................................................................................ 90
xi
Figure 4.9: Phase Angle Isotherms at 25.0 °C .............................................................................. 91
Figure 4.10: Phase Angle Isotherms at 37.8 °C ............................................................................ 91
Figure 4.11: Phase Angle Isotherms at 54.4 °C ............................................................................ 92
Figure 4.12: E* ratios at 5Hz at All Test Temperatures ............................................................... 93
Figure 4.13: Master Curves developed from E* test results ......................................................... 97
Figure 4.14: Rutting Factor at 5Hz, 54.4°C .................................................................................. 98
Figure 4.15: Fatigue Factor at 5Hz, 25°C ................................................................................... 100
Figure 4.16: Flow Number test results ........................................................................................ 102
Figure 4.17: LWT Test Results – Rut Depth .............................................................................. 106
Figure 4.18: LWT Test Results – Rut Profile ............................................................................. 107
Figure 4.19: ITS Test Results – Indirect Tensile Strength .......................................................... 112
Figure 4.20: ITS Test Results – Indirect Tensile Strain .............................................................. 112
Figure 4.21: ITS Test Results – Toughness Index ...................................................................... 113
Figure 4.22: ITS Test Results – Normalized Ratios ................................................................... 114
Figure 4.23: ITS Test Results – Aging Index Values and Ratios ............................................... 114
Figure 4.24: SCB Test Results – Peak Loads at Different Notch Depths................................... 118
Figure 4.25: SCB Test Results – Area (Strain Energy) at Different Notch Depths.................... 119
Figure 4.26: SCB Test Results – Jc values and Jc Ratios ............................................................ 119
Figure 4.27: DCSE Test Results: DCSE Values and Ratios ....................................................... 121
Figure 4.28: DCSE Test Results: Resilient Modulus and Ratios ............................................... 122
Figure 4.29: Beam Fatigue Test Results: Modulus of the Mixtures ........................................... 124
Figure 4.30: Beam Fatigue Test Results: Normalized Modulus of the Mixtures ....................... 124
Figure 4.31: Beam Fatigue Test Results for US171 Project ....................................................... 125
xii
Figure 4.32: Beam Fatigue Test Results for LA116 Project ....................................................... 125
Figure 4.33: TSRST Test Results: Fracture Temperature .......................................................... 127
Figure 4.34: TSRST Test Results: Fracture Load ....................................................................... 128
Figure 4.35: Modified Lottman Test Results: Tensile Strength ................................................. 131
Figure 4.36: Modified Lottman Test Results: Tensile Strength Ratio ........................................ 131
Figure 4.37: Correlation between Rut Depth and Flow Number ................................................ 135
Figure 4.38: Correlation between Rut Depth and Dynamic Modulus ........................................ 136
Figure 4.39: Correlation between LWT and Lottman Test Results ............................................ 136
Figure 4.40: Correlation between Toughness Index and DCSE values ...................................... 137
Figure 4.41: Correlation between Toughness Index and Fatigue Factor .................................... 137
Figure 4.42: Average CO and CO2 Emissions during Production and Placement of HMA and
WMA ................................................................................................................................... 140
Figure 4.43: Environmental Impacts of WMA ........................................................................... 141
xiii
ABSTRACT
Increasing concerns on environment and greenhouse effect, coupled with increased
construction prices led to the development of new technologies by the Asphalt industry to
produce Asphalt Concrete (AC) pavements. Extensive research is being done to evaluate the
impact and performance of these new technologies. Warm Mix Asphalt (WMA) is one of these
technologies that allow mixing, production, placing and compaction of asphalt mixes at
significantly lower temperatures as compared to the traditional Hot Mix Asphalt (HMA)
practice. Lower temperatures result in reduced fuel usage, fume exhausts, greenhouse gas
emissions, wear and tear at plants; while enhancing worker health and safety conditions. The
performance characteristics of asphalt mixtures containing WMA technologies may be affected
and should be quantified.
A detailed laboratory study has been conducted to evaluate and quantify the performance
of different WMA technologies. Eleven mixes from three overlay field projects across Louisiana
were taken into consideration. Evotherm, Rediset, Foaming and Latex were different warm mix
technologies used. Each project included a companion HMA mixture section to allow
comparison of WMA to conventional HMA. Mechanistic tests were conducted on plant
produced–lab compacted (PL) specimens to evaluate Rutting (permanent deformation),
Fatigue/Fracture and Low temperature cracking performance of the mixtures at high,
intermediate and low temperatures respectively. The testing factorial included Dynamic
Modulus, Indirect Tensile Strength (ITS), Flow Number (FN), Loaded Wheel Tester (LWT),
Beam Fatigue, Semi-Circular Bend (SCB), Dissipated Creep Strain Energy (DCSE), Thermal
Stress Restrained Specimen Test (TSRST) and Modified Lottman Test. A Life Cycle Assessment
(LCA) has been performed to evaluate the economic and environmental benefits of WMA.

xiv
Overall, the WMA mixtures showed similar performance compared to that of control
HMA mixtures. Asphalt mixtures with Rediset and Latex showed better performance than
conventional mixtures with respect to fatigue and permanent deformation. The use of WMA
technologies resulted in lesser aging of the binder. Energy assessment has shown a 12-15 %
energy savings, mostly attributed to the reduction in heating temperature of the production plant.
On average, $1.61 of cost savings per ton of produced asphalt was observed along with a
considerable reduction in air pollutants without any reduction in the mechanistic performance of
these mixtures.
15
CHAPTER 1 : INTRODUCTION
1.1 Introduction
Increasing concerns on environment and greenhouse effect, coupled with increased
construction prices led to the development of new technologies by the Asphalt industry to
produce Asphalt Concrete (AC) pavements. Extensive research is being done to evaluate the
impact and performance of these new technologies. Warm Mix Asphalt (WMA) is one of these
technologies that allow mixing, production, placing and compaction of asphalt mixes at
significantly lower temperatures as compared to the traditional Hot Mix Asphalt (HMA)
practice. WMA technologies were first developed in Europe with the aim of reducing greenhouse
gases (1).
Implementing WMA technologies offers a wide variety of benefits, including reduced
fuel usage and emissions, easier compaction, possible use of higher percentage of RAP, extended
paving season, longer haul times and distances, and improved job site conditions for workers (2).
WMA practice could be a potential step towards preserving resources while addressing growing
environmental sustainability. Broadly, WMA technologies can be classified into two categories
based on the way they achieve lower binder viscosity (2): use of chemical additives and through
a foaming process.
WMA practice can have a significant impact on transportation construction projects in
and around non-attainment areas such as large metropolitan areas that have air quality
restrictions. The reduction in fuel usage to produce the mix would also have a significant impact
on the cost of transportation construction projects. With the availability of several proprietary
chemicals and processes, it is now possible to produce warm asphalt without affecting the
16
properties of the mix. However, the lower mixing temperatures have raised concerns that the
aggregates may contain moisture and yield a mixture that is moisture susceptible. Another
concern is that the asphalt binder may not possess adequate stiffness characteristics at elevated
pavement surface temperatures, resulting in rutting susceptibility. This brings up the need to
thoroughly test the WMA mixtures to ensure the adequate performance of the mixtures.
1.2 Background
Using lower temperatures to produce asphalt paving mixtures is not a new concept. The
idea of saving energy and lowering emissions in the asphalt industry has been discussed for
decades.
In 1956, Dr. Ladis H. Csanyi, a professor at Iowa State University, realized the potential
of foamed bitumen for use as a soil binder. Since then, foamed asphalt technology, which allows
lower mixing temperatures, has been used successfully in many countries (3). The original
process consisted of injecting steam into hot bitumen (binder). In 1968, Mobil Oil Australia
having acquired the patent rights for Csanyi’s invention; modified the original process by adding
cold water rather than steam into the hot bitumen. The bitumen foaming process then became
more practical (3).
In the early 1970’s, Chevron prepared paving mixtures by stabilizing the emulsified
asphalt (4). In 1994, Maccarone evaluated the performance of the cold mix asphalt, prepared by
foamed bitumen and very high binder content emulsions. Reduction in energy consumption and
emissions were observed (5). In 1999, Jenkins introduced half-warm foamed bitumen treatment.
The results showed good particle coating, tensile strength and compaction (6). In 2002, Koenders
introduced foamed WMA technologies to produce asphalt mixtures at lower temperatures (7).
17
National Center for Asphalt Technology (NCAT) reported in 2005 and in 2006 about the usage
of additive such as Sasobit, Aspha-min and Evotherm (8, 9, 10).
The use of WMA technologies was initially developed in Europe with the aim of
reducing greenhouse gases produced by manufacturing industries (1). Specifically, the European
Union agreed to reduce CO2 emissions by 15% by 2010. With this goal, several field trials have
been conducted in Europe to evaluate the usage of WMA mixtures, and their compactability and
in-service performance. These trials were carried out in Norway, United Kingdom, and the
Netherlands (11). Emissions quantified during construction; visual inspection of the trial roads
after placing and up to three years of trafficking indicated similar performance compared to that
of control sections constructed using conventional HMA mixtures. Cores from the field trials
showed similar stability and adhesion characteristics to those of conventional asphalt (11).
The United Nations conference on the environment and sustainable development held at
Rio de Janeiro, in 1992 marked the beginning of universal awareness on increasing global
warming (12). The Kyoto Protocol in 1997, by the United Nations formalized this awareness by
committing to bring down the greenhouse gas emission rates to 1990 levels. This agreement
came into force on February 13, 2005.
WMA technologies address this issue in a rather small but important way. WMA
technologies are a relatively new technology in the United States. Very limited research studies
have been conducted to evaluate the performance of the WMA mixtures. Louisiana’s experience
with WMA started with a demonstration project in August 2008. An Astec Double Barrel Green
system was used to produce WMA using the foaming process. Shortly afterwards, a
18
comprehensive research project was initiated to evaluate the performance of plant produced-lab
compacted (PL) WMA mixtures, which were produced by four different WMA technologies.
1.3 Problem Statement
More than 90 percent of the pavements in the United Sates are surfaced with asphalt. 500
million tons of conventional HMA mixture is produced annually to meet the demand to produce
flexible pavements (13). Mixture production involves usage of huge amounts of aggregates and
asphalt binders. These materials are heated at elevated temperatures in the production process to
accommodate drying, mixing and compaction. WMA is a term used to describe various
technologies that allow asphalt mixtures to be produced at lower temperatures as compared to
conventional HMA. The conventional HMA mixtures are usually produced at temperatures in
the range of 280°F to 320° F, while for the WMA practices, the mixtures are produced at much
lower temperatures typically ranging from 250°F and 275°F (14). These technologies reduce the
viscosity of the binder to allow coating of the aggregate at lower temperatures, while increasing
the workability of the mixtures. The significant reduction in the production temperature yield to
potential benefits as mentioned in the earlier section. Also, the WMA technologies enable
incorporation of higher percentages of RAP into the mixtures.
However, the lower mixing temperatures have raised concerns on the performance of the
mixtures. Few of the concerns are: Moisture presence in the aggregates due to incomplete
vaporization may yield a mixture that is moisture susceptible. Another concern is that the asphalt
binder may not possess adequate stiffness characteristics at elevated pavement surface
temperatures, resulting in rutting susceptibility. This brings up the need to thoroughly evaluate
and characterize these WMA mixtures to ensure adequate performance. The cost investment
involved in the implementation of these new technologies must be studied. The cost of
19
proprietary additives and their licensing must be acknowledged. This study examined and
evaluated the usage of WMA mixtures in the state of Louisiana with a wide range of WMA
technologies available. A life cycle assessment has been performed to quantify the reductions in
energy consumptions and emissions.
1.4 Objectives
The primary objective of this study is to evaluate and quantify the performance and
fundamental engineering properties of different WMA mixtures compared to conventional HMA
mixtures, designed to meet the Louisiana Superpave specifications; and to develop a framework
for design, construction and implementation of these technologies in Louisiana. A secondary
objective was to quantify the economic and environmental benefits of WMA technologies over
the conventional HMA mixture production.
In addition, effects of four different WMA production methods used in this study and use
of higher Reclaimed Asphalt Pavement (RAP) contents on the mechanical properties of produced
WMA mixtures were also evaluated.
1.5 Scope
The research team consulted and coordinated with LADOTD research and construction
personnel to identify and select field projects currently undertaken, and that use WMA
technologies. A minimum of three field projects were selected that incorporate various WMA
technologies. Each individual project consisted of a control HMA mixture accompanied by
WMA mixtures with varying RAP contents. Different warm mix technologies such as Foaming,
Evotherm, Rediset, Latex etc were used in this study. PG 70-22M was the asphalt binder used in
these projects. Astec Double Barrel Green system and Accu-Shear device were employed for the
20
foaming of the mixtures. Evotherm was blended with the binder at the terminal while Rediset
was added to the asphalt tank at the plant. Latex was incorporated into the binder followed by a
foaming process. Evotherm was blended with the binder at the terminal while Rediset was added
to the asphalt tank at the plant. Laboratory tests were performed to evaluate the mechanistic
properties of the mixtures. Mixture characterization was performed by a suite of laboratory
mechanistic testing on plant produced-laboratory compacted (PL) samples at Low, Intermediate
and High temperatures. Indirect Tensile Strength (ITS) test, Semi-Circular Bend (SCB) test,
Loaded Wheel Tracking (LWT) test, Simple Performance tests (Dynamic Modulus test, Flow
Number test), Dissipated Creep Strain Energy (DCSE) test, Thermal Stress Restrained Specimen
Test (TSRST), Beam Fatigue Test, Modified Lottman test were included in the testing suite.
1.6 Outline
The document is divided into five chapters, including the introductory first chapter. The
outline of the thesis is as follows.
Chapter 1 presents a brief introduction of the WMA technologies, leading in to the
objectives and the scope of the study.
Chapter 2 presents an extensive literature review on laboratory evaluation and
characterization of asphalt mixtures, previous research on WMA and a brief summary of the
findings of the research.
Chapter 3 presents the methodology and the experimental framework, and discussion on
the laboratory tests employed for the material characterization in this study.
Chapter 4 presents the laboratory test results and the analyses, along with the statistical
analyses performed to draw comparisons between the WMA and HMA mixtures.

21
Chapter 5 presents the findings from the study and summarizes the research with any
recommendations for future research.
22
CHAPTER 2 : LITERATURE REVIEW
The literature review identifies and documents various WMA technologies employed in
the industry. Brief notes on the WMA technologies used for this study is documented. This
chapter also summarizes previous and ongoing research studies performed on the evaluation and
characterization of WMA mixtures.
2.1 WMA Classification
Warm-mix technology uses various techniques to reduce the effective viscosity of the
binder enabling full coating and subsequent compact-ability at lower temperatures. The WMA
technologies can be classified in different ways. Depending on the technology adopted to reduce
the temperature, the WMA technologies can be broadly divided in to three categories: Foaming
techniques, both water-based and water-bearing; Organic or Wax additives; and Chemical
additives (15, 16). Table 2.1 presents some of the widely used WMA technologies (15, 16).
2.1.1 Foaming Techniques
A wide range of foaming techniques is available to reduce the viscosity of asphalt binder,
by introducing small amounts of water into the binder. The water turns to steam, increases the
volume of the binder and reduces its viscosity for a short period until cooled. The foam then
collapses and the mixture behaves as a normal binder. The amount of expansion depends on a
number of factors, including the amount of water added and the temperature of the binder (1).
Liquid anti-stripping additives can be added to the binder before mixing with the aggregates, to
ensure that the moisture susceptibility is minimized (17, 18). The foaming techniques can be
further classified into two: Water-based and Water-bearing.
23
Table 2.1: List of Widely Used WMA Technologies
Technology Company Category
Production Temperature
[or Reduction Range] (F)
Aquablack WMA Maxam Equipment Water-based NA*
Double Barrel Green Astec Water-based 255
Low Energy Asphalt LEACO Water-based 220 - 255
Ultradoam GXTM
Gencor Industries Water-based NA*
WAM Foam Shell and Kolo Veidekke Water-based 212 - 248
Warm Mix Asphalt System Terex Road Building Water-based [< 90]
Advera PQ Corporation Water-bearing [50 - 85]
Aspha-Min Eurovia Water-bearing 215
Sasobit® Sasol Organic 235
Asphaltan A, Romonta N Romonta GmbH Organic [68]
Asphaltan B Romonta GmbH Organic [68 - 86]
3E LT (Ecoflex) Colas Organic [86 -104]
Evotherm ET Mead-Westvaco Chemical [99 - 167]
Evotherm DAT Mead-Westvaco Chemical [113 - 131]
Evotherm 3G Mead-Westvaco Chemical [91 - 113]
Rediset WMX Akzo Nobel Chemical [≥86]
Revix Mathy-Ergon Chemical [60 - 80]
24
2.1.2 Organic or Wax Additives
Different organic additives can be used to lower the viscosity of the asphalt binder.
WMA mixture employing these technologies exhibit lower viscosities during production at
temperatures higher than the melting point of the additives. After the crystallization process of
the additive, it may enhance the stiffness of the mixture. The type of additive must be selected
carefully so that its melting point is higher than the expected in-service temperatures, otherwise
may result in permanent deformation of the pavement structure. The organic additives usually
are waxes or fatty amides. A commonly used additive is a special paraffin wax produced by
treating hot coal with steam in the presence of a catalyst (19).
2.1.3 Chemical Additives
Chemical additives do not reduce the viscosity of the asphalt binder. As surfactants they
work at the microscopic interface of the aggregates and the binder reducing the frictional forces
at that interface (15). Chemical additives usually are combination of emulsions, surfactants,
polymers that enhance coating, workability, compaction and adhesion properties of the mixtures.
2.1.4 WMA Technologies Evaluated
A brief notes on the different WMA technologies employed in this study are presented in
this section.
An Astec Double Barrel Green device and an Accu-Shear device were the devices used
for the foaming of the mixtures evaluated in this study. Figures 2.1 and 2.2 present the devices
used in the study. Both these equipment were employed for the Water-Based foaming for the
US171 and LA116 projects respectively. A provision to accommodate the Latex polymer
dispersion into the asphalt binder was attached to the Accu-shear device.
25
Figure 2.1: Astec Double Barrel Green Foaming Device
Figure 2.2: Accu-Shear Foaming Device
WMA additives Evotherm® 3G and Rediset WMX were used for the projects LA3121
and US171 respectively. LA3121 project had two WMA mixtures with Evotherm; one with 15%
RAP and the second with 30% RAP.
Evotherm® 3G is a water-free form of Evotherm. It is a chemical additive that improves
coating, workability, adhesion and emulsification (8). This additive was used for the LA3121
filed project. The Evotherm additive is blended with the binder at the terminal in the plant.
The Rediset WMX is a combination of cationic surfactants and organic additive based
rheology modifier (15). This is a patented additive in the form of small pellets, added in the
range of 1.25-2% to the asphalt cement. It can also be added to the mix at the asphalt plant. The
26
product reduces the asphalt cement viscosity and reduces the surface tension of the asphalt. This
additive was used for one of the WMA mixtures in the US171 project.
Latex is a polymer dispersion additive added to the asphalt binder to improve coating,
adhesion and ductility of the binder. Latex can be added to the binder at the plant during
production in the range of 2 -3%. Latex was used for the WMA mixtures for the LA116 project,
wherein two WMA mixtures with 15% RAP and 20% RAP were produced.
2.2 Previous Research Studies on Performance of Different WMA Technologies
WMA practice is a relatively new practice adopted in USA. Significant amount of
research is being done on WMA to evaluate and quantify the performance of these technologies.
The use of warm asphalt technologies was initially developed in Europe with the aim of reducing
greenhouse gases produced by manufacturing industries (1). Specifically, the European Union
has agreed to reduce CO2 emissions by 15% by 2010. With this goal, several field trials were
conducted in Europe to evaluate the use of WMA mixtures and their compactability and in-
service performance. Those trials were carried out in Norway, United Kingdom, and the
Netherlands (11). Emissions during construction was measured, and visual inspection of the trial
roads after placing and after up to three years of trafficking indicated performance similar to
control sections constructed using conventional asphalt. Cores from the field trials showed
similar stability and adhesion characteristics to those of conventional asphalt.
The United Nations conference on the environment and sustainable development held at
Rio de Janeiro in 1992 marked the beginning of universal awareness on increasing global
warming (12). The Kyoto Protocol in 1997, by the United Nations formalized this awareness by
committing to bring down the greenhouse gas emission rates to 1990 levels. This agreement
27
came into force on February 13, 2005. Warm mix asphalt technology addresses this issue in a
rather small but important way.
Some of earlier work on warm asphalt in the United States was conducted by the
National Center of Asphalt Technology, NCAT (8,9,10,20,21). NCAT evaluated the use of
Zeolite, Sasobit and Evotherm as potential additives to produce warm asphalt mixtures at
temperatures lower than the conventional asphalt mixtures. An infrared camera was used to
monitor the thermal consistency during paving (22). Improved compactability was reported at
temperatures as low as 190°F. These additives showed no effect on the resilient modulus of the
asphalt mixtures. The resulting mixtures however showed poor resistance to moisture damage as
measured by the tensile strength ratio (TSR). Stripping was also observed when testing the
mixtures in the Hamburg Wheel Tracking Test.
Buss et al. used MEPDG to compare the effects of WMA technologies on pavement
performance (23). Dynamic modulus data was used as the input for the MEPDG, and the
performance of the WMA mixes were compared to the respective control HMA mixes. Duralife
and DureClime were used as additives for the warm mix asphalt mixtures. The results showed
that WMA mixtures exhibited similar or better performance to that of the conventional HMA
mixtures (23).
Goh et al. evaluated the performance of several WMA mixtures in comparison with a
conventional HMA (14). Aspha-min, Sasobit, Evotherm, Asphaltan B were used as WMA
additives. Effect of WAM-Foam technology was also evaluated. Results showed that, based on a
Level 1 analysis WMA had a lower predicted rut depth than the conventional HMA mixture.
28
Also, the dynamic modulus values were not significantly different between the mixtures. WMA
technologies has shown significant reduction in mixing and compaction temperature
Diefenderfer et al. evaluated the long-term performance effects of WMA and found that
the performance did not differ significantly from conventional HMA (24). Sasobit and Evotherm
were the additives considered in this study. These studies showed that the use of WMA did not
have a significant effect on the results of the MEPDG performance predictions when compared
to the predictions of conventional HMA mixtures. The performance grading of the recovered
binder indicated reduction in the rate of in-service aging of the binder of WMA produced by
Sasobit, when compared to control HMA.
In 2008, Goh and You (25) performed a field study to evaluate the rutting performance of
the WMA mixture with Sasobit additive. A companion HMA mixture with similar mixture
design was also constructed in the demonstration. The WMA was produced at 260°F and showed
similar rutting performance as compared to the control HMA mixture.
In 2009, Washington DOT (26) conducted an experimental field study involving a
control HMA mixture and a WMA mixture with Sasobit additive. WMA section was compacted
at reduced temperatures in the range of 30 to 50 °F. Density testing revealed better compaction
of the WMA section. Hamburg Wheel Tracking testing showed identical rut performance
between the two pavement sections, and stripping was not evident in either of the sections.
In 2007, Wasiuddin et al. (14) studied the rutting potential and the rheological properties
of the binder. WMA mixtures with Aspha-min and Sasobit additives were evaluated in this
study. A decrease in the rut potential of the mixtures was observed with the decrease in the
production temperatures. A field study in Florida (8) revealed that the addition of Aspha-min
29
additive improved the workability of the mixture, and similar performance in terms of moisture
susceptibility.
The National Cooperative Highway Research Program (NCHRP) performed various
research studies involving the WMA technologies. Research project NCHRP 9-43, “Mix Design
Practices for WMA,” (27) was initiated to develop mixture design and analysis procedures for
wide range of WMA technologies. WMA technologies such as Evotherm, Sasobit, Advera, LEA,
Gencor foaming etc were evaluated in this study. The research indicated similar volumetric
properties for the WMA and HMA mixtures. The research showed differences in the moisture
sensitivity between HMA and WMA mixtures, but also showed improved resistance to moisture
damage with addition of anti-strip additives. The rutting resistance of all the WMA mixtures
except Sasobit, as measured by flow number test, was lower as compared to the control HMA
mixture. The fatigue evaluation of the mixtures showed similar performance between the HMA
and WMA mixtures.
Research project NCHRP 9-47, “Engineering Properties, Emissions, and Field
Performance of WMA Technologies,” (28) was conducted to establish relationships among
engineering properties of WMA binders and mixtures and the field performance of various
WMA technologies. Research showed WMA mixtures produced with Astec’s Double Barrel
Green system and 30% RAP exhibited comparable rut performance compared to the HMA
mixtures. Few WMA mixtures showed reduced rut performance and indirect tensile strength
values as compared to the control HMA mixtures.
30
Many other research projects are being conducted by the NCHRP to evaluate the
performance of the WMA mixtures. List of on-going research projects on WMA technologies by
NCHRP:
NCHRP 9-47A, Properties and Performance of WMA Technologies
NCHRP 9-49, Performance of WMA technologies: Stage I – Moisture
Susceptibility
NCHRP 9-49A, Performance of WMA technologies: Stage II – Long-Term Field
Performance
NCHRP 9-52, Short-Term Laboratory Conditioning of Asphalt Mixtures
NCHRP 9-53, Properties of Foamed Asphalt for Warm Mix Asphalt Applications
NCHRP 9-54, Long-Term Aging of Asphalt Mixtures for Performance Testing
and Prediction
NCHRP 9-55, Recycled Asphalt Shingles in Asphalt Mixtures with WMA
Technologies
2.3 Previous Research Studies on Environmental and Economic Benefits
Lower mixing and production temperatures yield to lower emissions and reduced energy
consumption. This section documents some of the research studies and findings that quantify the
potential environmental and economic benefits observed since the introduction of the WMA
technologies.
There are approximately 3600 HMA plants in USA producing 500 to 600 million tons of
asphalt mixture annually (13). The Federal Clean Air Act requires emission sources like HMA
plants to use the “best available control technology” to limit the emissions (29). Previous
31
research studies indicate that the emissions during the production of WMA are lower, as
compared to the production of the conventional HMA (30-32). Emissions in the range of 30 to
98% to that of HMA were observed under varying circumstances. Measurements of energy
consumption indicated a reduction during the WMA practice as compared to the conventional
HMA practice. WMA production recorded reductions in the range of 20 to 75% compared to that
of HMA production (31-36).
Rajib et al (37) conducted a laboratory study to evaluate the CO2 emissions through the
use of WMA technologies. Sasobit was the WMA technology employed for the research. This
research implied that WMA technology is an effective way of lowering the emissions; both
directly and by usage of lesser energy for production. Addition of 1.5% of Sasobit to the asphalt
binder resulted in a reduction of production temperatures in the range of 10 - 30°C. At the same
time, about 40% of savings were observed in energy consumption as compared to HMA practice.
A research study performed by the Ohio DOT to assess the performance of WMA
pavements adopted WMA technologies Aspha-min, Sasobit and Evotherm. Emissions at the
paving site reported reductions in the range of 67 – 77% compared to HMA. Emissions at the
plant revealed a reduction of 50% for volatile organic compounds, 60% for carbon monoxide,
20% for nitrogen oxide and 83% for sulfur dioxide (38).
32
CHAPTER 3 : MEHTODOLOGY
3.1 Introduction
The experimental program employed for this study evaluated the performance and the
fundamental engineering properties of different WMA mixtures designed to meet the Louisiana
Superpave specifications. A comprehensive laboratory mechanistic testing was conducted on
eleven mixtures from three different projects across the state of Louisiana employing different
WMA technologies. This chapter documents the research approach and methodology employed
in this study.
3.2 Field Projects
The research team consulted and coordinated with LADOTD research and construction
personnel, to identify and select field projects that use WMA technology in Louisiana. A
minimum of three field projects were selected that incorporate various WMA technologies. Its
noteworthy that all the three individual projects consisted of a control HMA mixture
accompanied by WMA mixtures with varying RAP contents. Different warm mix technologies
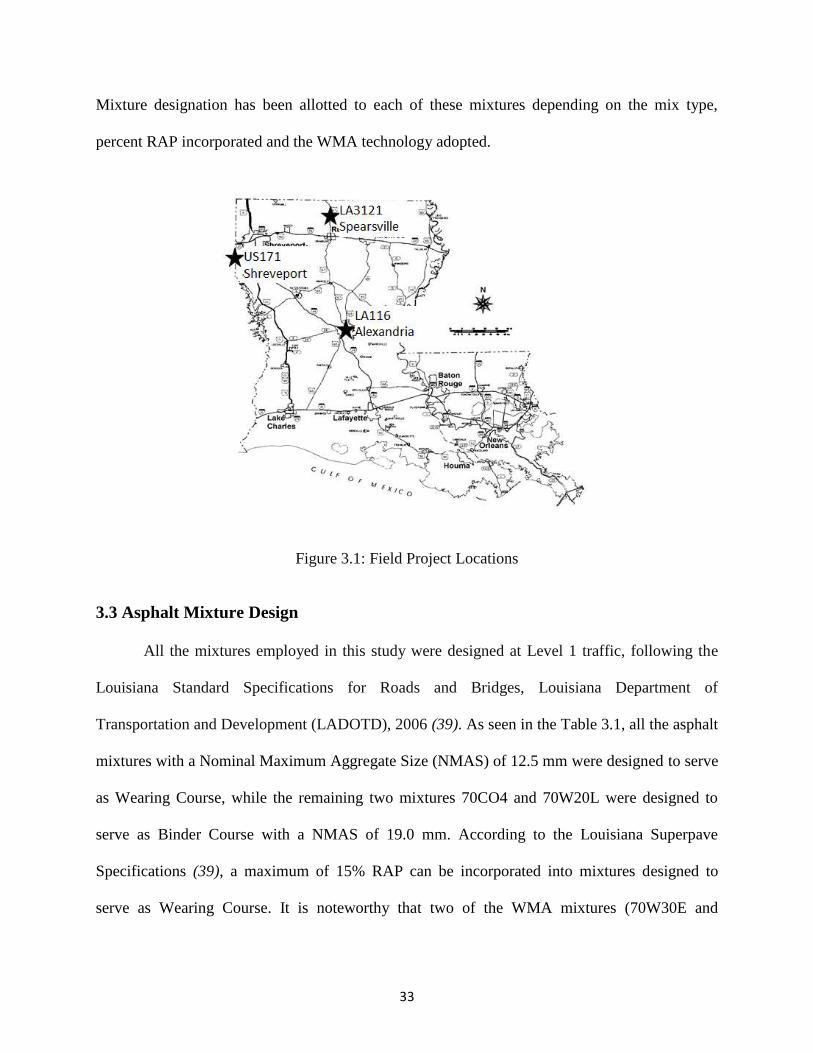
such as Foaming, Evotherm, Rediset, Latex etc were used in this study. Figure 3.1 shows the
approximate locations of the three field projects, LA3121 near Spearsville, LA116 near
Alexandria, and US171 near Shreveport.
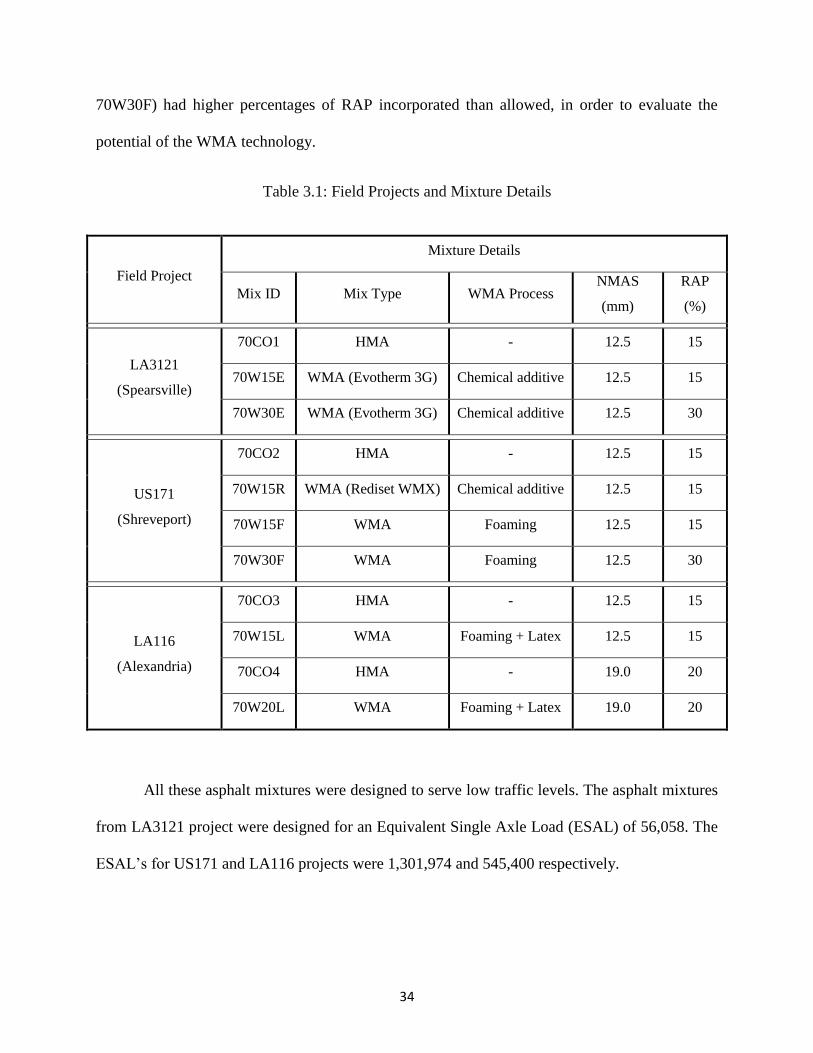
Table 3.1 summarizes the field projects selected for this study alongside the individual
asphalt mixtures for each of these field projects. The type of mixture and the WMA technology
adopted are also presented for each of the eleven mixtures evaluated. The percentage of
Reclaimed Asphalt Pavements (RAP) incorporated into each of these mixtures is also presented.
33
Mixture designation has been allotted to each of these mixtures depending on the mix type,
percent RAP incorporated and the WMA technology adopted.
Figure 3.1: Field Project Locations
3.3 Asphalt Mixture Design
All the mixtures employed in this study were designed at Level 1 traffic, following the
Louisiana Standard Specifications for Roads and Bridges, Louisiana Department of
Transportation and Development (LADOTD), 2006 (39). As seen in the Table 3.1, all the asphalt
mixtures with a Nominal Maximum Aggregate Size (NMAS) of 12.5 mm were designed to serve
as Wearing Course, while the remaining two mixtures 70CO4 and 70W20L were designed to
serve as Binder Course with a NMAS of 19.0 mm. According to the Louisiana Superpave
Specifications (39), a maximum of 15% RAP can be incorporated into mixtures designed to
serve as Wearing Course. It is noteworthy that two of the WMA mixtures (70W30E and
34
70W30F) had higher percentages of RAP incorporated than allowed, in order to evaluate the
potential of the WMA technology.
Table 3.1: Field Projects and Mixture Details
Field Project
Mixture Details
Mix ID Mix Type WMA Process NMAS
(mm)
RAP
(%)
LA3121
(Spearsville)
70CO1 HMA - 12.5 15
70W15E WMA (Evotherm 3G) Chemical additive 12.5 15
70W30E WMA (Evotherm 3G) Chemical additive 12.5 30
US171
(Shreveport)
70CO2 HMA - 12.5 15
70W15R WMA (Rediset WMX) Chemical additive 12.5 15
70W15F WMA Foaming 12.5 15
70W30F WMA Foaming 12.5 30
LA116
(Alexandria)
70CO3 HMA - 12.5 15
70W15L WMA Foaming + Latex 12.5 15
70CO4 HMA - 19.0 20
70W20L WMA Foaming + Latex 19.0 20
All these asphalt mixtures were designed to serve low traffic levels. The asphalt mixtures
from LA3121 project were designed for an Equivalent Single Axle Load (ESAL) of 56,058. The
ESAL’s for US171 and LA116 projects were 1,301,974 and 545,400 respectively.
35
Nine of these mixtures, apart from the two WMA mixtures with Latex, contained an SBS
polymer modified PG 70-22M binder as per Louisiana DOT specification. The remaining two
WMA mixtures contained a PG64-22 binder modified with Latex to meet PG70-22M
specifications. Binder testing was performed at the laboratory. Binder characterizing tests like
Rotational Viscometer (RV), Dynamic Shear Rheometer (DSR), Flash Point Test, Ductility Test,
Bending Beam Rheometer (BBR) were performed on original binder as well as aged binder.
Asphalt binder was aged using Rolling Thin Film Oven (RTFO) and Pressure Aging Vessel
(PAV) apparatus to simulate short-term aging as well as long-term aging of the binder. Table 3.2
presents the Louisiana specification requirements for PG 70-22M binder. It also summarizes the
binder test results.
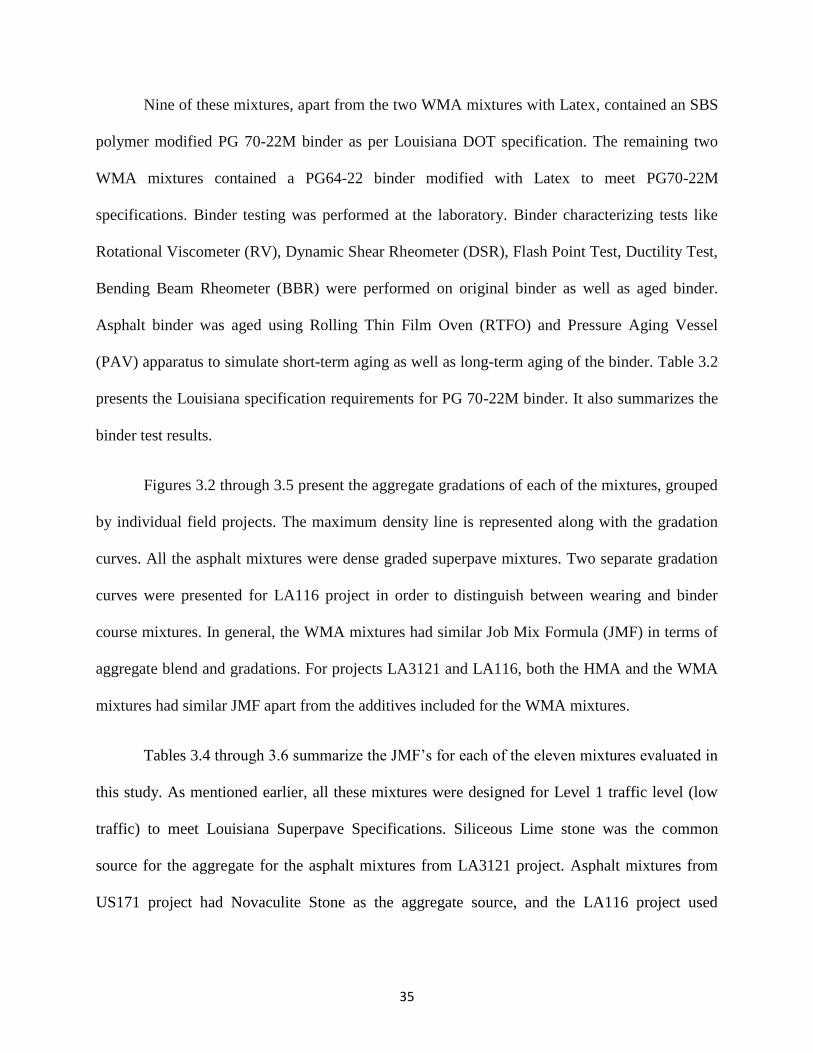
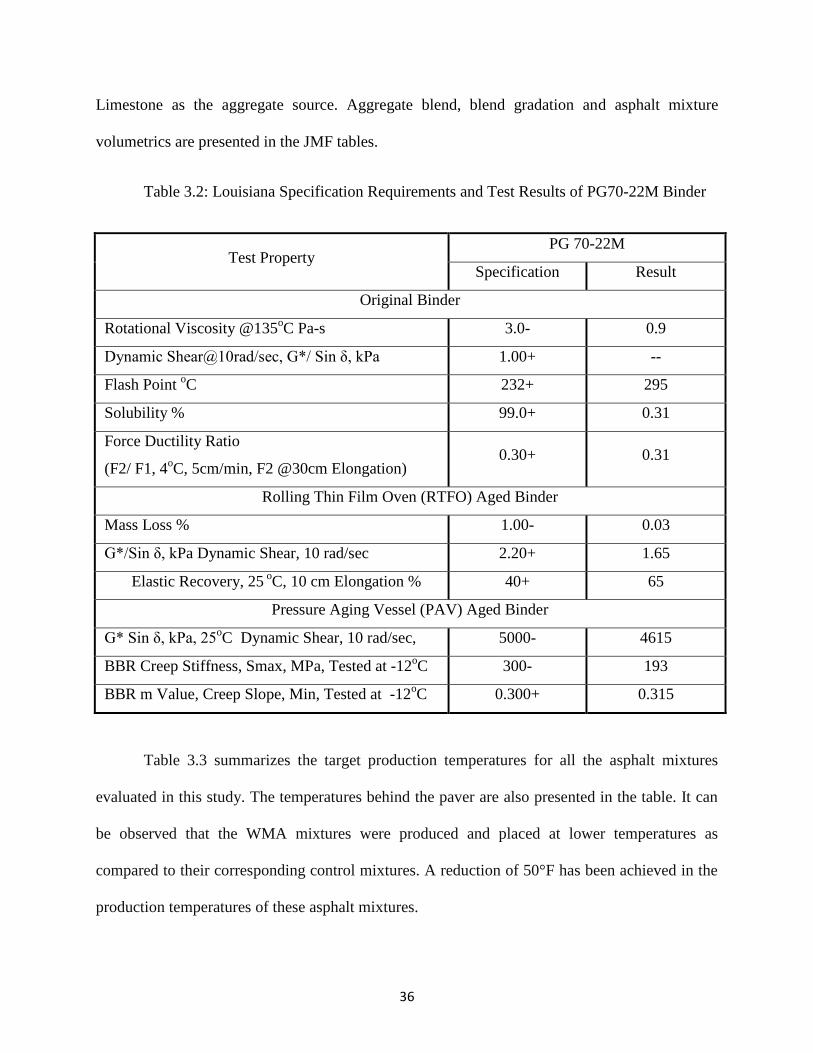
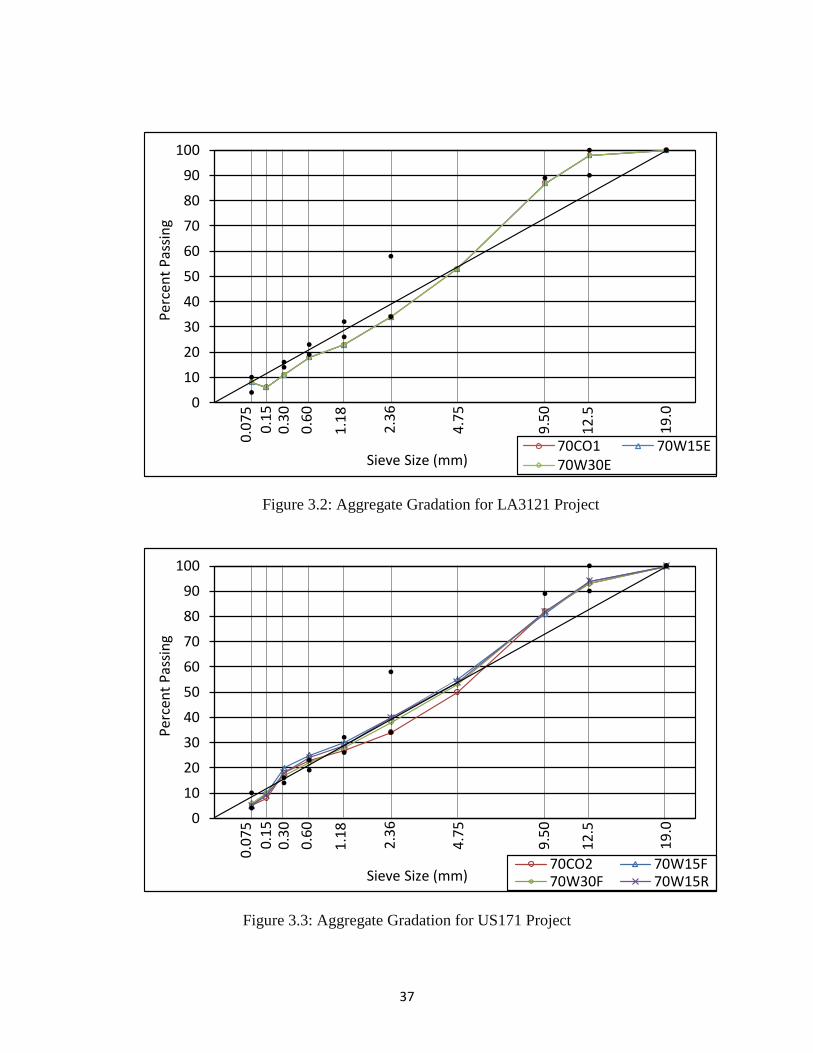
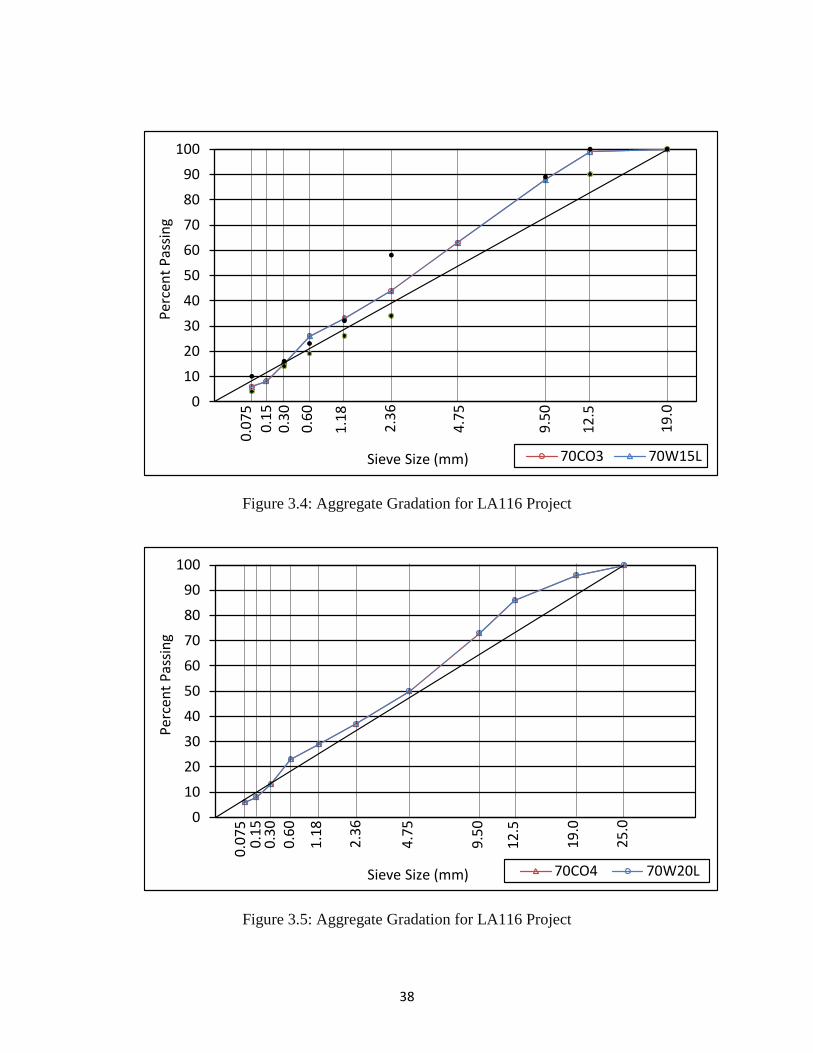
Figures 3.2 through 3.5 present the aggregate gradations of each of the mixtures, grouped
by individual field projects. The maximum density line is represented along with the gradation
curves. All the asphalt mixtures were dense graded superpave mixtures. Two separate gradation
curves were presented for LA116 project in order to distinguish between wearing and binder
course mixtures. In general, the WMA mixtures had similar Job Mix Formula (JMF) in terms of
aggregate blend and gradations. For projects LA3121 and LA116, both the HMA and the WMA
mixtures had similar JMF apart from the additives included for the WMA mixtures.
Tables 3.4 through 3.6 summarize the JMF’s for each of the eleven mixtures evaluated in
this study. As mentioned earlier, all these mixtures were designed for Level 1 traffic level (low
traffic) to meet Louisiana Superpave Specifications. Siliceous Lime stone was the common
source for the aggregate for the asphalt mixtures from LA3121 project. Asphalt mixtures from
US171 project had Novaculite Stone as the aggregate source, and the LA116 project used
36
Limestone as the aggregate source. Aggregate blend, blend gradation and asphalt mixture
volumetrics are presented in the JMF tables.
Table 3.2: Louisiana Specification Requirements and Test Results of PG70-22M Binder
Test Property PG 70-22M
Specification Result
Original Binder
Rotational Viscosity @135oC Pa-s 3.0- 0.9
Dynamic Shear@10rad/sec, G*/ Sin δ, kPa 1.00+ --
Flash Point oC 232+ 295
Solubility % 99.0+ 0.31
Force Ductility Ratio
(F2/ F1, 4oC, 5cm/min, F2 @30cm Elongation)
0.30+ 0.31
Rolling Thin Film Oven (RTFO) Aged Binder
Mass Loss % 1.00- 0.03
G*/Sin δ, kPa Dynamic Shear, 10 rad/sec 2.20+ 1.65
Elastic Recovery, 25 oC, 10 cm Elongation % 40+ 65
Pressure Aging Vessel (PAV) Aged Binder
G* Sin δ, kPa, 25oC Dynamic Shear, 10 rad/sec, 5000- 4615
BBR Creep Stiffness, Smax, MPa, Tested at -12oC 300- 193
BBR m Value, Creep Slope, Min, Tested at -12oC 0.300+ 0.315
Table 3.3 summarizes the target production temperatures for all the asphalt mixtures
evaluated in this study. The temperatures behind the paver are also presented in the table. It can
be observed that the WMA mixtures were produced and placed at lower temperatures as
compared to their corresponding control mixtures. A reduction of 50°F has been achieved in the
production temperatures of these asphalt mixtures.
37
Figure 3.2: Aggregate Gradation for LA3121 Project
Figure 3.3: Aggregate Gradation for US171 Project
0
10
20
30
40
50
60
70
80
90
100P
erce
nt
Pas
sin
g
Sieve Size (mm)70CO1 70W15E70W30E
0.0
75
0.1
50
.30
0.6
0
1.1
8
2.3
6
4.7
5
9.5
0
12
.5
19
.0
0
10
20
30
40
50
60
70
80
90
100
Per
cen
t P
assi
ng
Sieve Size (mm)70CO2 70W15F70W30F 70W15R
0.0
75
0.1
50
.30
0.6
0
1.1
8
2.3
6
4.7
5
9.5
0
12
.5
19
.0
38
Figure 3.4: Aggregate Gradation for LA116 Project
Figure 3.5: Aggregate Gradation for LA116 Project
0
10
20
30
40
50
60
70
80
90
100P
erce
nt
Pas
sin
g
Sieve Size (mm) 70CO3 70W15L
0.0
75
0.1
50
.30
0.6
0
1.1
8
2.3
6
4.7
5
9.5
0
12
.5
19
.0
0
10
20
30
40
50
60
70
80
90
100
Per
cen
t P
assi
ng
Sieve Size (mm) 70CO4 70W20L
0.0
75
0.1
50
.30
0.6
0
1.1
8
2.3
6
4.7
5
9.5
0
12
.5
19
.0
25
.0
39
Table 3.3: Production Temperatures of Asphalt Mixtures
Analytical
Grouping Mix ID
Production
Temperature
(°F)
Temperature
Behind
Paver(°F)
Avg. Reduction in
Production
Temperature (°F)
LA3121 70CO1 315-325 290-300 -
70W15E 265-275 250-260 50
70W30E 280-290 260-270 35
US171 70CO2 325-335 305-315 -
70W15F 280-290 265-275 45
70W30F 280-290 265-275 45
70W15R 275-285 255-265 50
LA116 70CO3 310-320 275-285 -
70W15L 270-280 250-260 40
70CO4 320-330 290-300 -
70W20L 270-280 250-260 50
3.4 Specimen Preparation
Plant produced-lab compacted specimens were employed for the mechanistic testing
performed in this study. Specimen compaction was performed in a mobile laboratory facility
provided by the Louisiana Transportation Research Center (LTRC). Loose asphalt mixture was
collected from the truck just before placing at the field and is compacted immediately using a
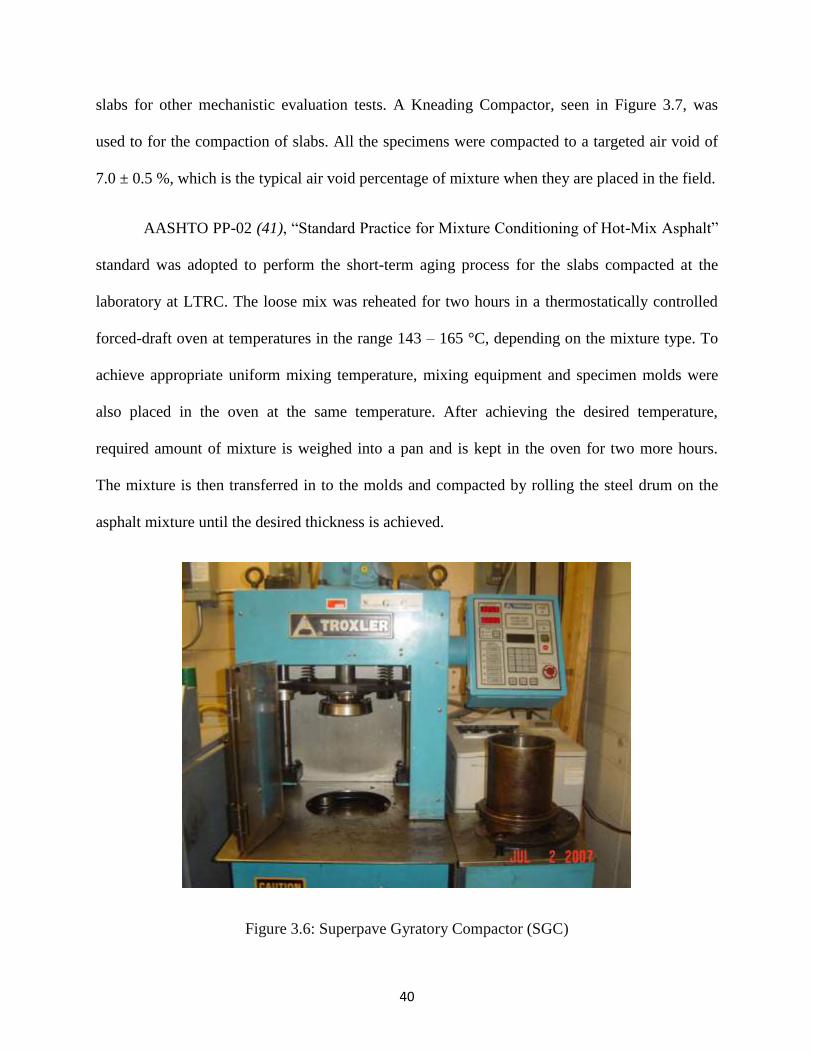
Superpave Gyratory Compactor (SGC). Figure 3.6 presents the gyratory compactor used in this
study. The American Association of State Highway and Transportation Officials (AASHTO)
standard specifications were employed in this study. AASHTO T 312-04 (40), “Standard Method
of Test for Preparing and Determining the Density of Hot-Mix Asphalt (HMA) Specimens by
Means of Superpave Gyratory Compactor” procedure was employed for the specimen
compaction. Loose asphalt mixture was collected and stored at LTRC for further compaction of
40
slabs for other mechanistic evaluation tests. A Kneading Compactor, seen in Figure 3.7, was
used to for the compaction of slabs. All the specimens were compacted to a targeted air void of
7.0 ± 0.5 %, which is the typical air void percentage of mixture when they are placed in the field.
AASHTO PP-02 (41), “Standard Practice for Mixture Conditioning of Hot-Mix Asphalt”
standard was adopted to perform the short-term aging process for the slabs compacted at the
laboratory at LTRC. The loose mix was reheated for two hours in a thermostatically controlled
forced-draft oven at temperatures in the range 143 – 165 °C, depending on the mixture type. To
achieve appropriate uniform mixing temperature, mixing equipment and specimen molds were
also placed in the oven at the same temperature. After achieving the desired temperature,
required amount of mixture is weighed into a pan and is kept in the oven for two more hours.
The mixture is then transferred in to the molds and compacted by rolling the steel drum on the
asphalt mixture until the desired thickness is achieved.
Figure 3.6: Superpave Gyratory Compactor (SGC)
41
Table 3.4: Job Mix Formula for LA3121 Project
Mixture Designation 70CO1 70W15E 70W30E
Mix Type HMA WMA WMA
Aggregate
Blend (%)
#78 25.7 25.7 21.4
#11 SP 25.7 25.7 21.4
KY 11 21.4 21.4 17.9
C.Sand 12.9 12.9 10.7
RAP 14.3 14.3 28.6
Binder Type PG 70-22M PG 70-22M PG 70-22M
% Gmm at NIni 84.2 84.2 84.2
% Gmm at NMax 97.3 97.3 97.3
Binder
content,
%
Asphalt 4.1 4.1 4.1
From RAP 0.7 0.7 0.7
Total
(Design) 4.8 4.8 4.8
Anti-Strip 0.5 0.5 0.5
Design air void, % 4.1 4.1 4.1
VMA, % 15 15 15
VFA, % 73 73 73
Metric (U. S.) Sieve Blend Gradation
37. 5 mm (1½ in) 100 100 100
25 mm (1 in) 100 100 100
19 mm (¾ in) 100 100 100
12. 5 mm (½ in) 98 98 98
9. 5 mm (⅜ in) 87 87 87
4. 75 mm (No. 4) 53 53 53
2. 36 mm (No. 8) 34 34 34
1. 18 mm (No. 16) 23 23 23
0. 6 mm (No. 30) 18 18 18
0. 3 mm (No. 50) 11 11 11
0. 15 mm (No. 100) 6 6 6
0. 075 mm (No. 200) 8 8 8
Gsb Aggregate 2.652 2.652 2.652
Gmb (N des) 2.402 2.402 2.402
Gse 2.658 2.658 2.658
Pabsorb 0.09 0.09 0.09
Dust/Peff 0.81 0.81 0.81
42
Table 3.5: Job Mix Formula for US171 Project
Mixture Designation 70CO2 70W15F 70W30F 70W15R
Mix Type HMA WMA WMA WMA
Aggregate
Blend
5/8" Stone 10% 11% 10% 11%
1/2" Stone 52% 46% 38% 46%
RAP 15% 15% 30% 15%
Screens 10% 15% 15% 15%
C.Sand 7% 13% 7% 13%
F.Sand 6% - - -
Additives - - - 2% (AZKO-NOBEL)
Binder Type PG 70-22M PG 70-22M PG 70-22M PG 70-22M
% Gmm at NIni 88.7 88.7 88.2 88.2
% Gmm at NMax 98 98 97.4 97.5
Binder
content,
%
Asphalt 4.2 4.3 4 4.3
From RAP 0.8 0.7 1.4 0.7
Total (Design) 5 5 5.4 5
Anti-Strip 0.6 0.6 0.6 0.6
Design air void, % 3.4 3.3 3.6 3.4
VMA, % 14.5 14.5 14 14
VFA, % 78 78 75 76
Metric (U. S.) Sieve Blend Gradation
37. 5 mm (1½ in) 100 100 100 100
25 mm (1 in) 100 100 100 100
19 mm (¾ in) 100 100 100 100
12. 5 mm (½ in) 93 94 93 94
9. 5 mm (⅜ in) 82 81 82 82
4. 75 mm (No. 4) 50 55 53 54
2. 36 mm (No. 8) 34 40 38 40
1. 18 mm (No. 16) 27 30 28 29
0. 6 mm (No. 30) 23 25 22 24
0. 3 mm (No. 50) 18 20 17 18
0. 15 mm (No. 100) 8 10 10 9
0. 075 mm (No. 200) 5 5 6 5
Gsb Aggregate 2.642 2.642 2.651 2.642
Gmb (Ndes) 2.376 2.386 2.397 2.386
Gse 2.65 2.666 2.703 2.666
Pabsorb 0.12 0.35 0.75 0.35
Dust/Peff 1.06 1.09 1.22 1.07
43
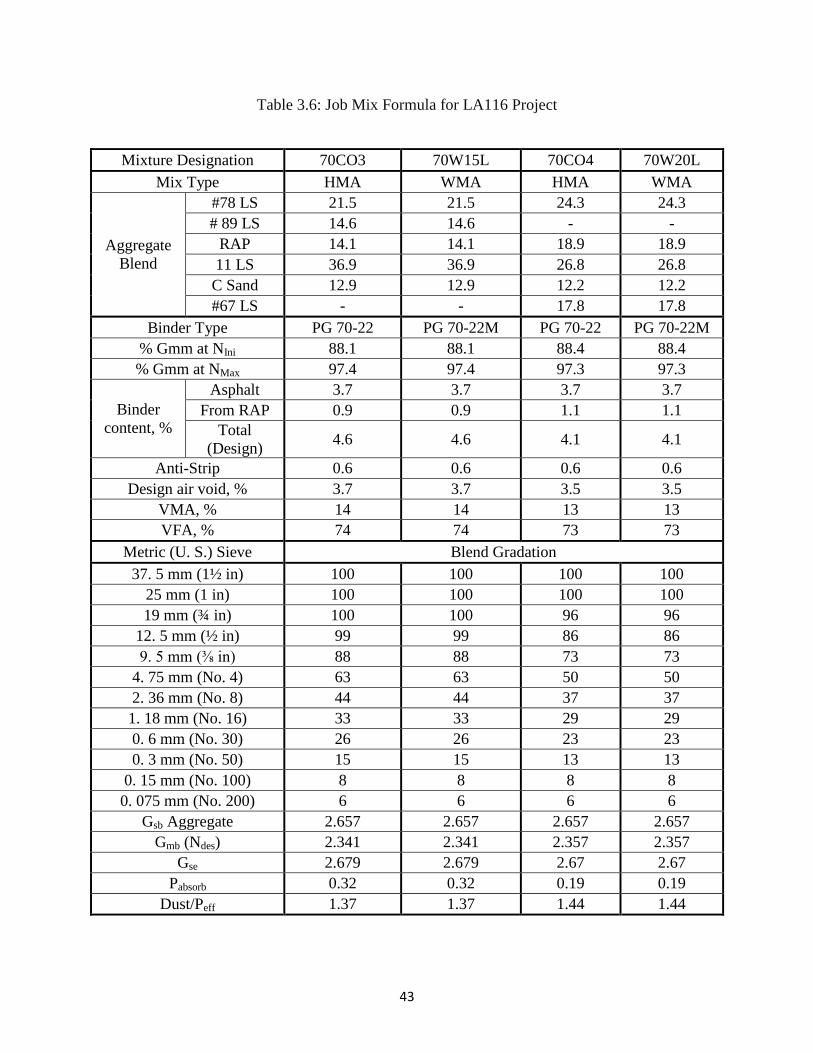
Table 3.6: Job Mix Formula for LA116 Project
Mixture Designation 70CO3 70W15L 70CO4 70W20L
Mix Type HMA WMA HMA WMA
Aggregate
Blend
#78 LS 21.5 21.5 24.3 24.3
# 89 LS 14.6 14.6 - -
RAP 14.1 14.1 18.9 18.9
11 LS 36.9 36.9 26.8 26.8
C Sand 12.9 12.9 12.2 12.2
#67 LS - - 17.8 17.8
Binder Type PG 70-22 PG 70-22M PG 70-22 PG 70-22M
% Gmm at NIni 88.1 88.1 88.4 88.4
% Gmm at NMax 97.4 97.4 97.3 97.3
Binder
content, %
Asphalt 3.7 3.7 3.7 3.7
From RAP 0.9 0.9 1.1 1.1
Total
(Design) 4.6 4.6 4.1 4.1
Anti-Strip 0.6 0.6 0.6 0.6
Design air void, % 3.7 3.7 3.5 3.5
VMA, % 14 14 13 13
VFA, % 74 74 73 73
Metric (U. S.) Sieve Blend Gradation
37. 5 mm (1½ in) 100 100 100 100
25 mm (1 in) 100 100 100 100
19 mm (¾ in) 100 100 96 96
12. 5 mm (½ in) 99 99 86 86
9. 5 mm (⅜ in) 88 88 73 73
4. 75 mm (No. 4) 63 63 50 50
2. 36 mm (No. 8) 44 44 37 37
1. 18 mm (No. 16) 33 33 29 29
0. 6 mm (No. 30) 26 26 23 23
0. 3 mm (No. 50) 15 15 13 13
0. 15 mm (No. 100) 8 8 8 8
0. 075 mm (No. 200) 6 6 6 6
Gsb Aggregate 2.657 2.657 2.657 2.657
Gmb (Ndes) 2.341 2.341 2.357 2.357
Gse 2.679 2.679 2.67 2.67
Pabsorb 0.32 0.32 0.19 0.19
Dust/Peff 1.37 1.37 1.44 1.44
44
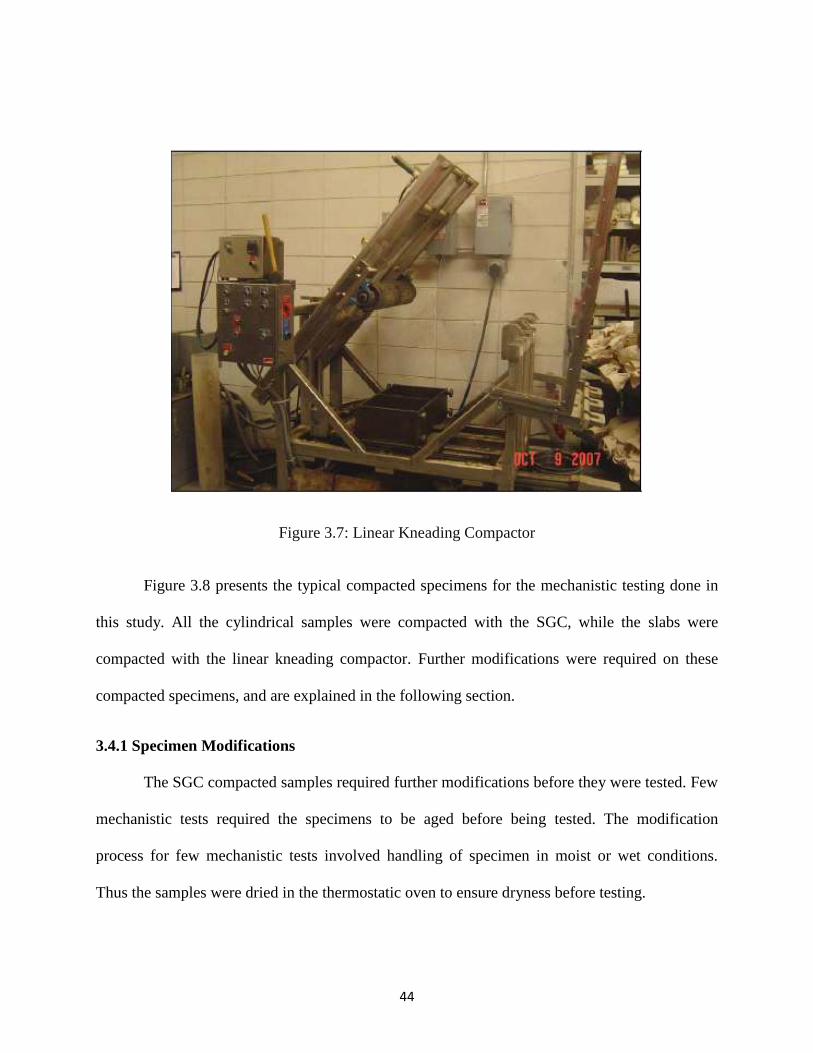
Figure 3.7: Linear Kneading Compactor
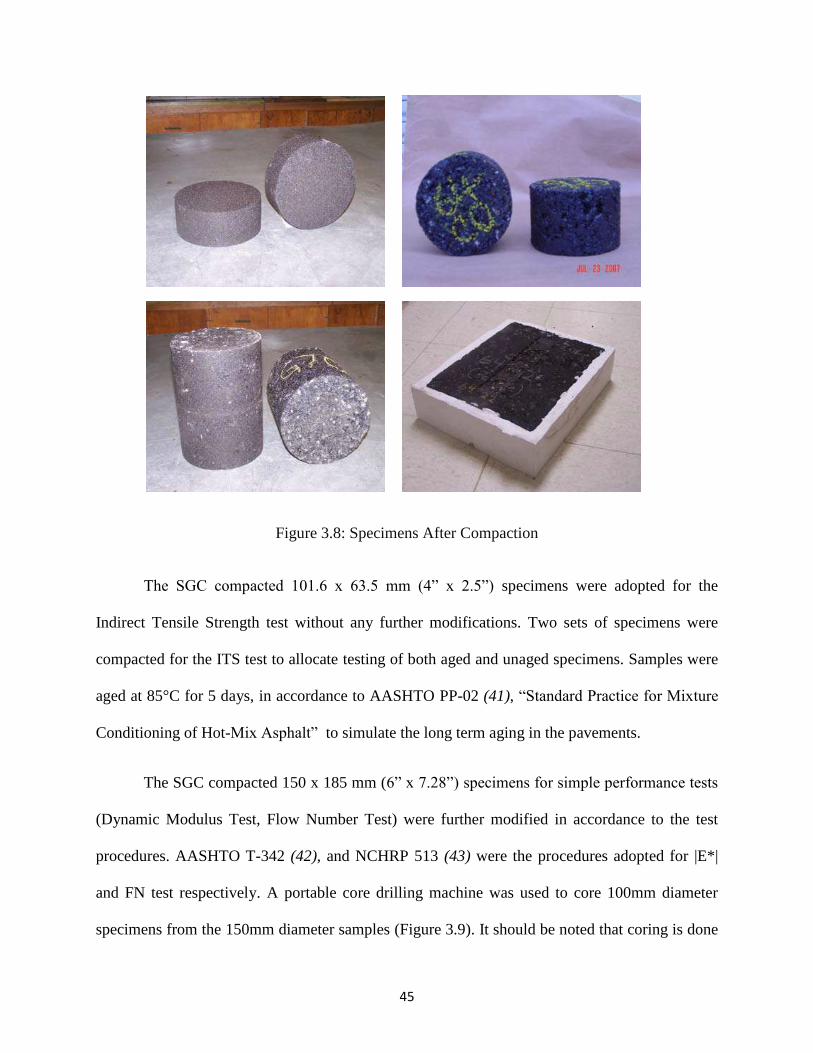
Figure 3.8 presents the typical compacted specimens for the mechanistic testing done in
this study. All the cylindrical samples were compacted with the SGC, while the slabs were
compacted with the linear kneading compactor. Further modifications were required on these
compacted specimens, and are explained in the following section.
3.4.1 Specimen Modifications
The SGC compacted samples required further modifications before they were tested. Few
mechanistic tests required the specimens to be aged before being tested. The modification
process for few mechanistic tests involved handling of specimen in moist or wet conditions.
Thus the samples were dried in the thermostatic oven to ensure dryness before testing.
45
Figure 3.8: Specimens After Compaction
The SGC compacted 101.6 x 63.5 mm (4” x 2.5”) specimens were adopted for the
Indirect Tensile Strength test without any further modifications. Two sets of specimens were
compacted for the ITS test to allocate testing of both aged and unaged specimens. Samples were
aged at 85°C for 5 days, in accordance to AASHTO PP-02 (41), “Standard Practice for Mixture
Conditioning of Hot-Mix Asphalt” to simulate the long term aging in the pavements.
The SGC compacted 150 x 185 mm (6” x 7.28”) specimens for simple performance tests
(Dynamic Modulus Test, Flow Number Test) were further modified in accordance to the test
procedures. AASHTO T-342 (42), and NCHRP 513 (43) were the procedures adopted for |E*|
and FN test respectively. A portable core drilling machine was used to core 100mm diameter
specimens from the 150mm diameter samples (Figure 3.9). It should be noted that coring is done
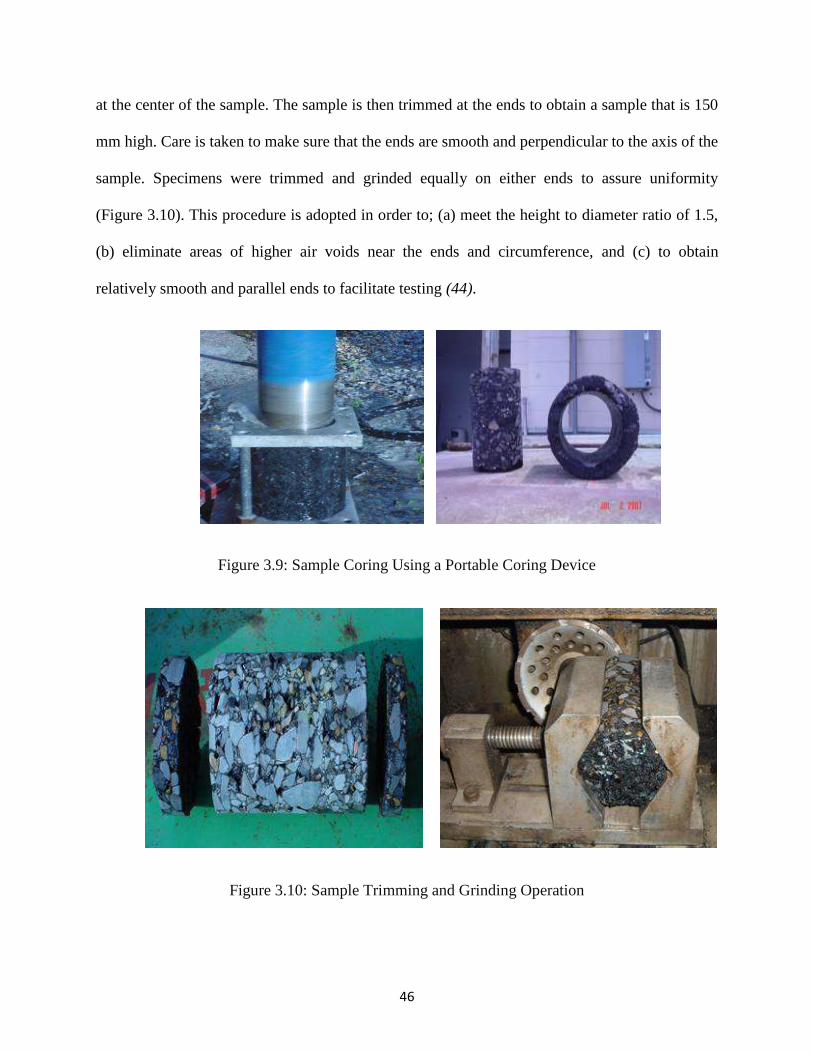
46
at the center of the sample. The sample is then trimmed at the ends to obtain a sample that is 150
mm high. Care is taken to make sure that the ends are smooth and perpendicular to the axis of the
sample. Specimens were trimmed and grinded equally on either ends to assure uniformity
(Figure 3.10). This procedure is adopted in order to; (a) meet the height to diameter ratio of 1.5,
(b) eliminate areas of higher air voids near the ends and circumference, and (c) to obtain
relatively smooth and parallel ends to facilitate testing (44).
Figure 3.9: Sample Coring Using a Portable Coring Device
Figure 3.10: Sample Trimming and Grinding Operation
47
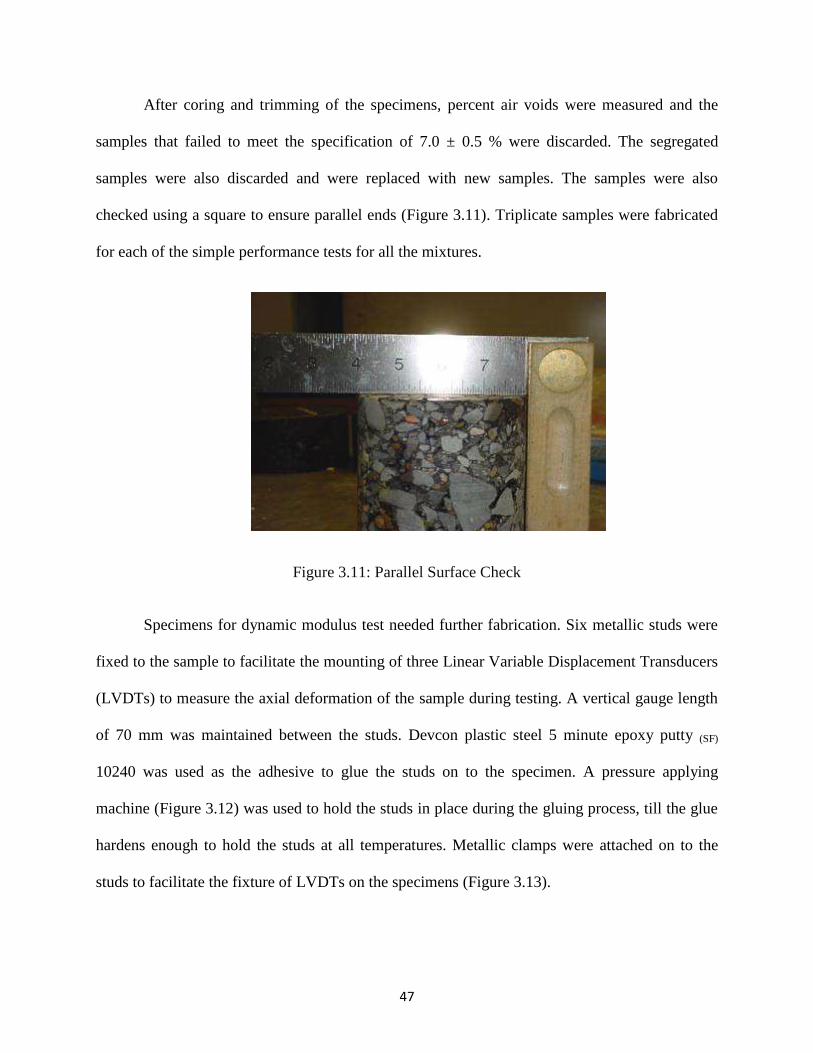
After coring and trimming of the specimens, percent air voids were measured and the
samples that failed to meet the specification of 7.0 ± 0.5 % were discarded. The segregated
samples were also discarded and were replaced with new samples. The samples were also
checked using a square to ensure parallel ends (Figure 3.11). Triplicate samples were fabricated
for each of the simple performance tests for all the mixtures.
Figure 3.11: Parallel Surface Check
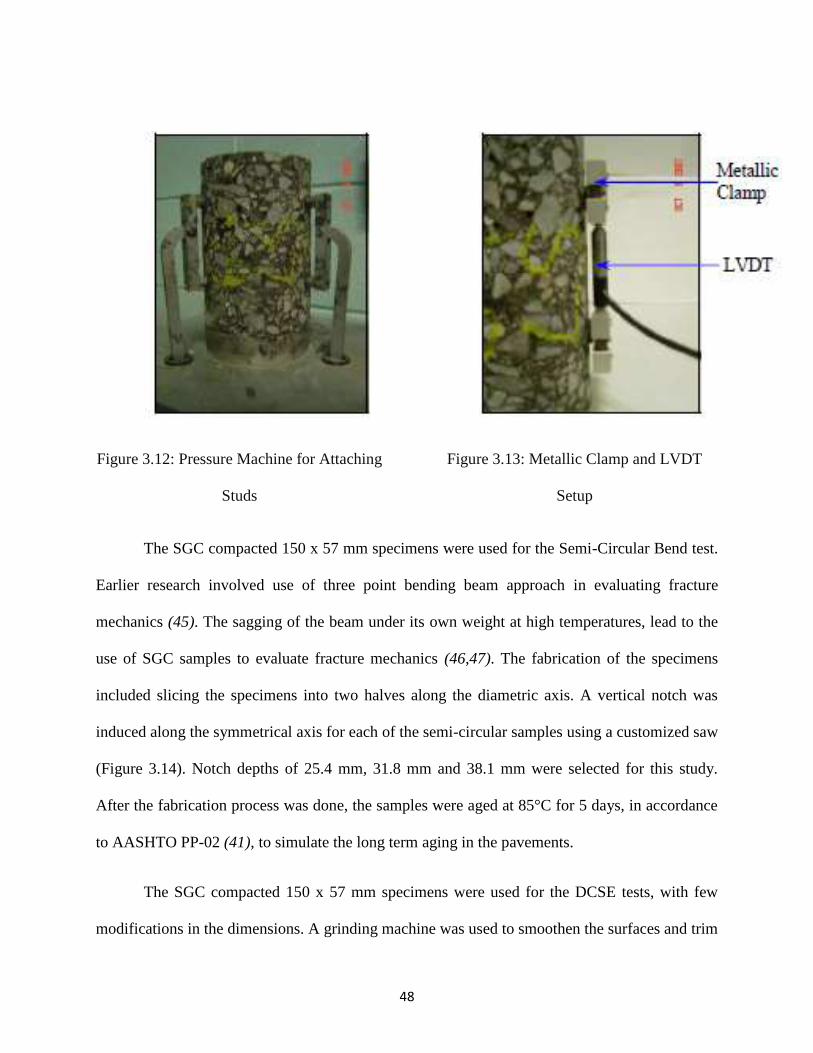
Specimens for dynamic modulus test needed further fabrication. Six metallic studs were
fixed to the sample to facilitate the mounting of three Linear Variable Displacement Transducers
(LVDTs) to measure the axial deformation of the sample during testing. A vertical gauge length
of 70 mm was maintained between the studs. Devcon plastic steel 5 minute epoxy putty (SF)
10240 was used as the adhesive to glue the studs on to the specimen. A pressure applying
machine (Figure 3.12) was used to hold the studs in place during the gluing process, till the glue
hardens enough to hold the studs at all temperatures. Metallic clamps were attached on to the
studs to facilitate the fixture of LVDTs on the specimens (Figure 3.13).
48
Figure 3.12: Pressure Machine for Attaching
Studs
Figure 3.13: Metallic Clamp and LVDT
Setup
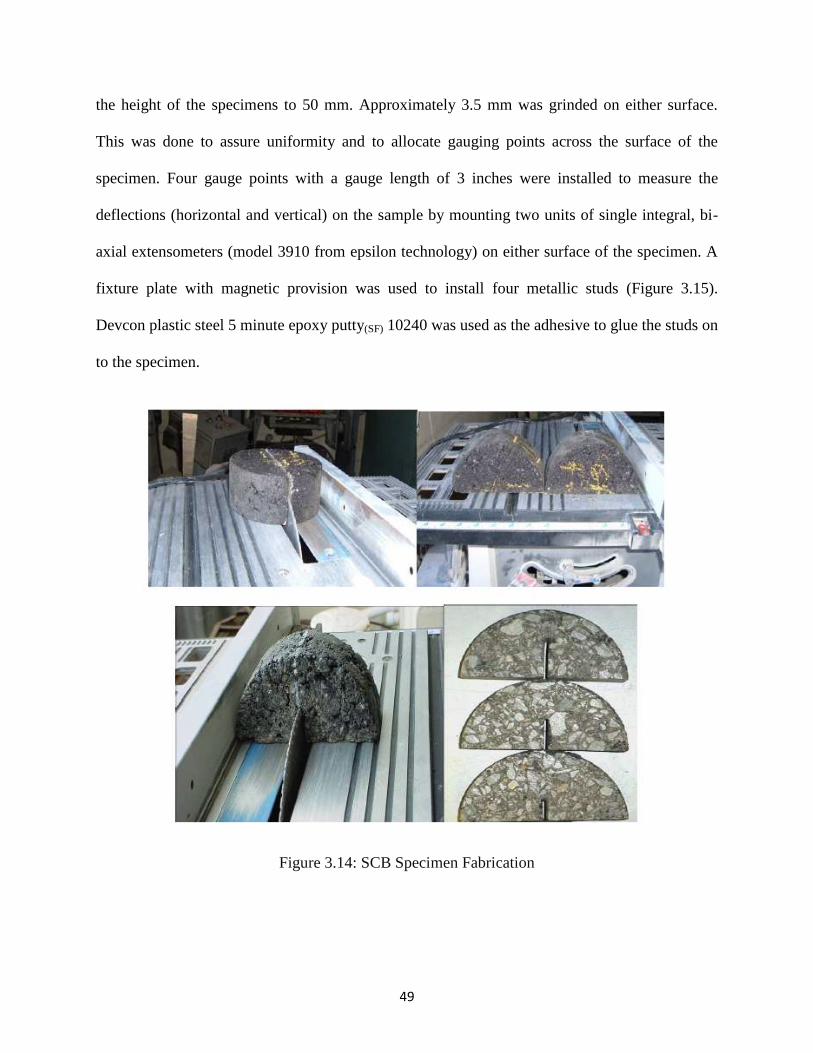
The SGC compacted 150 x 57 mm specimens were used for the Semi-Circular Bend test.
Earlier research involved use of three point bending beam approach in evaluating fracture
mechanics (45). The sagging of the beam under its own weight at high temperatures, lead to the
use of SGC samples to evaluate fracture mechanics (46,47). The fabrication of the specimens
included slicing the specimens into two halves along the diametric axis. A vertical notch was
induced along the symmetrical axis for each of the semi-circular samples using a customized saw
(Figure 3.14). Notch depths of 25.4 mm, 31.8 mm and 38.1 mm were selected for this study.
After the fabrication process was done, the samples were aged at 85°C for 5 days, in accordance
to AASHTO PP-02 (41), to simulate the long term aging in the pavements.
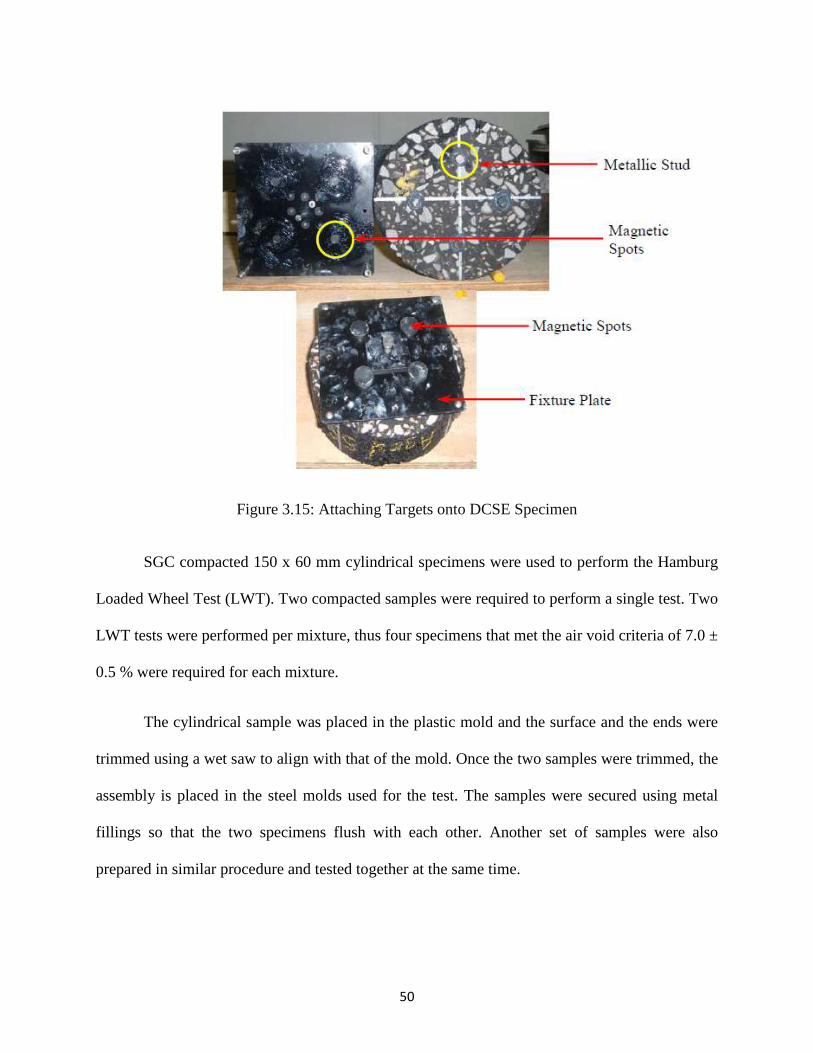
The SGC compacted 150 x 57 mm specimens were used for the DCSE tests, with few
modifications in the dimensions. A grinding machine was used to smoothen the surfaces and trim
49
the height of the specimens to 50 mm. Approximately 3.5 mm was grinded on either surface.
This was done to assure uniformity and to allocate gauging points across the surface of the
specimen. Four gauge points with a gauge length of 3 inches were installed to measure the
deflections (horizontal and vertical) on the sample by mounting two units of single integral, bi-
axial extensometers (model 3910 from epsilon technology) on either surface of the specimen. A
fixture plate with magnetic provision was used to install four metallic studs (Figure 3.15).
Devcon plastic steel 5 minute epoxy putty(SF) 10240 was used as the adhesive to glue the studs on
to the specimen.
Figure 3.14: SCB Specimen Fabrication
50
Figure 3.15: Attaching Targets onto DCSE Specimen
SGC compacted 150 x 60 mm cylindrical specimens were used to perform the Hamburg
Loaded Wheel Test (LWT). Two compacted samples were required to perform a single test. Two
LWT tests were performed per mixture, thus four specimens that met the air void criteria of 7.0 ±
0.5 % were required for each mixture.
The cylindrical sample was placed in the plastic mold and the surface and the ends were
trimmed using a wet saw to align with that of the mold. Once the two samples were trimmed, the
assembly is placed in the steel molds used for the test. The samples were secured using metal
fillings so that the two specimens flush with each other. Another set of samples were also
prepared in similar procedure and tested together at the same time.
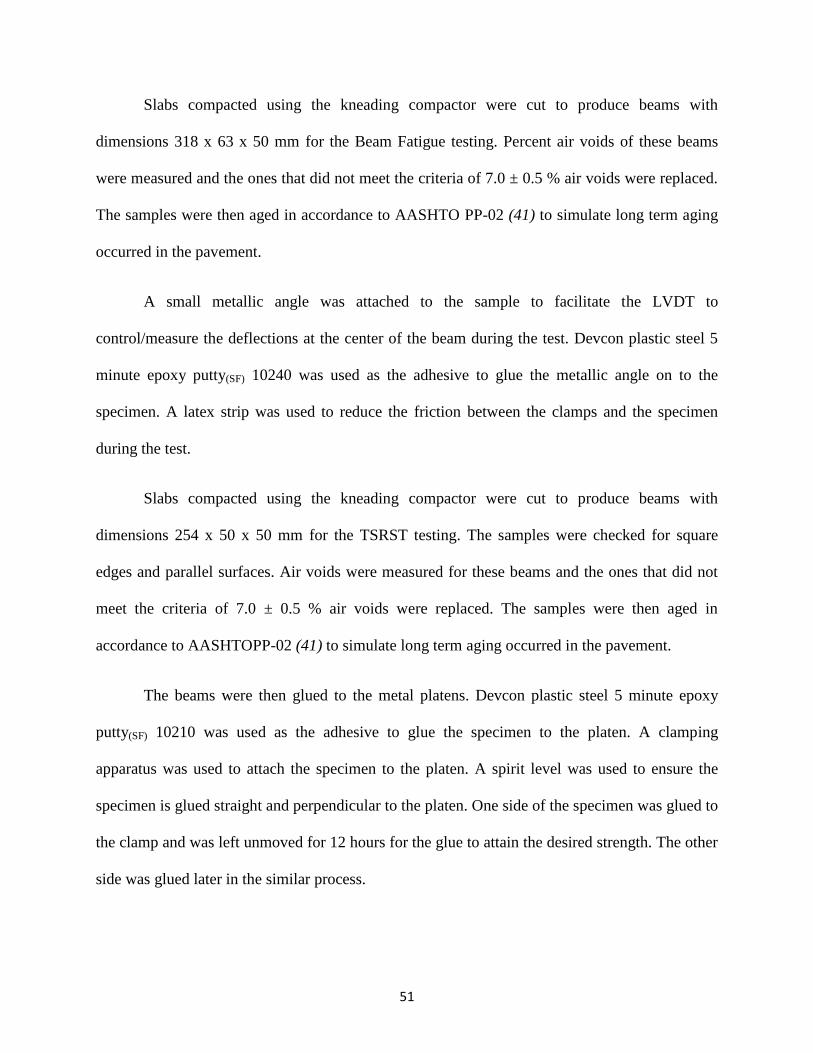
51
Slabs compacted using the kneading compactor were cut to produce beams with
dimensions 318 x 63 x 50 mm for the Beam Fatigue testing. Percent air voids of these beams
were measured and the ones that did not meet the criteria of 7.0 ± 0.5 % air voids were replaced.
The samples were then aged in accordance to AASHTO PP-02 (41) to simulate long term aging
occurred in the pavement.
A small metallic angle was attached to the sample to facilitate the LVDT to
control/measure the deflections at the center of the beam during the test. Devcon plastic steel 5
minute epoxy putty(SF) 10240 was used as the adhesive to glue the metallic angle on to the
specimen. A latex strip was used to reduce the friction between the clamps and the specimen
during the test.
Slabs compacted using the kneading compactor were cut to produce beams with
dimensions 254 x 50 x 50 mm for the TSRST testing. The samples were checked for square
edges and parallel surfaces. Air voids were measured for these beams and the ones that did not
meet the criteria of 7.0 ± 0.5 % air voids were replaced. The samples were then aged in
accordance to AASHTOPP-02 (41) to simulate long term aging occurred in the pavement.
The beams were then glued to the metal platens. Devcon plastic steel 5 minute epoxy
putty(SF) 10210 was used as the adhesive to glue the specimen to the platen. A clamping
apparatus was used to attach the specimen to the platen. A spirit level was used to ensure the
specimen is glued straight and perpendicular to the platen. One side of the specimen was glued to
the clamp and was left unmoved for 12 hours for the glue to attain the desired strength. The other
side was glued later in the similar process.
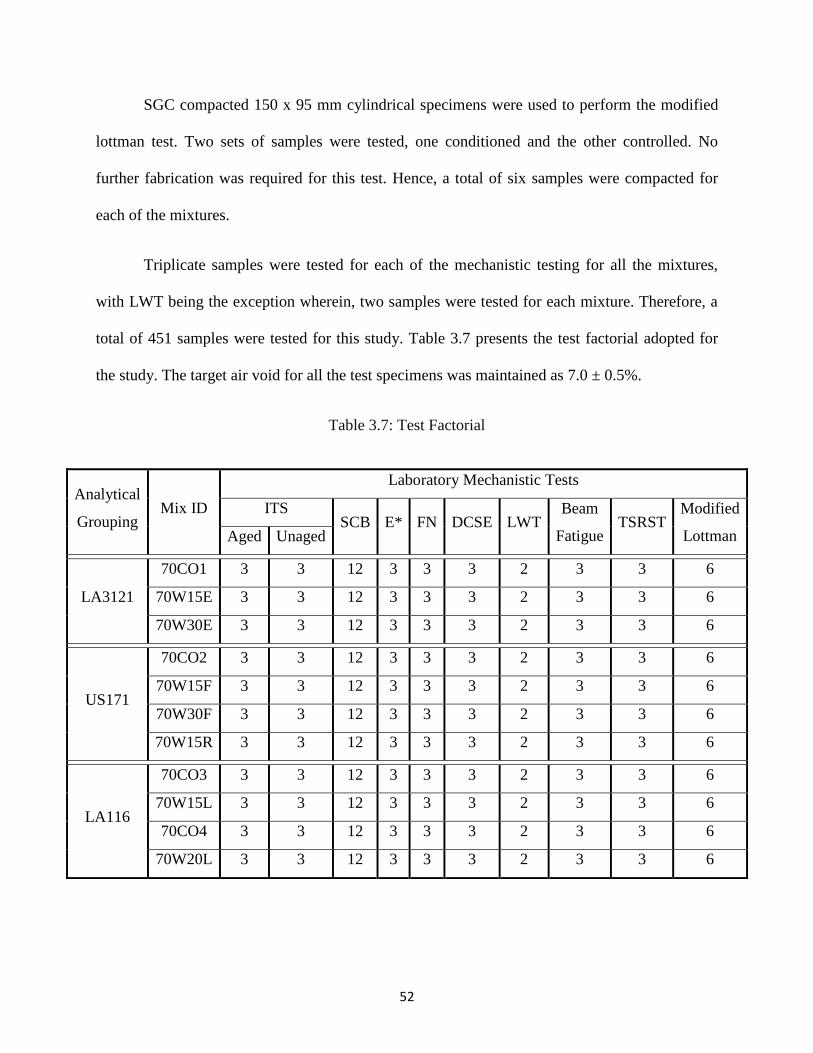
52
SGC compacted 150 x 95 mm cylindrical specimens were used to perform the modified
lottman test. Two sets of samples were tested, one conditioned and the other controlled. No
further fabrication was required for this test. Hence, a total of six samples were compacted for
each of the mixtures.
Triplicate samples were tested for each of the mechanistic testing for all the mixtures,
with LWT being the exception wherein, two samples were tested for each mixture. Therefore, a
total of 451 samples were tested for this study. Table 3.7 presents the test factorial adopted for
the study. The target air void for all the test specimens was maintained as 7.0 ± 0.5%.
Table 3.7: Test Factorial
Analytical
Grouping Mix ID
Laboratory Mechanistic Tests
ITS SCB E* FN DCSE LWT
Beam
Fatigue TSRST
Modified
Lottman Aged Unaged
LA3121
70CO1 3 3 12 3 3 3 2 3 3 6
70W15E 3 3 12 3 3 3 2 3 3 6
70W30E 3 3 12 3 3 3 2 3 3 6
US171
70CO2 3 3 12 3 3 3 2 3 3 6
70W15F 3 3 12 3 3 3 2 3 3 6
70W30F 3 3 12 3 3 3 2 3 3 6
70W15R 3 3 12 3 3 3 2 3 3 6
LA116
70CO3 3 3 12 3 3 3 2 3 3 6
70W15L 3 3 12 3 3 3 2 3 3 6
70CO4 3 3 12 3 3 3 2 3 3 6
70W20L 3 3 12 3 3 3 2 3 3 6
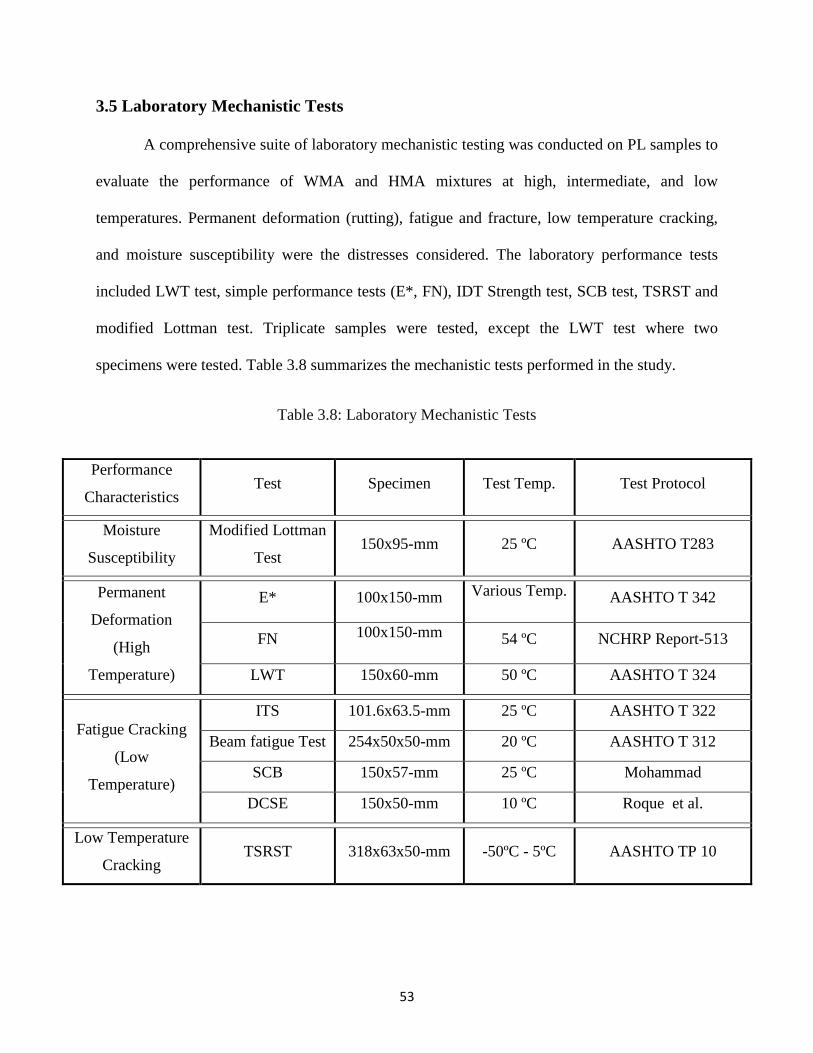
53
3.5 Laboratory Mechanistic Tests
A comprehensive suite of laboratory mechanistic testing was conducted on PL samples to
evaluate the performance of WMA and HMA mixtures at high, intermediate, and low
temperatures. Permanent deformation (rutting), fatigue and fracture, low temperature cracking,
and moisture susceptibility were the distresses considered. The laboratory performance tests
included LWT test, simple performance tests (E*, FN), IDT Strength test, SCB test, TSRST and
modified Lottman test. Triplicate samples were tested, except the LWT test where two
specimens were tested. Table 3.8 summarizes the mechanistic tests performed in the study.
Table 3.8: Laboratory Mechanistic Tests
Performance
Characteristics Test Specimen Test Temp. Test Protocol
Moisture
Susceptibility
Modified Lottman
Test 150x95-mm 25 ºC AASHTO T283
Permanent
Deformation
(High
Temperature)
E* 100x150-mm Various Temp. AASHTO T 342
FN 100x150-mm 54 ºC NCHRP Report-513
LWT 150x60-mm 50 ºC AASHTO T 324
Fatigue Cracking
(Low
Temperature)
ITS 101.6x63.5-mm 25 ºC AASHTO T 322
Beam fatigue Test 254x50x50-mm 20 ºC AASHTO T 312
SCB 150x57-mm 25 ºC Mohammad
DCSE 150x50-mm 10 ºC Roque et al.
Low Temperature
Cracking TSRST 318x63x50-mm -50ºC - 5ºC AASHTO TP 10
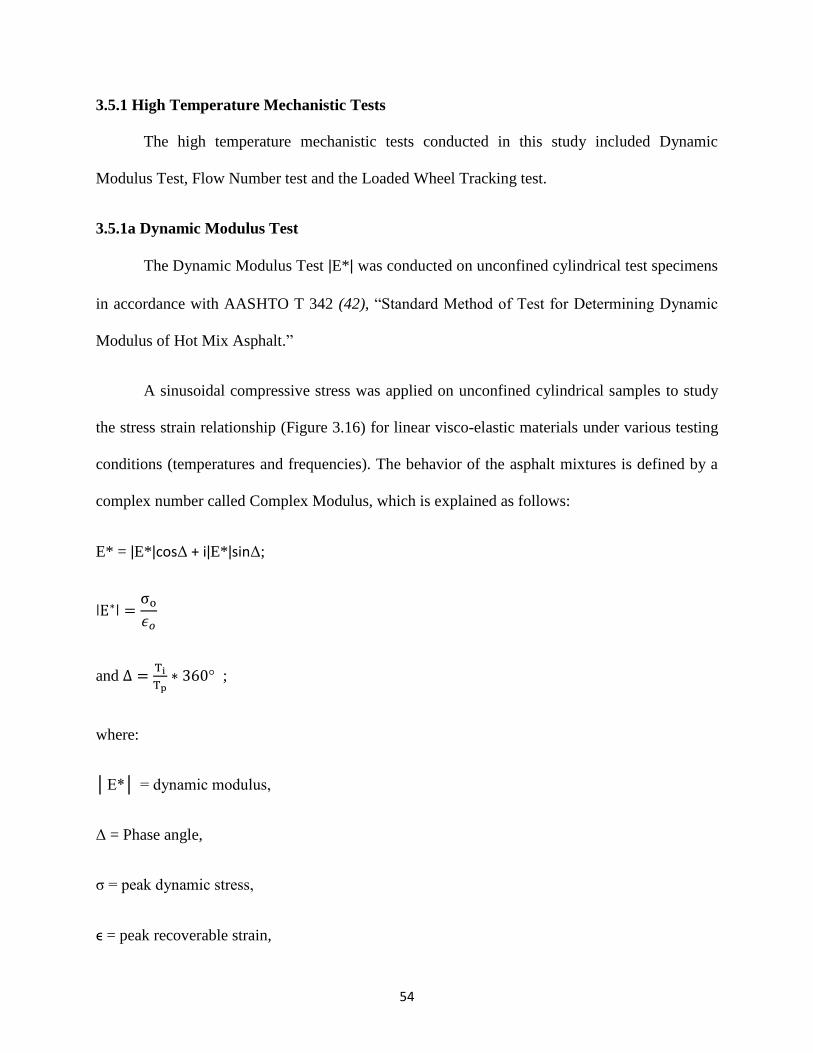
54
3.5.1 High Temperature Mechanistic Tests
The high temperature mechanistic tests conducted in this study included Dynamic
Modulus Test, Flow Number test and the Loaded Wheel Tracking test.
3.5.1a Dynamic Modulus Test
The Dynamic Modulus Test ǀE*ǀ was conducted on unconfined cylindrical test specimens
in accordance with AASHTO T 342 (42), “Standard Method of Test for Determining Dynamic
Modulus of Hot Mix Asphalt.”
A sinusoidal compressive stress was applied on unconfined cylindrical samples to study
the stress strain relationship (Figure 3.16) for linear visco-elastic materials under various testing
conditions (temperatures and frequencies). The behavior of the asphalt mixtures is defined by a
complex number called Complex Modulus, which is explained as follows:
E* = ǀE*ǀcosΔ + iǀE*ǀsinΔ;
and
;
where:
│E*│ = dynamic modulus,
Δ = Phase angle,
σ = peak dynamic stress,
ϵ = peak recoverable strain,
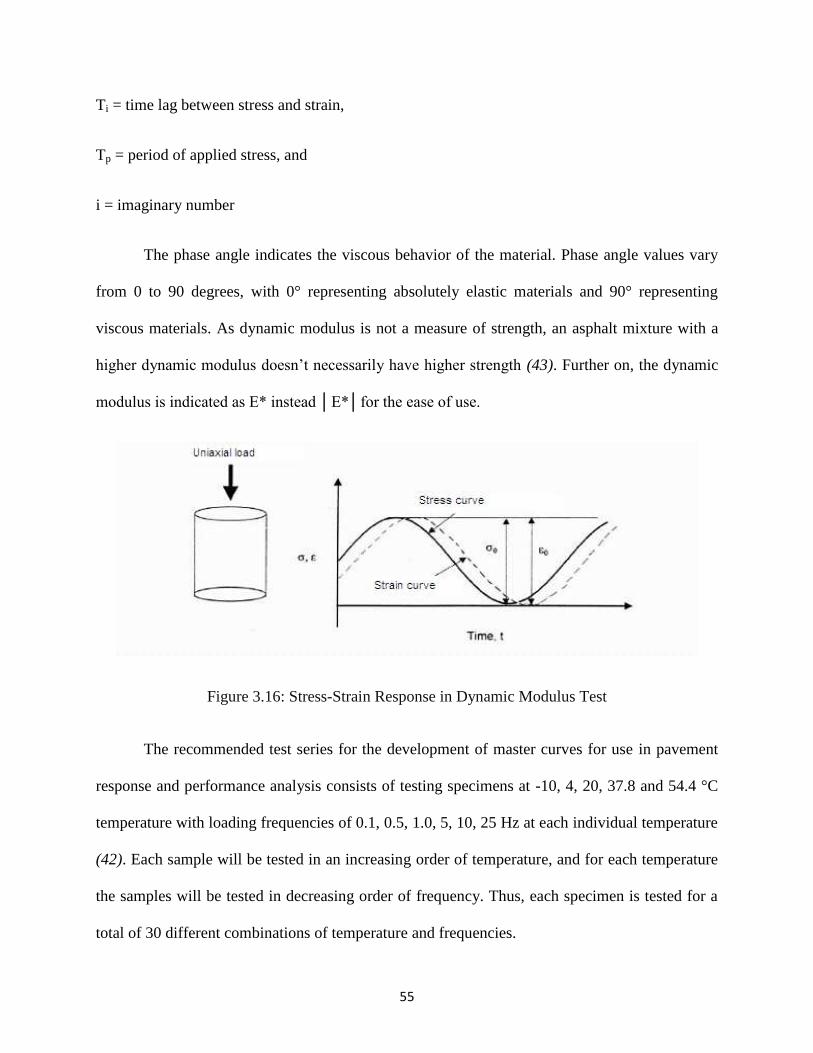
55
Ti = time lag between stress and strain,
Tp = period of applied stress, and
i = imaginary number
The phase angle indicates the viscous behavior of the material. Phase angle values vary
from 0 to 90 degrees, with 0° representing absolutely elastic materials and 90° representing
viscous materials. As dynamic modulus is not a measure of strength, an asphalt mixture with a
higher dynamic modulus doesn’t necessarily have higher strength (43). Further on, the dynamic
modulus is indicated as E* instead │E*│for the ease of use.
Figure 3.16: Stress-Strain Response in Dynamic Modulus Test
The recommended test series for the development of master curves for use in pavement
response and performance analysis consists of testing specimens at -10, 4, 20, 37.8 and 54.4 °C
temperature with loading frequencies of 0.1, 0.5, 1.0, 5, 10, 25 Hz at each individual temperature
(42). Each sample will be tested in an increasing order of temperature, and for each temperature
the samples will be tested in decreasing order of frequency. Thus, each specimen is tested for a
total of 30 different combinations of temperature and frequencies.
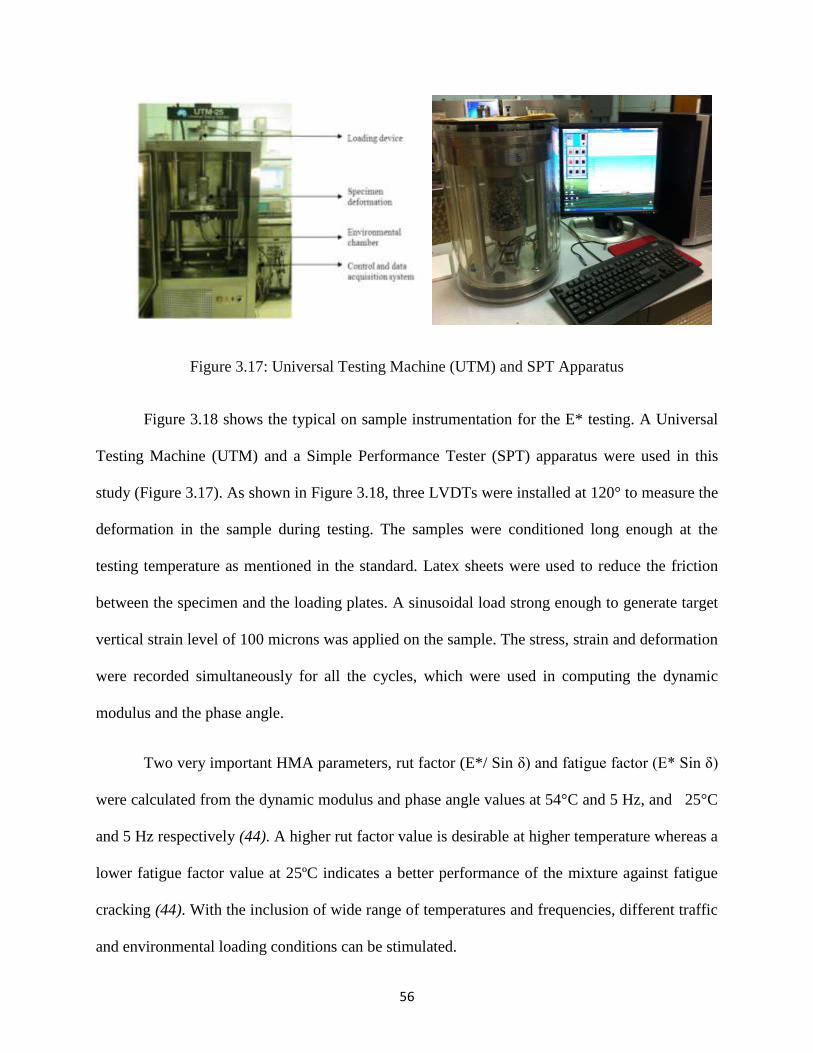
56
Figure 3.17: Universal Testing Machine (UTM) and SPT Apparatus
Figure 3.18 shows the typical on sample instrumentation for the E* testing. A Universal
Testing Machine (UTM) and a Simple Performance Tester (SPT) apparatus were used in this
study (Figure 3.17). As shown in Figure 3.18, three LVDTs were installed at 120° to measure the
deformation in the sample during testing. The samples were conditioned long enough at the
testing temperature as mentioned in the standard. Latex sheets were used to reduce the friction
between the specimen and the loading plates. A sinusoidal load strong enough to generate target
vertical strain level of 100 microns was applied on the sample. The stress, strain and deformation
were recorded simultaneously for all the cycles, which were used in computing the dynamic
modulus and the phase angle.
Two very important HMA parameters, rut factor (E*/ Sin δ) and fatigue factor (E* Sin δ)
were calculated from the dynamic modulus and phase angle values at 54°C and 5 Hz, and 25°C
and 5 Hz respectively (44). A higher rut factor value is desirable at higher temperature whereas a
lower fatigue factor value at 25ºC indicates a better performance of the mixture against fatigue
cracking (44). With the inclusion of wide range of temperatures and frequencies, different traffic
and environmental loading conditions can be stimulated.
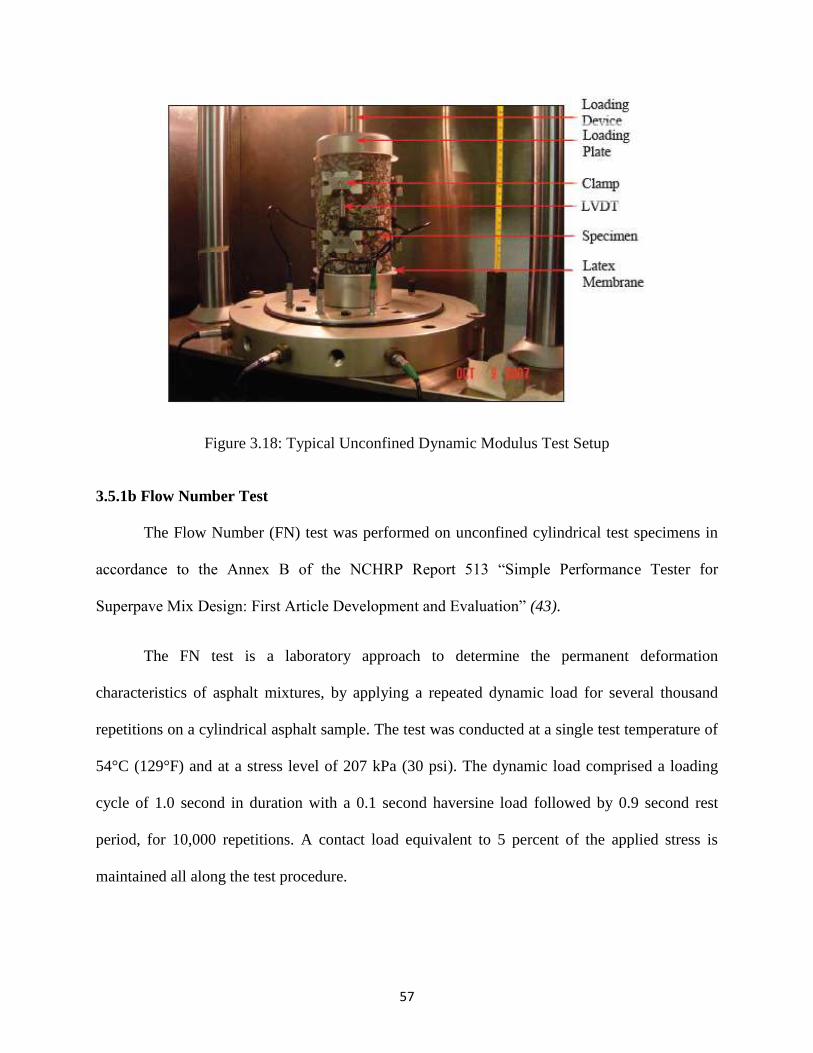
57
Figure 3.18: Typical Unconfined Dynamic Modulus Test Setup
3.5.1b Flow Number Test
The Flow Number (FN) test was performed on unconfined cylindrical test specimens in
accordance to the Annex B of the NCHRP Report 513 “Simple Performance Tester for
Superpave Mix Design: First Article Development and Evaluation” (43).
The FN test is a laboratory approach to determine the permanent deformation
characteristics of asphalt mixtures, by applying a repeated dynamic load for several thousand
repetitions on a cylindrical asphalt sample. The test was conducted at a single test temperature of
54°C (129°F) and at a stress level of 207 kPa (30 psi). The dynamic load comprised a loading
cycle of 1.0 second in duration with a 0.1 second haversine load followed by 0.9 second rest
period, for 10,000 repetitions. A contact load equivalent to 5 percent of the applied stress is
maintained all along the test procedure.
58
A Universal Testing Machine (UTM) and a Simple Performance Tester (SPT) apparatus
were used to perform the test (Figure 3.17). The samples were conditioned at the test temperature
(54.4°C) for 3 hours in accordance to the standard practice. Latex membranes were used to
reduce the friction between the loading plates and specimen. Once the conditioning is done, a
contact load is applied on the specimen before applying the dynamic haversine cyclic load. The
stress, strain and temperature were recorded for each cycle for the computation of FN. The test
was conducted till the specimen accumulated 50,000 µϵ or till 10,000 cycles which ever occurred
first.
The FN is defined as the starting point, or cycle number, at which tertiary flow occurs on
a cumulative permanent strain curve obtained during the test. As seen in the Figure 3.19, the
cumulative permanent strain curve can be divided into three phases: primary, secondary and
tertiary. Steep increase in permanent deformation can be observed in the primary and the tertiary
regions, wherein a linear trend is observed in the secondary region.
The start point of tertiary flow was calculated from the derivative (rate of change of
microstrain) and the load cycles plots. The rate of change of microstrain (derivative) was
computed from the permanent deformation data for each of the tests conducted. Smoothening the
data and polynomial curve fitting were performed in order to attain accurate results. The lowest
point on the curve is considered as the start of the tertiary flow, and thus the number of load
cycles corresponding to this point is the flow number. In case of inconclusive results (no lowest
point on the curve), a FN of 10,000 was assigned (the load cycle at the end of the test) for the
test, considering the sample did not flow.
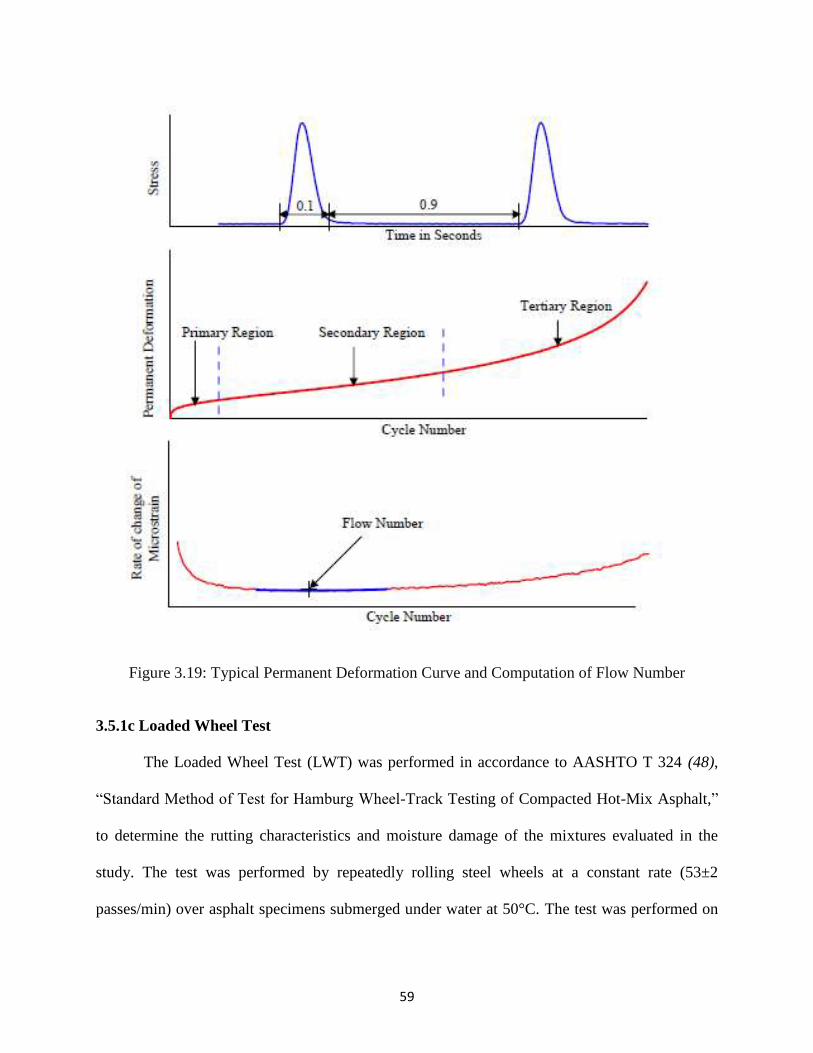
59
Figure 3.19: Typical Permanent Deformation Curve and Computation of Flow Number
3.5.1c Loaded Wheel Test
The Loaded Wheel Test (LWT) was performed in accordance to AASHTO T 324 (48),
“Standard Method of Test for Hamburg Wheel-Track Testing of Compacted Hot-Mix Asphalt,”
to determine the rutting characteristics and moisture damage of the mixtures evaluated in the
study. The test was performed by repeatedly rolling steel wheels at a constant rate (53±2
passes/min) over asphalt specimens submerged under water at 50°C. The test was performed on
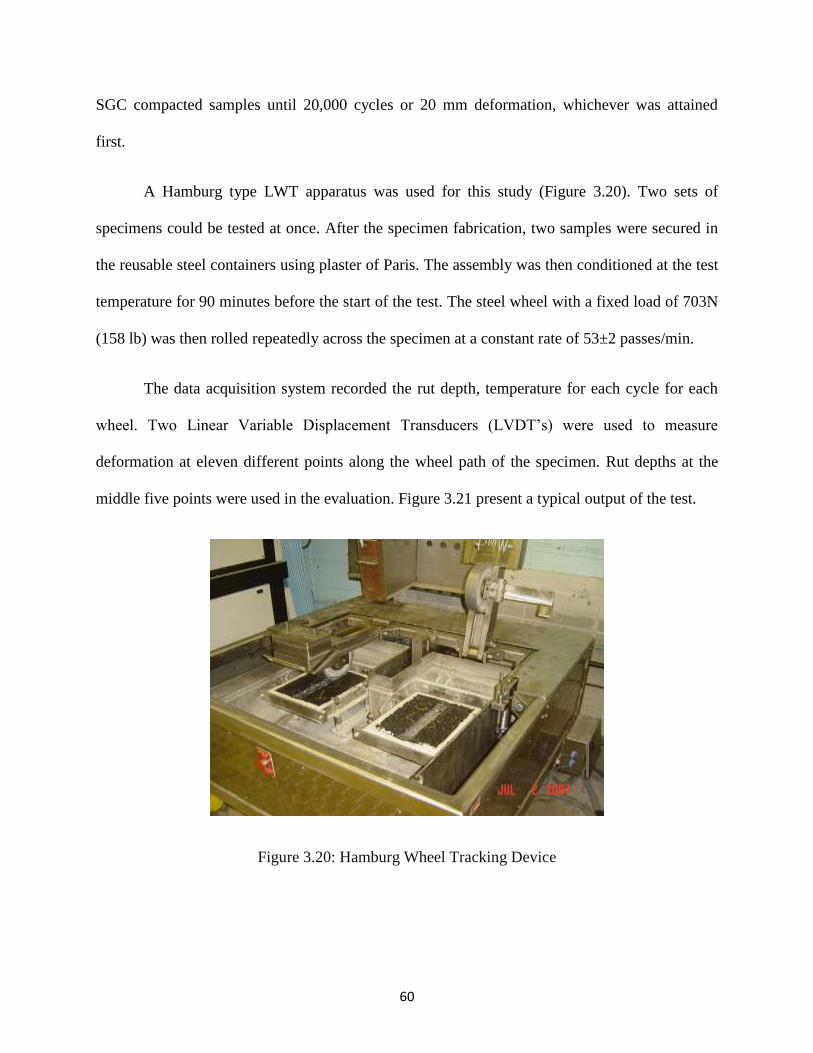
60
SGC compacted samples until 20,000 cycles or 20 mm deformation, whichever was attained
first.
A Hamburg type LWT apparatus was used for this study (Figure 3.20). Two sets of
specimens could be tested at once. After the specimen fabrication, two samples were secured in
the reusable steel containers using plaster of Paris. The assembly was then conditioned at the test
temperature for 90 minutes before the start of the test. The steel wheel with a fixed load of 703N
(158 lb) was then rolled repeatedly across the specimen at a constant rate of 53±2 passes/min.
The data acquisition system recorded the rut depth, temperature for each cycle for each
wheel. Two Linear Variable Displacement Transducers (LVDT’s) were used to measure
deformation at eleven different points along the wheel path of the specimen. Rut depths at the
middle five points were used in the evaluation. Figure 3.21 present a typical output of the test.
Figure 3.20: Hamburg Wheel Tracking Device
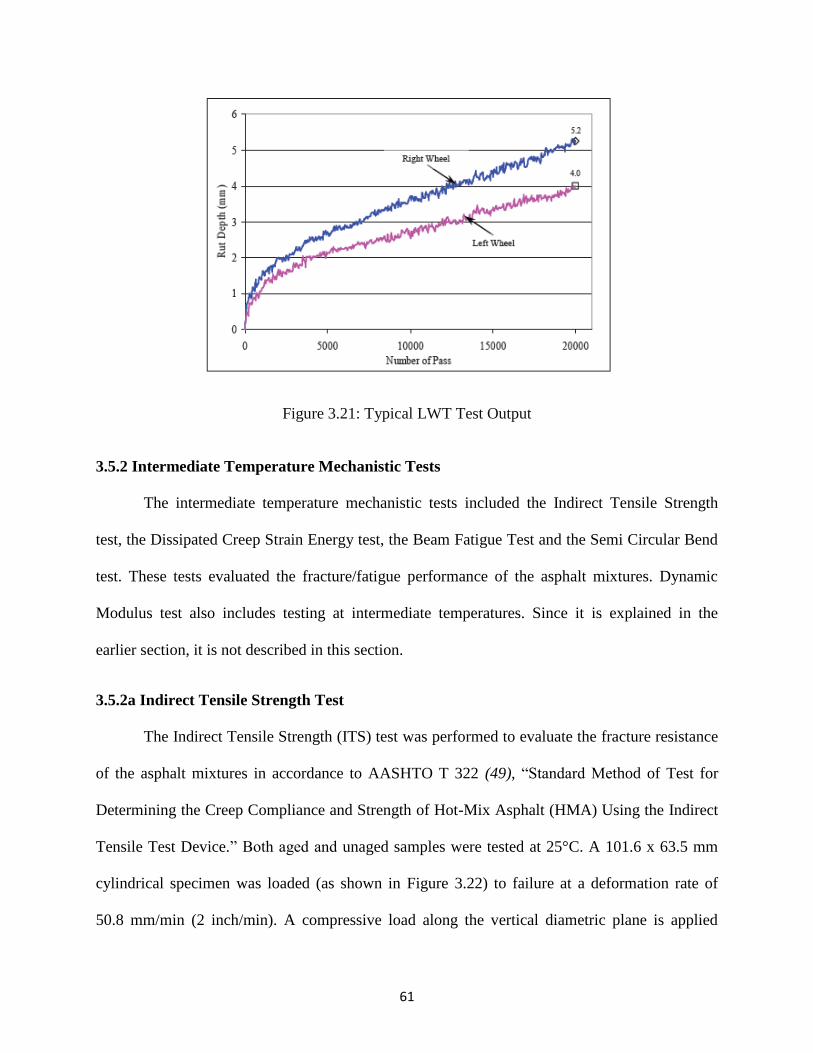
61
Figure 3.21: Typical LWT Test Output
3.5.2 Intermediate Temperature Mechanistic Tests
The intermediate temperature mechanistic tests included the Indirect Tensile Strength
test, the Dissipated Creep Strain Energy test, the Beam Fatigue Test and the Semi Circular Bend
test. These tests evaluated the fracture/fatigue performance of the asphalt mixtures. Dynamic
Modulus test also includes testing at intermediate temperatures. Since it is explained in the
earlier section, it is not described in this section.
3.5.2a Indirect Tensile Strength Test
The Indirect Tensile Strength (ITS) test was performed to evaluate the fracture resistance
of the asphalt mixtures in accordance to AASHTO T 322 (49), “Standard Method of Test for
Determining the Creep Compliance and Strength of Hot-Mix Asphalt (HMA) Using the Indirect
Tensile Test Device.” Both aged and unaged samples were tested at 25°C. A 101.6 x 63.5 mm
cylindrical specimen was loaded (as shown in Figure 3.22) to failure at a deformation rate of
50.8 mm/min (2 inch/min). A compressive load along the vertical diametric plane is applied
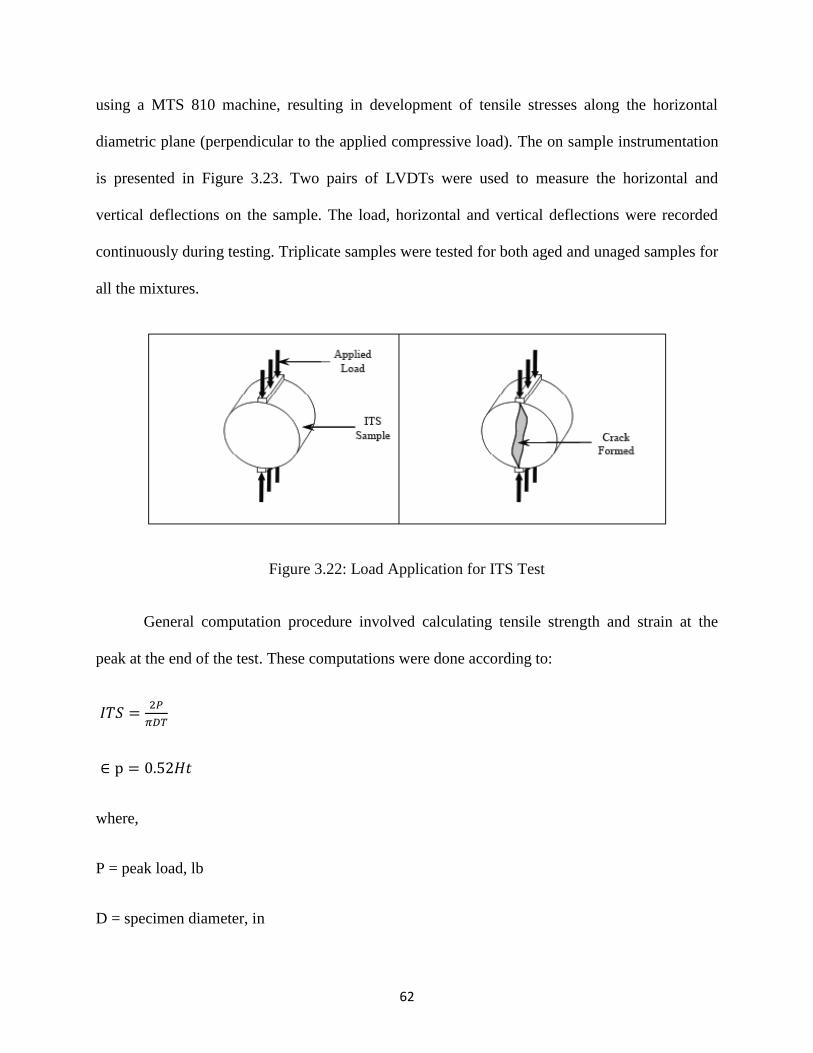
62
using a MTS 810 machine, resulting in development of tensile stresses along the horizontal
diametric plane (perpendicular to the applied compressive load). The on sample instrumentation
is presented in Figure 3.23. Two pairs of LVDTs were used to measure the horizontal and
vertical deflections on the sample. The load, horizontal and vertical deflections were recorded
continuously during testing. Triplicate samples were tested for both aged and unaged samples for
all the mixtures.
Figure 3.22: Load Application for ITS Test
General computation procedure involved calculating tensile strength and strain at the
peak at the end of the test. These computations were done according to:
where,
P = peak load, lb
D = specimen diameter, in
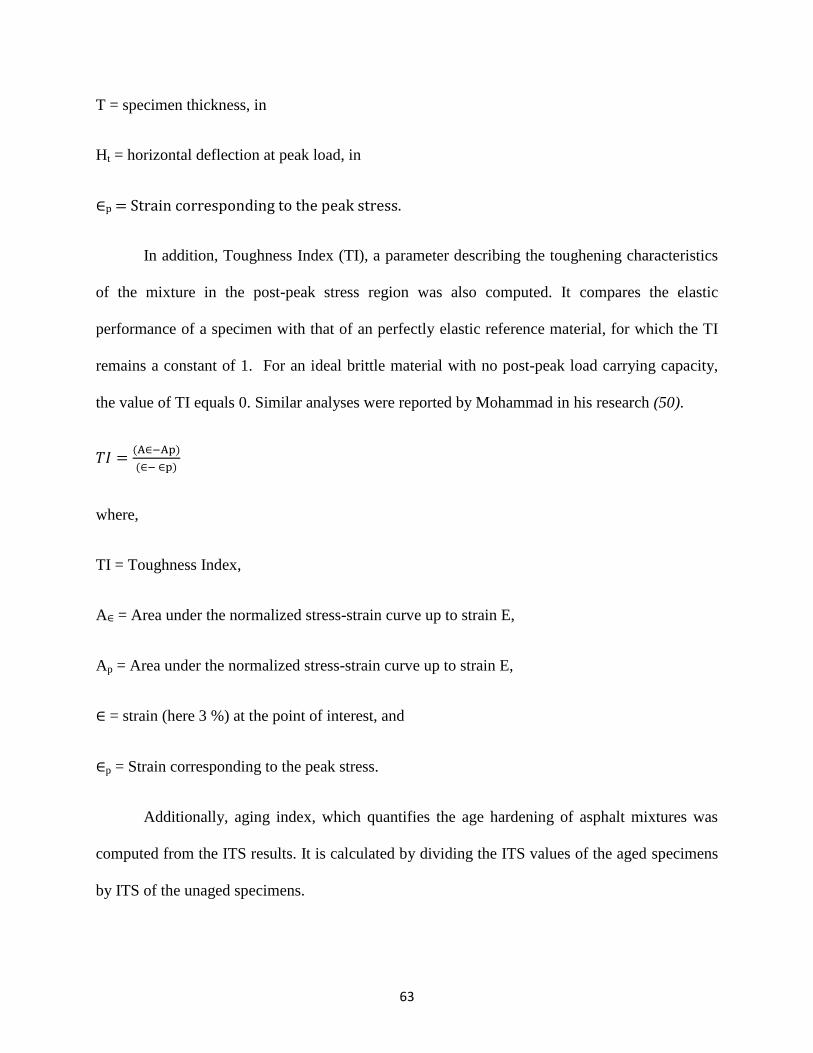
63
T = specimen thickness, in
Ht = horizontal deflection at peak load, in
p = Strain corresponding to the peak stress.
In addition, Toughness Index (TI), a parameter describing the toughening characteristics
of the mixture in the post-peak stress region was also computed. It compares the elastic
performance of a specimen with that of an perfectly elastic reference material, for which the TI
remains a constant of 1. For an ideal brittle material with no post-peak load carrying capacity,
the value of TI equals 0. Similar analyses were reported by Mohammad in his research (50).
where,
TI = Toughness Index,
A = Area under the normalized stress-strain curve up to strain E,
Ap = Area under the normalized stress-strain curve up to strain E,
= strain (here 3 %) at the point of interest, and
p = Strain corresponding to the peak stress.
Additionally, aging index, which quantifies the age hardening of asphalt mixtures was
computed from the ITS results. It is calculated by dividing the ITS values of the aged specimens
by ITS of the unaged specimens.
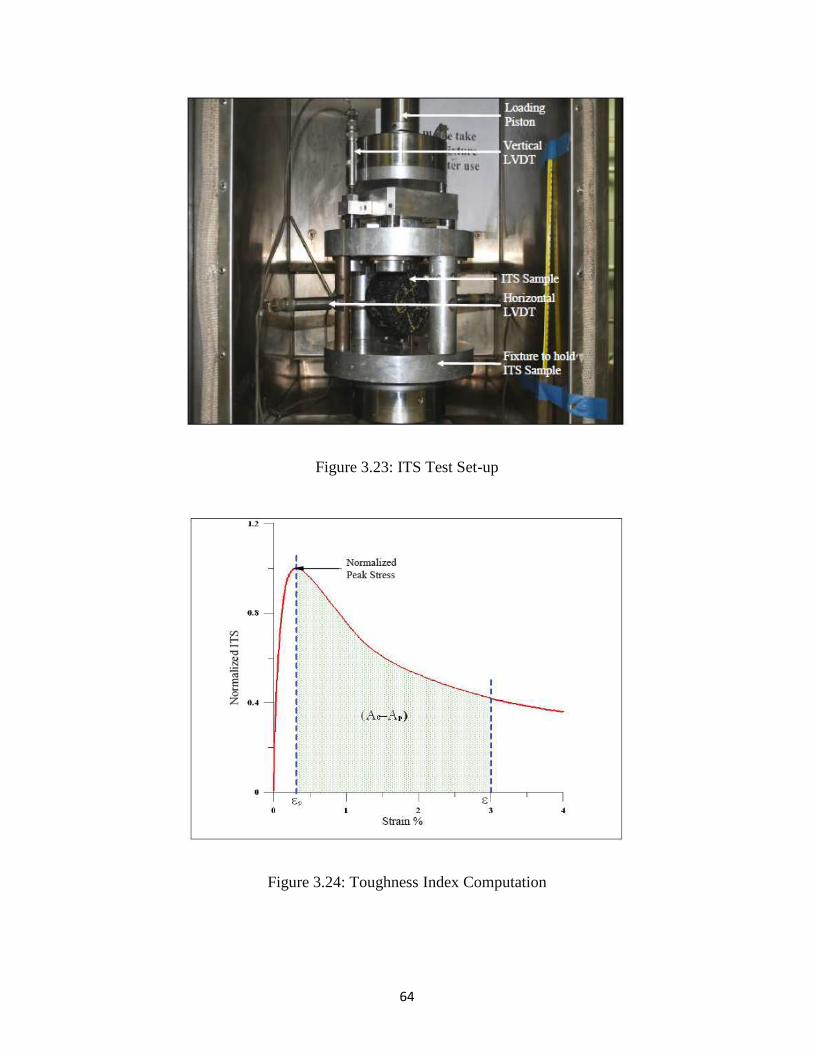
64
Figure 3.23: ITS Test Set-up
Figure 3.24: Toughness Index Computation
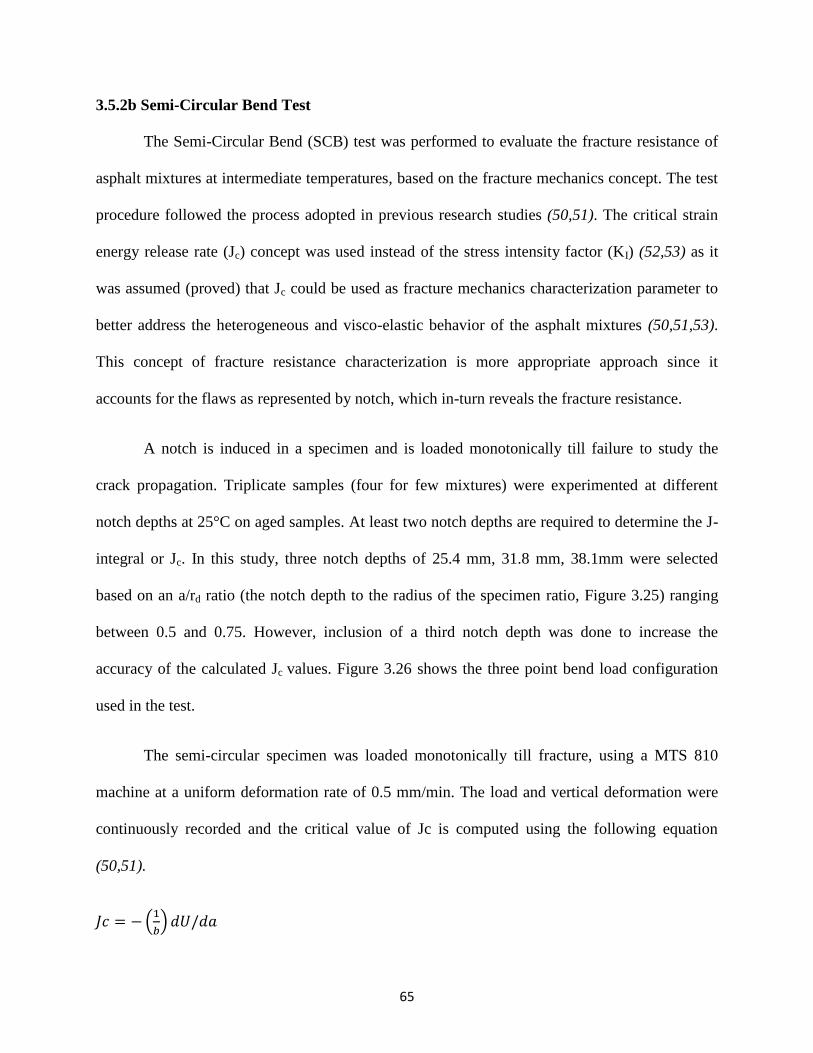
65
3.5.2b Semi-Circular Bend Test
The Semi-Circular Bend (SCB) test was performed to evaluate the fracture resistance of
asphalt mixtures at intermediate temperatures, based on the fracture mechanics concept. The test
procedure followed the process adopted in previous research studies (50,51). The critical strain
energy release rate (Jc) concept was used instead of the stress intensity factor (KI) (52,53) as it
was assumed (proved) that Jc could be used as fracture mechanics characterization parameter to
better address the heterogeneous and visco-elastic behavior of the asphalt mixtures (50,51,53).
This concept of fracture resistance characterization is more appropriate approach since it
accounts for the flaws as represented by notch, which in-turn reveals the fracture resistance.
A notch is induced in a specimen and is loaded monotonically till failure to study the
crack propagation. Triplicate samples (four for few mixtures) were experimented at different
notch depths at 25°C on aged samples. At least two notch depths are required to determine the J-
integral or Jc. In this study, three notch depths of 25.4 mm, 31.8 mm, 38.1mm were selected
based on an a/rd ratio (the notch depth to the radius of the specimen ratio, Figure 3.25) ranging
between 0.5 and 0.75. However, inclusion of a third notch depth was done to increase the
accuracy of the calculated Jc values. Figure 3.26 shows the three point bend load configuration
used in the test.
The semi-circular specimen was loaded monotonically till fracture, using a MTS 810
machine at a uniform deformation rate of 0.5 mm/min. The load and vertical deformation were
continuously recorded and the critical value of Jc is computed using the following equation
(50,51).
(
)
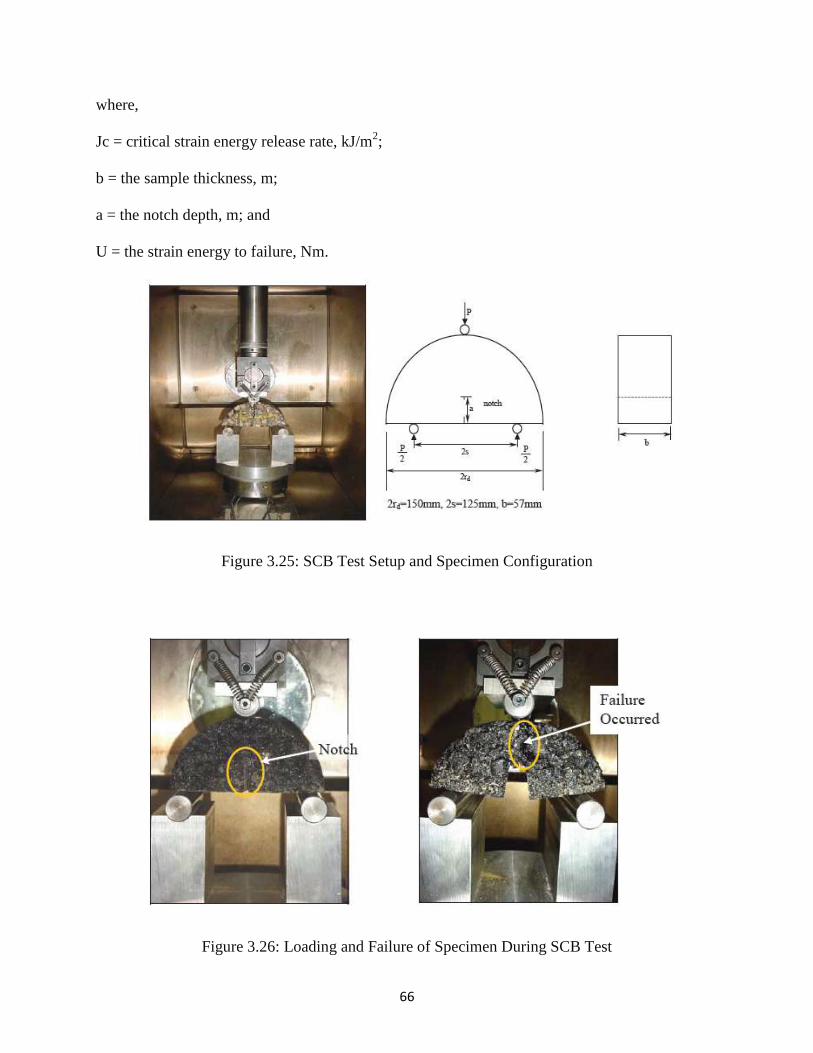
66
where,
Jc = critical strain energy release rate, kJ/m2;
b = the sample thickness, m;
a = the notch depth, m; and
U = the strain energy to failure, Nm.
Figure 3.25: SCB Test Setup and Specimen Configuration
Figure 3.26: Loading and Failure of Specimen During SCB Test
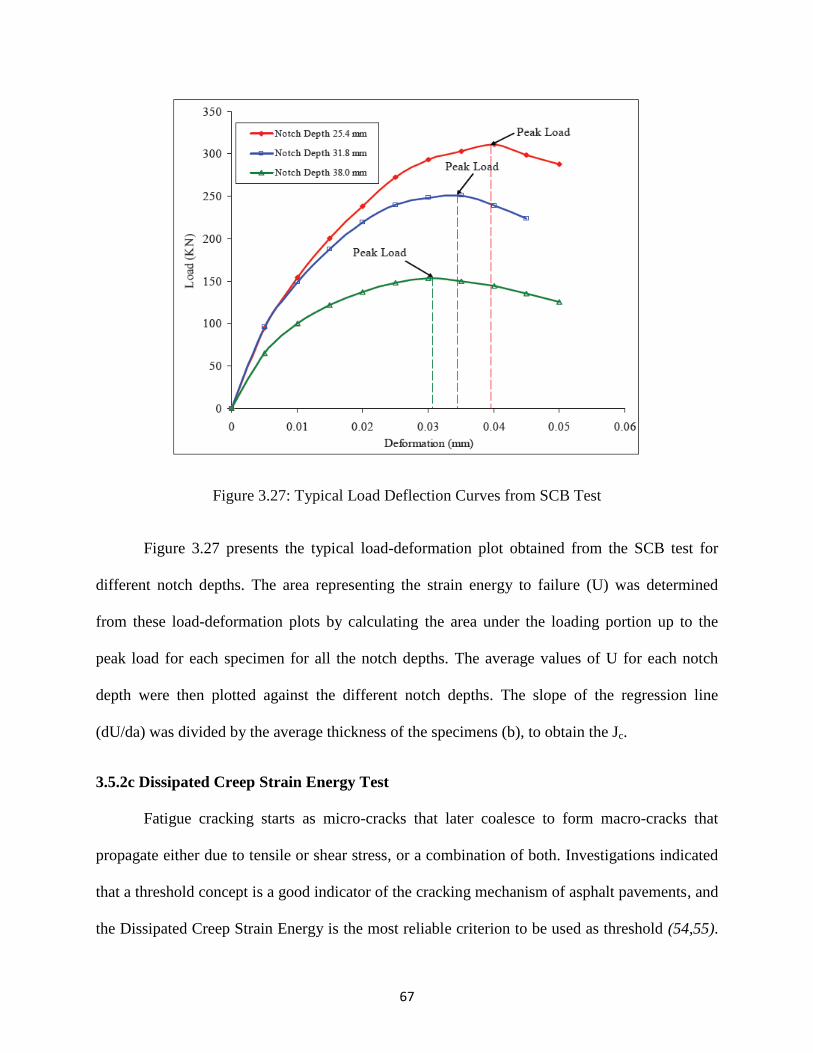
67
Figure 3.27: Typical Load Deflection Curves from SCB Test
Figure 3.27 presents the typical load-deformation plot obtained from the SCB test for
different notch depths. The area representing the strain energy to failure (U) was determined
from these load-deformation plots by calculating the area under the loading portion up to the
peak load for each specimen for all the notch depths. The average values of U for each notch
depth were then plotted against the different notch depths. The slope of the regression line
(dU/da) was divided by the average thickness of the specimens (b), to obtain the Jc.
3.5.2c Dissipated Creep Strain Energy Test
Fatigue cracking starts as micro-cracks that later coalesce to form macro-cracks that
propagate either due to tensile or shear stress, or a combination of both. Investigations indicated
that a threshold concept is a good indicator of the cracking mechanism of asphalt pavements, and
the Dissipated Creep Strain Energy is the most reliable criterion to be used as threshold (54,55).
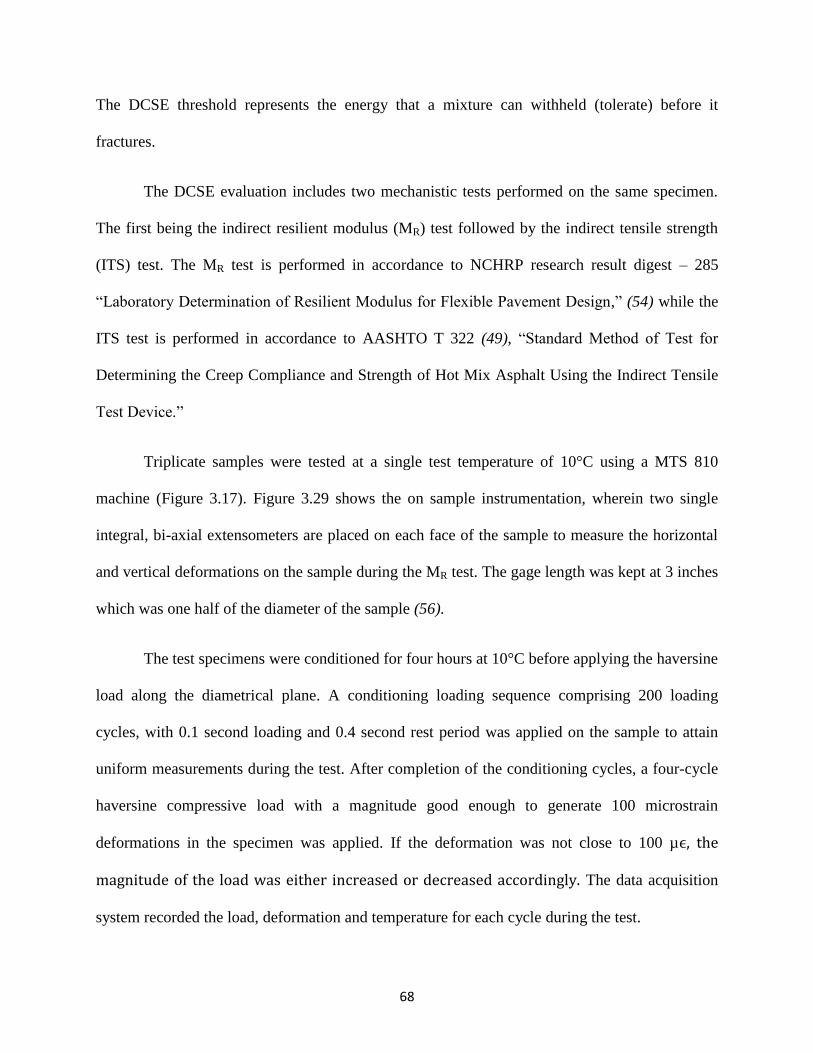
68
The DCSE threshold represents the energy that a mixture can withheld (tolerate) before it
fractures.
The DCSE evaluation includes two mechanistic tests performed on the same specimen.
The first being the indirect resilient modulus (MR) test followed by the indirect tensile strength
(ITS) test. The MR test is performed in accordance to NCHRP research result digest – 285
“Laboratory Determination of Resilient Modulus for Flexible Pavement Design,” (54) while the
ITS test is performed in accordance to AASHTO T 322 (49), “Standard Method of Test for
Determining the Creep Compliance and Strength of Hot Mix Asphalt Using the Indirect Tensile
Test Device.”
Triplicate samples were tested at a single test temperature of 10°C using a MTS 810
machine (Figure 3.17). Figure 3.29 shows the on sample instrumentation, wherein two single
integral, bi-axial extensometers are placed on each face of the sample to measure the horizontal
and vertical deformations on the sample during the MR test. The gage length was kept at 3 inches
which was one half of the diameter of the sample (56).
The test specimens were conditioned for four hours at 10°C before applying the haversine
load along the diametrical plane. A conditioning loading sequence comprising 200 loading
cycles, with 0.1 second loading and 0.4 second rest period was applied on the sample to attain
uniform measurements during the test. After completion of the conditioning cycles, a four-cycle
haversine compressive load with a magnitude good enough to generate 100 microstrain
deformations in the specimen was applied. If the deformation was not close to 100 µϵ, the
magnitude of the load was either increased or decreased accordingly. The data acquisition
system recorded the load, deformation and temperature for each cycle during the test.
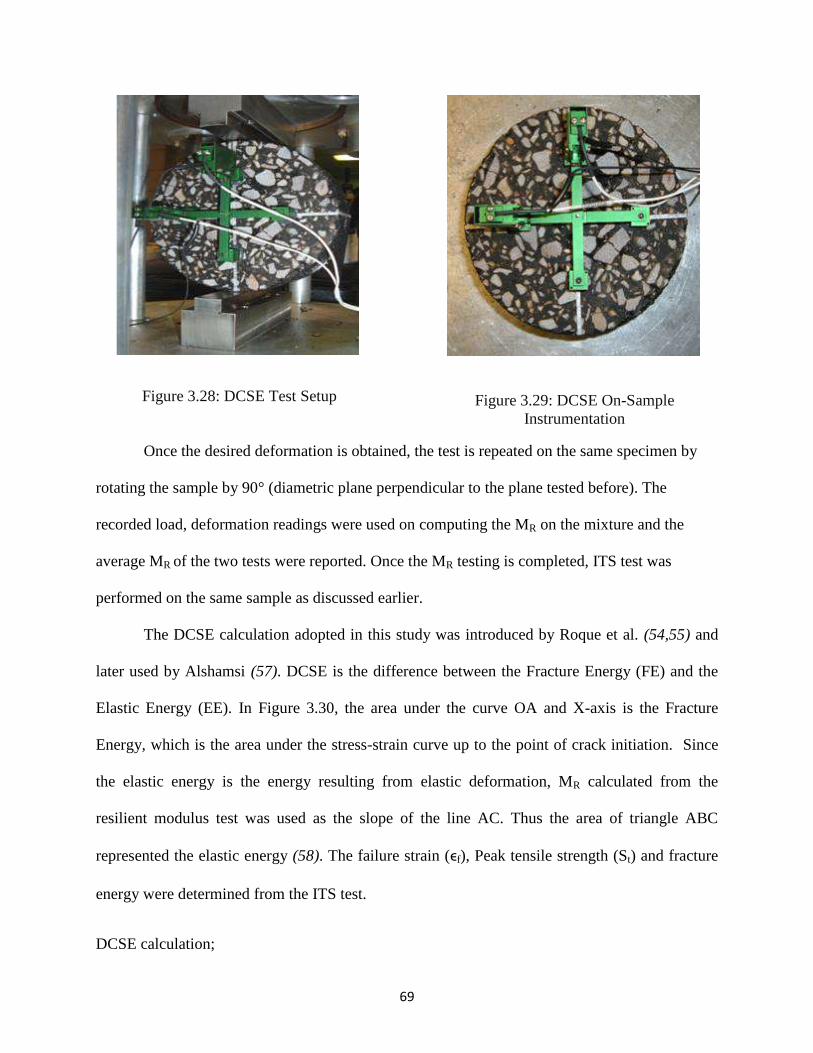
69
Figure 3.28: DCSE Test Setup
Figure 3.29: DCSE On-Sample
Instrumentation
Once the desired deformation is obtained, the test is repeated on the same specimen by
rotating the sample by 90° (diametric plane perpendicular to the plane tested before). The
recorded load, deformation readings were used on computing the MR on the mixture and the
average MR of the two tests were reported. Once the MR testing is completed, ITS test was
performed on the same sample as discussed earlier.
The DCSE calculation adopted in this study was introduced by Roque et al. (54,55) and
later used by Alshamsi (57). DCSE is the difference between the Fracture Energy (FE) and the
Elastic Energy (EE). In Figure 3.30, the area under the curve OA and X-axis is the Fracture
Energy, which is the area under the stress-strain curve up to the point of crack initiation. Since
the elastic energy is the energy resulting from elastic deformation, MR calculated from the
resilient modulus test was used as the slope of the line AC. Thus the area of triangle ABC
represented the elastic energy (58). The failure strain (ϵf), Peak tensile strength (St) and fracture
energy were determined from the ITS test.
DCSE calculation;
70
,
Therefore, ( )
,
Again,
Thus,
.
Figure 3.30: DCSE Calculation Procedure
3.5.2d Beam Fatigue Test
The beam fatigue test was performed to evaluate the fatigue life of asphalt mixtures, in
accordance to AASHTO T 321-07 (59), “Standard Method of Test for Determining the Fatigue
Life of Compacted Hot Mix Asphalt Subjected to Repeated Flexural Bending.” The test was
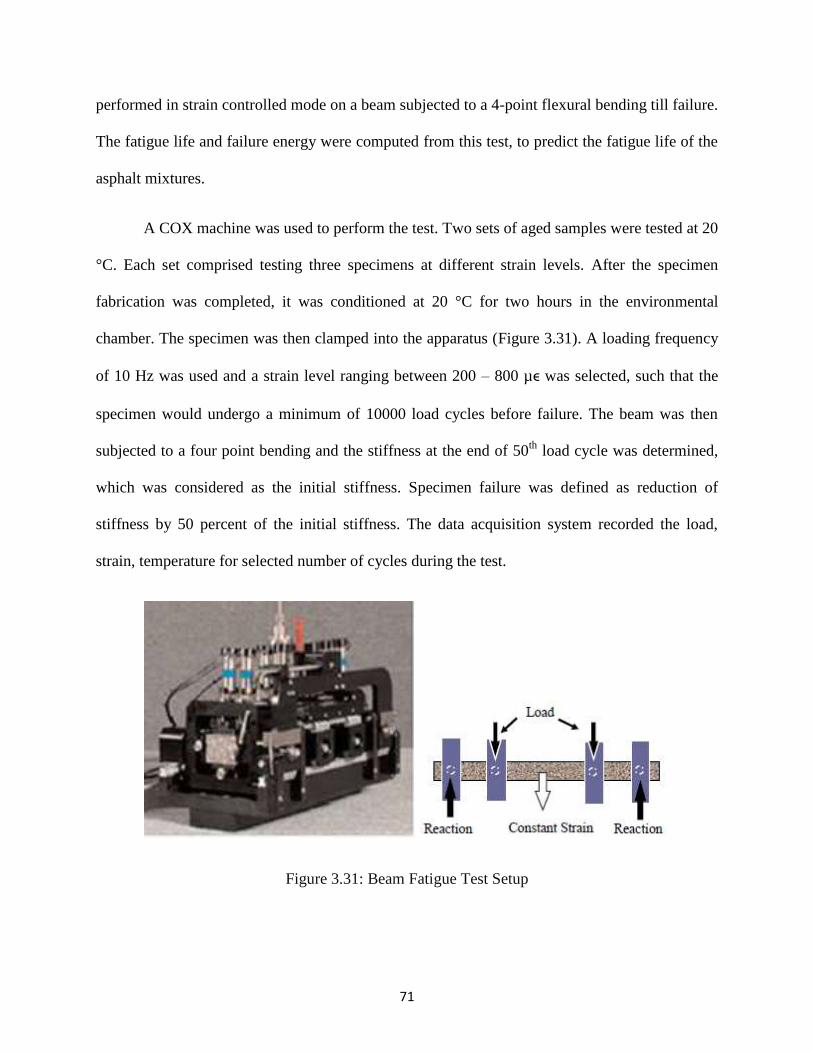
71
performed in strain controlled mode on a beam subjected to a 4-point flexural bending till failure.
The fatigue life and failure energy were computed from this test, to predict the fatigue life of the
asphalt mixtures.
A COX machine was used to perform the test. Two sets of aged samples were tested at 20
°C. Each set comprised testing three specimens at different strain levels. After the specimen
fabrication was completed, it was conditioned at 20 °C for two hours in the environmental
chamber. The specimen was then clamped into the apparatus (Figure 3.31). A loading frequency
of 10 Hz was used and a strain level ranging between 200 – 800 µϵ was selected, such that the
specimen would undergo a minimum of 10000 load cycles before failure. The beam was then
subjected to a four point bending and the stiffness at the end of 50th
load cycle was determined,
which was considered as the initial stiffness. Specimen failure was defined as reduction of
stiffness by 50 percent of the initial stiffness. The data acquisition system recorded the load,
strain, temperature for selected number of cycles during the test.
Figure 3.31: Beam Fatigue Test Setup

72
General computation procedure involved calculating tensile strength and tensile strain at
the peak load. The computations were done according to:
Maximum Tensile Stress (Pa);
Maximum Tensile Strain (m/m);
Flexural Stiffness (Pa);
Also, Phase angle (degrees);
Where,
P = load applied by actuator, N;
b = average specimen width, m;
h = average specimen height, m;
Δ = maximum deflection at the center of beam, m;
a = space between the incised clamps, 0.357/3 m;
L = length of beam between outside clamps, 0.357 m;
f = load frequency, HZ;
s = time lag between Pmax and Δmax, sec.
Figure 3.32 presents the typical output of the test. The modulus is plotted against the
cycles for all the different micro-strain levels adopted.
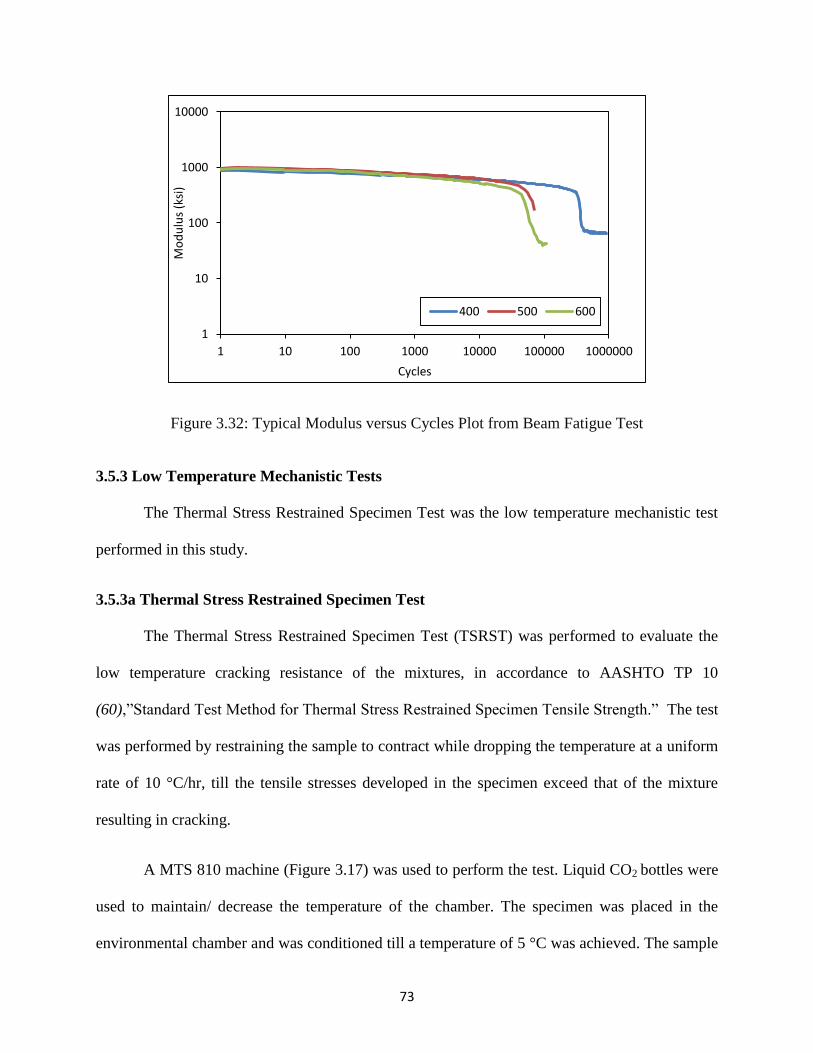
73
Figure 3.32: Typical Modulus versus Cycles Plot from Beam Fatigue Test
3.5.3 Low Temperature Mechanistic Tests
The Thermal Stress Restrained Specimen Test was the low temperature mechanistic test
performed in this study.
3.5.3a Thermal Stress Restrained Specimen Test
The Thermal Stress Restrained Specimen Test (TSRST) was performed to evaluate the
low temperature cracking resistance of the mixtures, in accordance to AASHTO TP 10
(60),”Standard Test Method for Thermal Stress Restrained Specimen Tensile Strength.” The test
was performed by restraining the sample to contract while dropping the temperature at a uniform
rate of 10 °C/hr, till the tensile stresses developed in the specimen exceed that of the mixture
resulting in cracking.
A MTS 810 machine (Figure 3.17) was used to perform the test. Liquid CO2 bottles were
used to maintain/ decrease the temperature of the chamber. The specimen was placed in the
environmental chamber and was conditioned till a temperature of 5 °C was achieved. The sample
1
10
100
1000
10000
1 10 100 1000 10000 100000 1000000
Mo
du
lus
(ksi
)
Cycles
400 500 600
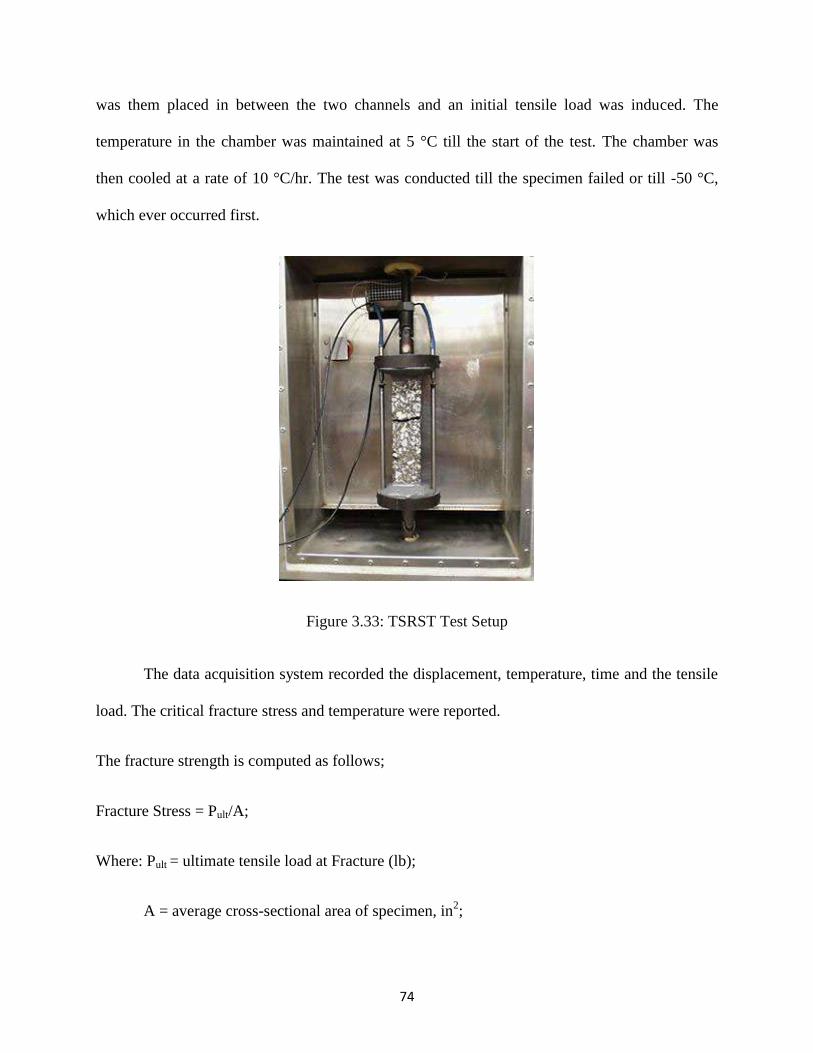
74
was them placed in between the two channels and an initial tensile load was induced. The
temperature in the chamber was maintained at 5 °C till the start of the test. The chamber was
then cooled at a rate of 10 °C/hr. The test was conducted till the specimen failed or till -50 °C,
which ever occurred first.
Figure 3.33: TSRST Test Setup
The data acquisition system recorded the displacement, temperature, time and the tensile
load. The critical fracture stress and temperature were reported.
The fracture strength is computed as follows;
Fracture Stress = Pult/A;
Where: Pult = ultimate tensile load at Fracture (lb);
A = average cross-sectional area of specimen, in2;
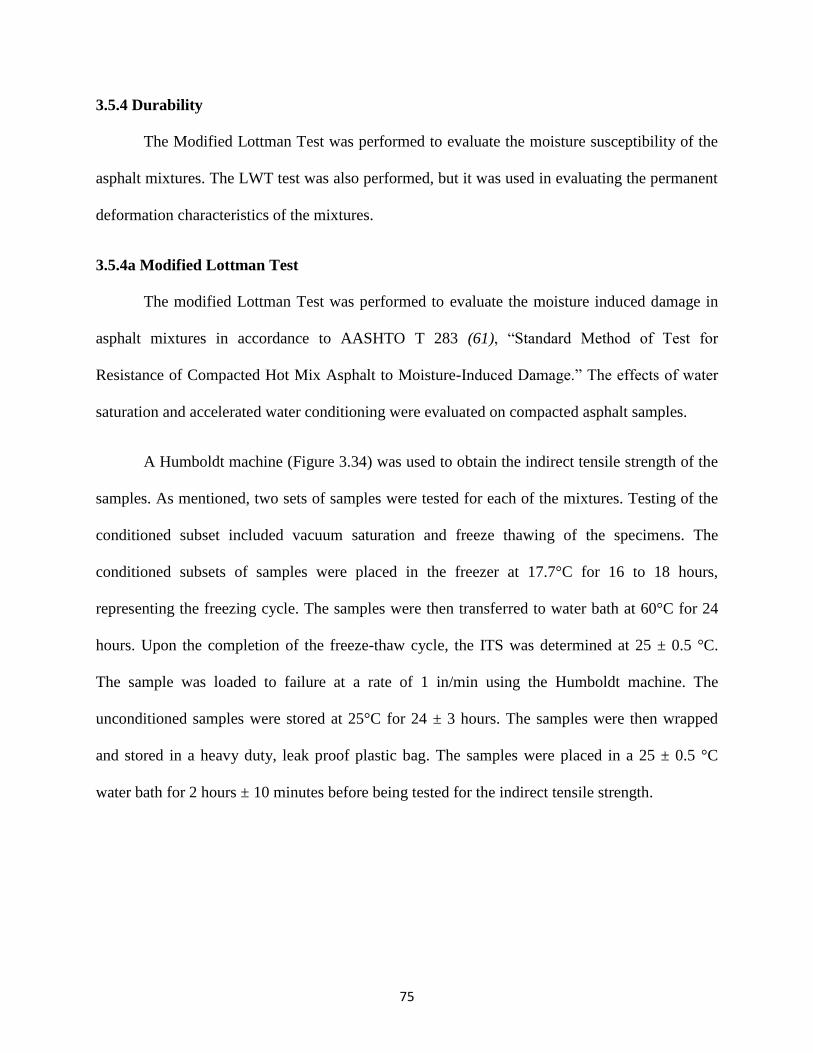
75
3.5.4 Durability
The Modified Lottman Test was performed to evaluate the moisture susceptibility of the
asphalt mixtures. The LWT test was also performed, but it was used in evaluating the permanent
deformation characteristics of the mixtures.
3.5.4a Modified Lottman Test
The modified Lottman Test was performed to evaluate the moisture induced damage in
asphalt mixtures in accordance to AASHTO T 283 (61), “Standard Method of Test for
Resistance of Compacted Hot Mix Asphalt to Moisture-Induced Damage.” The effects of water
saturation and accelerated water conditioning were evaluated on compacted asphalt samples.
A Humboldt machine (Figure 3.34) was used to obtain the indirect tensile strength of the
samples. As mentioned, two sets of samples were tested for each of the mixtures. Testing of the
conditioned subset included vacuum saturation and freeze thawing of the specimens. The
conditioned subsets of samples were placed in the freezer at 17.7°C for 16 to 18 hours,
representing the freezing cycle. The samples were then transferred to water bath at 60°C for 24
hours. Upon the completion of the freeze-thaw cycle, the ITS was determined at 25 ± 0.5 °C.
The sample was loaded to failure at a rate of 1 in/min using the Humboldt machine. The
unconditioned samples were stored at 25°C for 24 ± 3 hours. The samples were then wrapped
and stored in a heavy duty, leak proof plastic bag. The samples were placed in a 25 ± 0.5 °C
water bath for 2 hours ± 10 minutes before being tested for the indirect tensile strength.
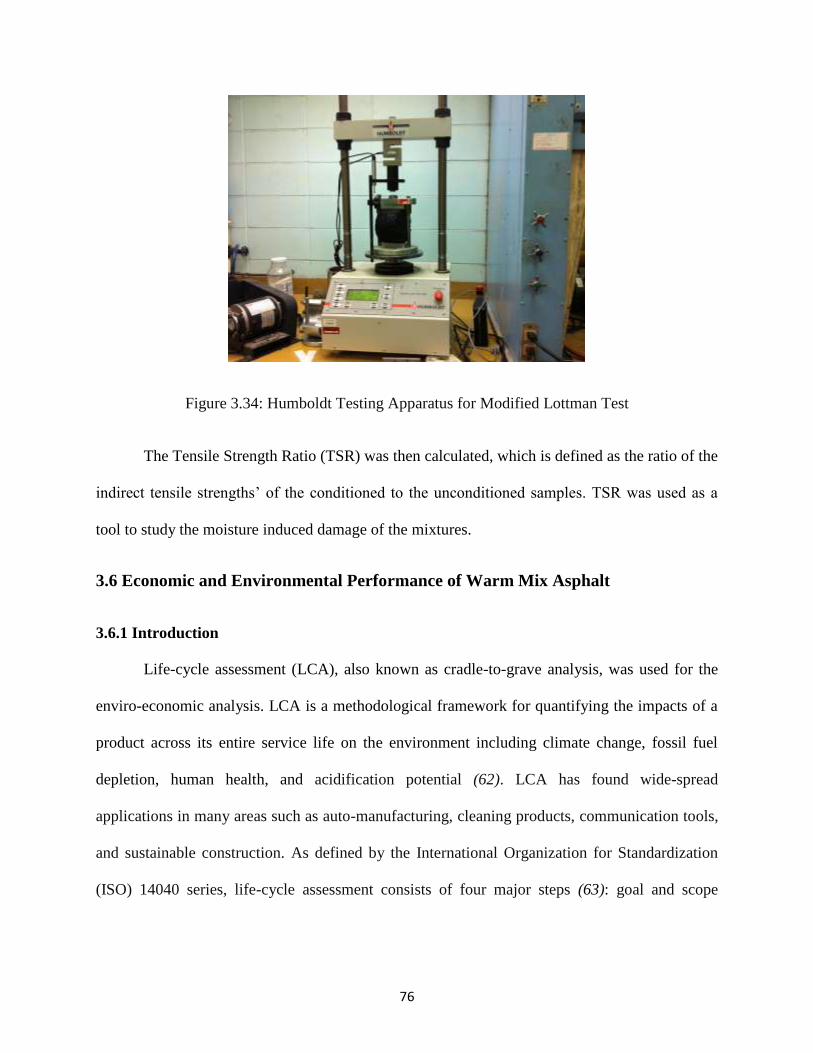
76
Figure 3.34: Humboldt Testing Apparatus for Modified Lottman Test
The Tensile Strength Ratio (TSR) was then calculated, which is defined as the ratio of the
indirect tensile strengths’ of the conditioned to the unconditioned samples. TSR was used as a
tool to study the moisture induced damage of the mixtures.
3.6 Economic and Environmental Performance of Warm Mix Asphalt
3.6.1 Introduction
Life-cycle assessment (LCA), also known as cradle-to-grave analysis, was used for the
enviro-economic analysis. LCA is a methodological framework for quantifying the impacts of a
product across its entire service life on the environment including climate change, fossil fuel
depletion, human health, and acidification potential (62). LCA has found wide-spread
applications in many areas such as auto-manufacturing, cleaning products, communication tools,
and sustainable construction. As defined by the International Organization for Standardization
(ISO) 14040 series, life-cycle assessment consists of four major steps (63): goal and scope
77
definition, life cycle inventory (LCI), life-cycle impact assessment (LCIA), and life-cycle
interpretation (64).
1. Goal and scope definition, which provides a description of the system in terms
of its boundaries and selection of a functional unit. The functional unit provides the basis of
comparison between alternative products.
2. Life cycle inventory (LCI), which estimates the consumption of resources and
the quantities of waste and emission associated with the production of the functional unit and its
different components.
3. Life-cycle impact assessment (LCIA), which evaluates the impact of the product
life-cycle in terms of selected impact categories. This may include factors such as global
warming potential, fossil fuel depletion, impact on human health, and smog potential.
4. Life cycle interpretation, which evaluates the results of LCIA by comparing the
performance scores for all impact categories. In this study, interpretation will be conducted based
on a combined environmental and economic performance approach.
Robinette and Epps utilized LCA to evaluate the environmental impacts of sustainable
technologies including WMA (65). Energy and emissions data were collected from various
sources including a program known as Pavement Life-cycle Assessment Tool for Environmental
and Economic Effects (PaLATE). Results showed that sustainable activities including WMA can
reduce energy consumptions and emission generations.
A LCI was developed for warm mix asphalt mixtures to provide a compilation of the
energy requirements, material inputs, and the emissions associated with its production and
installation. The functional unit considered was 1 metric ton of WMA placed. The developed
LCI considers energy and emissions associated with the manufacturing of asphalt binder,
78
production of aggregate, plant operations, and HMA placement. The in-service emissions were
acquired from previous research and literature and were used in developing LCI. Also, the
emissions of CO, CO2 were only measured. Emissions related to other toxic gases were obtained
from previous research studies. The use phase was excluded from the analysis. Compilation of
the required raw data was conducted manually and an LCIA was conducted based on the
Building for Environmental and Economic Sustainability (BEES) 4.0 model. It should also be
noted that the presented LCIA neglected the environmental impacts of the WMA additives, given
their small masses as compared to the functional unit considered in the analysis. Energy
consumption and energy saving data reported are based on surveying asphalt plants in Louisiana.
A wide range of published reports and databases were reviewed to identify emission data for
each process and activity. A review of literature was conducted to quantify the emission benefits
of WMA (64,66).
3.6.2 Environmental Performance of WMA
Carbon monoxide (CO) is a toxic gas that contributes to ground level ozone and to smog
formation. Carbon dioxide (CO2) is a greenhouse gas, which absorbs and emits infrared
radiation, causing global warming. To evaluate the environmental benefits of WMA, CO and
CO2 emissions were monitored and quantified during the production and placement of two
additional WMA field projects to the ones reported in Table 3.1. The first field project utilized
mixtures containing two WMA technologies, namely, Foaming and Sasobit additive. The second
field project consisted of a conventional HMA mixture. A portable Fluke-975V® air quality
analyzer device with a CO monitoring range from 0 to 500 ppm and a CO2 monitoring range
from 0 to 5000 ppm was used. CO and CO2 emissions were monitored during the following
production and placement activities, Figure 3.35, at exit of the mixture drum, during truck
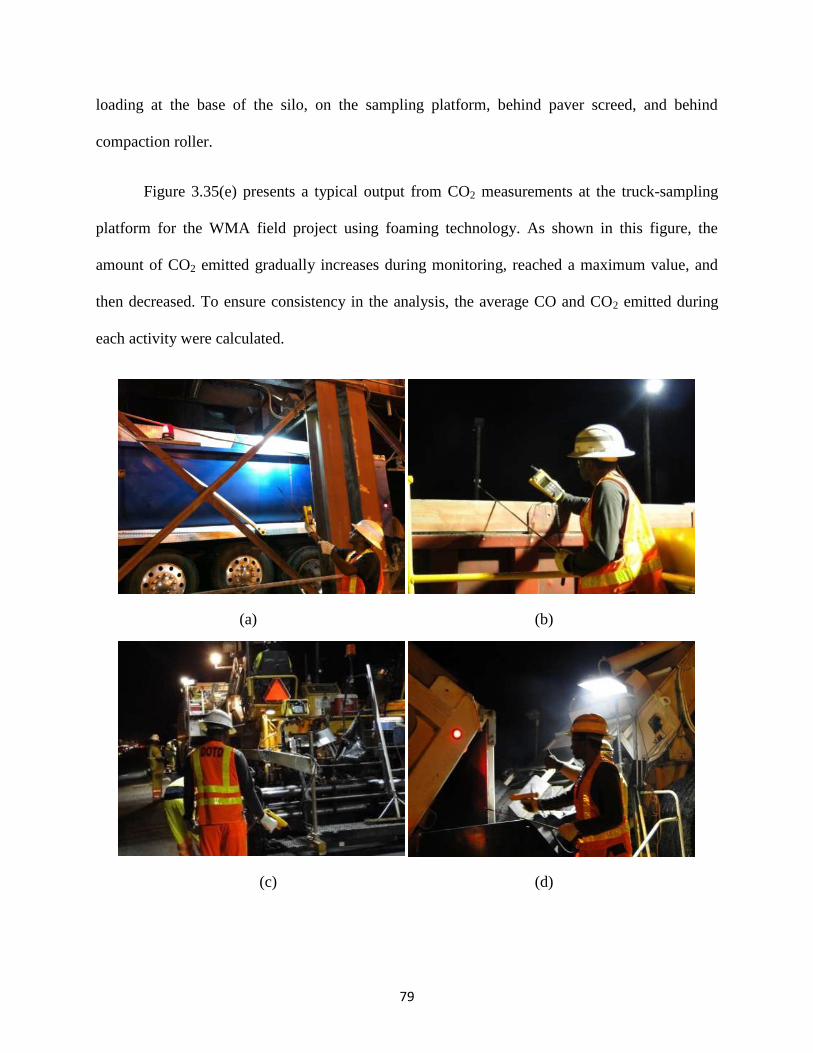
79
loading at the base of the silo, on the sampling platform, behind paver screed, and behind
compaction roller.
Figure 3.35(e) presents a typical output from CO2 measurements at the truck-sampling
platform for the WMA field project using foaming technology. As shown in this figure, the
amount of CO2 emitted gradually increases during monitoring, reached a maximum value, and
then decreased. To ensure consistency in the analysis, the average CO and CO2 emitted during
each activity were calculated.
(a) (b)
(c) (d)
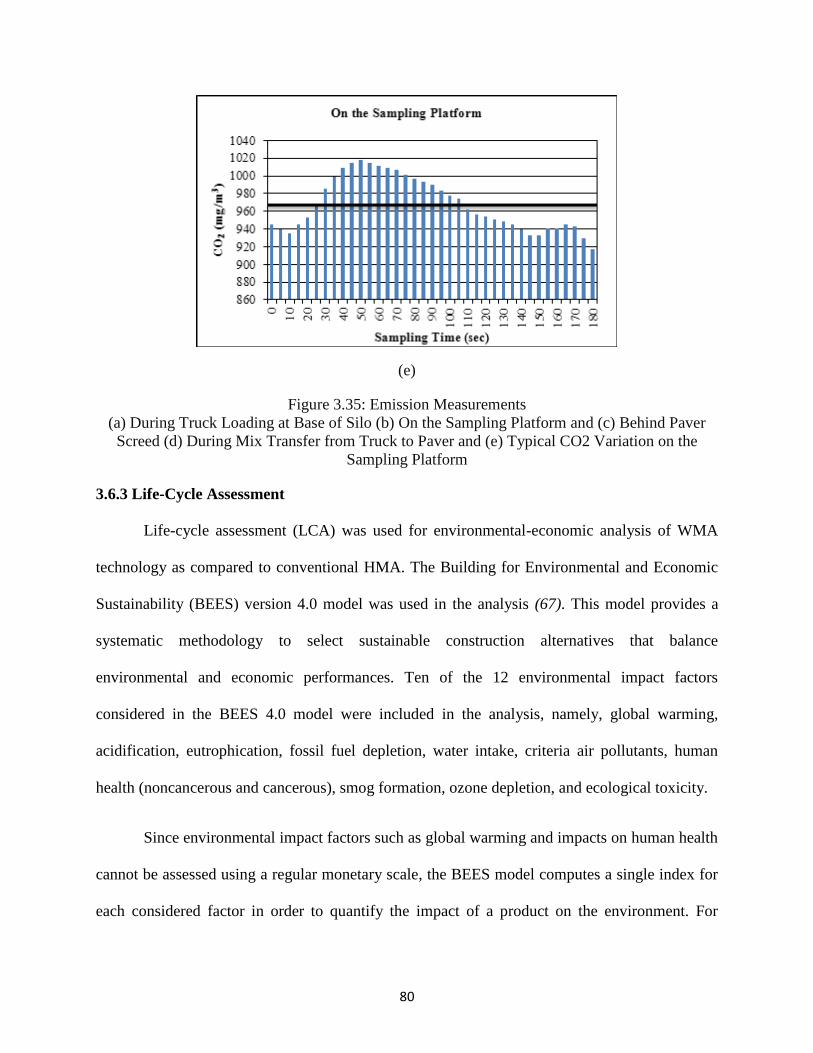
80
(e)
Figure 3.35: Emission Measurements
(a) During Truck Loading at Base of Silo (b) On the Sampling Platform and (c) Behind Paver
Screed (d) During Mix Transfer from Truck to Paver and (e) Typical CO2 Variation on the
Sampling Platform
3.6.3 Life-Cycle Assessment
Life-cycle assessment (LCA) was used for environmental-economic analysis of WMA
technology as compared to conventional HMA. The Building for Environmental and Economic
Sustainability (BEES) version 4.0 model was used in the analysis (67). This model provides a
systematic methodology to select sustainable construction alternatives that balance
environmental and economic performances. Ten of the 12 environmental impact factors
considered in the BEES 4.0 model were included in the analysis, namely, global warming,
acidification, eutrophication, fossil fuel depletion, water intake, criteria air pollutants, human
health (noncancerous and cancerous), smog formation, ozone depletion, and ecological toxicity.
Since environmental impact factors such as global warming and impacts on human health
cannot be assessed using a regular monetary scale, the BEES model computes a single index for
each considered factor in order to quantify the impact of a product on the environment. For
81
instance, global warming is expressed in grams of carbon dioxide produced per functional unit of
a product. The global warming index is calculated based on the following relation:
Global Warming Index = ∑i mi x GWPi
Where,
mi = mass (in grams) of emission i per functional unit; and
GWPi = conversion factor from one gram of emission i to its equivalent of carbon dioxide.
Equivalency factors are provided by the BEES model based on research conducted by the
U.S. Environmental Protection Agency (EPA). An LCI was developed for WMA mixtures to
provide a compilation of the energy requirements, material inputs, and the emissions associated
with its production and installation. A wide range of published reports and databases were
reviewed to collect emission data for each process and activity used in WMA (64,66). The
functional unit considered was 1 ton of WMA placed. The LCI considered energy and emissions
associated with the manufacturing of asphalt binder, production of aggregate, plant operations,
and mixture placement. However, the in-service use phase was excluded from the analysis.
Compilation of the required raw data was conducted manually and an LCIA was conducted
based on the BEES model. The presented LCIA neglected the environmental impacts of the
WMA additives, given their small masses compared to the functional unit considered in the
analysis.
3.6.4 Cost and Energy Savings
The reduction in energy consumption for WMA production was surveyed from the three
asphalt plants, which produced the mixtures for this study. Data collection included the type of

82
fuel used for the project, energy consumption for the production and placement of the asphalt
mixtures. The survey data were used to calculate the overall cost per ton of HMA and WMA,
respectively, and to determine the energy cost savings due to WMA

83
CHAPTER 4 : DISCUSSION OF RESULTS
4.1 Introduction
The results obtained from the mechanistic performance tests are analyzed and presented
in this chapter. The analysis was designed to assess the performance of WMA mixtures with that
of the control HMA mixtures evaluated in the study. Alongside, the effect of the WMA
technology adopted was also studied. Incorporation of higher percentages of RAP into WMA
mixtures was also evaluated. Several statistical analyses were utilized to statistically compare
and rank the performance of WMA mixtures with that of control HMA mixtures. Normalized
results are presented to better understand the results, and to draw comparisons between different
WMA mixes across the three projects considered. The mechanistic results are normalized by
dividing the performance parameter of a mix by the performance parameter of the corresponding
HMA within the project. Hence, all the HMA mixes have a value of 1.0 in the normalized
graphs. However, depending on the property evaluated, a higher or lower value is desired. The
mixtures evaluated in this study were abbreviated as follows:
70CO1: Conventional HMA mixture with 15% RAP and PG70-22M asphalt binder.
70W15E: WMA mixture with 15% RAP and PG70-22M asphalt binder, and Evotherm.
70W30E: WMA mixture with 30% RAP and PG70-22M asphalt binder, and Evotherm.
70CO2: Conventional HMA mixture with 15% RAP and PG70-22M asphalt binder.
70W15F: WMA mixture with 15% RAP and PG70-22M asphalt binder, and Foaming.
70W30F: WMA mixture with 30% RAP and PG70-22M asphalt binder, and Foaming.
70W15R: WMA mixture with 30% RAP and PG70-22M asphalt binder, and Rediset.
70CO3: Conventional HMA mixture with 15% RAP and PG70-22M asphalt binder.
84
70W15L: WMA mixture with 15% RAP and PG70-22M asphalt binder, Latex and
Foaming.
70CO4: Conventional HMA mixture with 20% RAP and PG70-22M asphalt binder.
70W20L: WMA mixture with 20% RAP and PG70-22M asphalt binder, Latex and
Foaming.
4.2 Statistical Analysis
Statistical analyses were conducted on the performance characteristics derived from the
mechanistic tests accomplished in this study. A Statistical Analysis Program (SAS) version 9.0
for Windows operating system was used for the analyses. The mean values of the performance
characteristics obtained from mechanistic testing for triplicate specimens were used in the
analyses. Analysis of Variance (ANOVA) with Least Significant Difference (LSD) option and
pair wise t-test were performed to draw comparisons between the performance of the WMA
mixtures and the control HMA mixtures. A Type I error rate (α) of 0.05 was used to differentiate
any significant difference between the mixtures in consideration. In other words, if the analysis
reported any significant difference, 95.0 % of the time there will be a difference in the entities in
comparison. These analyses were used to rank the asphalt mixtures accordingly. The statistical
rankings obtained by each mixture were designated by letters A, B, and C, with ‘A’ assigned to
the best performing mixture, followed by B and C. Mixtures that met the specification
requirements for the test were assigned a ranking of A, even if it was significantly different from
other mixes.
85
4.3 Mixture Characterization Test Results
Permanent deformation (rutting), Fatigue/Fracture cracking and Low temperature
cracking were the three major distress conditions considered in the evaluation of the mixtures.
Results obtained from |E*|, FN and LWT tests were used to assess the high temperature
performance of the mixtures. Results from ITS, DCSE, SCB, |E*|, Beam Fatigue were used to
assess the intermediate temperature performance of the mixtures. Test results from TSRST were
employed in evaluating the low temperature performance of the mixtures, while the modified
Lottman test results were used in evaluating the moisture induced damage for the mixtures.
4.3.1 High Temperature Mechanistic Tests
4.3.1.1 Dynamic Modulus Test Results
The axial dynamic modulus (|E*|) test was conducted on three replicate samples for each
mixture to evaluate the visco-elastic behavior of the asphalt mixtures. The test was performed at
five temperatures (i.e., 10, 4.4, 25, 37.8 and 54.4ºC) and six frequencies (i.e., 25, 10, 5, 1, 0.5 and
0.1 Hz). Two properties, E* and phase angle (δ) were obtained from this test. Figures 4.1
through 4.5 present the mean E* isotherms for all the eleven mixtures, at all temperatures and
frequencies adopted in the study. In general, the E* increased with increase in frequency and
decreased with increasing temperature. At low temperatures (-10°C and 4.4°C) the E* isotherms
followed a linear pattern, indicating behavior of a mixture in linear viscoelastic region. However,
at other temperatures (25°C, 37.8°C and 54.4°C) the isotherms did not follow a linear trend, but
rather a polynomial shape. This non-linear response of the mixtures may be attributed to the
viscous effect of the binder at elevated temperatures.
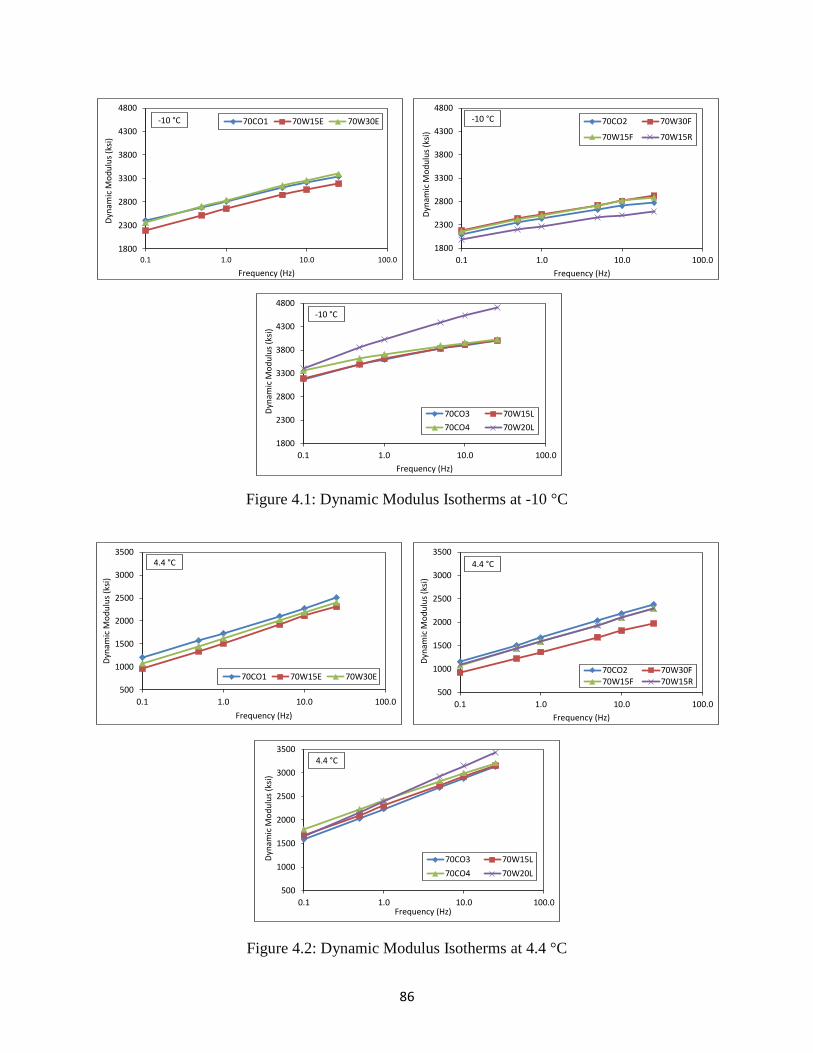
86
Figure 4.1: Dynamic Modulus Isotherms at -10 °C
Figure 4.2: Dynamic Modulus Isotherms at 4.4 °C
1800
2300
2800
3300
3800
4300
4800
0.1 1.0 10.0 100.0
Dyn
amic
Mo
du
lus
(ksi
)
Frequency (Hz)
70CO1 70W15E 70W30E-10 °C
1800
2300
2800
3300
3800
4300
4800
0.1 1.0 10.0 100.0
Dyn
amic
Mo
du
lus
(ksi
)
Frequency (Hz)
70CO2 70W30F
70W15F 70W15R
-10 °C
1800
2300
2800
3300
3800
4300
4800
0.1 1.0 10.0 100.0
Dyn
amic
Mo
du
lus
(ksi
)
Frequency (Hz)
70CO3 70W15L
70CO4 70W20L
-10 °C
500
1000
1500
2000
2500
3000
3500
0.1 1.0 10.0 100.0
Dyn
amic
Mo
du
lus
(ksi
)
Frequency (Hz)
70CO1 70W15E 70W30E
4.4 °C
500
1000
1500
2000
2500
3000
3500
0.1 1.0 10.0 100.0
Dyn
amic
Mo
du
lus
(ksi
)
Frequency (Hz)
70CO2 70W30F70W15F 70W15R
4.4 °C
500
1000
1500
2000
2500
3000
3500
0.1 1.0 10.0 100.0
Dyn
amic
Mo
du
lus
(ksi
)
Frequency (Hz)
70CO3 70W15L
70CO4 70W20L
4.4 °C
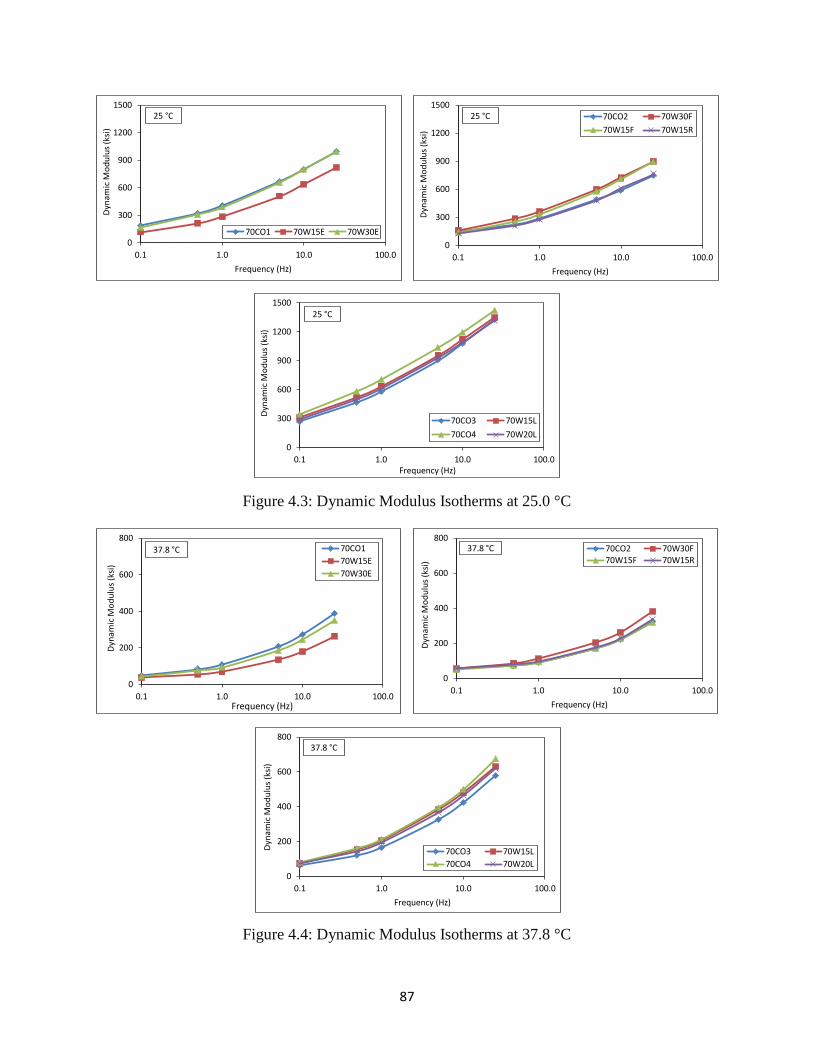
87
Figure 4.3: Dynamic Modulus Isotherms at 25.0 °C
Figure 4.4: Dynamic Modulus Isotherms at 37.8 °C
0
300
600
900
1200
1500
0.1 1.0 10.0 100.0
Dyn
amic
Mo
du
lus
(ksi
)
Frequency (Hz)
70CO1 70W15E 70W30E
25 °C
0
300
600
900
1200
1500
0.1 1.0 10.0 100.0
Dyn
amic
Mo
du
lus
(ksi
)
Frequency (Hz)
70CO2 70W30F
70W15F 70W15R
25 °C
0
300
600
900
1200
1500
0.1 1.0 10.0 100.0
Dyn
amic
Mo
du
lus
(ksi
)
Frequency (Hz)
70CO3 70W15L
70CO4 70W20L
25 °C
0
200
400
600
800
0.1 1.0 10.0 100.0
Dyn
amic
Mo
du
lus
(ksi
)
Frequency (Hz)
70CO1
70W15E
70W30E
37.8 °C
0
200
400
600
800
0.1 1.0 10.0 100.0
Dyn
amic
Mo
du
lus
(ksi
)
Frequency (Hz)
70CO2 70W30F70W15F 70W15R
37.8 °C
0
200
400
600
800
0.1 1.0 10.0 100.0
Dyn
amic
Mo
du
lus
(ksi
)
Frequency (Hz)
70CO3 70W15L
70CO4 70W20L
37.8 °C
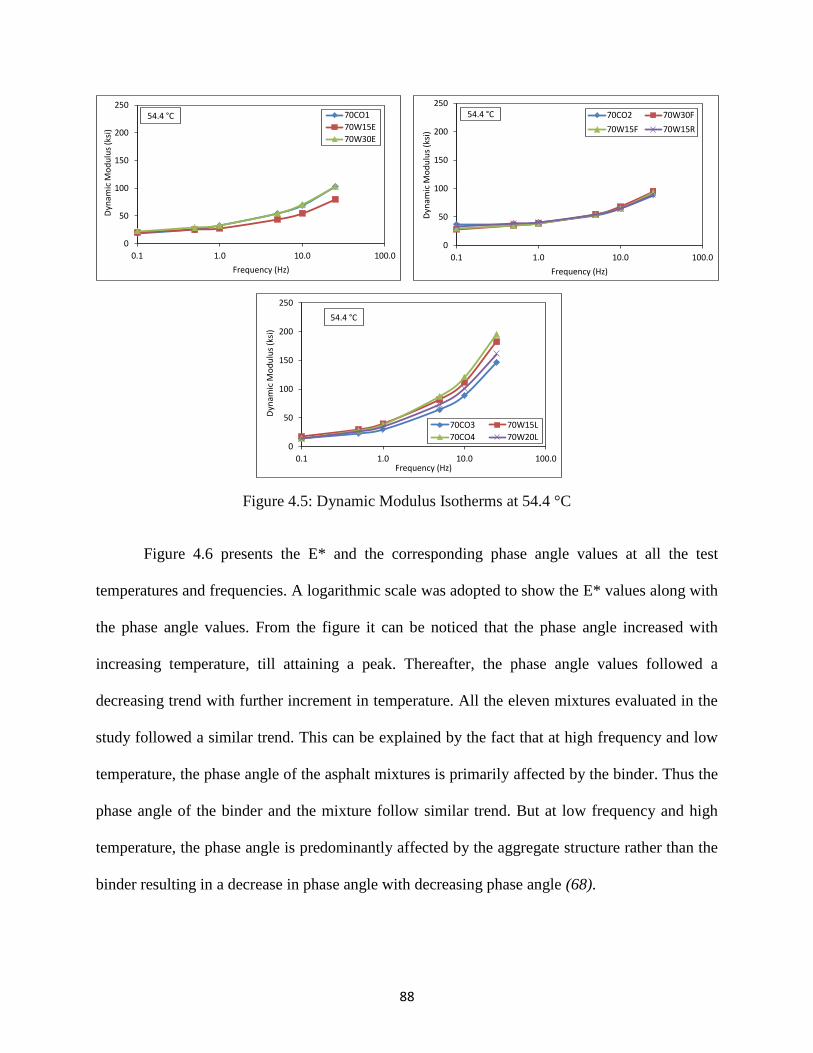
88
Figure 4.5: Dynamic Modulus Isotherms at 54.4 °C
Figure 4.6 presents the E* and the corresponding phase angle values at all the test
temperatures and frequencies. A logarithmic scale was adopted to show the E* values along with
the phase angle values. From the figure it can be noticed that the phase angle increased with
increasing temperature, till attaining a peak. Thereafter, the phase angle values followed a
decreasing trend with further increment in temperature. All the eleven mixtures evaluated in the
study followed a similar trend. This can be explained by the fact that at high frequency and low
temperature, the phase angle of the asphalt mixtures is primarily affected by the binder. Thus the
phase angle of the binder and the mixture follow similar trend. But at low frequency and high
temperature, the phase angle is predominantly affected by the aggregate structure rather than the
binder resulting in a decrease in phase angle with decreasing phase angle (68).
0
50
100
150
200
250
0.1 1.0 10.0 100.0
Dyn
amic
Mo
du
lus
(ksi
)
Frequency (Hz)
70CO1
70W15E
70W30E
54.4 °C
0
50
100
150
200
250
0.1 1.0 10.0 100.0
Dyn
amic
Mo
du
lus
(ksi
)
Frequency (Hz)
70CO2 70W30F
70W15F 70W15R
54.4 °C
0
50
100
150
200
250
0.1 1.0 10.0 100.0
Dyn
amic
Mo
du
lus
(ksi
)
Frequency (Hz)
70CO3 70W15L
70CO4 70W20L
54.4 °C
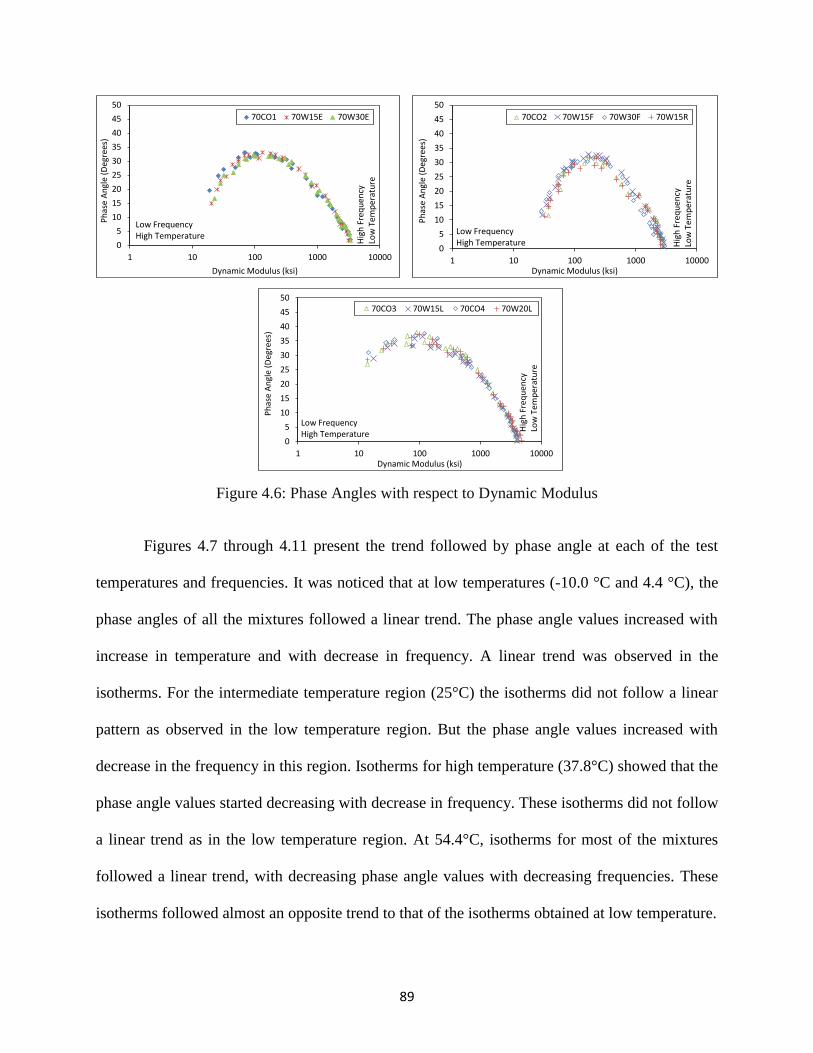
89
Figure 4.6: Phase Angles with respect to Dynamic Modulus
Figures 4.7 through 4.11 present the trend followed by phase angle at each of the test
temperatures and frequencies. It was noticed that at low temperatures (-10.0 °C and 4.4 °C), the
phase angles of all the mixtures followed a linear trend. The phase angle values increased with
increase in temperature and with decrease in frequency. A linear trend was observed in the
isotherms. For the intermediate temperature region (25°C) the isotherms did not follow a linear
pattern as observed in the low temperature region. But the phase angle values increased with
decrease in the frequency in this region. Isotherms for high temperature (37.8°C) showed that the
phase angle values started decreasing with decrease in frequency. These isotherms did not follow
a linear trend as in the low temperature region. At 54.4°C, isotherms for most of the mixtures
followed a linear trend, with decreasing phase angle values with decreasing frequencies. These
isotherms followed almost an opposite trend to that of the isotherms obtained at low temperature.
0
5
10
15
20
25
30
35
40
45
50
1 10 100 1000 10000
Ph
ase
An
gle
(Deg
rees
)
Dynamic Modulus (ksi)
70CO1 70W15E 70W30E
Low Frequency High Temperature
Hig
h F
req
uen
cy
Low
Tem
per
atu
re
0
5
10
15
20
25
30
35
40
45
50
1 10 100 1000 10000
Ph
ase
An
gle
(Deg
rees
)
Dynamic Modulus (ksi)
70CO2 70W15F 70W30F 70W15R
Low Frequency High Temperature H
igh
Fre
qu
ency
Lo
w T
emp
erat
ure
0
5
10
15
20
25
30
35
40
45
50
1 10 100 1000 10000
Ph
ase
An
gle
(D
egr
ee
s)
Dynamic Modulus (ksi)
70CO3 70W15L 70CO4 70W20L
Low Frequency High Temperature
Hig
h F
req
ue
ncy
Lo
w T
em
pe
ratu
re
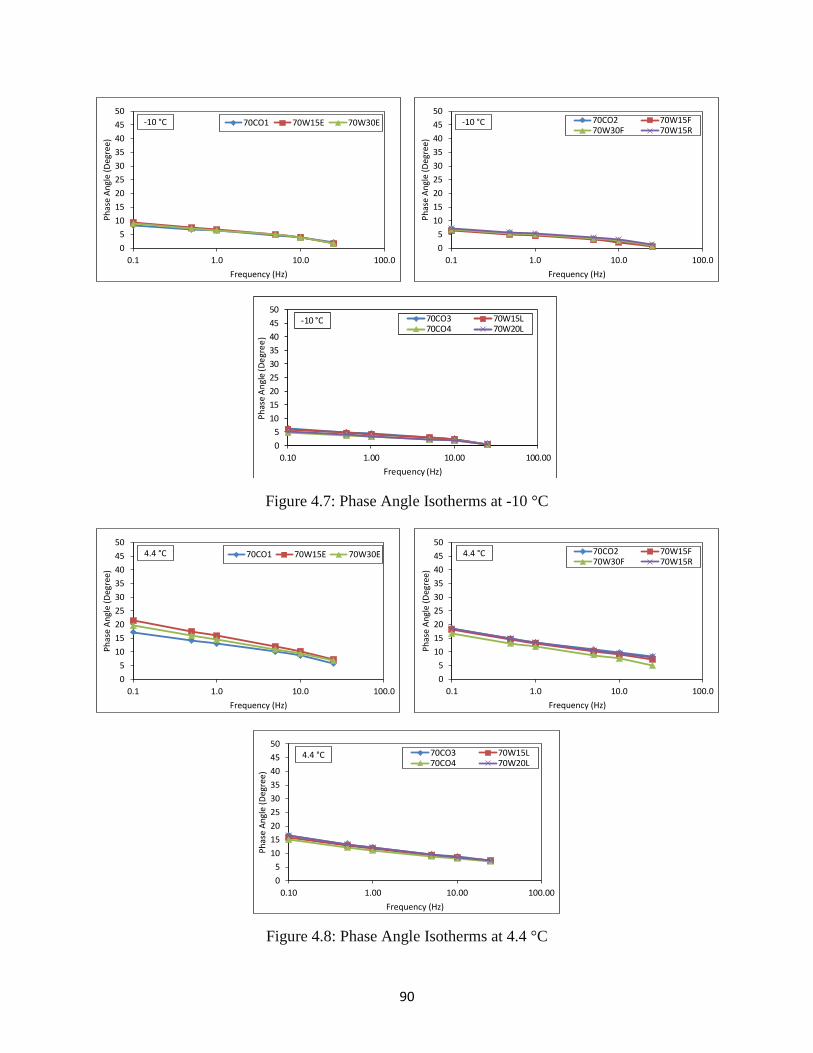
90
Figure 4.7: Phase Angle Isotherms at -10 °C
Figure 4.8: Phase Angle Isotherms at 4.4 °C
Phase angle at -10c
0
5
10
15
20
25
30
35
40
45
50
0.1 1.0 10.0 100.0
Ph
ase
An
gle
(Deg
ree)
Frequency (Hz)
70CO1 70W15E 70W30E-10 °C
0
5
10
15
20
25
30
35
40
45
50
0.1 1.0 10.0 100.0
Ph
ase
An
gle
(Deg
ree)
Frequency (Hz)
70CO2 70W15F70W30F 70W15R
-10 °C
0
5
10
15
20
25
30
35
40
45
50
0.10 1.00 10.00 100.00
Ph
ase
An
gle
(De
gre
e)
Frequency (Hz)
70CO3 70W15L70CO4 70W20L
-10 °C
0
5
10
15
20
25
30
35
40
45
50
0.1 1.0 10.0 100.0
Ph
ase
An
gle
(Deg
ree)
Frequency (Hz)
70CO1 70W15E 70W30E4.4 °C
0
5
10
15
20
25
30
35
40
45
50
0.1 1.0 10.0 100.0
Ph
ase
An
gle
(Deg
ree)
Frequency (Hz)
70CO2 70W15F70W30F 70W15R
4.4 °C
0
5
10
15
20
25
30
35
40
45
50
0.10 1.00 10.00 100.00
Ph
ase
An
gle
(Deg
ree)
Frequency (Hz)
70CO3 70W15L70CO4 70W20L
4.4 °C
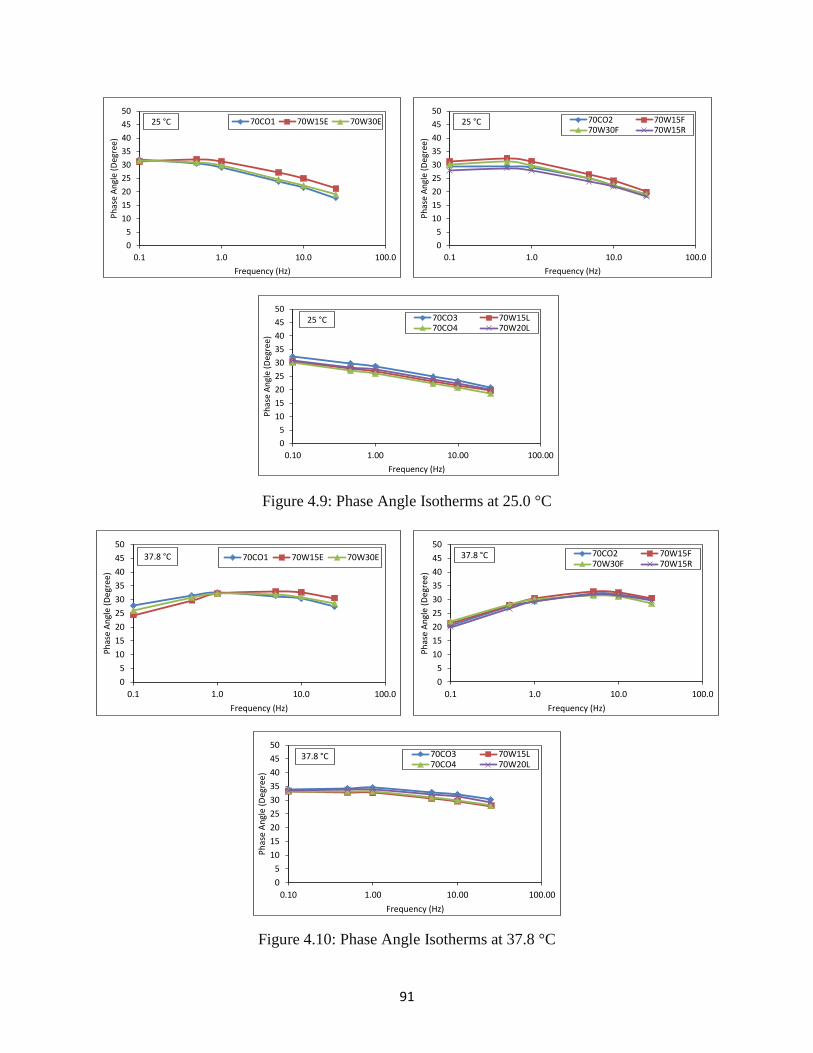
91
Figure 4.9: Phase Angle Isotherms at 25.0 °C
Figure 4.10: Phase Angle Isotherms at 37.8 °C
0
5
10
15
20
25
30
35
40
45
50
0.1 1.0 10.0 100.0
Ph
ase
An
gle
(Deg
ree)
Frequency (Hz)
70CO1 70W15E 70W30E25 °C
0
5
10
15
20
25
30
35
40
45
50
0.1 1.0 10.0 100.0
Ph
ase
An
gle
(Deg
ree)
Frequency (Hz)
70CO2 70W15F70W30F 70W15R
25 °C
0
5
10
15
20
25
30
35
40
45
50
0.10 1.00 10.00 100.00
Ph
ase
An
gle
(Deg
ree)
Frequency (Hz)
70CO3 70W15L70CO4 70W20L
25 °C
Phase angle at 38c
0
5
10
15
20
25
30
35
40
45
50
0.1 1.0 10.0 100.0
Ph
ase
An
gle
(Deg
ree)
Frequency (Hz)
70CO1 70W15E 70W30E37.8 °C
0
5
10
15
20
25
30
35
40
45
50
0.1 1.0 10.0 100.0
Ph
ase
An
gle
(Deg
ree)
Frequency (Hz)
70CO2 70W15F70W30F 70W15R
37.8 °C
0
5
10
15
20
25
30
35
40
45
50
0.10 1.00 10.00 100.00
Ph
ase
An
gle
(Deg
ree)
Frequency (Hz)
70CO3 70W15L70CO4 70W20L
37.8 °C
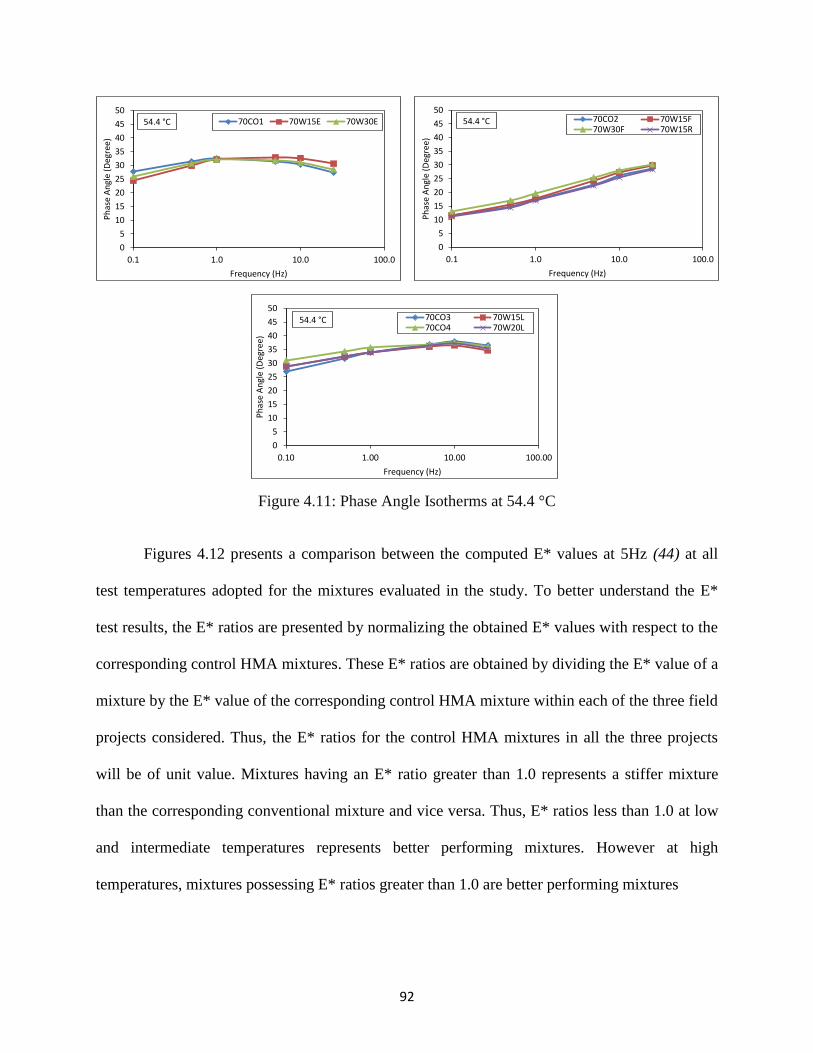
92
Figure 4.11: Phase Angle Isotherms at 54.4 °C
Figures 4.12 presents a comparison between the computed E* values at 5Hz (44) at all
test temperatures adopted for the mixtures evaluated in the study. To better understand the E*
test results, the E* ratios are presented by normalizing the obtained E* values with respect to the
corresponding control HMA mixtures. These E* ratios are obtained by dividing the E* value of a
mixture by the E* value of the corresponding control HMA mixture within each of the three field
projects considered. Thus, the E* ratios for the control HMA mixtures in all the three projects
will be of unit value. Mixtures having an E* ratio greater than 1.0 represents a stiffer mixture
than the corresponding conventional mixture and vice versa. Thus, E* ratios less than 1.0 at low
and intermediate temperatures represents better performing mixtures. However at high
temperatures, mixtures possessing E* ratios greater than 1.0 are better performing mixtures
0
5
10
15
20
25
30
35
40
45
50
0.1 1.0 10.0 100.0
Ph
ase
An
gle
(Deg
ree)
Frequency (Hz)
70CO1 70W15E 70W30E54.4 °C
0
5
10
15
20
25
30
35
40
45
50
0.1 1.0 10.0 100.0
Ph
ase
An
gle
(Deg
ree)
Frequency (Hz)
70CO2 70W15F70W30F 70W15R
54.4 °C
0
5
10
15
20
25
30
35
40
45
50
0.10 1.00 10.00 100.00
Ph
ase
An
gle
(Deg
ree)
Frequency (Hz)
70CO3 70W15L70CO4 70W20L
54.4 °C
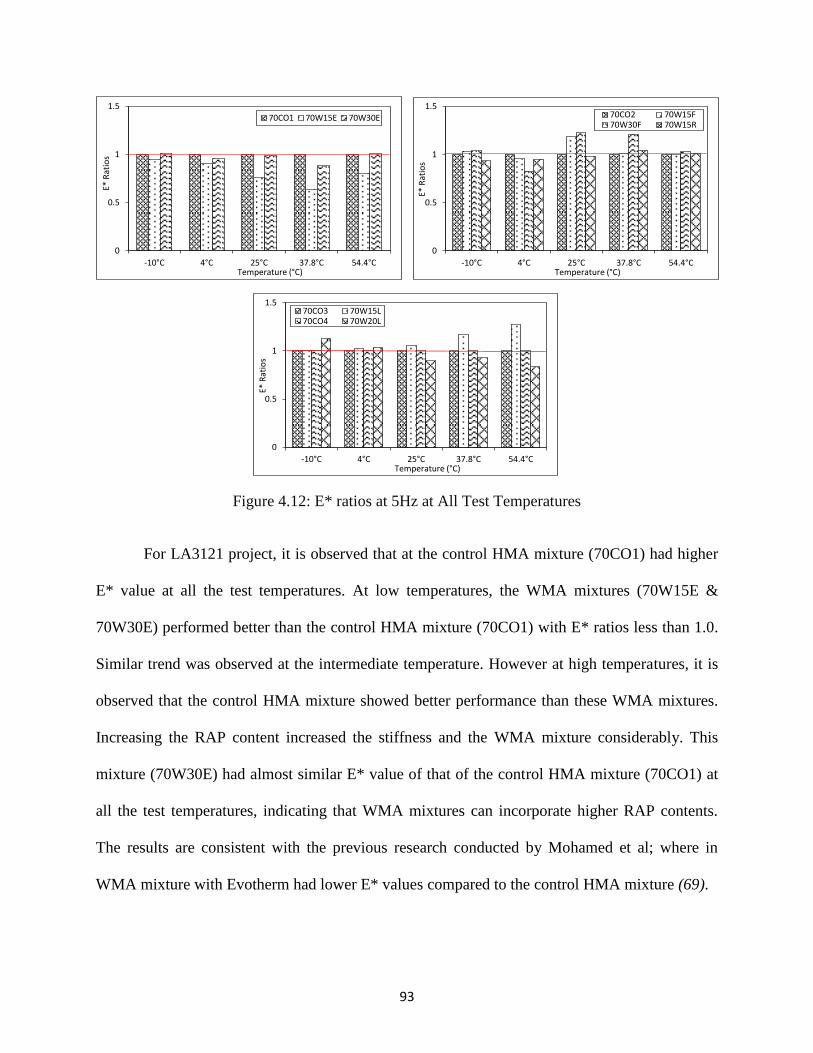
93
Figure 4.12: E* ratios at 5Hz at All Test Temperatures
For LA3121 project, it is observed that at the control HMA mixture (70CO1) had higher
E* value at all the test temperatures. At low temperatures, the WMA mixtures (70W15E &
70W30E) performed better than the control HMA mixture (70CO1) with E* ratios less than 1.0.
Similar trend was observed at the intermediate temperature. However at high temperatures, it is
observed that the control HMA mixture showed better performance than these WMA mixtures.
Increasing the RAP content increased the stiffness and the WMA mixture considerably. This
mixture (70W30E) had almost similar E* value of that of the control HMA mixture (70CO1) at
all the test temperatures, indicating that WMA mixtures can incorporate higher RAP contents.
The results are consistent with the previous research conducted by Mohamed et al; where in
WMA mixture with Evotherm had lower E* values compared to the control HMA mixture (69).
0
0.5
1
1.5
-10°C 4°C 25°C 37.8°C 54.4°C
E* R
atio
s
Temperature (°C)
70CO1 70W15E 70W30E
0
0.5
1
1.5
-10°C 4°C 25°C 37.8°C 54.4°C
E* R
atio
s
Temperature (°C)
70CO2 70W15F70W30F 70W15R
0
0.5
1
1.5
-10°C 4°C 25°C 37.8°C 54.4°C
E* R
atio
s
Temperature (°C)
70CO3 70W15L70CO4 70W20L
94
For US171 project, it is observed that the WMA mixtures were stiffer than the control
HMA mixture at intermediate and high temperatures. At low temperatures (-10°C & 4.4°C), the
WMA mixtures had E* ratios less than 1.0, indicating a better performance at these
temperatures. At high temperatures (37.8°C & 54.4°C), all the WMA mixtures had ratios greater
than 1.0, representing better performing performance. Foaming of mixtures seemed to improve
the performance of the mixtures, at low and high temperatures. However at intermediate
temperature, foaming seemed to stiffen the mixture, increasing the concern for fatigue cracking.
WMA mixture with Rediset additive had the best performance among the WMA mixtures. The
Resdiset additive improved the performance of the mixture at all the temperatures. Increase in
the RAP content did not yield significant increase in E* values, as observed in LA3121 project.
For LA116 project, it is observed that the WMA mixture with 15% RAP (70W15L)
showed better performance than that of the control HMA mixture (70CO3) at all the test
temperatures. At low temperatures the E* ratio of the mix was less than 1.0 (or just over 1.0),
whereas at high temperatures, it was higher than 1.0. At intermediate temperature, the control
HMA mixture showed better performance. The WMA mixture with increased RAP (70W20L)
content was outperformed by its control mixture (70CO4) at all the test temperatures.
Research conducted by Prowell et al (70) on foamed mixtures yielded similar results,
where in similar E* values were observed between WMA and HMA mixtures.
4.3.1.1a Development of Master Curves
Master curves were developed from the dynamic modulus test results at all temperatures
and frequencies for all the eleven mixtures evaluated, using the time-temperature superposition
principle. According to this principle, for the viscoelastic materials tested in the linear
95
viscoelastic region, the time of loading and the temperature of loading are interchangeable. In
general, the E* values obtained at lower frequencies (longer loading times) are considered to
represent E* values obtained at higher temperature; and the E* values obtained at higher
frequencies (shorter loading times) are considered to represent the E* values at low temperatures.
The master curve can be described using a sigmoidal function shown below.
log (|E*|) = δ + )(log
1 rte
where:
|E*| = dynamic modulus
tr = time of loading at reference temperature
δ = minimum value of E*
δ+ = maximum value of E*
β, γ = parameters describing the shape of the sigmoidal function.
The master curves were constructed using the Mechanical Empirical Pavement Design
Guide (MEPDG) software version 9.1.0. A standard reference temperature of 77°F (25°C) was
used in constructing the master curves. The E* and phase angle values from the test results were
given as the input to the MEPDG software to shift the data at different temperatures with respect
to time, till a single smooth curve is formed. Also, the curve model parameters and the
temperature shift parameters were computed by the MEPDG software to describe the viscoelastic
behavior of the asphalt mixtures.
Figure 4.13 represents the E* master curves for all the mixtures evaluated in the study,
grouped by corresponding field projects. In this figure, the upper bound of the sigmoidal curve
96
represents the shorter loading times (low temperature performance); whereas, the lower bound
of the sigmoidal curve represent the more critical longer loading times (high temperature
performance). These E* master curves can be useful in ranking mixtures based on the
performance over varied test conditions. In general, higher E* values at lower bound of curve
represent better rut resistant mixture. Similarly, lower E* values at the intermediate region of the
sigmoidal curve represent better fatigue performing mixture. Also, a lower E* value at the upper
bound of the curve represent mixtures with better low temperature performance.
From the figure it is observed that for US171 and LA116 projects, the master curves for
the WMA mixtures and corresponding control HMA mixtures were almost identical,
representing similar performance of all the mixtures at all the temperatures. No significant
difference is observed in the performance of the WMA mixtures to that of the control HMA
mixtures. For LA3121 project, the WMA mixtures had similar low temperature performance to
that of the control HMA mixture. Some minor differences were observed in the performances of
the mixtures at intermediate and high temperatures. The control HMA mixture was outperformed
by the WMA mixtures at intermediate temperatures, by exhibiting higher stiffness. However, the
HMA mixture exhibited higher stiffness at elevated temperatures.
4.3.1.1b Evaluation of Rutting Resistance from Dynamic Modulus Test Results
Dynamic modulus test results at high temperatures are used in evaluating the permanent
deformation (rutting) characteristics of asphalt mixtures. The rut factor, defined by E*/sinδ, is
computed using the E* and δ (phase angle) values at a particular temperature and frequency from
the testing conditions to evaluate the rutting characteristics of asphalt mixtures. For this study,
temperature 54.4°C and frequency 5Hz were selected to compute the rutting factor (44). Higher
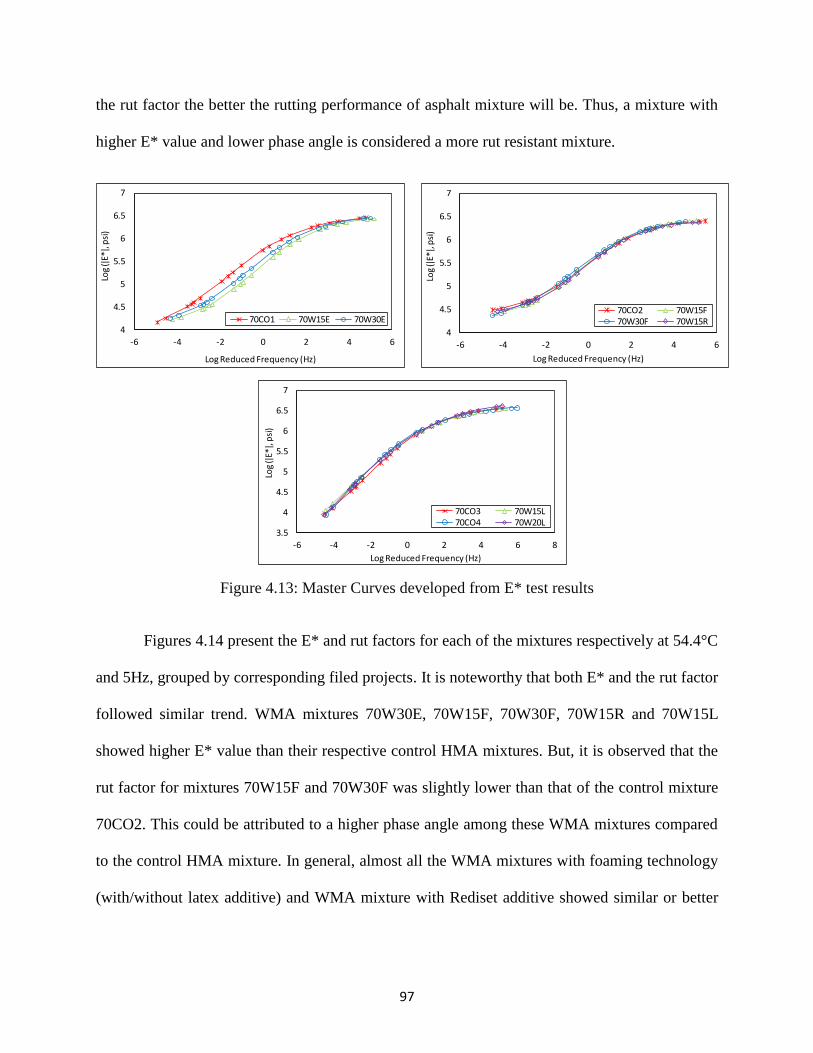
97
the rut factor the better the rutting performance of asphalt mixture will be. Thus, a mixture with
higher E* value and lower phase angle is considered a more rut resistant mixture.
Figure 4.13: Master Curves developed from E* test results
Figures 4.14 present the E* and rut factors for each of the mixtures respectively at 54.4°C
and 5Hz, grouped by corresponding filed projects. It is noteworthy that both E* and the rut factor
followed similar trend. WMA mixtures 70W30E, 70W15F, 70W30F, 70W15R and 70W15L
showed higher E* value than their respective control HMA mixtures. But, it is observed that the
rut factor for mixtures 70W15F and 70W30F was slightly lower than that of the control mixture
70CO2. This could be attributed to a higher phase angle among these WMA mixtures compared
to the control HMA mixture. In general, almost all the WMA mixtures with foaming technology
(with/without latex additive) and WMA mixture with Rediset additive showed similar or better
4
4.5
5
5.5
6
6.5
7
-6 -4 -2 0 2 4 6
Log
(ǀE*
ǀ, p
si)
Log Reduced Frequency (Hz)
70CO1 70W15E 70W30E
4
4.5
5
5.5
6
6.5
7
-6 -4 -2 0 2 4 6
Log
(ǀE*
ǀ, p
si)
Log Reduced Frequency (Hz)
70CO2 70W15F70W30F 70W15R
3.5
4
4.5
5
5.5
6
6.5
7
-6 -4 -2 0 2 4 6 8
Log
(ǀE*
ǀ, p
si)
Log Reduced Frequency (Hz)
70CO3 70W15L70CO4 70W20L
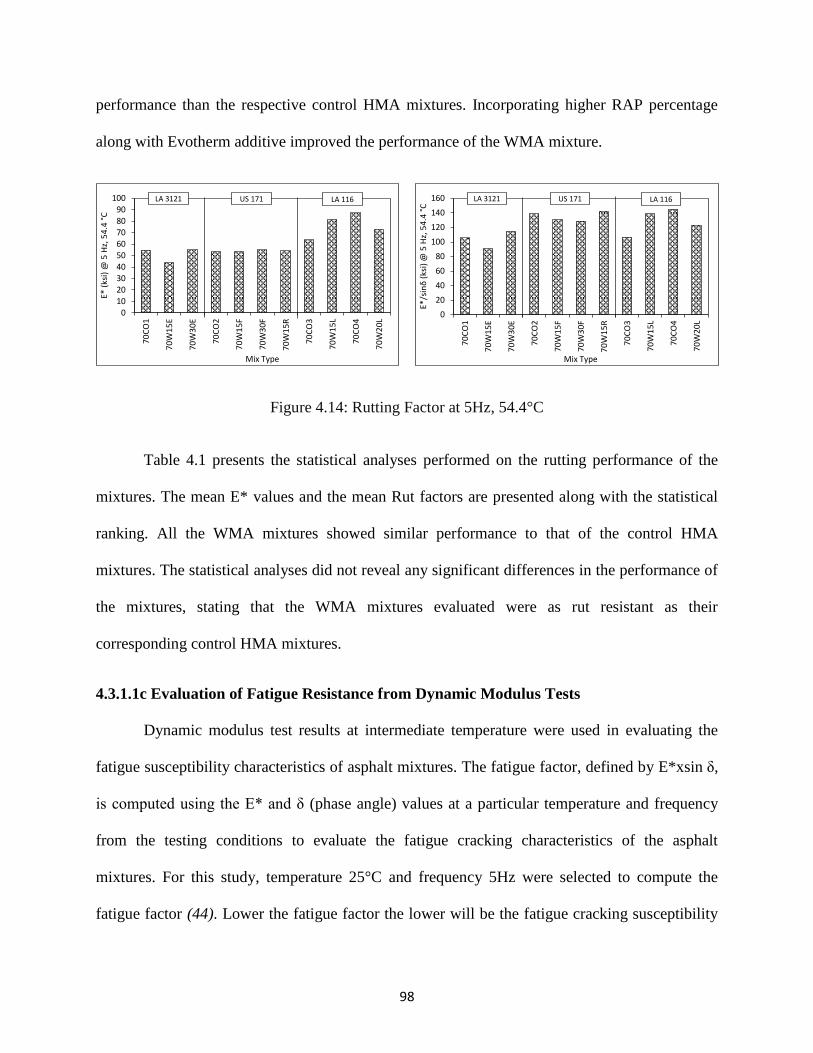
98
performance than the respective control HMA mixtures. Incorporating higher RAP percentage
along with Evotherm additive improved the performance of the WMA mixture.
Figure 4.14: Rutting Factor at 5Hz, 54.4°C
Table 4.1 presents the statistical analyses performed on the rutting performance of the
mixtures. The mean E* values and the mean Rut factors are presented along with the statistical
ranking. All the WMA mixtures showed similar performance to that of the control HMA
mixtures. The statistical analyses did not reveal any significant differences in the performance of
the mixtures, stating that the WMA mixtures evaluated were as rut resistant as their
corresponding control HMA mixtures.
4.3.1.1c Evaluation of Fatigue Resistance from Dynamic Modulus Tests
Dynamic modulus test results at intermediate temperature were used in evaluating the
fatigue susceptibility characteristics of asphalt mixtures. The fatigue factor, defined by E*xsin δ,
is computed using the E* and δ (phase angle) values at a particular temperature and frequency
from the testing conditions to evaluate the fatigue cracking characteristics of the asphalt
mixtures. For this study, temperature 25°C and frequency 5Hz were selected to compute the
fatigue factor (44). Lower the fatigue factor the lower will be the fatigue cracking susceptibility
0102030405060708090
100
70
CO
1
70
W1
5E
70
W3
0E
70
CO
2
70
W1
5F
70
W3
0F
70
W1
5R
70
CO
3
70
W1
5L
70
CO
4
70
W2
0L
E* (
ksi)
@ 5
Hz,
54
.4 °
C
Mix Type
LA 3121 US 171 LA 116
0
20
40
60
80
100
120
140
160
70
CO
1
70
W1
5E
70
W3
0E
70
CO
2
70
W1
5F
70
W3
0F
70
W1
5R
70
CO
3
70
W1
5L
70
CO
4
70
W2
0L
E*/s
inδ
(ksi
) @
5 H
z, 5
4.4
°C
Mix Type
LA 3121 US 171 LA 116
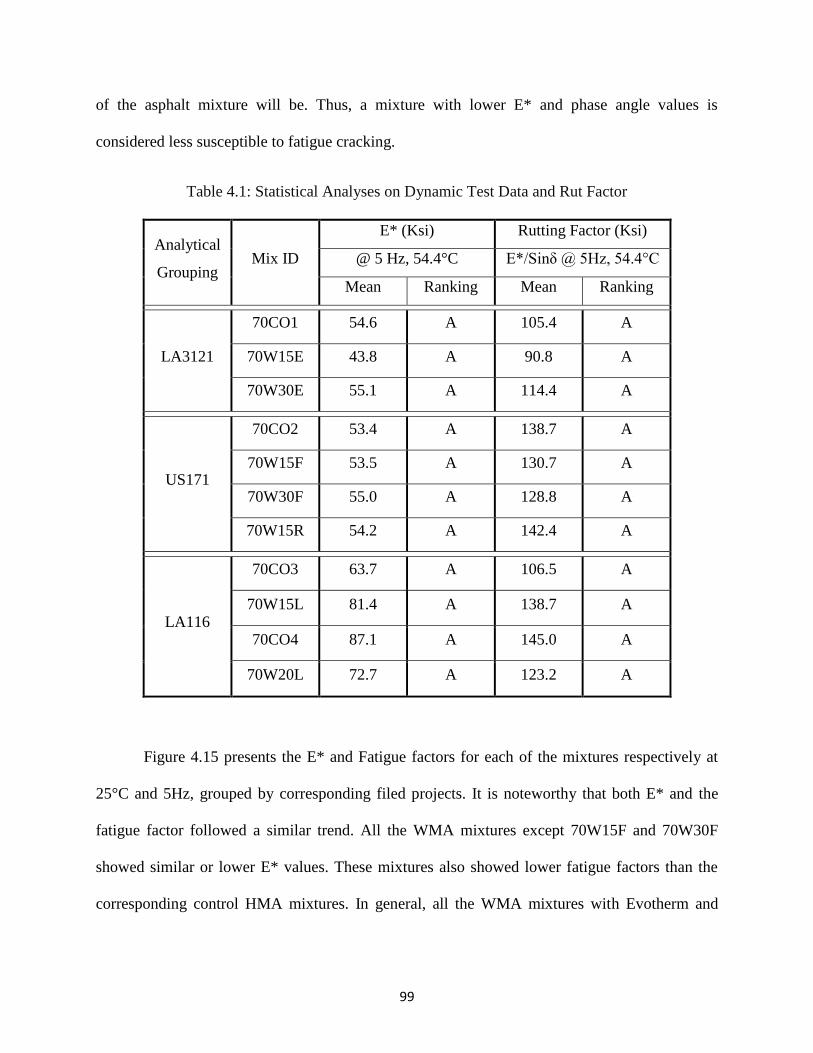
99
of the asphalt mixture will be. Thus, a mixture with lower E* and phase angle values is
considered less susceptible to fatigue cracking.
Table 4.1: Statistical Analyses on Dynamic Test Data and Rut Factor
Analytical
Grouping Mix ID
E* (Ksi) Rutting Factor (Ksi)
@ 5 Hz, 54.4°C E*/Sinδ @ 5Hz, 54.4 C
Mean Ranking Mean Ranking
LA3121
70CO1 54.6 A 105.4 A
70W15E 43.8 A 90.8 A
70W30E 55.1 A 114.4 A
US171
70CO2 53.4 A 138.7 A
70W15F 53.5 A 130.7 A
70W30F 55.0 A 128.8 A
70W15R 54.2 A 142.4 A
LA116
70CO3 63.7 A 106.5 A
70W15L 81.4 A 138.7 A
70CO4 87.1 A 145.0 A
70W20L 72.7 A 123.2 A
Figure 4.15 presents the E* and Fatigue factors for each of the mixtures respectively at
25°C and 5Hz, grouped by corresponding filed projects. It is noteworthy that both E* and the
fatigue factor followed a similar trend. All the WMA mixtures except 70W15F and 70W30F
showed similar or lower E* values. These mixtures also showed lower fatigue factors than the
corresponding control HMA mixtures. In general, all the WMA mixtures with Evotherm and
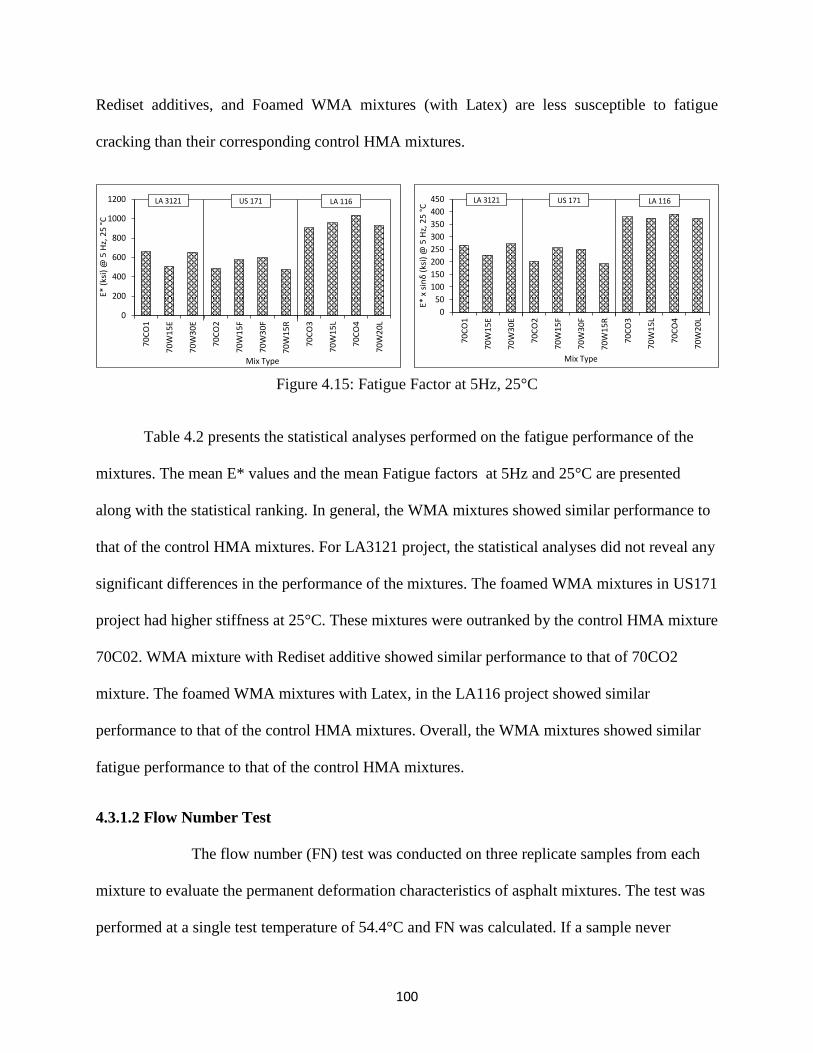
100
Rediset additives, and Foamed WMA mixtures (with Latex) are less susceptible to fatigue
cracking than their corresponding control HMA mixtures.
Table 4.2 presents the statistical analyses performed on the fatigue performance of the
mixtures. The mean E* values and the mean Fatigue factors at 5Hz and 25°C are presented
along with the statistical ranking. In general, the WMA mixtures showed similar performance to
that of the control HMA mixtures. For LA3121 project, the statistical analyses did not reveal any
significant differences in the performance of the mixtures. The foamed WMA mixtures in US171
project had higher stiffness at 25°C. These mixtures were outranked by the control HMA mixture
70C02. WMA mixture with Rediset additive showed similar performance to that of 70CO2
mixture. The foamed WMA mixtures with Latex, in the LA116 project showed similar
performance to that of the control HMA mixtures. Overall, the WMA mixtures showed similar
fatigue performance to that of the control HMA mixtures.
4.3.1.2 Flow Number Test
The flow number (FN) test was conducted on three replicate samples from each
mixture to evaluate the permanent deformation characteristics of asphalt mixtures. The test was
performed at a single test temperature of 54.4°C and FN was calculated. If a sample never
E* fatigue factor, 5Hz 25C
0
200
400
600
800
1000
1200
70
CO
1
70
W1
5E
70
W3
0E
70
CO
2
70
W1
5F
70
W3
0F
70
W1
5R
70
CO
3
70
W1
5L
70
CO
4
70
W2
0L
E*
(ks
i) @
5 H
z, 2
5 °
C
Mix Type
LA 3121 US 171 LA 116
0
50
100
150
200
250
300
350
400
450
70
CO
1
70
W1
5E
70
W3
0E
70
CO
2
70
W1
5F
70
W3
0F
70
W1
5R
70
CO
3
70
W1
5L
70
CO
4
70
W2
0L
E*
x s
inδ
(ksi
) @
5 H
z, 2
5 °
C
Mix Type
LA 3121 US 171 LA 116
Figure 4.15: Fatigue Factor at 5Hz, 25°C
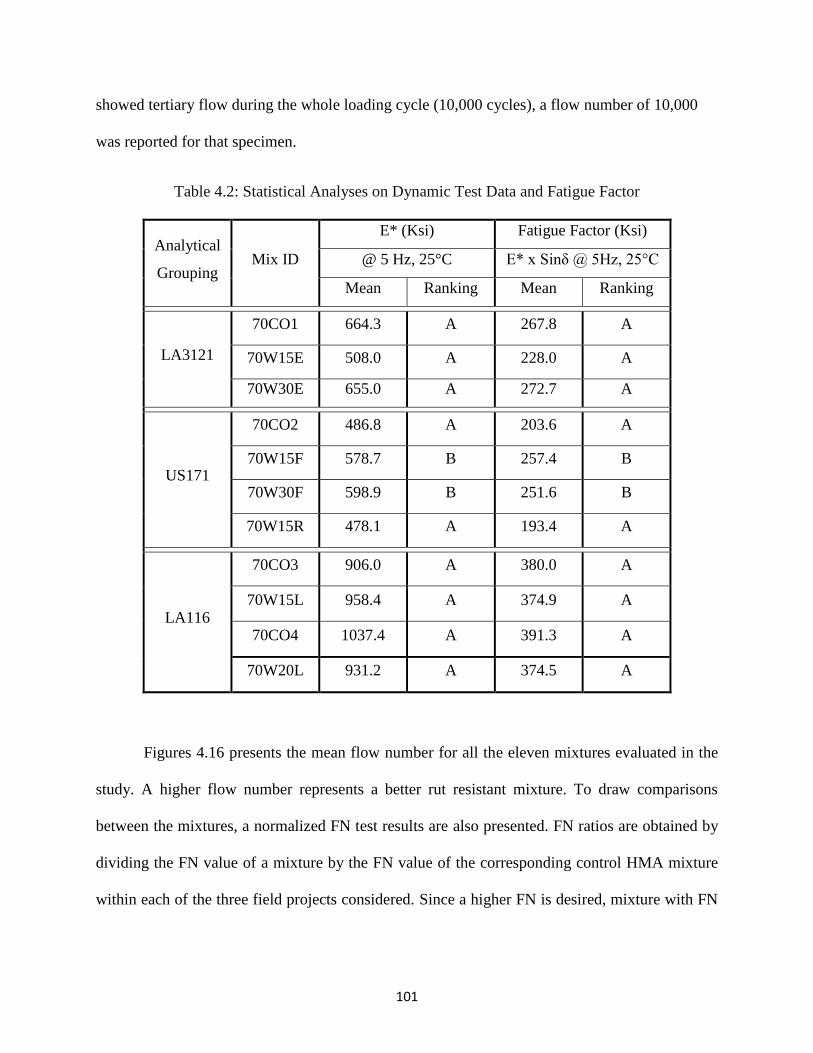
101
showed tertiary flow during the whole loading cycle (10,000 cycles), a flow number of 10,000
was reported for that specimen.
Table 4.2: Statistical Analyses on Dynamic Test Data and Fatigue Factor
Analytical
Grouping Mix ID
E* (Ksi) Fatigue Factor (Ksi)
@ 5 Hz, 25°C E* x Sinδ @ 5Hz, 25 C
Mean Ranking Mean Ranking
LA3121
70CO1 664.3 A 267.8 A
70W15E 508.0 A 228.0 A
70W30E 655.0 A 272.7 A
US171
70CO2 486.8 A 203.6 A
70W15F 578.7 B 257.4 B
70W30F 598.9 B 251.6 B
70W15R 478.1 A 193.4 A
LA116
70CO3 906.0 A 380.0 A
70W15L 958.4 A 374.9 A
70CO4 1037.4 A 391.3 A
70W20L 931.2 A 374.5 A
Figures 4.16 presents the mean flow number for all the eleven mixtures evaluated in the
study. A higher flow number represents a better rut resistant mixture. To draw comparisons
between the mixtures, a normalized FN test results are also presented. FN ratios are obtained by
dividing the FN value of a mixture by the FN value of the corresponding control HMA mixture
within each of the three field projects considered. Since a higher FN is desired, mixture with FN
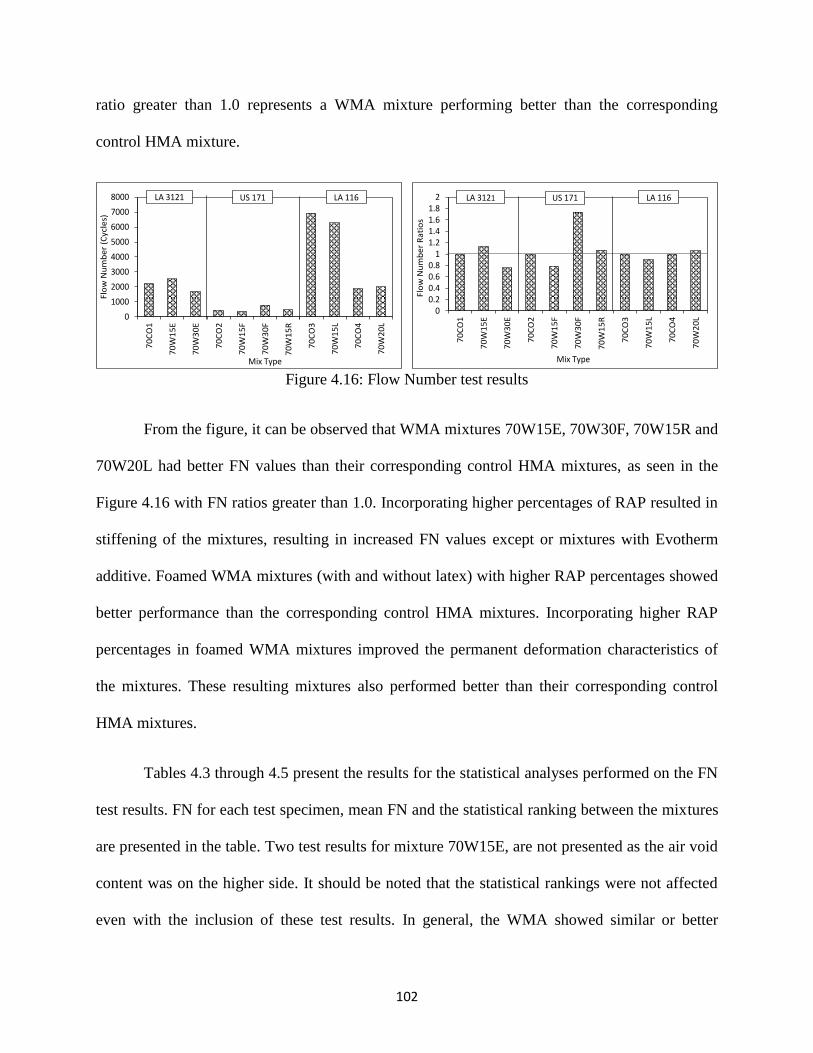
102
ratio greater than 1.0 represents a WMA mixture performing better than the corresponding
control HMA mixture.
Figure 4.16: Flow Number test results
From the figure, it can be observed that WMA mixtures 70W15E, 70W30F, 70W15R and
70W20L had better FN values than their corresponding control HMA mixtures, as seen in the
Figure 4.16 with FN ratios greater than 1.0. Incorporating higher percentages of RAP resulted in
stiffening of the mixtures, resulting in increased FN values except or mixtures with Evotherm
additive. Foamed WMA mixtures (with and without latex) with higher RAP percentages showed
better performance than the corresponding control HMA mixtures. Incorporating higher RAP
percentages in foamed WMA mixtures improved the permanent deformation characteristics of
the mixtures. These resulting mixtures also performed better than their corresponding control
HMA mixtures.
Tables 4.3 through 4.5 present the results for the statistical analyses performed on the FN
test results. FN for each test specimen, mean FN and the statistical ranking between the mixtures
are presented in the table. Two test results for mixture 70W15E, are not presented as the air void
content was on the higher side. It should be noted that the statistical rankings were not affected
even with the inclusion of these test results. In general, the WMA showed similar or better
0
1000
2000
3000
4000
5000
6000
7000
8000
70
CO
1
70
W1
5E
70
W3
0E
70
CO
2
70
W1
5F
70
W3
0F
70
W1
5R
70
CO
3
70
W1
5L
70
CO
4
70
W2
0L
Flo
w N
um
be
r (C
ycle
s)
Mix Type
LA 3121 US 171 LA 116
00.20.40.60.8
11.21.41.61.8
2
70
CO
1
70
W1
5E
70
W3
0E
70
CO
2
70
W1
5F
70
W3
0F
70
W1
5R
70
CO
3
70
W1
5L
70
CO
4
70
W2
0L
Flo
w N
um
be
r R
ati
os
Mix Type
LA 3121 US 171 LA 116
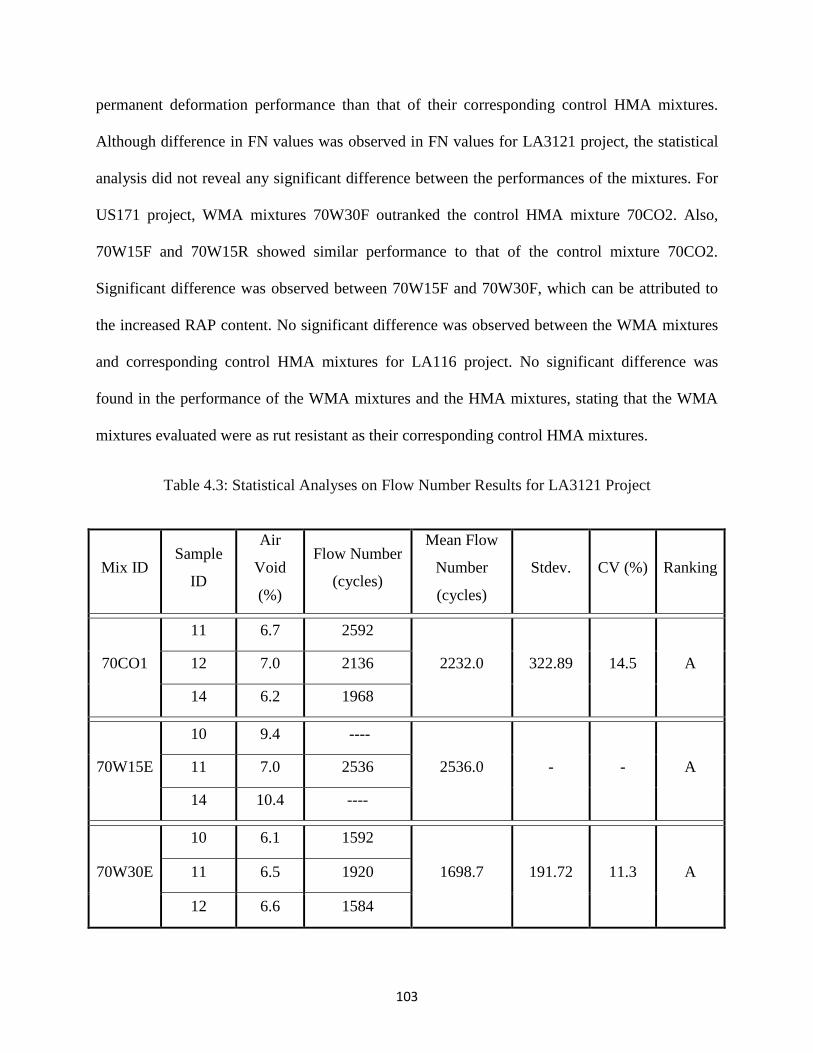
103
permanent deformation performance than that of their corresponding control HMA mixtures.
Although difference in FN values was observed in FN values for LA3121 project, the statistical
analysis did not reveal any significant difference between the performances of the mixtures. For
US171 project, WMA mixtures 70W30F outranked the control HMA mixture 70CO2. Also,
70W15F and 70W15R showed similar performance to that of the control mixture 70CO2.
Significant difference was observed between 70W15F and 70W30F, which can be attributed to
the increased RAP content. No significant difference was observed between the WMA mixtures
and corresponding control HMA mixtures for LA116 project. No significant difference was
found in the performance of the WMA mixtures and the HMA mixtures, stating that the WMA
mixtures evaluated were as rut resistant as their corresponding control HMA mixtures.
Table 4.3: Statistical Analyses on Flow Number Results for LA3121 Project
Mix ID Sample
ID
Air
Void
(%)
Flow Number
(cycles)
Mean Flow
Number
(cycles)
Stdev. CV (%) Ranking
70CO1
11 6.7 2592
2232.0 322.89 14.5 A 12 7.0 2136
14 6.2 1968
70W15E
10 9.4 ----
2536.0 - - A 11 7.0 2536
14 10.4 ----
70W30E
10 6.1 1592
1698.7 191.72 11.3 A 11 6.5 1920
12 6.6 1584
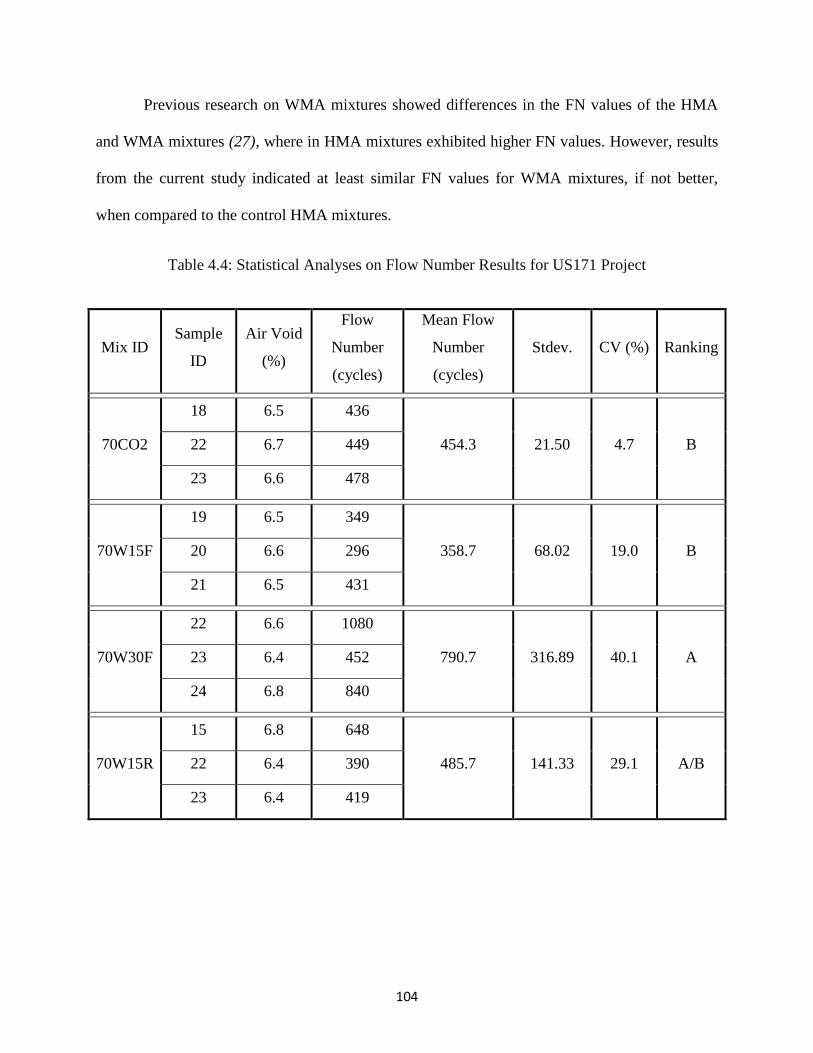
104
Previous research on WMA mixtures showed differences in the FN values of the HMA
and WMA mixtures (27), where in HMA mixtures exhibited higher FN values. However, results
from the current study indicated at least similar FN values for WMA mixtures, if not better,
when compared to the control HMA mixtures.
Table 4.4: Statistical Analyses on Flow Number Results for US171 Project
Mix ID Sample
ID
Air Void
(%)
Flow
Number
(cycles)
Mean Flow
Number
(cycles)
Stdev. CV (%) Ranking
70CO2
18 6.5 436
454.3 21.50 4.7 B 22 6.7 449
23 6.6 478
70W15F
19 6.5 349
358.7 68.02 19.0 B 20 6.6 296
21 6.5 431
70W30F
22 6.6 1080
790.7 316.89 40.1 A 23 6.4 452
24 6.8 840
70W15R
15 6.8 648
485.7 141.33 29.1 A/B 22 6.4 390
23 6.4 419
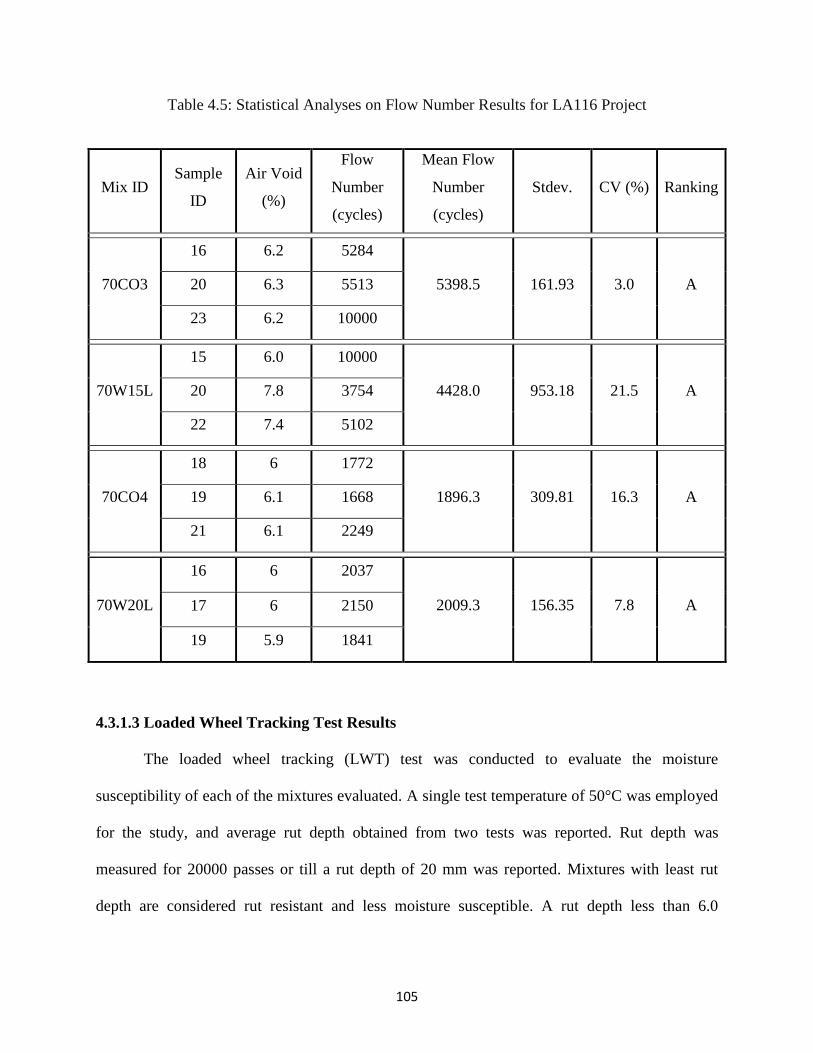
105
Table 4.5: Statistical Analyses on Flow Number Results for LA116 Project
Mix ID Sample
ID
Air Void
(%)
Flow
Number
(cycles)
Mean Flow
Number
(cycles)
Stdev. CV (%) Ranking
70CO3
16 6.2 5284
5398.5 161.93 3.0 A 20 6.3 5513
23 6.2 10000
70W15L
15 6.0 10000
4428.0 953.18 21.5 A 20 7.8 3754
22 7.4 5102
70CO4
18 6 1772
1896.3 309.81 16.3 A 19 6.1 1668
21 6.1 2249
70W20L
16 6 2037
2009.3 156.35 7.8 A 17 6 2150
19 5.9 1841
4.3.1.3 Loaded Wheel Tracking Test Results
The loaded wheel tracking (LWT) test was conducted to evaluate the moisture
susceptibility of each of the mixtures evaluated. A single test temperature of 50°C was employed
for the study, and average rut depth obtained from two tests was reported. Rut depth was
measured for 20000 passes or till a rut depth of 20 mm was reported. Mixtures with least rut
depth are considered rut resistant and less moisture susceptible. A rut depth less than 6.0
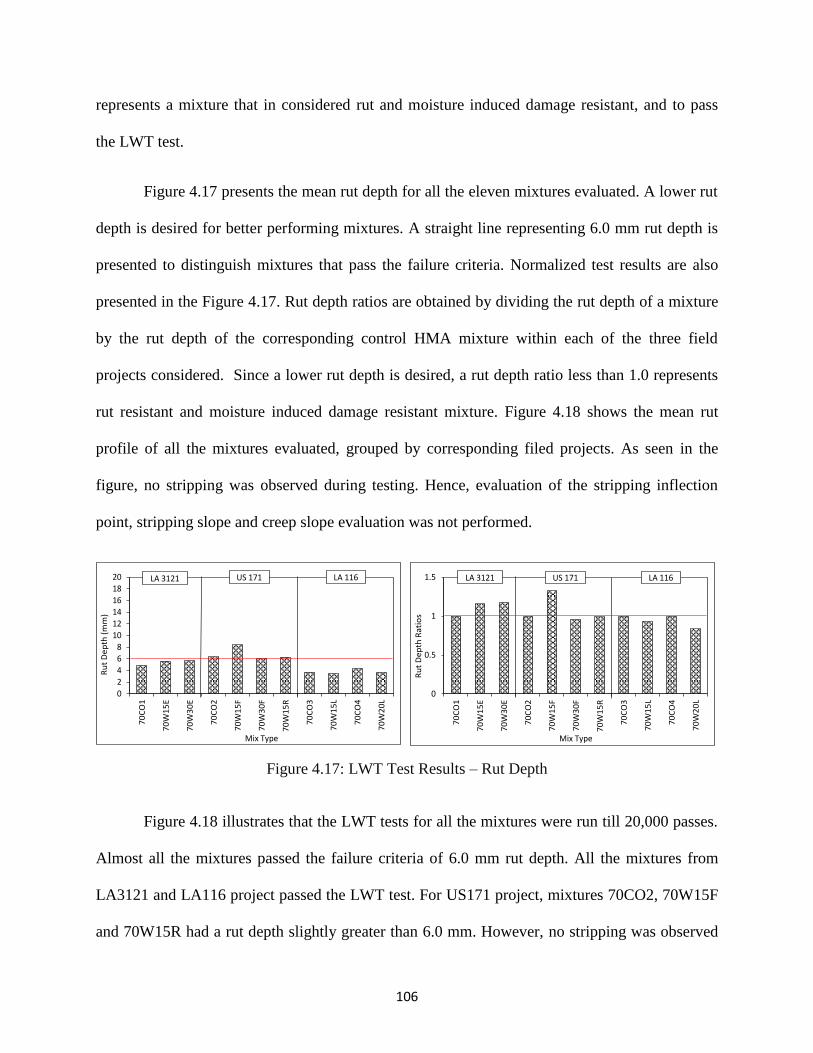
106
represents a mixture that in considered rut and moisture induced damage resistant, and to pass
the LWT test.
Figure 4.17 presents the mean rut depth for all the eleven mixtures evaluated. A lower rut
depth is desired for better performing mixtures. A straight line representing 6.0 mm rut depth is
presented to distinguish mixtures that pass the failure criteria. Normalized test results are also
presented in the Figure 4.17. Rut depth ratios are obtained by dividing the rut depth of a mixture
by the rut depth of the corresponding control HMA mixture within each of the three field
projects considered. Since a lower rut depth is desired, a rut depth ratio less than 1.0 represents
rut resistant and moisture induced damage resistant mixture. Figure 4.18 shows the mean rut
profile of all the mixtures evaluated, grouped by corresponding filed projects. As seen in the
figure, no stripping was observed during testing. Hence, evaluation of the stripping inflection
point, stripping slope and creep slope evaluation was not performed.
Figure 4.17: LWT Test Results – Rut Depth
Figure 4.18 illustrates that the LWT tests for all the mixtures were run till 20,000 passes.
Almost all the mixtures passed the failure criteria of 6.0 mm rut depth. All the mixtures from
LA3121 and LA116 project passed the LWT test. For US171 project, mixtures 70CO2, 70W15F
and 70W15R had a rut depth slightly greater than 6.0 mm. However, no stripping was observed
0
0.5
1
1.5
70
CO
1
70
W1
5E
70
W3
0E
70
CO
2
70
W1
5F
70
W3
0F
70
W1
5R
70
CO
3
70
W1
5L
70
CO
4
70
W2
0L
Ru
t D
ep
th R
atio
s
Mix Type
LA 3121 US 171 LA 116
0
2
4
6
8
10
12
14
16
18
20
70
CO
1
70
W1
5E
70
W3
0E
70
CO
2
70
W1
5F
70
W3
0F
70
W1
5R
70
CO
3
70
W1
5L
70
CO
4
70
W2
0L
Ru
t D
ep
th (
mm
)
Mix Type
LA 3121 US 171 LA 116
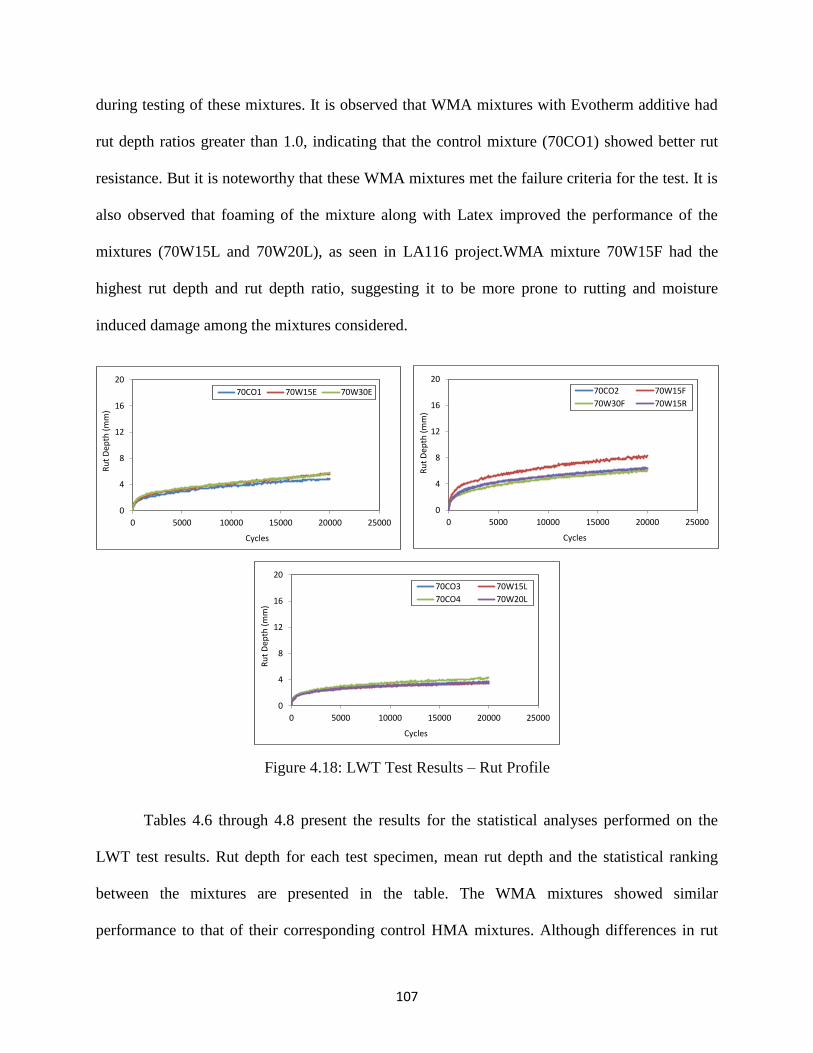
107
during testing of these mixtures. It is observed that WMA mixtures with Evotherm additive had
rut depth ratios greater than 1.0, indicating that the control mixture (70CO1) showed better rut
resistance. But it is noteworthy that these WMA mixtures met the failure criteria for the test. It is
also observed that foaming of the mixture along with Latex improved the performance of the
mixtures (70W15L and 70W20L), as seen in LA116 project.WMA mixture 70W15F had the
highest rut depth and rut depth ratio, suggesting it to be more prone to rutting and moisture
induced damage among the mixtures considered.
Figure 4.18: LWT Test Results – Rut Profile
Tables 4.6 through 4.8 present the results for the statistical analyses performed on the
LWT test results. Rut depth for each test specimen, mean rut depth and the statistical ranking
between the mixtures are presented in the table. The WMA mixtures showed similar
performance to that of their corresponding control HMA mixtures. Although differences in rut
0
4
8
12
16
20
0 5000 10000 15000 20000 25000
Ru
t D
ep
th (
mm
)
Cycles
70CO1 70W15E 70W30E
0
4
8
12
16
20
0 5000 10000 15000 20000 25000
Ru
t D
ep
th (
mm
)
Cycles
70CO2 70W15F
70W30F 70W15R
0
4
8
12
16
20
0 5000 10000 15000 20000 25000
Ru
t D
ep
th (
mm
)
Cycles
70CO3 70W15L
70CO4 70W20L
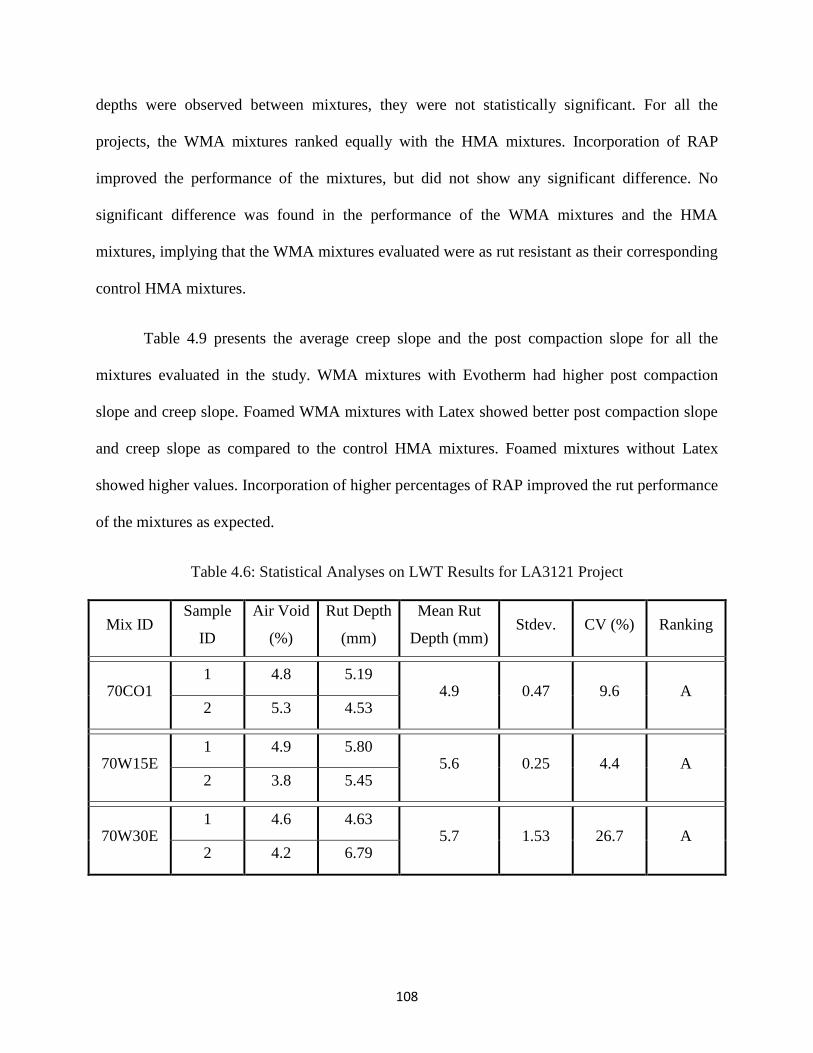
108
depths were observed between mixtures, they were not statistically significant. For all the
projects, the WMA mixtures ranked equally with the HMA mixtures. Incorporation of RAP
improved the performance of the mixtures, but did not show any significant difference. No
significant difference was found in the performance of the WMA mixtures and the HMA
mixtures, implying that the WMA mixtures evaluated were as rut resistant as their corresponding
control HMA mixtures.
Table 4.9 presents the average creep slope and the post compaction slope for all the
mixtures evaluated in the study. WMA mixtures with Evotherm had higher post compaction
slope and creep slope. Foamed WMA mixtures with Latex showed better post compaction slope
and creep slope as compared to the control HMA mixtures. Foamed mixtures without Latex
showed higher values. Incorporation of higher percentages of RAP improved the rut performance
of the mixtures as expected.
Table 4.6: Statistical Analyses on LWT Results for LA3121 Project
Mix ID Sample
ID
Air Void
(%)
Rut Depth
(mm)
Mean Rut
Depth (mm) Stdev. CV (%) Ranking
70CO1 1 4.8 5.19
4.9 0.47 9.6 A 2 5.3 4.53
70W15E 1 4.9 5.80
5.6 0.25 4.4 A 2 3.8 5.45
70W30E 1 4.6 4.63
5.7 1.53 26.7 A 2 4.2 6.79
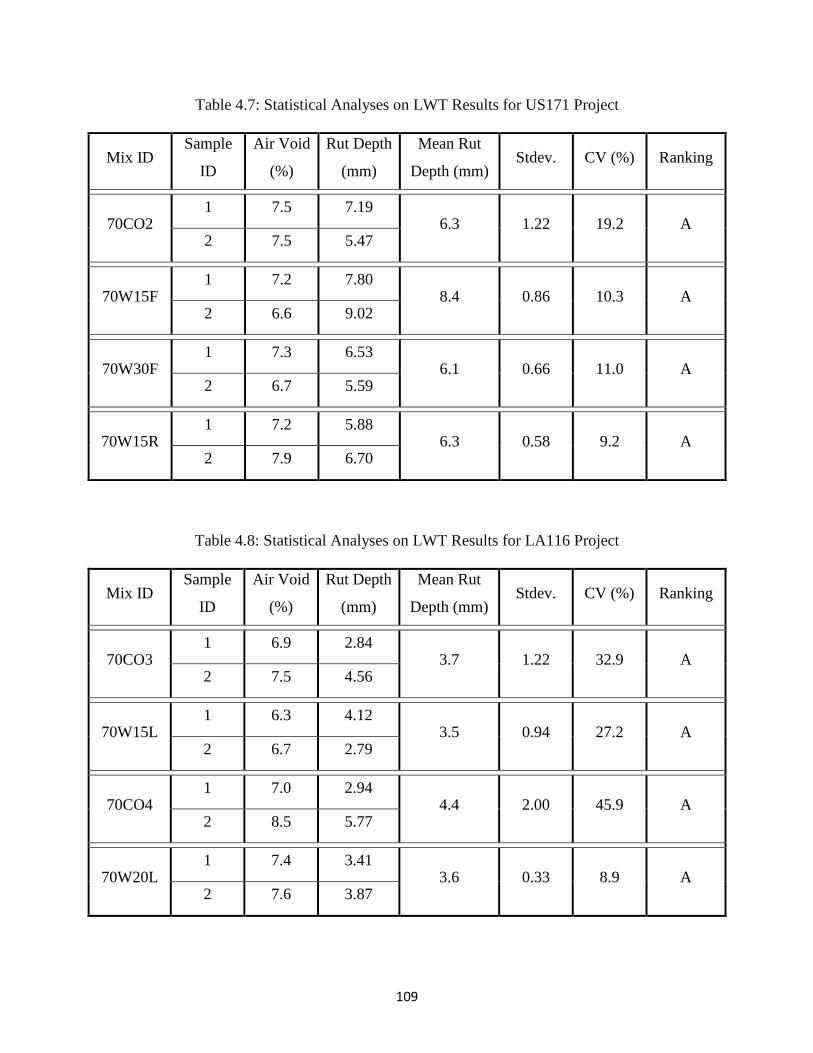
109
Table 4.7: Statistical Analyses on LWT Results for US171 Project
Mix ID Sample
ID
Air Void
(%)
Rut Depth
(mm)
Mean Rut
Depth (mm) Stdev. CV (%) Ranking
70CO2 1 7.5 7.19
6.3 1.22 19.2 A 2 7.5 5.47
70W15F 1 7.2 7.80
8.4 0.86 10.3 A 2 6.6 9.02
70W30F 1 7.3 6.53
6.1 0.66 11.0 A 2 6.7 5.59
70W15R 1 7.2 5.88
6.3 0.58 9.2 A 2 7.9 6.70
Table 4.8: Statistical Analyses on LWT Results for LA116 Project
Mix ID Sample
ID
Air Void
(%)
Rut Depth
(mm)
Mean Rut
Depth (mm) Stdev. CV (%) Ranking
70CO3 1 6.9 2.84
3.7 1.22 32.9 A 2 7.5 4.56
70W15L 1 6.3 4.12
3.5 0.94 27.2 A 2 6.7 2.79
70CO4 1 7.0 2.94
4.4 2.00 45.9 A 2 8.5 5.77
70W20L 1 7.4 3.41
3.6 0.33 8.9 A 2 7.6 3.87
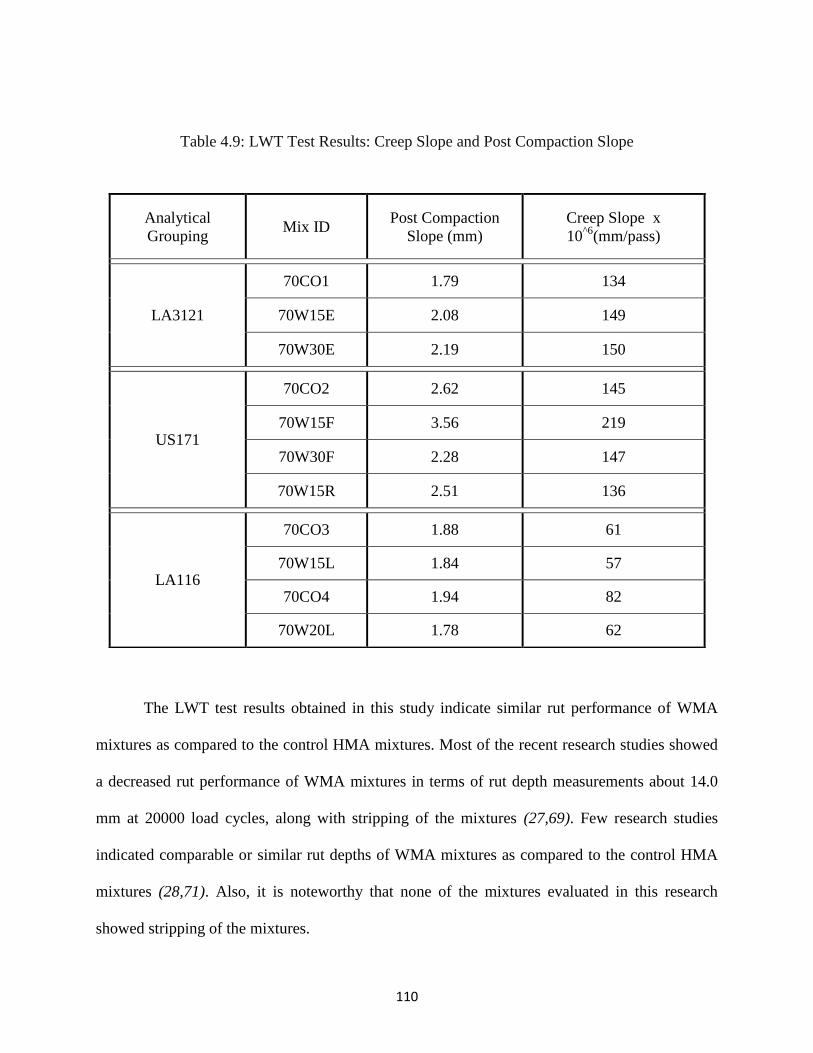
110
Table 4.9: LWT Test Results: Creep Slope and Post Compaction Slope
The LWT test results obtained in this study indicate similar rut performance of WMA
mixtures as compared to the control HMA mixtures. Most of the recent research studies showed
a decreased rut performance of WMA mixtures in terms of rut depth measurements about 14.0
mm at 20000 load cycles, along with stripping of the mixtures (27,69). Few research studies
indicated comparable or similar rut depths of WMA mixtures as compared to the control HMA
mixtures (28,71). Also, it is noteworthy that none of the mixtures evaluated in this research
showed stripping of the mixtures.
Analytical
Grouping Mix ID
Post Compaction
Slope (mm)
Creep Slope x
10^6
(mm/pass)
LA3121
70CO1 1.79 134
70W15E 2.08 149
70W30E 2.19 150
US171
70CO2 2.62 145
70W15F 3.56 219
70W30F 2.28 147
70W15R 2.51 136
LA116
70CO3 1.88 61
70W15L 1.84 57
70CO4 1.94 82
70W20L 1.78 62
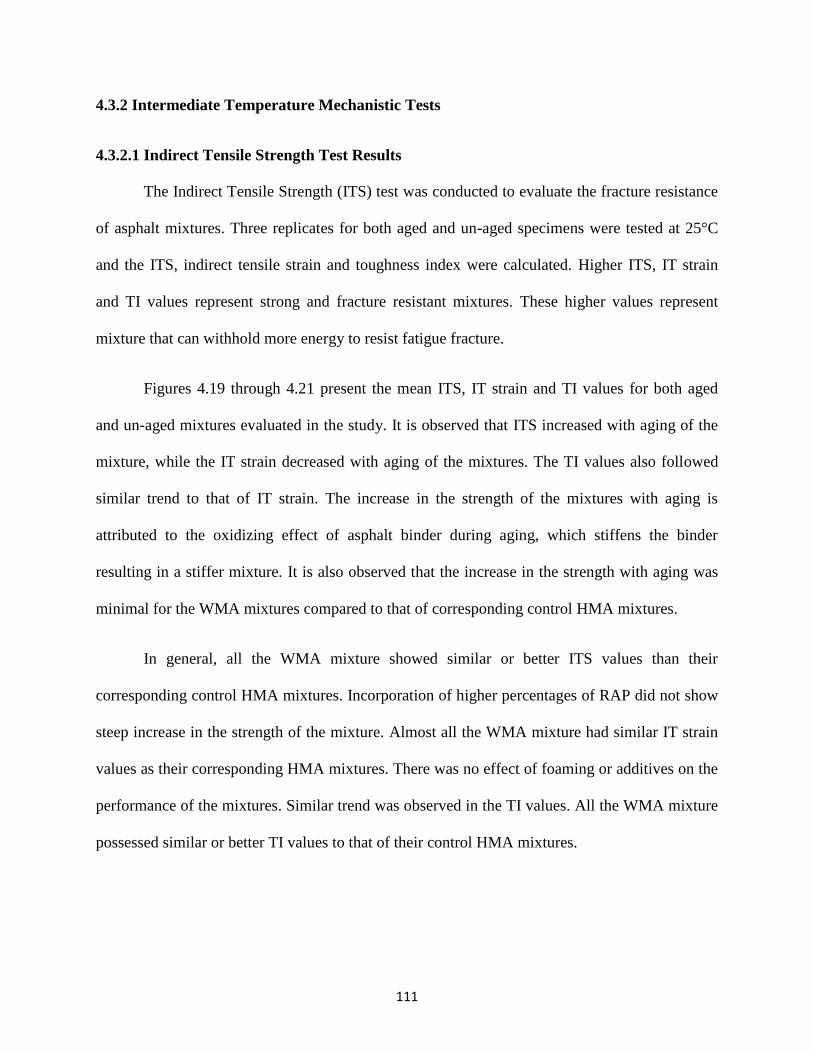
111
4.3.2 Intermediate Temperature Mechanistic Tests
4.3.2.1 Indirect Tensile Strength Test Results
The Indirect Tensile Strength (ITS) test was conducted to evaluate the fracture resistance
of asphalt mixtures. Three replicates for both aged and un-aged specimens were tested at 25°C
and the ITS, indirect tensile strain and toughness index were calculated. Higher ITS, IT strain
and TI values represent strong and fracture resistant mixtures. These higher values represent
mixture that can withhold more energy to resist fatigue fracture.
Figures 4.19 through 4.21 present the mean ITS, IT strain and TI values for both aged
and un-aged mixtures evaluated in the study. It is observed that ITS increased with aging of the
mixture, while the IT strain decreased with aging of the mixtures. The TI values also followed
similar trend to that of IT strain. The increase in the strength of the mixtures with aging is
attributed to the oxidizing effect of asphalt binder during aging, which stiffens the binder
resulting in a stiffer mixture. It is also observed that the increase in the strength with aging was
minimal for the WMA mixtures compared to that of corresponding control HMA mixtures.
In general, all the WMA mixture showed similar or better ITS values than their
corresponding control HMA mixtures. Incorporation of higher percentages of RAP did not show
steep increase in the strength of the mixture. Almost all the WMA mixture had similar IT strain
values as their corresponding HMA mixtures. There was no effect of foaming or additives on the
performance of the mixtures. Similar trend was observed in the TI values. All the WMA mixture
possessed similar or better TI values to that of their control HMA mixtures.
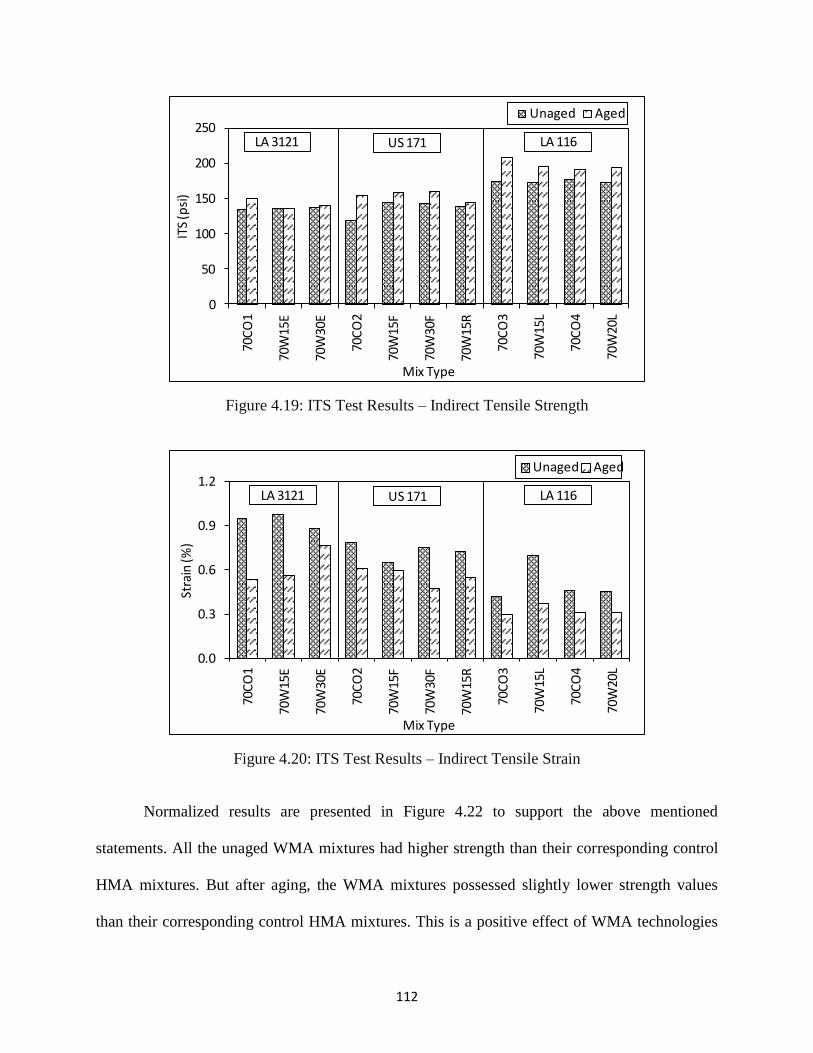
112
Figure 4.19: ITS Test Results – Indirect Tensile Strength
Figure 4.20: ITS Test Results – Indirect Tensile Strain
Normalized results are presented in Figure 4.22 to support the above mentioned
statements. All the unaged WMA mixtures had higher strength than their corresponding control
HMA mixtures. But after aging, the WMA mixtures possessed slightly lower strength values
than their corresponding control HMA mixtures. This is a positive effect of WMA technologies
0
50
100
150
200
250
70C
O1
70W
15E
70W
30E
70C
O2
70W
15F
70W
30F
70W
15R
70C
O3
70W
15L
70C
O4
70W
20L
ITS
(psi
)
Mix Type
Unaged Aged
LA 3121 US 171 LA 116
0.0
0.3
0.6
0.9
1.2
70C
O1
70W
15E
70W
30E
70C
O2
70W
15F
70W
30F
70W
15R
70C
O3
70W
15L
70C
O4
70W
20L
Stra
in (%
)
Mix Type
Unaged Aged
LA 3121 US 171 LA 116
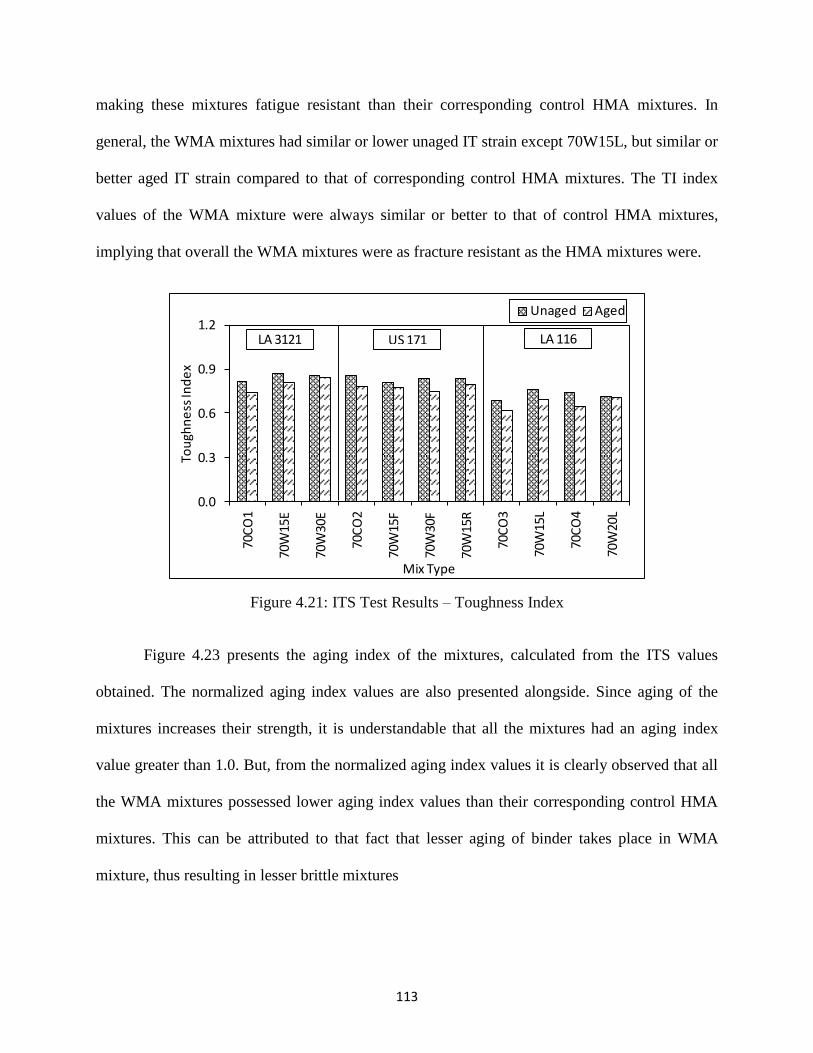
113
making these mixtures fatigue resistant than their corresponding control HMA mixtures. In
general, the WMA mixtures had similar or lower unaged IT strain except 70W15L, but similar or
better aged IT strain compared to that of corresponding control HMA mixtures. The TI index
values of the WMA mixture were always similar or better to that of control HMA mixtures,
implying that overall the WMA mixtures were as fracture resistant as the HMA mixtures were.
Figure 4.21: ITS Test Results – Toughness Index
Figure 4.23 presents the aging index of the mixtures, calculated from the ITS values
obtained. The normalized aging index values are also presented alongside. Since aging of the
mixtures increases their strength, it is understandable that all the mixtures had an aging index
value greater than 1.0. But, from the normalized aging index values it is clearly observed that all
the WMA mixtures possessed lower aging index values than their corresponding control HMA
mixtures. This can be attributed to that fact that lesser aging of binder takes place in WMA
mixture, thus resulting in lesser brittle mixtures
0.0
0.3
0.6
0.9
1.2
70C
O1
70W
15E
70W
30E
70C
O2
70W
15F
70W
30F
70W
15R
70C
O3
70W
15L
70C
O4
70W
20L
Tou
ghn
ess
Ind
ex
Mix Type
Unaged Aged
LA 3121 US 171 LA 116
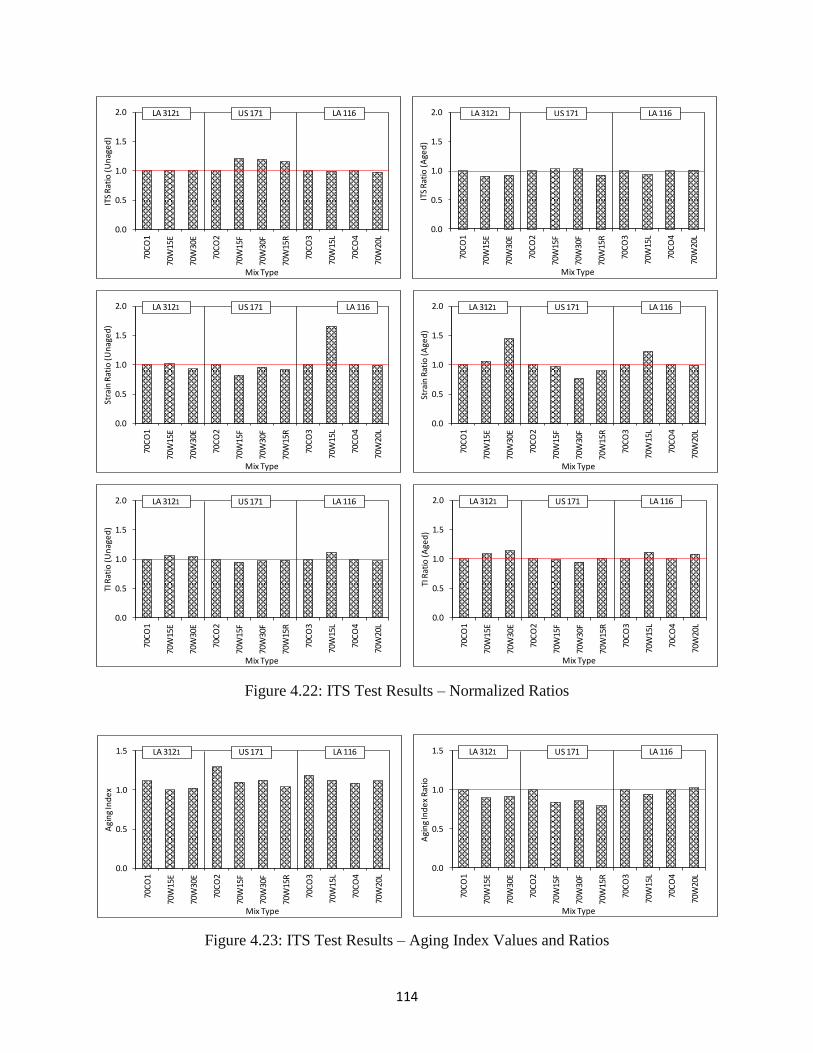
114
Figure 4.22: ITS Test Results – Normalized Ratios
Figure 4.23: ITS Test Results – Aging Index Values and Ratios
0.0
0.5
1.0
1.5
2.0
70C
O1
70W
15E
70W
30E
70C
O2
70W
15F
70W
30F
70W
15R
70C
O3
70W
15L
70C
O4
70W
20L
ITS
Rat
io (
Un
age
d)
Mix Type
LA 3121 US 171 LA 116
0.0
0.5
1.0
1.5
2.0
70C
O1
70W
15E
70W
30E
70C
O2
70W
15F
70W
30F
70W
15R
70C
O3
70W
15L
70C
O4
70W
20L
ITS
Rat
io (
Age
d)
Mix Type
LA 3121 US 171 LA 116
0.0
0.5
1.0
1.5
2.0
70C
O1
70W
15E
70W
30E
70C
O2
70W
15F
70W
30F
70W
15R
70C
O3
70W
15L
70C
O4
70W
20L
Stra
in R
atio
(U
nag
ed
)
Mix Type
LA 3121 US 171 LA 116
0.0
0.5
1.0
1.5
2.0
70C
O1
70W
15E
70W
30E
70C
O2
70W
15F
70W
30F
70W
15R
70C
O3
70W
15L
70C
O4
70W
20L
Stra
in R
atio
(A
ged
)
Mix Type
LA 3121 US 171 LA 116
0.0
0.5
1.0
1.5
2.0
70C
O1
70W
15E
70W
30E
70C
O2
70W
15F
70W
30F
70W
15R
70C
O3
70W
15L
70C
O4
70W
20L
TI R
atio
(A
ged
)
Mix Type
LA 3121 US 171 LA 116
0.0
0.5
1.0
1.5
2.0
70C
O1
70W
15E
70W
30E
70C
O2
70W
15F
70W
30F
70W
15R
70C
O3
70W
15L
70C
O4
70W
20L
TI R
atio
(U
nag
ed
)
Mix Type
LA 3121 US 171 LA 116
0.0
0.5
1.0
1.5
70C
O1
70W
15E
70W
30E
70C
O2
70W
15F
70W
30F
70W
15R
70C
O3
70W
15L
70C
O4
70W
20L
Agi
ng
Ind
ex
Mix Type
LA 3121 US 171 LA 116
0.0
0.5
1.0
1.5
70C
O1
70W
15E
70W
30E
70C
O2
70W
15F
70W
30F
70W
15R
70C
O3
70W
15L
70C
O4
70W
20L
Agi
ng
Ind
ex
Rat
io
Mix Type
LA 3121 US 171 LA 116
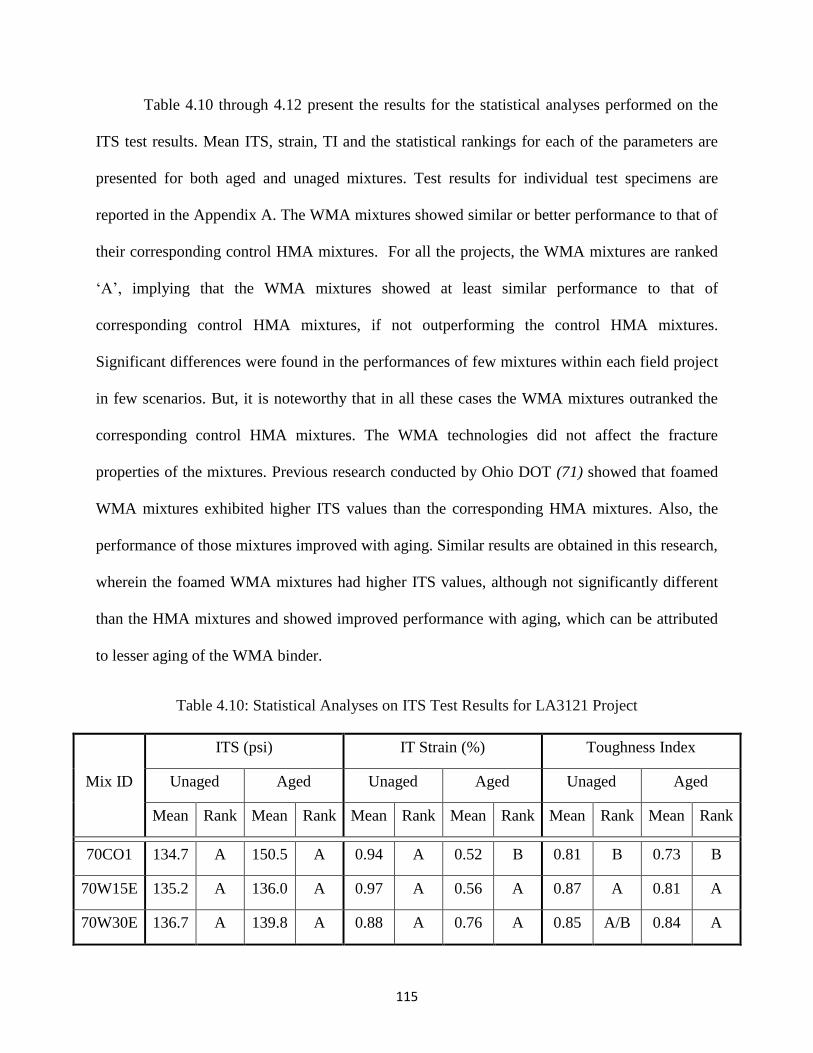
115
Table 4.10 through 4.12 present the results for the statistical analyses performed on the
ITS test results. Mean ITS, strain, TI and the statistical rankings for each of the parameters are
presented for both aged and unaged mixtures. Test results for individual test specimens are
reported in the Appendix A. The WMA mixtures showed similar or better performance to that of
their corresponding control HMA mixtures. For all the projects, the WMA mixtures are ranked
‘A’, implying that the WMA mixtures showed at least similar performance to that of
corresponding control HMA mixtures, if not outperforming the control HMA mixtures.
Significant differences were found in the performances of few mixtures within each field project
in few scenarios. But, it is noteworthy that in all these cases the WMA mixtures outranked the
corresponding control HMA mixtures. The WMA technologies did not affect the fracture
properties of the mixtures. Previous research conducted by Ohio DOT (71) showed that foamed
WMA mixtures exhibited higher ITS values than the corresponding HMA mixtures. Also, the
performance of those mixtures improved with aging. Similar results are obtained in this research,
wherein the foamed WMA mixtures had higher ITS values, although not significantly different
than the HMA mixtures and showed improved performance with aging, which can be attributed
to lesser aging of the WMA binder.
Table 4.10: Statistical Analyses on ITS Test Results for LA3121 Project
Mix ID
ITS (psi) IT Strain (%) Toughness Index
Unaged Aged Unaged Aged Unaged Aged
Mean Rank Mean Rank Mean Rank Mean Rank Mean Rank Mean Rank
70CO1 134.7 A 150.5 A 0.94 A 0.52 B 0.81 B 0.73 B
70W15E 135.2 A 136.0 A 0.97 A 0.56 A 0.87 A 0.81 A
70W30E 136.7 A 139.8 A 0.88 A 0.76 A 0.85 A/B 0.84 A
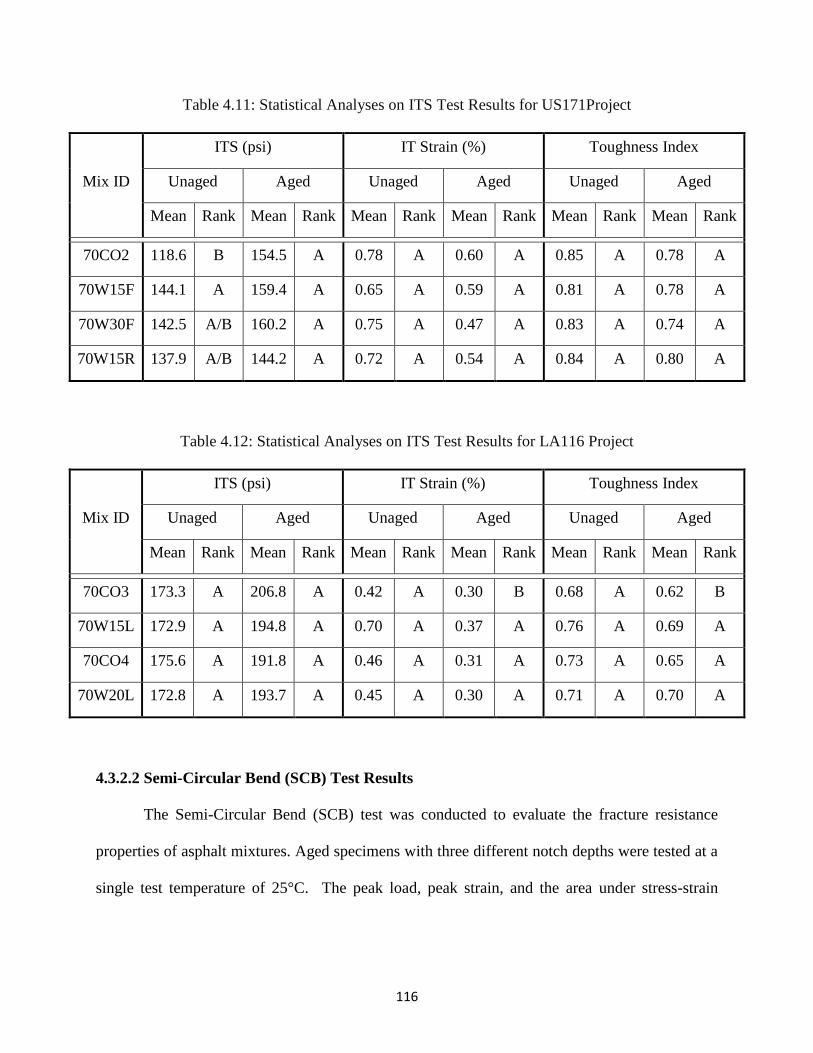
116
Table 4.11: Statistical Analyses on ITS Test Results for US171Project
Mix ID
ITS (psi) IT Strain (%) Toughness Index
Unaged Aged Unaged Aged Unaged Aged
Mean Rank Mean Rank Mean Rank Mean Rank Mean Rank Mean Rank
70CO2 118.6 B 154.5 A 0.78 A 0.60 A 0.85 A 0.78 A
70W15F 144.1 A 159.4 A 0.65 A 0.59 A 0.81 A 0.78 A
70W30F 142.5 A/B 160.2 A 0.75 A 0.47 A 0.83 A 0.74 A
70W15R 137.9 A/B 144.2 A 0.72 A 0.54 A 0.84 A 0.80 A
Table 4.12: Statistical Analyses on ITS Test Results for LA116 Project
Mix ID
ITS (psi) IT Strain (%) Toughness Index
Unaged Aged Unaged Aged Unaged Aged
Mean Rank Mean Rank Mean Rank Mean Rank Mean Rank Mean Rank
70CO3 173.3 A 206.8 A 0.42 A 0.30 B 0.68 A 0.62 B
70W15L 172.9 A 194.8 A 0.70 A 0.37 A 0.76 A 0.69 A
70CO4 175.6 A 191.8 A 0.46 A 0.31 A 0.73 A 0.65 A
70W20L 172.8 A 193.7 A 0.45 A 0.30 A 0.71 A 0.70 A
4.3.2.2 Semi-Circular Bend (SCB) Test Results
The Semi-Circular Bend (SCB) test was conducted to evaluate the fracture resistance
properties of asphalt mixtures. Aged specimens with three different notch depths were tested at a
single test temperature of 25°C. The peak load, peak strain, and the area under stress-strain
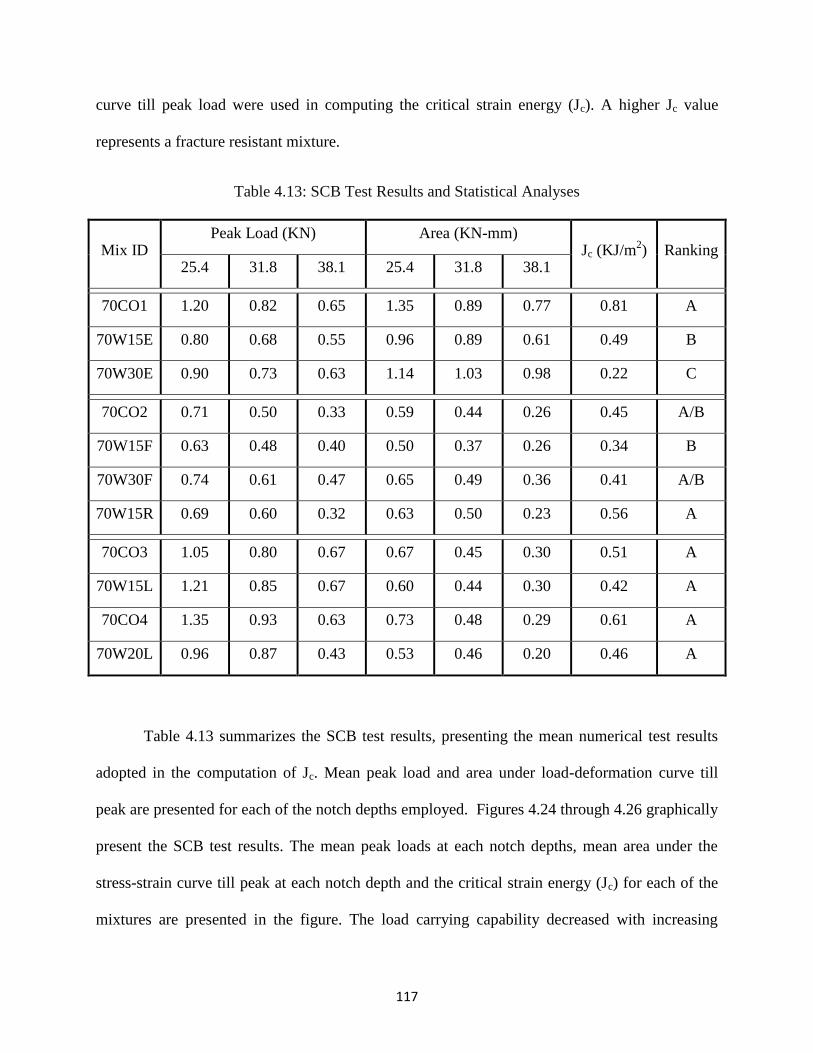
117
curve till peak load were used in computing the critical strain energy (Jc). A higher Jc value
represents a fracture resistant mixture.
Table 4.13: SCB Test Results and Statistical Analyses
Mix ID Peak Load (KN) Area (KN-mm)
Jc (KJ/m2) Ranking
25.4 31.8 38.1 25.4 31.8 38.1
70CO1 1.20 0.82 0.65 1.35 0.89 0.77 0.81 A
70W15E 0.80 0.68 0.55 0.96 0.89 0.61 0.49 B
70W30E 0.90 0.73 0.63 1.14 1.03 0.98 0.22 C
70CO2 0.71 0.50 0.33 0.59 0.44 0.26 0.45 A/B
70W15F 0.63 0.48 0.40 0.50 0.37 0.26 0.34 B
70W30F 0.74 0.61 0.47 0.65 0.49 0.36 0.41 A/B
70W15R 0.69 0.60 0.32 0.63 0.50 0.23 0.56 A
70CO3 1.05 0.80 0.67 0.67 0.45 0.30 0.51 A
70W15L 1.21 0.85 0.67 0.60 0.44 0.30 0.42 A
70CO4 1.35 0.93 0.63 0.73 0.48 0.29 0.61 A
70W20L 0.96 0.87 0.43 0.53 0.46 0.20 0.46 A
Table 4.13 summarizes the SCB test results, presenting the mean numerical test results
adopted in the computation of Jc. Mean peak load and area under load-deformation curve till
peak are presented for each of the notch depths employed. Figures 4.24 through 4.26 graphically
present the SCB test results. The mean peak loads at each notch depths, mean area under the
stress-strain curve till peak at each notch depth and the critical strain energy (Jc) for each of the
mixtures are presented in the figure. The load carrying capability decreased with increasing
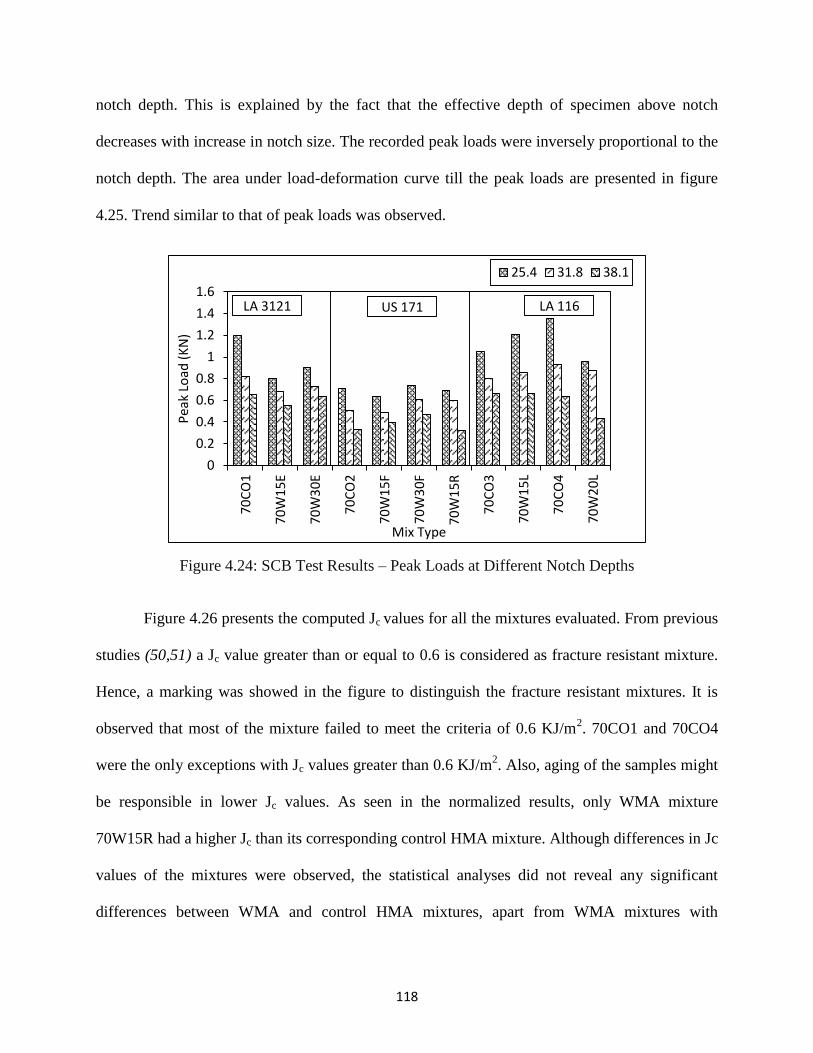
118
notch depth. This is explained by the fact that the effective depth of specimen above notch
decreases with increase in notch size. The recorded peak loads were inversely proportional to the
notch depth. The area under load-deformation curve till the peak loads are presented in figure
4.25. Trend similar to that of peak loads was observed.
Figure 4.24: SCB Test Results – Peak Loads at Different Notch Depths
Figure 4.26 presents the computed Jc values for all the mixtures evaluated. From previous
studies (50,51) a Jc value greater than or equal to 0.6 is considered as fracture resistant mixture.
Hence, a marking was showed in the figure to distinguish the fracture resistant mixtures. It is
observed that most of the mixture failed to meet the criteria of 0.6 KJ/m2. 70CO1 and 70CO4
were the only exceptions with Jc values greater than 0.6 KJ/m2. Also, aging of the samples might
be responsible in lower Jc values. As seen in the normalized results, only WMA mixture
70W15R had a higher Jc than its corresponding control HMA mixture. Although differences in Jc
values of the mixtures were observed, the statistical analyses did not reveal any significant
differences between WMA and control HMA mixtures, apart from WMA mixtures with
0
0.2
0.4
0.6
0.8
1
1.2
1.4
1.6
70
CO
1
70
W1
5E
70
W3
0E
70
CO
2
70W
15F
70W
30F
70W
15R
70
CO
3
70
W1
5L
70
CO
4
70
W2
0L
Pea
k Lo
ad (
KN
)
Mix Type
25.4 31.8 38.1
LA 3121 US 171 LA 116
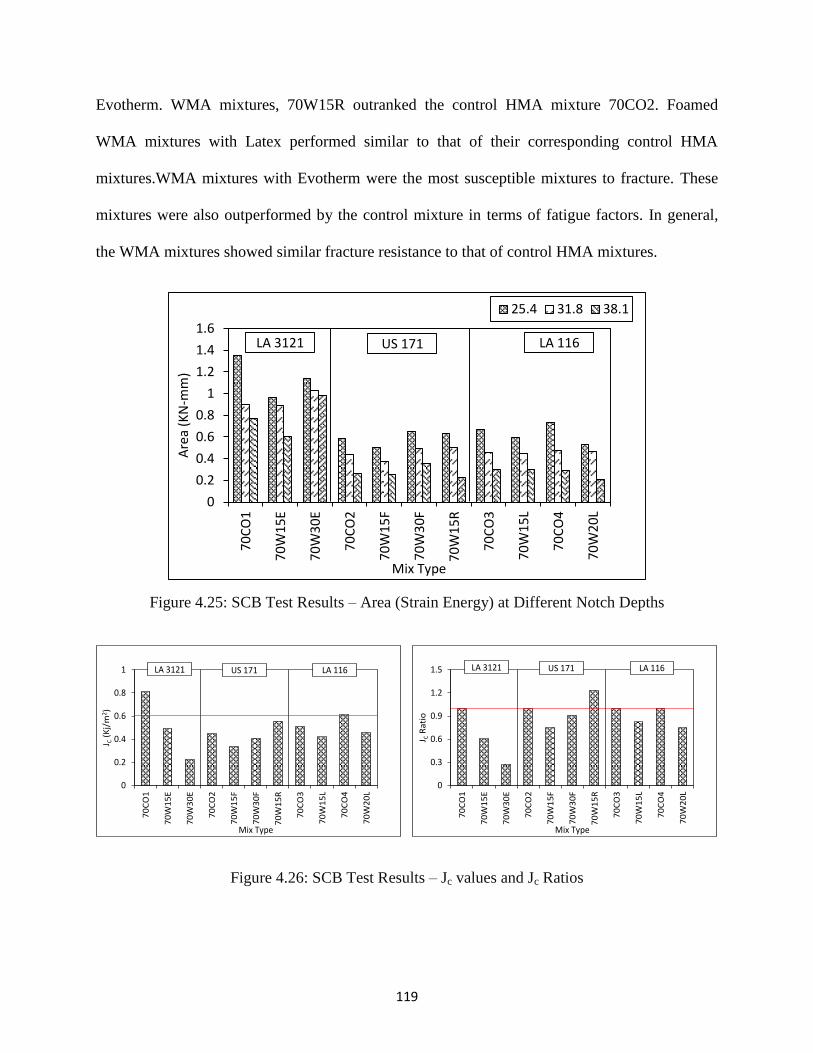
119
Evotherm. WMA mixtures, 70W15R outranked the control HMA mixture 70CO2. Foamed
WMA mixtures with Latex performed similar to that of their corresponding control HMA
mixtures.WMA mixtures with Evotherm were the most susceptible mixtures to fracture. These
mixtures were also outperformed by the control mixture in terms of fatigue factors. In general,
the WMA mixtures showed similar fracture resistance to that of control HMA mixtures.
Figure 4.25: SCB Test Results – Area (Strain Energy) at Different Notch Depths
Figure 4.26: SCB Test Results – Jc values and Jc Ratios
0
0.2
0.4
0.6
0.8
1
1.2
1.4
1.6
70C
O1
70W
15
E
70W
30E
70C
O2
70W
15
F
70W
30F
70W
15R
70C
O3
70W
15L
70C
O4
70W
20
L
Are
a (K
N-m
m)
Mix Type
25.4 31.8 38.1
LA 3121 US 171 LA 116
0
0.3
0.6
0.9
1.2
1.5
70
CO
1
70
W1
5E
70
W3
0E
70
CO
2
70
W1
5F
70
W3
0F
70
W1
5R
70
CO
3
70
W1
5L
70
CO
4
70
W2
0L
J CR
ati
o
Mix Type
LA 3121 US 171 LA 116
0
0.2
0.4
0.6
0.8
1
70
CO
1
70
W1
5E
70
W3
0E
70
CO
2
70
W1
5F
70
W3
0F
70
W1
5R
70
CO
3
70
W1
5L
70
CO
4
70
W2
0L
J C(K
j/m
2)
Mix Type
LA 3121 US 171 LA 116
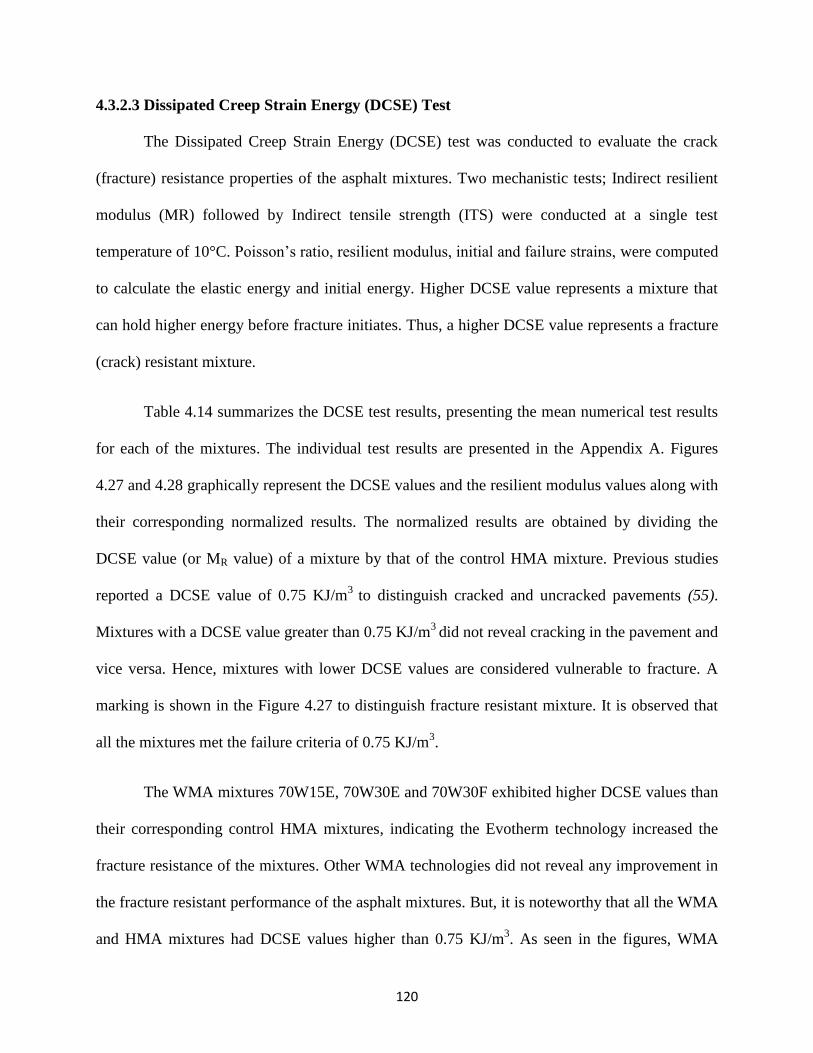
120
4.3.2.3 Dissipated Creep Strain Energy (DCSE) Test
The Dissipated Creep Strain Energy (DCSE) test was conducted to evaluate the crack
(fracture) resistance properties of the asphalt mixtures. Two mechanistic tests; Indirect resilient
modulus (MR) followed by Indirect tensile strength (ITS) were conducted at a single test
temperature of 10°C. Poisson’s ratio, resilient modulus, initial and failure strains, were computed
to calculate the elastic energy and initial energy. Higher DCSE value represents a mixture that
can hold higher energy before fracture initiates. Thus, a higher DCSE value represents a fracture
(crack) resistant mixture.
Table 4.14 summarizes the DCSE test results, presenting the mean numerical test results
for each of the mixtures. The individual test results are presented in the Appendix A. Figures
4.27 and 4.28 graphically represent the DCSE values and the resilient modulus values along with
their corresponding normalized results. The normalized results are obtained by dividing the
DCSE value (or MR value) of a mixture by that of the control HMA mixture. Previous studies
reported a DCSE value of 0.75 KJ/m3
to distinguish cracked and uncracked pavements (55).
Mixtures with a DCSE value greater than 0.75 KJ/m3
did not reveal cracking in the pavement and
vice versa. Hence, mixtures with lower DCSE values are considered vulnerable to fracture. A
marking is shown in the Figure 4.27 to distinguish fracture resistant mixture. It is observed that
all the mixtures met the failure criteria of 0.75 KJ/m3.
The WMA mixtures 70W15E, 70W30E and 70W30F exhibited higher DCSE values than
their corresponding control HMA mixtures, indicating the Evotherm technology increased the
fracture resistance of the mixtures. Other WMA technologies did not reveal any improvement in
the fracture resistant performance of the asphalt mixtures. But, it is noteworthy that all the WMA
and HMA mixtures had DCSE values higher than 0.75 KJ/m3. As seen in the figures, WMA
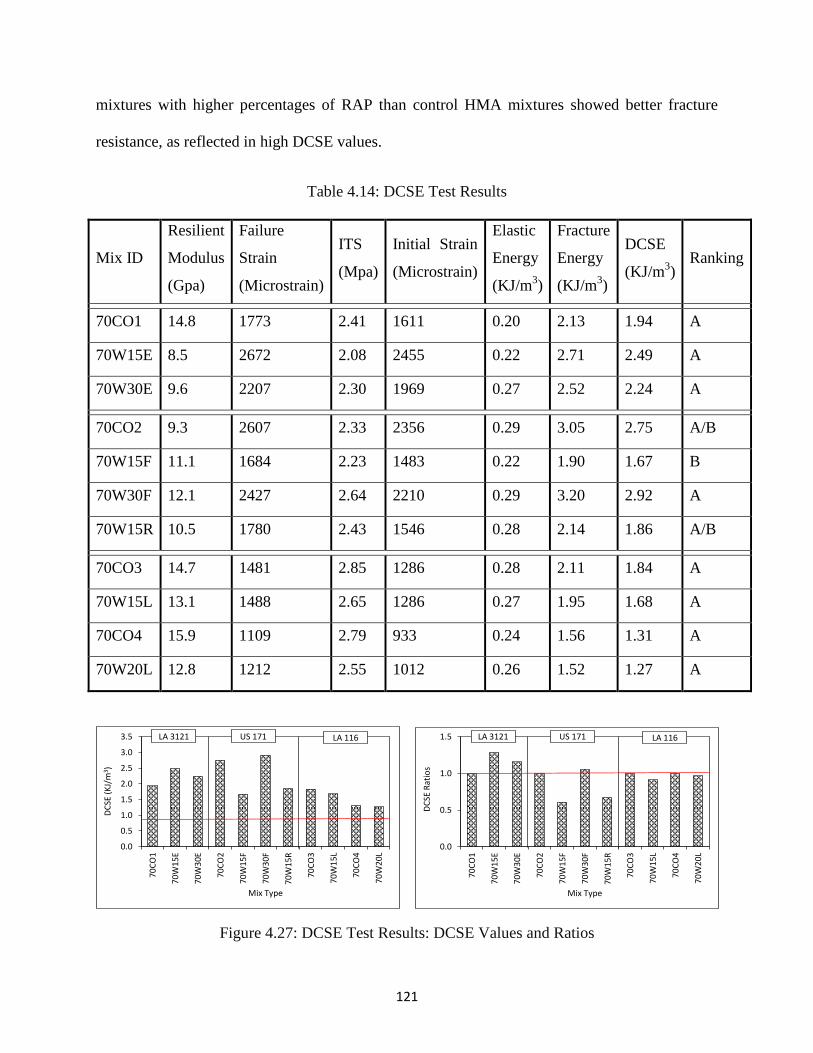
121
mixtures with higher percentages of RAP than control HMA mixtures showed better fracture
resistance, as reflected in high DCSE values.
Table 4.14: DCSE Test Results
Mix ID
Resilient
Modulus
(Gpa)
Failure
Strain
(Microstrain)
ITS
(Mpa)
Initial Strain
(Microstrain)
Elastic
Energy
(KJ/m3)
Fracture
Energy
(KJ/m3)
DCSE
(KJ/m3)
Ranking
70CO1 14.8 1773 2.41 1611 0.20 2.13 1.94 A
70W15E 8.5 2672 2.08 2455 0.22 2.71 2.49 A
70W30E 9.6 2207 2.30 1969 0.27 2.52 2.24 A
70CO2 9.3 2607 2.33 2356 0.29 3.05 2.75 A/B
70W15F 11.1 1684 2.23 1483 0.22 1.90 1.67 B
70W30F 12.1 2427 2.64 2210 0.29 3.20 2.92 A
70W15R 10.5 1780 2.43 1546 0.28 2.14 1.86 A/B
70CO3 14.7 1481 2.85 1286 0.28 2.11 1.84 A
70W15L 13.1 1488 2.65 1286 0.27 1.95 1.68 A
70CO4 15.9 1109 2.79 933 0.24 1.56 1.31 A
70W20L 12.8 1212 2.55 1012 0.26 1.52 1.27 A
Figure 4.27: DCSE Test Results: DCSE Values and Ratios
0.0
0.5
1.0
1.5
2.0
2.5
3.0
3.5
70C
O1
70W
15E
70W
30E
70C
O2
70W
15F
70W
30F
70W
15R
70C
O3
70W
15L
70C
O4
70W
20L
DC
SE (
KJ/
m3)
Mix Type
LA 3121 US 171 LA 116
0.0
0.5
1.0
1.5
70C
O1
70W
15E
70W
30E
70C
O2
70W
15F
70W
30F
70W
15R
70C
O3
70W
15L
70C
O4
70W
20L
DC
SE R
atio
s
Mix Type
LA 3121 US 171 LA 116
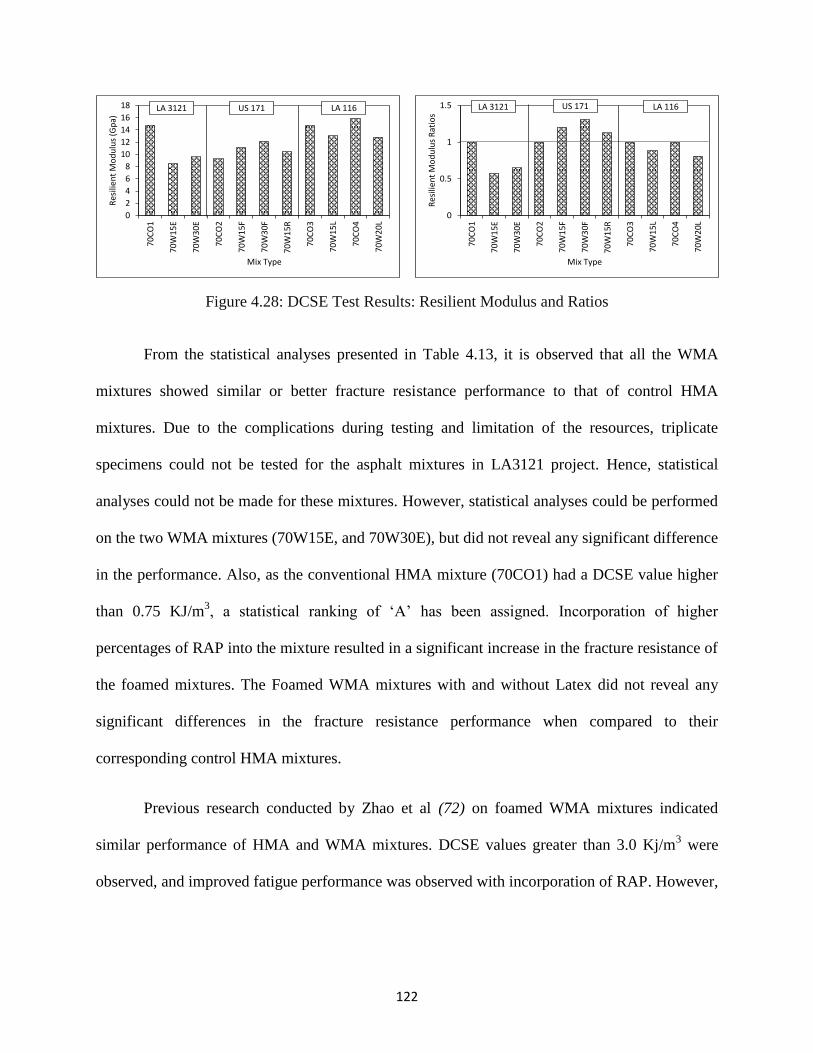
122
Figure 4.28: DCSE Test Results: Resilient Modulus and Ratios
From the statistical analyses presented in Table 4.13, it is observed that all the WMA
mixtures showed similar or better fracture resistance performance to that of control HMA
mixtures. Due to the complications during testing and limitation of the resources, triplicate
specimens could not be tested for the asphalt mixtures in LA3121 project. Hence, statistical
analyses could not be made for these mixtures. However, statistical analyses could be performed
on the two WMA mixtures (70W15E, and 70W30E), but did not reveal any significant difference
in the performance. Also, as the conventional HMA mixture (70CO1) had a DCSE value higher
than 0.75 KJ/m3, a statistical ranking of ‘A’ has been assigned. Incorporation of higher
percentages of RAP into the mixture resulted in a significant increase in the fracture resistance of
the foamed mixtures. The Foamed WMA mixtures with and without Latex did not reveal any
significant differences in the fracture resistance performance when compared to their
corresponding control HMA mixtures.
Previous research conducted by Zhao et al (72) on foamed WMA mixtures indicated
similar performance of HMA and WMA mixtures. DCSE values greater than 3.0 Kj/m3 were
observed, and improved fatigue performance was observed with incorporation of RAP. However,
0
2
4
6
8
10
12
14
16
18
70C
O1
70W
15E
70W
30E
70C
O2
70W
15F
70W
30F
70W
15R
70C
O3
70W
15L
70C
O4
70W
20L
Res
ilien
t M
od
ulu
s (G
pa)
Mix Type
LA 3121 US 171 LA 116
0
0.5
1
1.5
70C
O1
70W
15E
70W
30E
70C
O2
70W
15F
70W
30F
70W
15R
70C
O3
70W
15L
70C
O4
70W
20L
Res
ilien
t M
od
ulu
s R
atio
s
Mix Type
LA 3121 US 171 LA 116
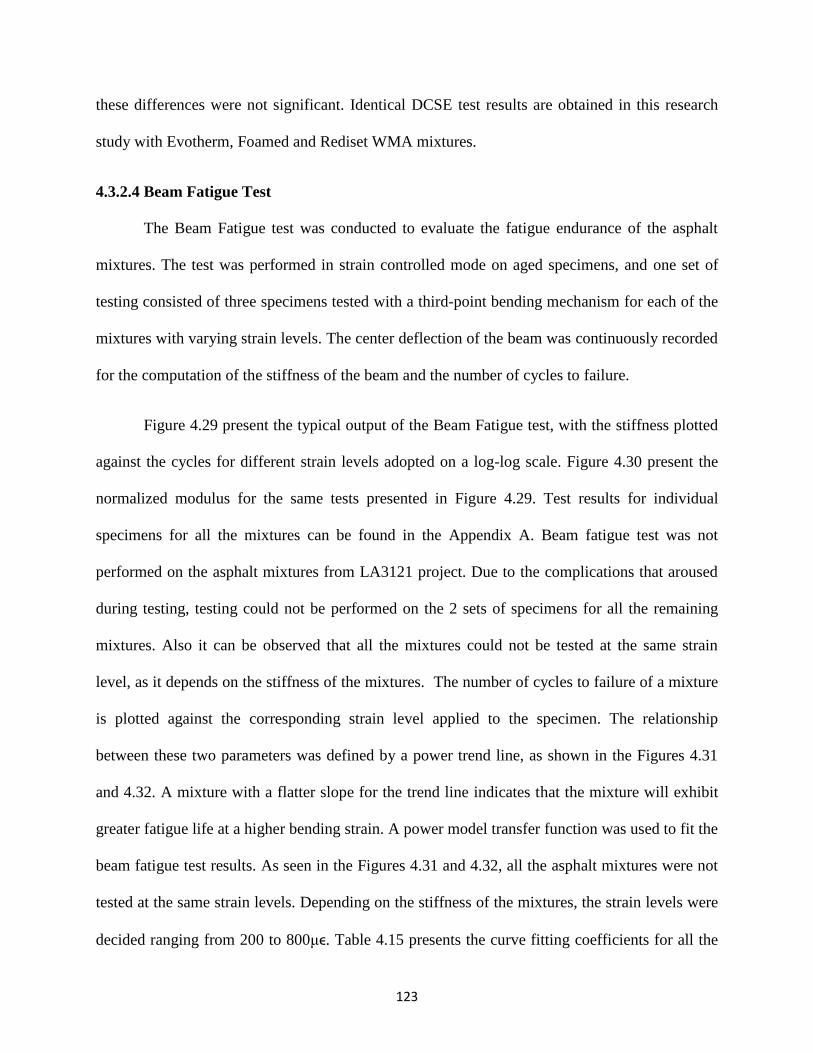
123
these differences were not significant. Identical DCSE test results are obtained in this research
study with Evotherm, Foamed and Rediset WMA mixtures.
4.3.2.4 Beam Fatigue Test
The Beam Fatigue test was conducted to evaluate the fatigue endurance of the asphalt
mixtures. The test was performed in strain controlled mode on aged specimens, and one set of
testing consisted of three specimens tested with a third-point bending mechanism for each of the
mixtures with varying strain levels. The center deflection of the beam was continuously recorded
for the computation of the stiffness of the beam and the number of cycles to failure.
Figure 4.29 present the typical output of the Beam Fatigue test, with the stiffness plotted
against the cycles for different strain levels adopted on a log-log scale. Figure 4.30 present the
normalized modulus for the same tests presented in Figure 4.29. Test results for individual
specimens for all the mixtures can be found in the Appendix A. Beam fatigue test was not
performed on the asphalt mixtures from LA3121 project. Due to the complications that aroused
during testing, testing could not be performed on the 2 sets of specimens for all the remaining
mixtures. Also it can be observed that all the mixtures could not be tested at the same strain
level, as it depends on the stiffness of the mixtures. The number of cycles to failure of a mixture
is plotted against the corresponding strain level applied to the specimen. The relationship
between these two parameters was defined by a power trend line, as shown in the Figures 4.31
and 4.32. A mixture with a flatter slope for the trend line indicates that the mixture will exhibit
greater fatigue life at a higher bending strain. A power model transfer function was used to fit the
beam fatigue test results. As seen in the Figures 4.31 and 4.32, all the asphalt mixtures were not
tested at the same strain levels. Depending on the stiffness of the mixtures, the strain levels were
decided ranging from 200 to 800μϵ. Table 4.15 presents the curve fitting coefficients for all the
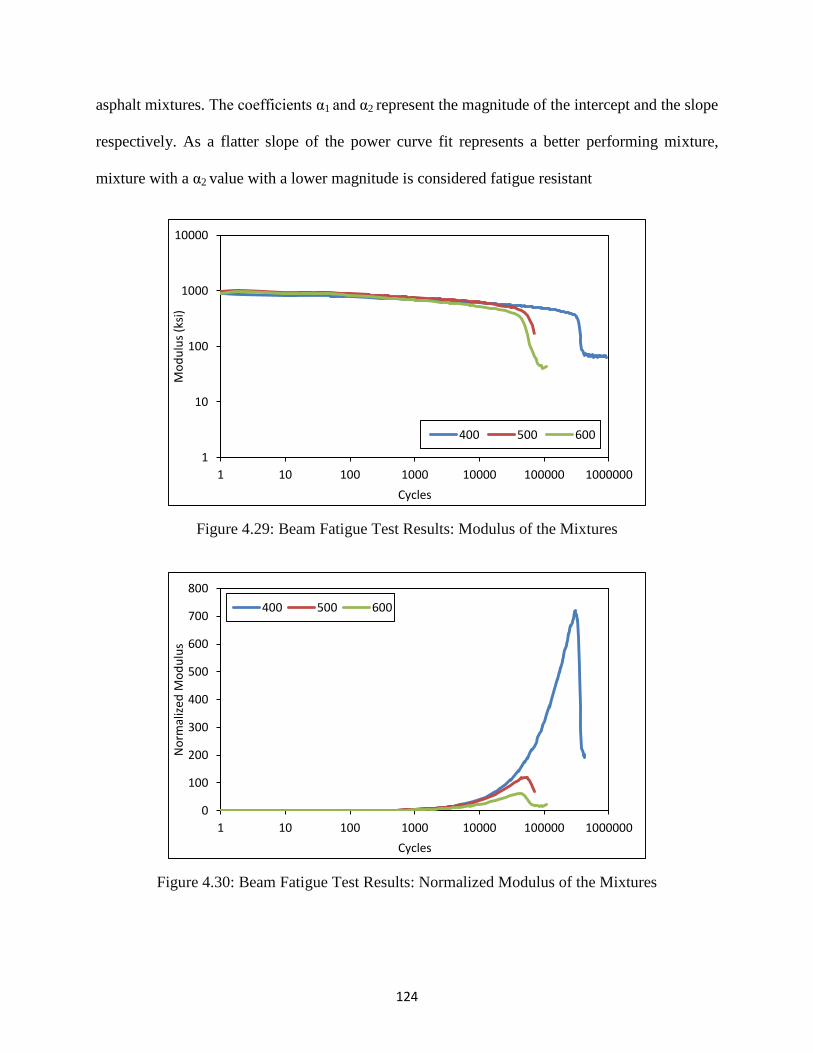
124
asphalt mixtures. The coefficients α1 and α2 represent the magnitude of the intercept and the slope
respectively. As a flatter slope of the power curve fit represents a better performing mixture,
mixture with a α2 value with a lower magnitude is considered fatigue resistant
Figure 4.29: Beam Fatigue Test Results: Modulus of the Mixtures
Figure 4.30: Beam Fatigue Test Results: Normalized Modulus of the Mixtures
1
10
100
1000
10000
1 10 100 1000 10000 100000 1000000
Mo
du
lus
(ksi
)
Cycles
400 500 600
0
100
200
300
400
500
600
700
800
1 10 100 1000 10000 100000 1000000
No
rmal
ized
Mo
du
lus
Cycles
400 500 600
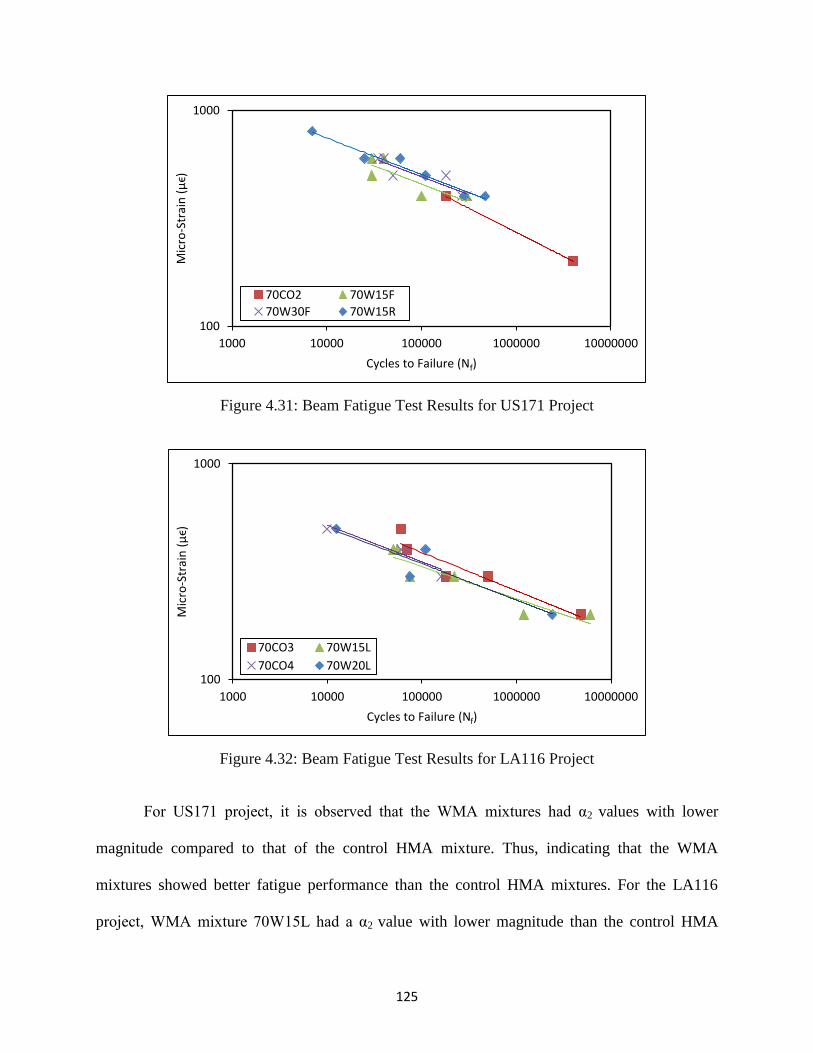
125
Figure 4.31: Beam Fatigue Test Results for US171 Project
Figure 4.32: Beam Fatigue Test Results for LA116 Project
For US171 project, it is observed that the WMA mixtures had α2 values with lower
magnitude compared to that of the control HMA mixture. Thus, indicating that the WMA
mixtures showed better fatigue performance than the control HMA mixtures. For the LA116
project, WMA mixture 70W15L had a α2 value with lower magnitude than the control HMA
100
1000
1000 10000 100000 1000000 10000000
Mic
ro-S
trai
n (
μϵ)
Cycles to Failure (Nf)
70CO2 70W15F
70W30F 70W15R
100
1000
1000 10000 100000 1000000 10000000
Mic
ro-S
trai
n (
μϵ)
Cycles to Failure (Nf)
70CO3 70W15L
70CO4 70W20L
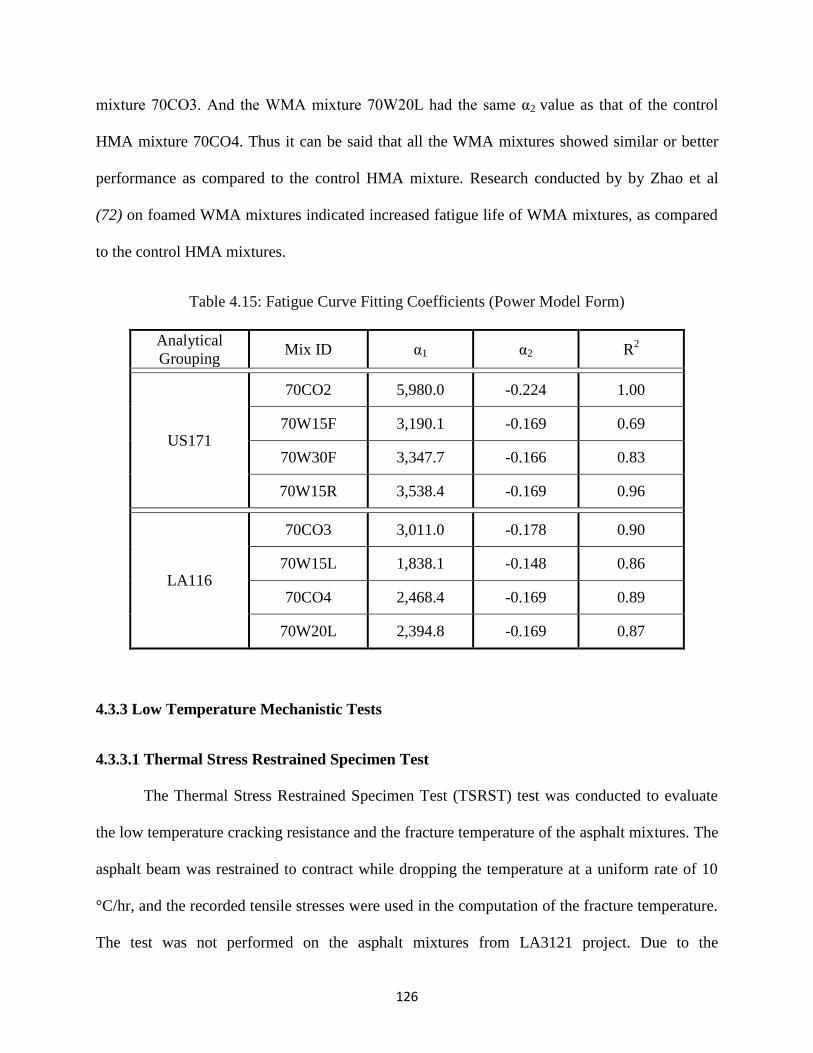
126
mixture 70CO3. And the WMA mixture 70W20L had the same α2 value as that of the control
HMA mixture 70CO4. Thus it can be said that all the WMA mixtures showed similar or better
performance as compared to the control HMA mixture. Research conducted by by Zhao et al
(72) on foamed WMA mixtures indicated increased fatigue life of WMA mixtures, as compared
to the control HMA mixtures.
Table 4.15: Fatigue Curve Fitting Coefficients (Power Model Form)
Analytical
Grouping Mix ID α1 α2 R
2
US171
70CO2 5,980.0 -0.224 1.00
70W15F 3,190.1 -0.169 0.69
70W30F 3,347.7 -0.166 0.83
70W15R 3,538.4 -0.169 0.96
LA116
70CO3 3,011.0 -0.178 0.90
70W15L 1,838.1 -0.148 0.86
70CO4 2,468.4 -0.169 0.89
70W20L 2,394.8 -0.169 0.87
4.3.3 Low Temperature Mechanistic Tests
4.3.3.1 Thermal Stress Restrained Specimen Test
The Thermal Stress Restrained Specimen Test (TSRST) test was conducted to evaluate
the low temperature cracking resistance and the fracture temperature of the asphalt mixtures. The
asphalt beam was restrained to contract while dropping the temperature at a uniform rate of 10
°C/hr, and the recorded tensile stresses were used in the computation of the fracture temperature.
The test was not performed on the asphalt mixtures from LA3121 project. Due to the
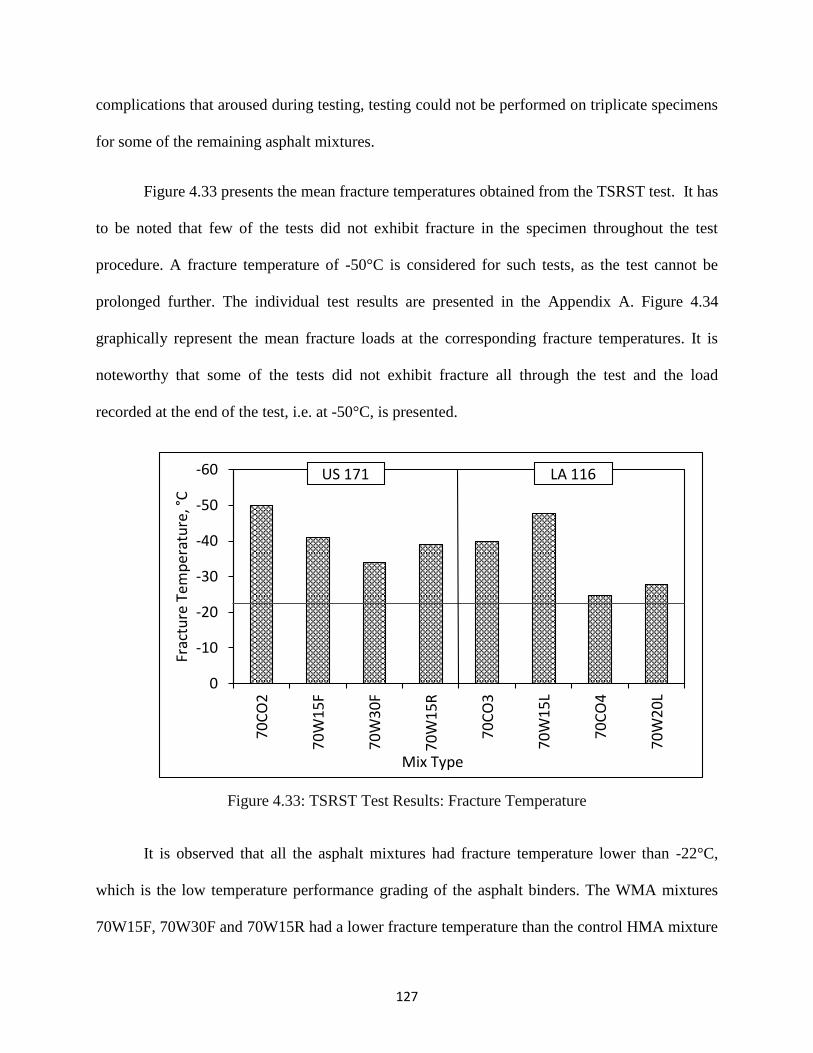
127
complications that aroused during testing, testing could not be performed on triplicate specimens
for some of the remaining asphalt mixtures.
Figure 4.33 presents the mean fracture temperatures obtained from the TSRST test. It has
to be noted that few of the tests did not exhibit fracture in the specimen throughout the test
procedure. A fracture temperature of -50°C is considered for such tests, as the test cannot be
prolonged further. The individual test results are presented in the Appendix A. Figure 4.34
graphically represent the mean fracture loads at the corresponding fracture temperatures. It is
noteworthy that some of the tests did not exhibit fracture all through the test and the load
recorded at the end of the test, i.e. at -50°C, is presented.
Figure 4.33: TSRST Test Results: Fracture Temperature
It is observed that all the asphalt mixtures had fracture temperature lower than -22°C,
which is the low temperature performance grading of the asphalt binders. The WMA mixtures
70W15F, 70W30F and 70W15R had a lower fracture temperature than the control HMA mixture
-60
-50
-40
-30
-20
-10
0
70C
O2
70W
15F
70W
30
F
70W
15R
70C
O3
70W
15L
70C
O4
70W
20
L
Frac
ture
Tem
per
atu
re, °
C
Mix Type
US 171 LA 116
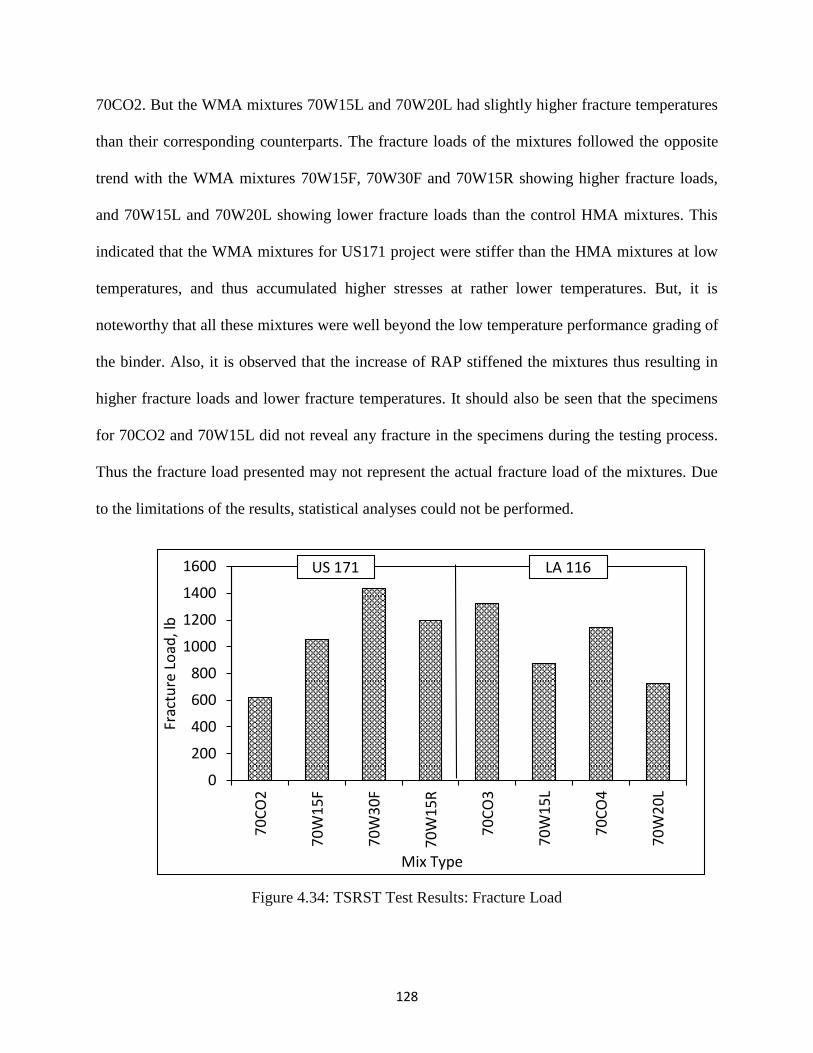
128
70CO2. But the WMA mixtures 70W15L and 70W20L had slightly higher fracture temperatures
than their corresponding counterparts. The fracture loads of the mixtures followed the opposite
trend with the WMA mixtures 70W15F, 70W30F and 70W15R showing higher fracture loads,
and 70W15L and 70W20L showing lower fracture loads than the control HMA mixtures. This
indicated that the WMA mixtures for US171 project were stiffer than the HMA mixtures at low
temperatures, and thus accumulated higher stresses at rather lower temperatures. But, it is
noteworthy that all these mixtures were well beyond the low temperature performance grading of
the binder. Also, it is observed that the increase of RAP stiffened the mixtures thus resulting in
higher fracture loads and lower fracture temperatures. It should also be seen that the specimens
for 70CO2 and 70W15L did not reveal any fracture in the specimens during the testing process.
Thus the fracture load presented may not represent the actual fracture load of the mixtures. Due
to the limitations of the results, statistical analyses could not be performed.
Figure 4.34: TSRST Test Results: Fracture Load
0
200
400
600
800
1000
1200
1400
1600
70
CO
2
70W
15F
70W
30
F
70W
15R
70
CO
3
70
W1
5L
70
CO
4
70
W2
0L
Frac
ture
Lo
ad, l
b
Mix Type
US 171 LA 116
129
4.3.4 Durability
4.3.4.1 Modified Lottman Test
The Modified Lottman Test was performed to evaluate the moisture induced damage of
the asphalt mixtures. Two sets of samples; Conditioned and Controlled (Unconditioned)
specimens were tested for each of the mixtures to compute the Tensile Strength and the Tensile
Strength Ratio (TSR). A higher TSR value represents a durable (moisture damage resistant)
mixture. A mixture with a TSR value of 80% or higher is considered moisture damage resistant.
Tables 4.16 summarize the Modified Lottman Test results. The mean tensile strength values for
the controlled and the conditioned specimens, and the TSR values of the asphalt mixtures are
presented in the tables. The statistical rankings are also presented in the table. Figures 4.35 and
4.36 graphically present the test results.
Figure 4.35 presents the mean tensile strengths of both the conditioned and controlled
specimens of the asphalt mixtures. As seen in the Figure 4.35, the controlled set of specimens
exhibited higher strength values than the conditioned set of specimens, illustrating the obvious
effect of the moisture conditioning. Figure 4.36 graphically present the mean TSR values and the
normalized TSR ratios. It is noted that some of the mixtures did not meet the Louisiana DOT
specification of 80% TSR. It is worth noting that, in general, these mixtures have a conditioned
IDT strength equal to or greater than 100 psi, a strength value associated with well-performing
mixtures in Louisiana (73). Additionally, the LWT test conducted in the wet mode did not show
any stripping problems.
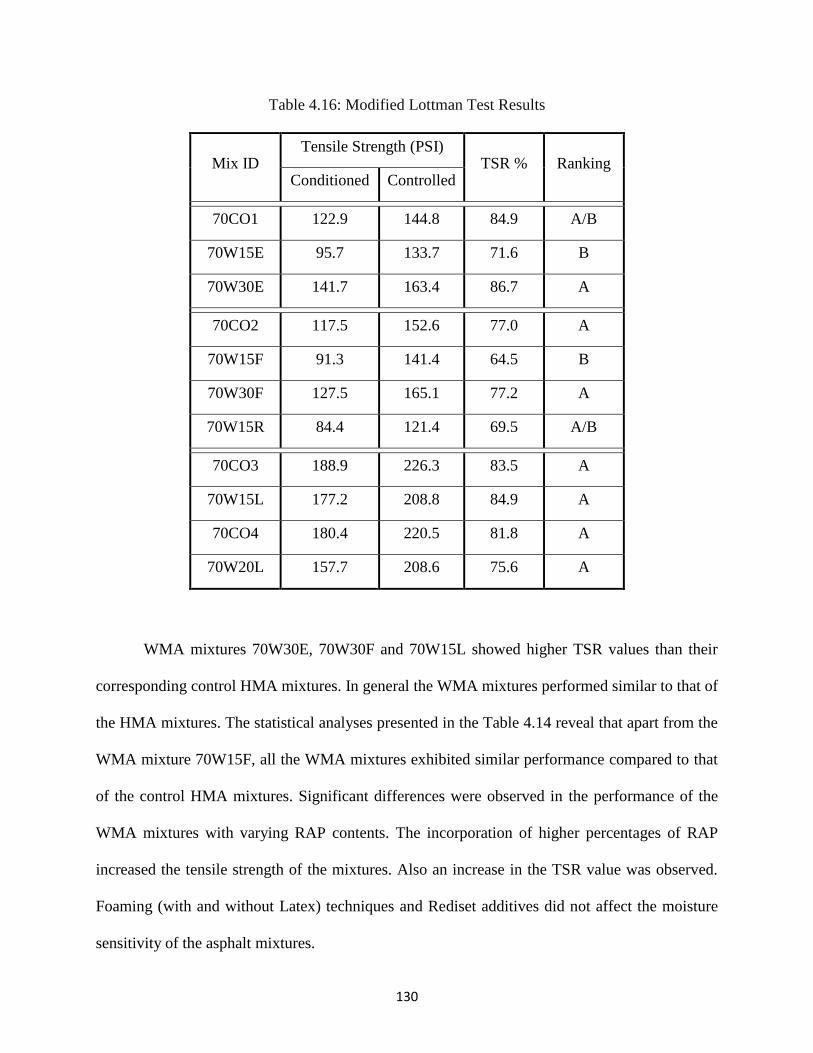
130
Table 4.16: Modified Lottman Test Results
Mix ID Tensile Strength (PSI)
TSR % Ranking Conditioned Controlled
70CO1 122.9 144.8 84.9 A/B
70W15E 95.7 133.7 71.6 B
70W30E 141.7 163.4 86.7 A
70CO2 117.5 152.6 77.0 A
70W15F 91.3 141.4 64.5 B
70W30F 127.5 165.1 77.2 A
70W15R 84.4 121.4 69.5 A/B
70CO3 188.9 226.3 83.5 A
70W15L 177.2 208.8 84.9 A
70CO4 180.4 220.5 81.8 A
70W20L 157.7 208.6 75.6 A
WMA mixtures 70W30E, 70W30F and 70W15L showed higher TSR values than their
corresponding control HMA mixtures. In general the WMA mixtures performed similar to that of
the HMA mixtures. The statistical analyses presented in the Table 4.14 reveal that apart from the
WMA mixture 70W15F, all the WMA mixtures exhibited similar performance compared to that
of the control HMA mixtures. Significant differences were observed in the performance of the
WMA mixtures with varying RAP contents. The incorporation of higher percentages of RAP
increased the tensile strength of the mixtures. Also an increase in the TSR value was observed.
Foaming (with and without Latex) techniques and Rediset additives did not affect the moisture
sensitivity of the asphalt mixtures.
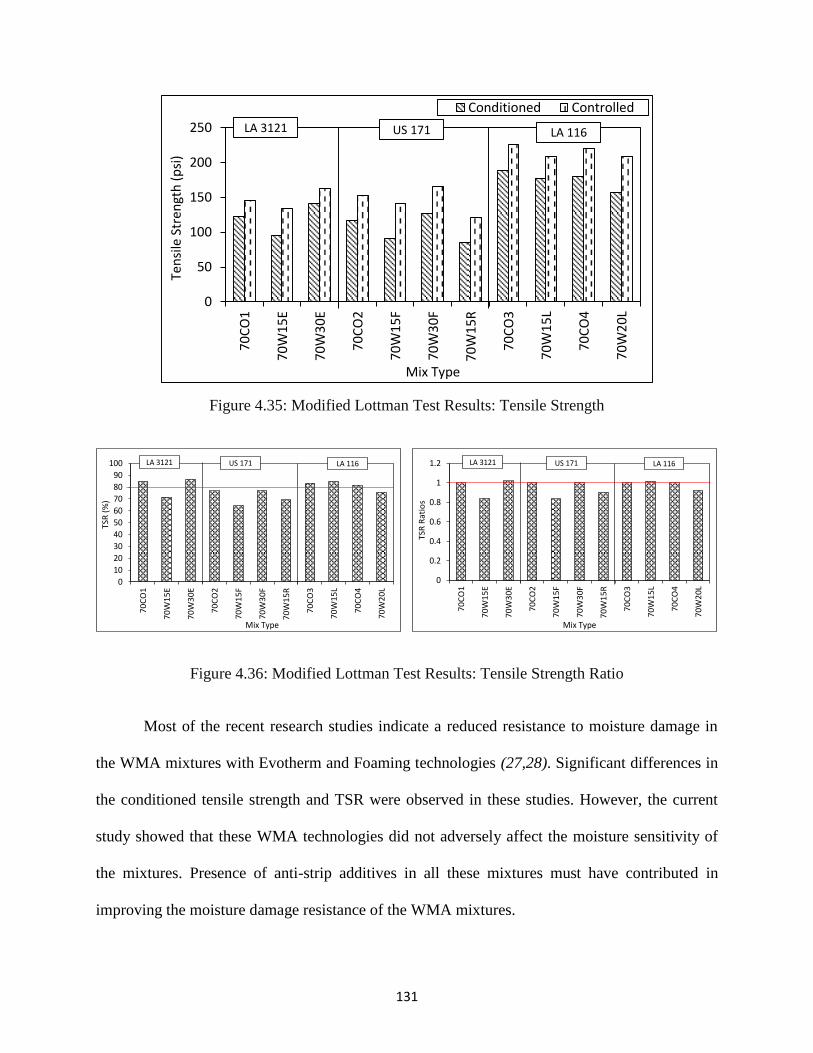
131
Figure 4.35: Modified Lottman Test Results: Tensile Strength
Figure 4.36: Modified Lottman Test Results: Tensile Strength Ratio
Most of the recent research studies indicate a reduced resistance to moisture damage in
the WMA mixtures with Evotherm and Foaming technologies (27,28). Significant differences in
the conditioned tensile strength and TSR were observed in these studies. However, the current
study showed that these WMA technologies did not adversely affect the moisture sensitivity of
the mixtures. Presence of anti-strip additives in all these mixtures must have contributed in
improving the moisture damage resistance of the WMA mixtures.
0
50
100
150
200
250
70C
O1
70W
15
E
70W
30
E
70C
O2
70W
15F
70W
30F
70W
15R
70C
O3
70W
15L
70C
O4
70W
20L
Ten
sile
Str
engt
h (
psi
)
Mix Type
Conditioned Controlled
LA 3121 US 171 LA 116
0
0.2
0.4
0.6
0.8
1
1.27
0C
O1
70
W1
5E
70
W3
0E
70
CO
2
70
W1
5F
70
W3
0F
70
W1
5R
70
CO
3
70
W1
5L
70
CO
4
70
W2
0L
TSR
Rat
ios
Mix Type
LA 3121 US 171 LA 116
0
10
20
30
40
50
60
70
80
90
100
70
CO
1
70
W1
5E
70
W3
0E
70
CO
2
70
W1
5F
70
W3
0F
70
W1
5R
70
CO
3
70
W1
5L
70
CO
4
70
W2
0L
TSR
(%
)
Mix Type
LA 3121 US 171 LA 116
132
4.4 Statistical Ranking of the Asphalt Mixtures
Table 4.17 summarizes the overall statistical ranking of the asphalt mixtures employed in
the study. The statistical evaluation of the mixtures employed three distinct performance criteria:
Rutting Performance (Permanent Deformation), Fatigue/Fracture Performance, and Durability
(Moisture susceptibility) of the mixtures. The evaluation of rutting performance included the
parameters Rut depth, Flow Number, Rut Factor and E* values at 54.4C and 5Hz. The
fatigue/fracture evaluation employed the Toughness Index, DCSE values, Jc and the fatigue
factor. TSR was employed in assessing the durability of the mixtures. Results from couple of the
mechanistic tests (Beam Fatigue and TSRST) could not be employed in the overall ranking due
to limitations in performing the statistical analyses. Also, these tests could not be performed for
the asphalt mixtures from LA3121 project. The statistical rankings obtained by each mixture
were designated by letters A, B, and C, with ‘A’ assigned to the best performing mixture,
followed by B and C. The analytical grouping of the mixtures is done according to the individual
field projects. As reported, the eleven mixtures evaluated in this study were grouped in to three
groupings.
In general, from the overall ranking of the mixtures it can by hypothesized that the WMA
mixture showed similar performance to that of the control HMA mixtures. For the analytical
grouping of LA3121, no significant differences were found in the high temperature (rutting)
performance of the mixtures. No significant difference was found in the moisture sensitivity of
the WMA and the control HMA mixtures. The fatigue performance criteria revealed few
differences in the performance of the mixtures. It has to be noted that majority of the parameters
considered did not show significant difference between the WMA and the control HMA
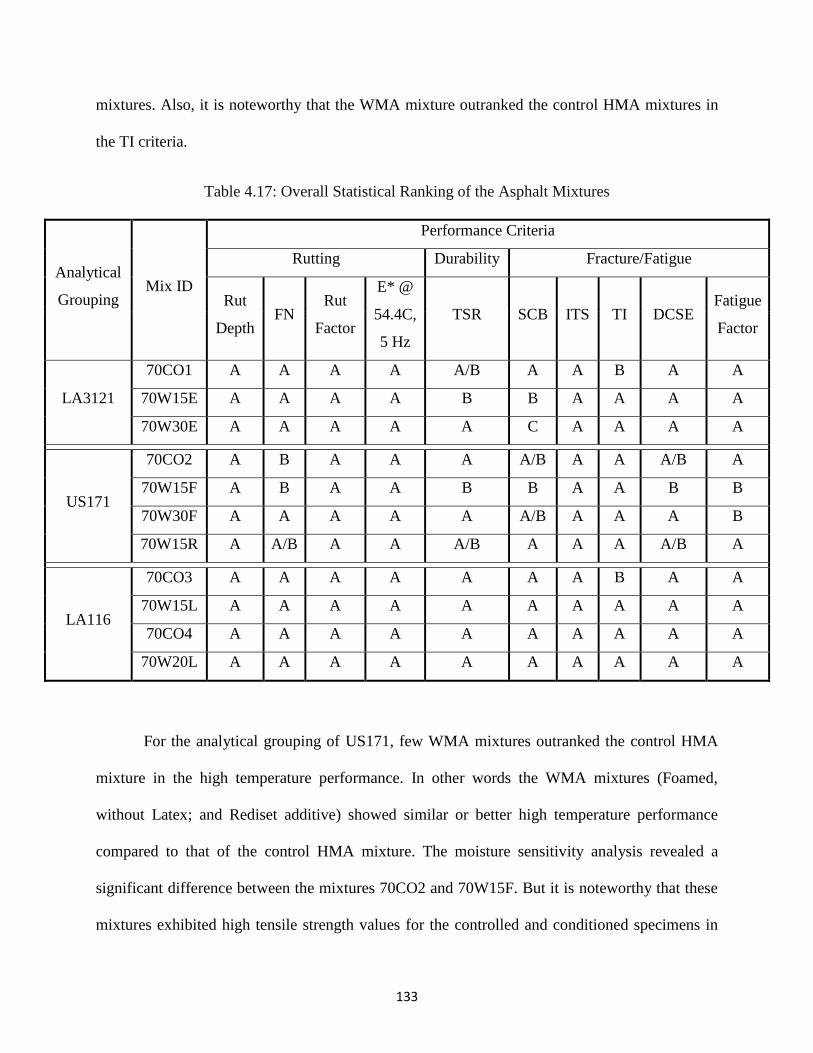
133
mixtures. Also, it is noteworthy that the WMA mixture outranked the control HMA mixtures in
the TI criteria.
Table 4.17: Overall Statistical Ranking of the Asphalt Mixtures
Analytical
Grouping Mix ID
Performance Criteria
Rutting Durability Fracture/Fatigue
Rut
Depth FN
Rut
Factor
E* @
54.4C,
5 Hz
TSR SCB ITS TI DCSE Fatigue
Factor
LA3121
70CO1 A A A A A/B A A B A A
70W15E A A A A B B A A A A
70W30E A A A A A C A A A A
US171
70CO2 A B A A A A/B A A A/B A
70W15F A B A A B B A A B B
70W30F A A A A A A/B A A A B
70W15R A A/B A A A/B A A A A/B A
LA116
70CO3 A A A A A A A B A A
70W15L A A A A A A A A A A
70CO4 A A A A A A A A A A
70W20L A A A A A A A A A A
For the analytical grouping of US171, few WMA mixtures outranked the control HMA
mixture in the high temperature performance. In other words the WMA mixtures (Foamed,
without Latex; and Rediset additive) showed similar or better high temperature performance
compared to that of the control HMA mixture. The moisture sensitivity analysis revealed a
significant difference between the mixtures 70CO2 and 70W15F. But it is noteworthy that these
mixtures exhibited high tensile strength values for the controlled and conditioned specimens in
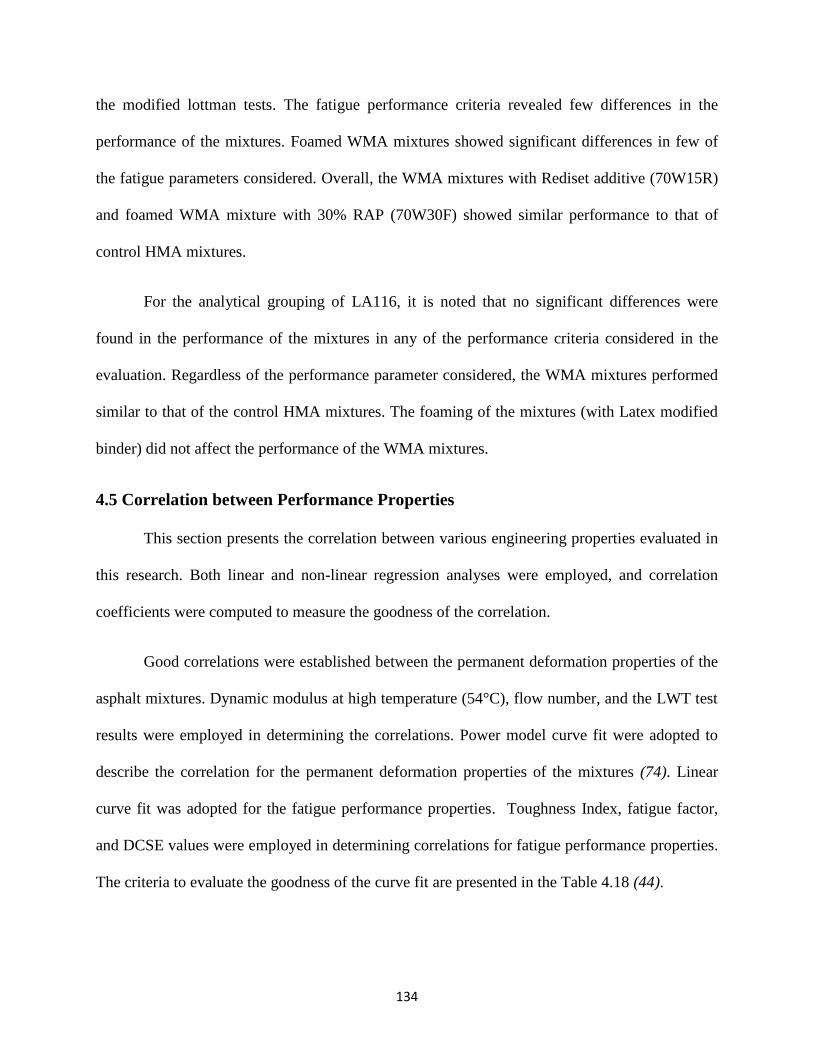
134
the modified lottman tests. The fatigue performance criteria revealed few differences in the
performance of the mixtures. Foamed WMA mixtures showed significant differences in few of
the fatigue parameters considered. Overall, the WMA mixtures with Rediset additive (70W15R)
and foamed WMA mixture with 30% RAP (70W30F) showed similar performance to that of
control HMA mixtures.
For the analytical grouping of LA116, it is noted that no significant differences were
found in the performance of the mixtures in any of the performance criteria considered in the
evaluation. Regardless of the performance parameter considered, the WMA mixtures performed
similar to that of the control HMA mixtures. The foaming of the mixtures (with Latex modified
binder) did not affect the performance of the WMA mixtures.
4.5 Correlation between Performance Properties
This section presents the correlation between various engineering properties evaluated in
this research. Both linear and non-linear regression analyses were employed, and correlation
coefficients were computed to measure the goodness of the correlation.
Good correlations were established between the permanent deformation properties of the
asphalt mixtures. Dynamic modulus at high temperature (54°C), flow number, and the LWT test
results were employed in determining the correlations. Power model curve fit were adopted to
describe the correlation for the permanent deformation properties of the mixtures (74). Linear
curve fit was adopted for the fatigue performance properties. Toughness Index, fatigue factor,
and DCSE values were employed in determining correlations for fatigue performance properties.
The criteria to evaluate the goodness of the curve fit are presented in the Table 4.18 (44).
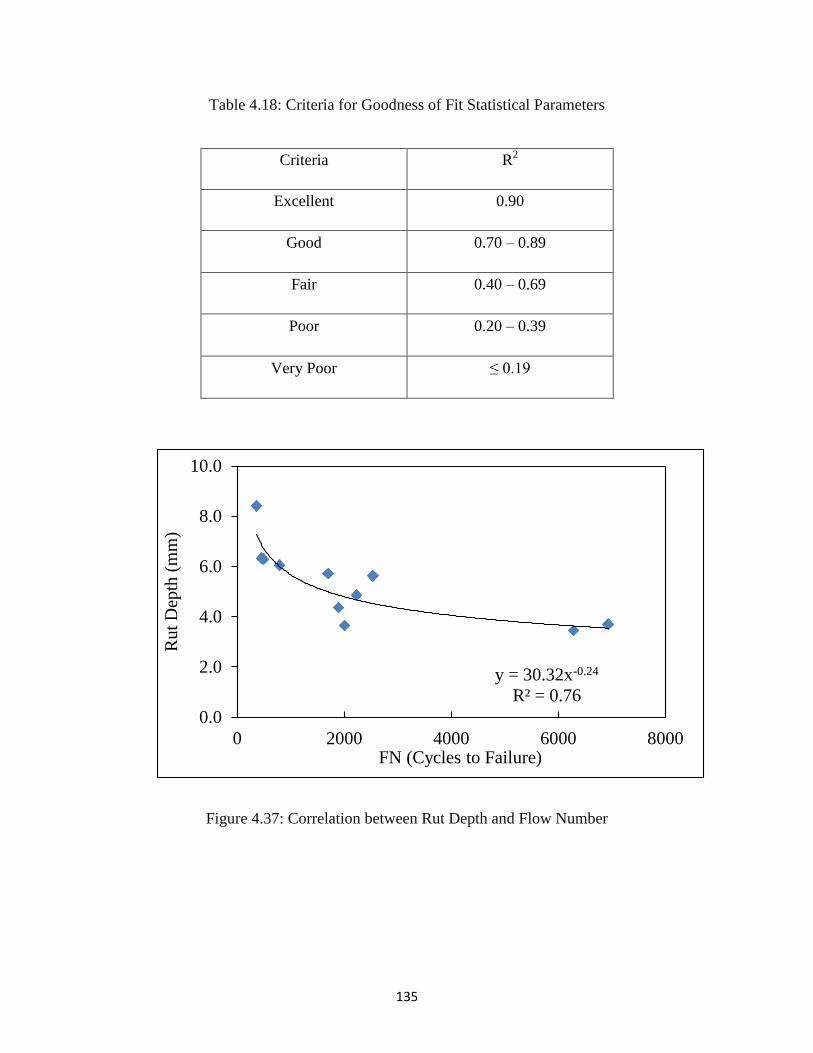
135
Table 4.18: Criteria for Goodness of Fit Statistical Parameters
Criteria R2
Excellent 0.90
Good 0.70 – 0.89
Fair 0.40 – 0.69
Poor 0.20 – 0.39
Very Poor ≤ 0.19
Figure 4.37: Correlation between Rut Depth and Flow Number
y = 30.32x-0.24
R² = 0.76
0.0
2.0
4.0
6.0
8.0
10.0
0 2000 4000 6000 8000
Rut
Dep
th (
mm
)
FN (Cycles to Failure)
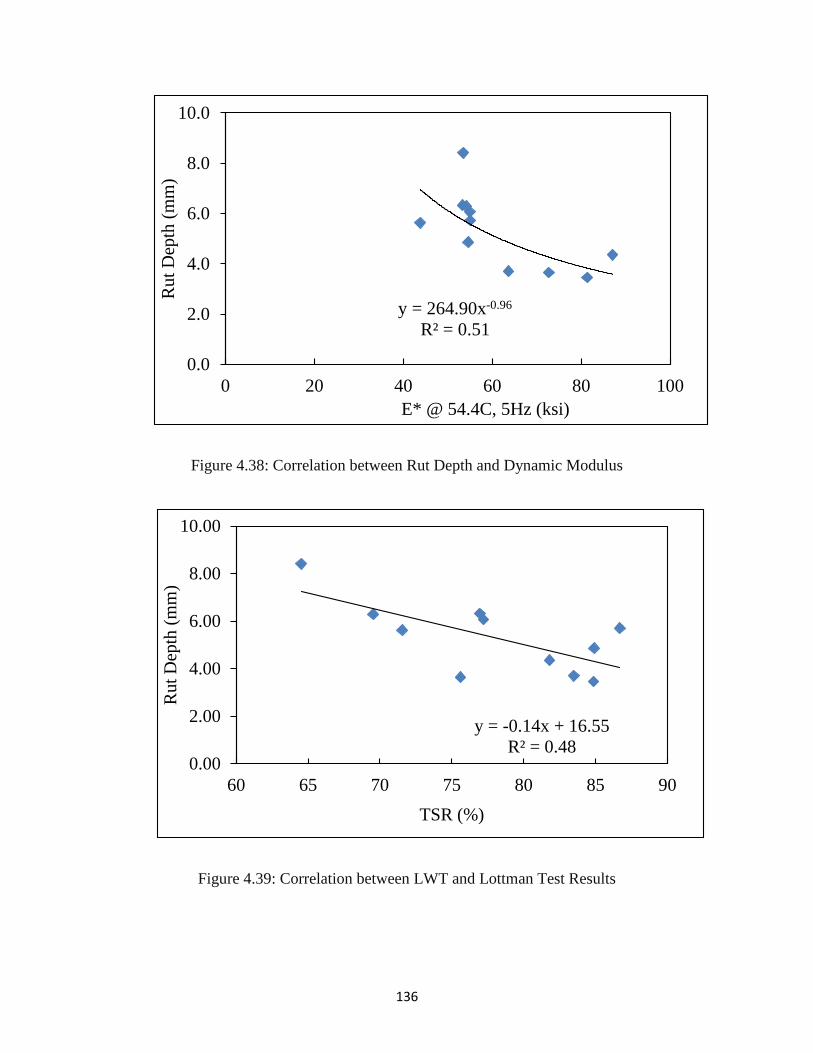
136
Figure 4.38: Correlation between Rut Depth and Dynamic Modulus
Figure 4.39: Correlation between LWT and Lottman Test Results
y = 264.90x-0.96
R² = 0.51
0.0
2.0
4.0
6.0
8.0
10.0
0 20 40 60 80 100
Ru
t D
epth
(m
m)
E* @ 54.4C, 5Hz (ksi)
y = -0.14x + 16.55
R² = 0.480.00
2.00
4.00
6.00
8.00
10.00
60 65 70 75 80 85 90
Ru
t D
epth
(m
m)
TSR (%)
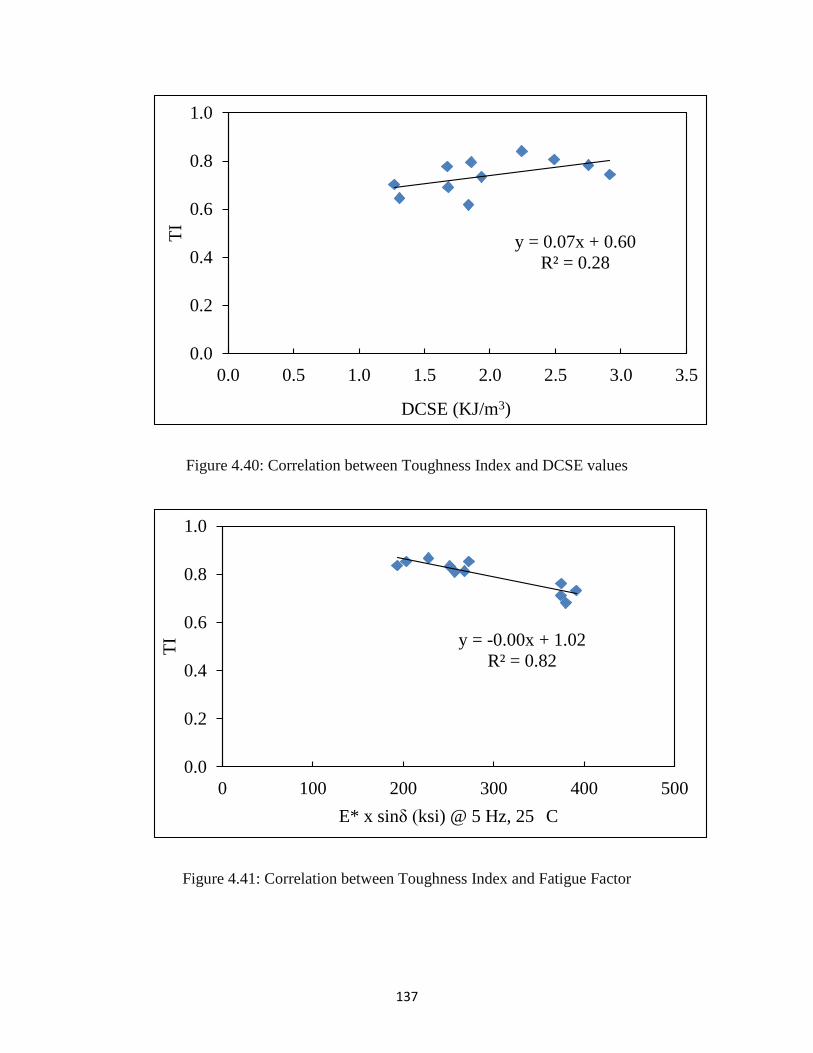
137
Figure 4.40: Correlation between Toughness Index and DCSE values
Figure 4.41: Correlation between Toughness Index and Fatigue Factor
y = 0.07x + 0.60
R² = 0.28
0.0
0.2
0.4
0.6
0.8
1.0
0.0 0.5 1.0 1.5 2.0 2.5 3.0 3.5
TI
DCSE (KJ/m3)
y = -0.00x + 1.02
R² = 0.82
0.0
0.2
0.4
0.6
0.8
1.0
0 100 200 300 400 500
TI
E* x sinδ (ksi) @ 5 Hz, 25
C
138
Figures 4.37 and 4.38 present the power fit correlation between rut depth and FN, and rut
depth and E* at 54.4°C, 5 Hz; with R2 values of 0.76 and 051 (good and fair curve fit)
respectively. Mixtures with higher rut depths had lower E* and FN values and vice-versa. These
power models can also be used to predict either of the parameters when the other parameter is
known. Figure 4.39 presents the correlation between rut depth and the TSR values of the
mixtures. The curve fit showed a fair fit with R2 value of 0.48. Mixtures with lower TSR values
had higher rut depths, which are expected. Figures 4.40 and 4.41 present the correlation for the
fatigue performance properties. A poor correlation was found between the toughness index and
DCSE values. Toughness index and fatigue factors showed good correlations. Mixtures with
higher TI and lower fatigue factor represent fatigue resistant mixtures.
4.6 Cost and Energy Analysis
4.6.1 Economic Impacts
Table 4.18 summarizes the fuel savings in the three field projects and a comparison
between the HMA and WMA energy costs. The reduction in energy consumption for WMA
productions was surveyed from the three asphalt plants which produced the mixtures for this
study. The survey data were then used to calculate the overall cost per ton of HMA and WMA,
respectively, to finally determine the energy cost savings of WMA productions. The type of fuel
used in each of the three field projects is also reported. Reduced energy consumption was
observed associated with production of asphalt mixtures. Fuel savings ranging from 12 – 14 %
were observed with WMA mixtures. Also, an average energy cost savings of $1.61 per ton of
mixture produced was observed for the WMA mixtures as compared to the HMA mixtures.
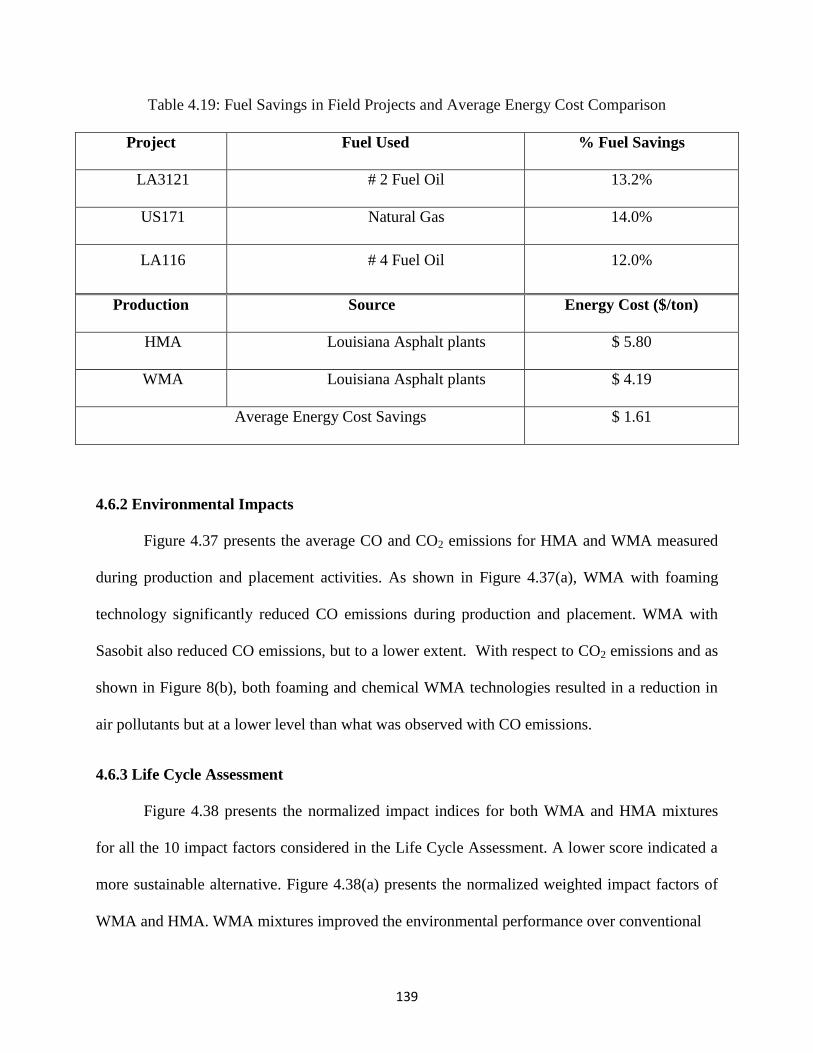
139
Table 4.19: Fuel Savings in Field Projects and Average Energy Cost Comparison
Project Fuel Used % Fuel Savings
LA3121 # 2 Fuel Oil 13.2%
US171 Natural Gas 14.0%
LA116 # 4 Fuel Oil 12.0%
Production Source Energy Cost ($/ton)
HMA Louisiana Asphalt plants $ 5.80
WMA Louisiana Asphalt plants $ 4.19
Average Energy Cost Savings $ 1.61
4.6.2 Environmental Impacts
Figure 4.37 presents the average CO and CO2 emissions for HMA and WMA measured
during production and placement activities. As shown in Figure 4.37(a), WMA with foaming
technology significantly reduced CO emissions during production and placement. WMA with
Sasobit also reduced CO emissions, but to a lower extent. With respect to CO2 emissions and as
shown in Figure 8(b), both foaming and chemical WMA technologies resulted in a reduction in
air pollutants but at a lower level than what was observed with CO emissions.
4.6.3 Life Cycle Assessment
Figure 4.38 presents the normalized impact indices for both WMA and HMA mixtures
for all the 10 impact factors considered in the Life Cycle Assessment. A lower score indicated a
more sustainable alternative. Figure 4.38(a) presents the normalized weighted impact factors of
WMA and HMA. WMA mixtures improved the environmental performance over conventional
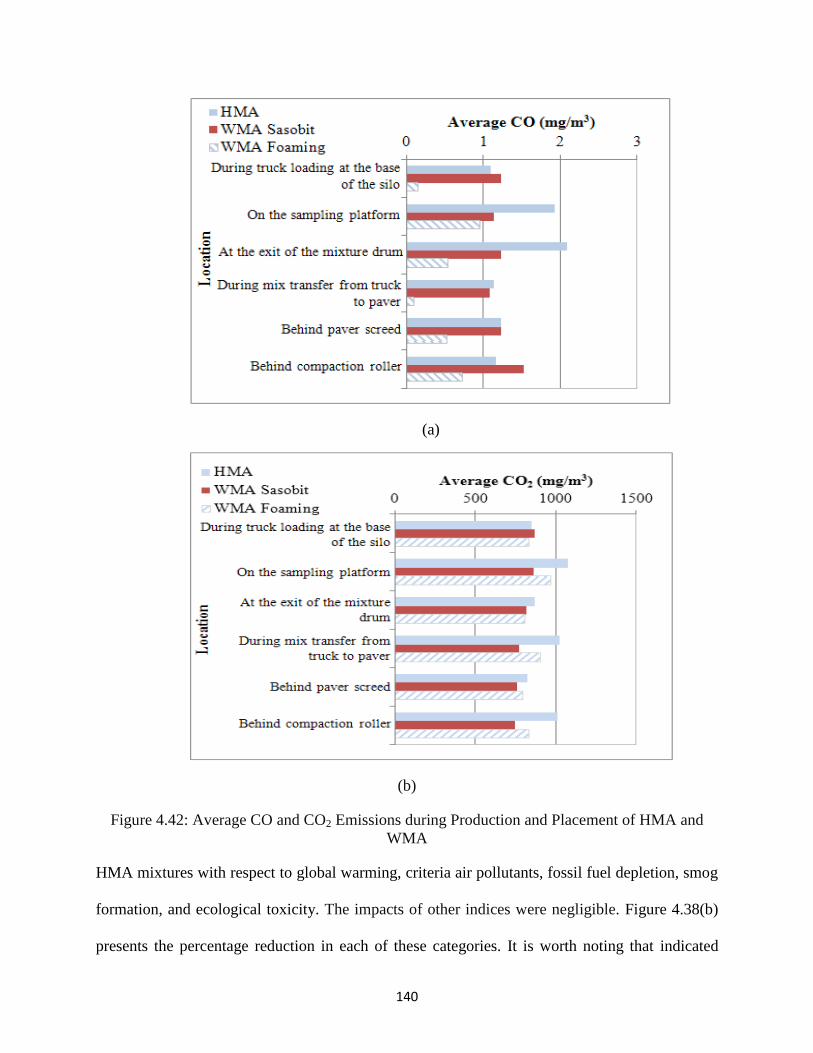
140
(a)
(b)
Figure 4.42: Average CO and CO2 Emissions during Production and Placement of HMA and
WMA
HMA mixtures with respect to global warming, criteria air pollutants, fossil fuel depletion, smog
formation, and ecological toxicity. The impacts of other indices were negligible. Figure 4.38(b)
presents the percentage reduction in each of these categories. It is worth noting that indicated
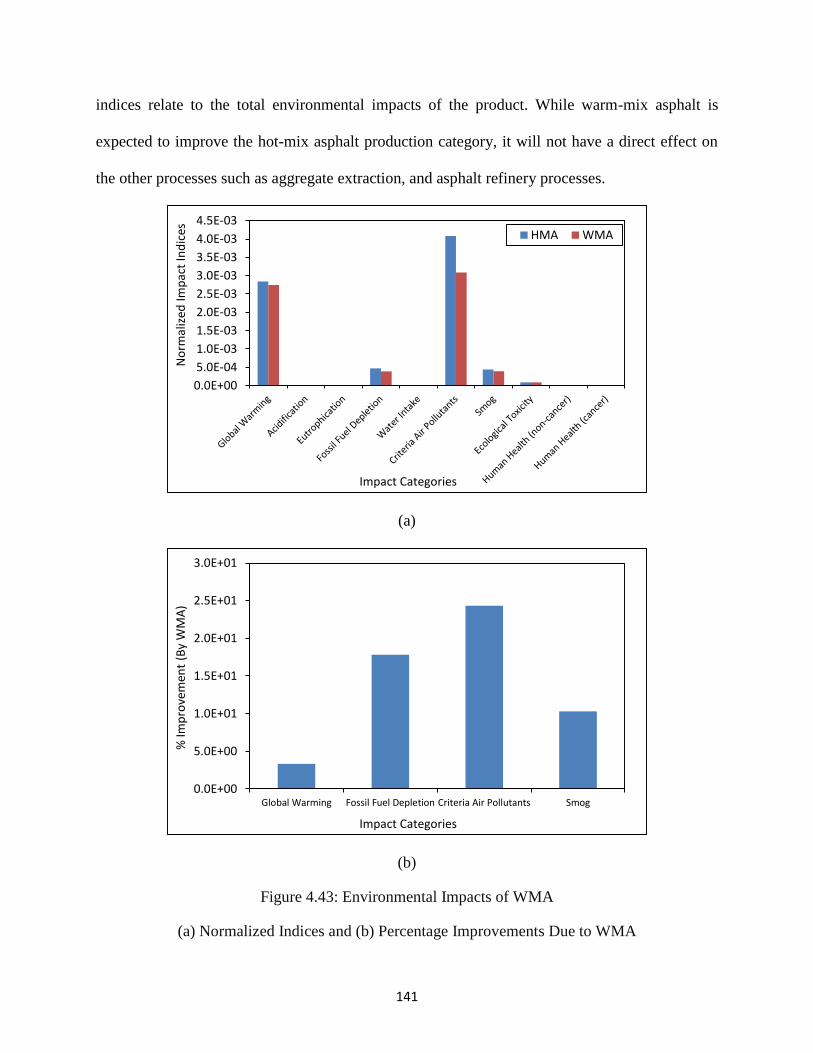
141
indices relate to the total environmental impacts of the product. While warm-mix asphalt is
expected to improve the hot-mix asphalt production category, it will not have a direct effect on
the other processes such as aggregate extraction, and asphalt refinery processes.
(a)
(b)
Figure 4.43: Environmental Impacts of WMA
(a) Normalized Indices and (b) Percentage Improvements Due to WMA
0.0E+00
5.0E-04
1.0E-03
1.5E-03
2.0E-03
2.5E-03
3.0E-03
3.5E-03
4.0E-03
4.5E-03
No
rmal
ized
Imp
act
Ind
ices
Impact Categories
HMA WMA
0.0E+00
5.0E+00
1.0E+01
1.5E+01
2.0E+01
2.5E+01
3.0E+01
Global Warming Fossil Fuel Depletion Criteria Air Pollutants Smog
% Im
pro
vem
ent
(By
WM
A)
Impact Categories
142
CHAPTER 5 : CONCLUSIONS AND RECOMMENDATIONS
5.1 Summary and Conclusions
The study evaluated and quantified the performance of different WMA mixtures across
Louisiana with a corresponding control HMA mixture. Nine 12.5 mm Level 1 Superpave
Wearing course and two 19.0 mm Level 1 Superpave Binder course mixtures were evaluated in
the study, across three different individual projects across the state of Louisiana. Four control
HMA mixtures were evaluated, and the remaining seven mixtures employed different WMA
techniques and additives with varying RAP contents. A comprehensive suite of laboratory
mechanistic testing was carried out the characterize each of the eleven mixtures. Mechanistic
testing was carried out at Low, Intermediate and High temperatures. Indirect Tensile Strength
(ITS) test, Semi-Circular Bend (SCB) Test, Loaded Wheel Tracking (LWT) test, Simple
Performance Tests (Dynamic Modulus Test, Flow Number Test), Dissipated Creep Strain
Energy (DCSE) Test, Thermal Stress Restrained Specimen Test (TSRST), Beam Fatigue Test,
Lottman Test were conducted. The mechanistic test results were adopted in the computation of
different performance characterizing parameters, which were employed in conducting detailed
statistical analyses to quantify the performance of these WMA mixtures compared to that of the
control HMA mixtures. The effect of incorporation of higher percentages of RAP was also
evaluated in this study. Potential environmental and economic benefits of adopting WMA
technologies were evaluated using the fuel consumption data obtained from the HMA plants.
Based upon the results presented herein, the following list of findings can be summarized:
143
All WMA mixtures included in this study showed comparable performance characteristics to
that of HMA mixtures at high, intermediate, and low temperature conditions evaluated by a
comprehensive suite of laboratory performance tests.
The master curves developed from the E* test data revealed that most of the WMA mixtures
showed identical or better performance compared to that of the control HMA mixtures at all
the test temperatures and frequencies adopted. Thus, indicating comparable performance
characteristics at high, intermediate and low temperatures. The WMA foamed mixtures (with
and without latex) and WMA mixture with Rediset showed identical performance to that of
control HMA mixtures at all temperatures. The WMA mixtures with Evotherm showed
identical performance to that of control HMA mixture at low and intermediate temperatures,
but was outperformed at high temperature.
Statistical analyses of the rut factor data indicated similar performances between the WMA
mixtures and the corresponding control HMA mixtures.
The fatigue factor analyses showed few differences in the performance of the mixtures.
WMA mixtures with Evotherm, Rediset and Latex showed similar fatigue performance to
that of the corresponding control HMA mixtures.
The flow number test results showed similar permanent deformation performance between
the mixtures. The statistical analyses showed that all the WMA mixtures performed at least
similar to that of the control HMA mixtures, if not better. Foamed WMA mixture with higher
RAP percentages outperformed the control HMA mixture.
144
The LWT test results did not indicate any significant differences between the permanent
deformation performance of the mixtures. In addition, stripping was not observed for any of
the mixtures. All the WMA mixtures exhibited similar performance to that of the control
HMA mixtures.
There was no difference in the rutting performance of WMA mixtures compared to
corresponding control HMA mixtures for all three projects evaluated. Incorporating higher
percentage of RAP up to 30% did not adversely affect the performance of WMA mixtures
study herein.
The ITS test results showed that the WMA mixtures exhibited similar or better performance
to that of the control HMA mixtures. All the WMA mixtures had similar or better ITS values
as compared to the control HMA mixtures for both aged and unaged specimens. Also, the
WMA mixtures exhibited similar or better Toughness Index values.
All the WMA mixtures possessed lower aging index values, suggesting that lesser aging of
binder took place in the WMA mixtures.
The SCB test results revealed few differences in the fracture performance of the mixtures.
Most of the mixtures (both HMA and WMA) did not meet the specification criteria. WMA
mixtures with Evotherm have been outperformed by the control HMA mixture. Foamed
WMA mixtures (both with and without latex) and WMA mixture with Rediset showed
adequate performance to that of thee control HMA mixtures.
The DCSE test results indicated similar performance of WMA mixtures, with all the WMA
mixtures exhibiting similar DCSE values to that of the control HMA mixtures.
145
The Beam Fatigue test results indicated better fatigue performance of the WMA mixtures as
compared to the control HMA mixtures.
The WMA mixtures showed adequate fracture/fatigue performance as compared to the
control HAM mixtures. Incorporation of higher percentages of RAP did not adversely affect
the performance of the mixtures.
Low temperature evaluation of the WMA mixtures showed adequate performance.
It was observed that, WMA technologies did not adversely affect the moisture sensitivity, as
indicated by the modified Lottman test.
WMA improved the environmental performance over conventional HMA with respect to
global warming; criteria air pollutants, fossil fuel depletion, smog formation, and ecological
toxicity.
Reduced energy consumption associated with producing WMA resulted in fuel savings of
12-14% and an average cost savings of $1.61 per ton of mixture compared to that of HMA.
Based on the findings of this limited study, it can be concluded that the four WMA
technologies evaluated provide considerable environmental and economic benefits without any
reduction in the mechanistic performance of the mixtures. Further research to collect more
environmental and economic data in addition to long-term field performance monitoring is
needed to validate the findings and conclusions of this study.
146
5.2 Recommendations
The research study concluded that the WMA mixtures showed similar or better overall
performance as compared to the conventional HMA mixtures. This study supported previous
research findings that WMA mixtures can be produced at relatively lower temperatures
without affecting the performance of the mixtures. Thus, suggesting that the WMA
technologies can be employed to produce asphalt cement pavements.
As WMA technologies are relatively newly adopted, data on Long-term field performance is
not available. If WMA technologies provide similar field performance and yield economic
and environmental benefits, specifications could be developed to accommodate these new
WMA technologies in the Louisiana superpave asphalt pavements.
147
REFERENCES
1. “Warm Mix Asphalt- A state of the Art Review.” Advisory Note 17, June 2001.
Australian Asphalt Pavement Association.
2. FHWA 2008, “Warm-mix Asphalt: European Practice.” U.S. Department of
Transportation Federal Highway Administration (FHWA) International Technology
Scanning Program, Report No. FHWA-PL-08-007.
3. Muthen, K. M., December 1998, “Foamed Asphalt Mixes – Mix Design Procedure.” CR-
98/077. Sabita ltd and CSIR Transportek, South Africa.
4. Chevron, 1977. Butumuls Mix Manual. Chevron USA, Asphalt Division, California.
5. Maccarrone, S., Holleran, G., and Ky, A., 1994, “Cold Asphalt Systems as an Alternative
to Hot Mix.” Proceedings, 9th International AAPA Conference, Surfers Paradise,
Queensland, Australia.
6. Jenkins, K.J., De Groot, J.L.A., 1999, “Half-Warm Foamed Bitumen Treatment, a New
Process.” 7th Conference on Asphalt Pavements for Southern Africa (CAPSA), Victoria
Falls, South Africa, 1999.
7. Koenders, B.G., Stoker, D.A., 2002, “WAM-Foam, Asphalt Production at Lower
Operating Temperatures.” Proceedings, 9th Conference of International Society for
Asphalt Pavements, Copenhagen, Denmark.
8. Hurley, G.C., and B.D. Prowell, 2006, “Evaluation of Evotherm for Use in Warm Mix
Asphalt,” Report NCAT 06-02, National Center for Asphalt Technology, Auburn
University, Auburn, Alabama.
9. Hurley, G.C., and B.D. Prowell, 2006, “Evaluation of Potential Processes for Use in
Warm Mix Asphalt,” Journal of the Association of Asphalt Paving Technologists,
Volume 75, Savannah, Georgia, pp. 41 – 90.
10. NCAT, 2005, “NCAT Evaluates Warm Mix Asphalt,” Asphalt Technology News,
Volume 17, Number 2, Fall, 2005.
11. Koenders B. G; Stoker D. A; “Innovative process in Asphalt Production and Application
to Obtain Lower Operating Temperature”. 2nd Eurasphalt & Eurobitume Congress,
Barcelona, Spain, September.
12. Dorchies, P.T., M. Chappat, and J. Bilal, 2005, “The Environmental Road of the Future:
Analysis of Energy Consumption and Greenhouse Gas Emissions,” Proceedings,
Canadian Asphalt Technical Association, Volume L, Victoria, B.C., Canada, 2005, pp. 1-
26.
148
13. Environmental Protection Agency (EPA), 2000, “Hot Mix Asphalt Plants Emission
Assessment Report,” EPA 454/R-00-019. U.S. Environmental Protection Agency, Office
of Air and Radiation, Office of Air Quality Planning and Standards, Research Park
Triangle, NC.
14. Goh, S.W., Zhanping, Y., Van Dam, T.J., 2007, “Laboratory Evaluation and Pavement
Design for Warm Mix Asphalt”, 2007 Mid-Continent Transportation research
Symposium, Ames, Iowa.
15. Martins Zaumanis, 2010, "Warm Mix Asphalt Inverstigation." Master's Thesis, Riga
Technical University, Denmark.
16. Steven W. Perkins, 2009, "Synthesis of Warm Mix Asphalt Paving Strategies for Use in
Montana Highway Construction." U.S. Department of Transportation, Federal Highway
Admisnistration, Report No. FHWA/MT-09-009/8117-38.
17. Chowdhury, Arif and Button, Joe, 2008, “A Review of Warm Mix Asphalt. Texas
Transportation Institute.” Springfield, Virginia: National Technical Information Service,
December 2008. Technical report.
18. D'Angelo, John, et al., 2008, “Warm-Mix Asphalt: European Practise.” American Trade
Iniatives. Washington, DC: U.S. Department of Transportation, February 2008.
19. Maccarone, S.; 1994, “Cold asphalt systems as an alternative to hot mix.” AAPA
International Conference, November 1994.
20. Hurley, G.C., and B.D. Prowell, 2005. “Evaluation of Aspha-Min® Zeolite for Use in
Warm Mix Asphalt,” Report NCAT 05-04, National Center for Asphalt Technology,
Auburn University, Auburn, Alabama.
21. Hurley, G.C., and B.D. Prowell, 2005, “Evaluation of Sasobit® for Use in Warm Mix
Asphalt,”Report NCAT 05-06, National Center for Asphalt Technology, Auburn
University, Auburn, Alabama.
22. Prowell, B., G.C. Hurley, and E. Crews, 2007, “Field Performance of Warm Mix Asphalt
at the NCAT Test Track,” Proceedings (CD), 86th Annual Meeting of the Transportation
Research Board, National Academy of Sciences, Washington, D.C.
23. Buss, A., Rashwan, M., Breakah, T., Williams, R.C., Kvasnak, A., 2009, “Investigation
of Warm-Mix Asphalt Using the Mechanistic-Empirical Pavement Design Guide”, 2009
Mid-Continent Transportation research Symposium, Ames, Iowa.
24. Diefenderfer, S., Hearon, A., 2008, “Laboratory Evaluation of a Warm Asphalt
Technology for Use in Virginia”, VTRC 09-R11 Final Report, Virginia Transportation
Research Council, Charlottesville, VA.
149
25. Goh, S.W., You, Z., 2008, "WMA using Sasobit: Field and Laboratory Experience",
Proceedings of the Mid-Continent Transportation Research Forum, Madison, Wisconsin.
26. Russell M., Uhlmeyer J., Weston J., Roseburg J., Moomaw T. and De Vol J., 2009,
"Evaluation of Warm Mix Asphalt." Report no. WA-RD 723.1 65P.
27. Bonaquist, R. "NCHRP 9-43 Mix Design Practices for Warm Mix Asphalt." Interim
Report-National Cooperative Highway Research Program Project 9 43 (2009).
28. Anderson, R. M., et al. "NCHRP 9-47: Engineering Properties, Emissions, and Field
Performance of Warm Mix Asphalt Technologies." Interim Report, TRB, National
Research Council, Washington, DC (2008).
29. Environmental Protection Agency (EPA). The Plain English Guide to the Clean Air Act.
U.S. EPA, Washington, D.C. 2006. http://www.epa.gov/oar/oaqps/peg_caa/pegcaain.html
30. De Groot, P.C., C. Bowen, B.G. Koenders, D.A. Stoker, O. Larsen, J. Johansen, 2001, “A
comparison of emissions from hot mixture and warm asphalt mixture production.” IRF
World Meeting, Paris, 2001.
31. Larsen, O.R., Moen, C. Robertus, B.G. Koenders, 2004, “WAM Foam asphalt production
at lower operating temperatures as an environmental friendly alternative to HMA.” 3rd
Eurasphalt & Eurobitume Congress, Vienna.
32. Barthel, W., J.P. Marchand, M. Von Devivere, 2005, “Warm asphalt mixes by adding a
synthetic zeolite. Eurovia.” www.asphamin.com. Accessed November 2005.
33. Naidoo, P., Fischer-Tropsch, 2005, “Hard Wax Chemistry in Warm Mix Asphalt
Applications.” Presentation document. Petersen Asphalt Research Conference. June
2005.
34. Davidson, J.K., 2005, Evotherm Trial: Aurora, Ontario, August 8 2005. McAsphalt
Engineering Services, Research Centre, Toronto, ON, August 31, 2005.
35. Davidson, J.K., 2006, Evotherm Trial: City of Calgary, September 28 2005. McAsphalt
Engineering Services, Research Centre, Toronto, ON, January 9, 2006
36. Davidson, J.K. Evotherm Trial: Ramara Township, Road 46 October 4 and 5, 2005.
McAsphalt Engineering Services, Research Centre, Toronto, ON, December 12, 2005.
37. Mallick et al, 2009, "A laboratory study on co2 emissions Reductions Through the use of
WMA", 88th Annual Meeting of the Transportation Research Board, January 2009.
38. Abbas R, Ayman Ali M.S, 2011., "Mechanical Properties of WMA Prepared Using
Foamed Asphalt Binders", U.S. Department of Transportation, Federal Highway
Administration, State Job # 134476.
150
39. Louisiana Standard Specifications for Roads and Bridges, Louisiana Department of
Transportation and Development (LADOTD), 2006.
40. AASHTO. 2006. “Standard Method of Test for Preparing and Determining the Density of
Hot-Mix Asphalt (HMA) Specimens by Means of Superpave Gyratory Compactor.”
AASHTO Designation: TP 312-04, American Association of State Highways and
Transportation Officials, Washington, D.C.
41. AASHTO 2002, “Standard Practice for Mixture Conditioning of Hot-Mix Asphalt,”
AASHTO Designation: PP-02, American Association of State Highways and
Transportation Officials, Washington, D.C.
42. AASHTO 2011, “Standard Method of Test for Determining Dynamic Modulus of Hot
Mix Asphalt”, AASHTO Designation: T 342, American Association of State Highways
and Transportation Officials, Washington, D.C.
43. Bonaquist, R.F., Christensen, D.W. and Stump III, W. 2003. “Simple Performance Tester
for Superpave Mix Design: First Article Development and Evaluation.” National
Cooperative Highway Research Program (NCHRP) Report 513, Transportation Research
Board, National Research Council, Washington, D.C.
44. Witczak, M.W., Kaloush, K., Pellinen, T., El-Basyouny, M., and Quintus, H.V. 2002.
“Simple Performance Test for Superpave Mix Design.” National Cooperative Highway
Research Program (NCHRP) Report 465, Transportation Research Board, National
Research Council, Washington, D.C.
45. Little, N., and Mahboub, K. 1985. “Engineering Properties of First Generation Plasticized
Sulfur Binders and Low Temperature Fracture Evaluation of Plasticized Sulfur Paving
Mixtures.” Transportation Research Record: Journal of the Transportation Research
Board, No. 1034, Transportation Research Board of the National Academies,
Washington, D.C., pp.103-111.
46. Mull, M.A., Stuart, K. and Yehia, A. 2002. “Fracture Resistance Characterization of
Chemically Modified Crumb Rubber Asphalt Pavement” Journal of Materials Science,
Vol. 37, pp.557-566.
47. Mull, M.A., Othman, A., Mohammad, L. 2006. “Fatigue Crack Growth Analysis of Hot-
Mix Asphalt Employing the Semi-Circular Notched Bend Specimen.” Transportation
Research Board 85th Annual Meeting CD-ROM, Washington, D.C.
48. AASHTO 2006, “Standard Practice for Hamburg Wheel-Track Testing of Compacted
Hot-Mix Asphalt”, AASHTO Designation: T 324-04, American Association of State
Highways and Transportation Officials, Washington, D.C.
151
49. AASHTO 2006, “Standard Method of Test for Determining the Creep Compliance and
Strength of Hot-Mix Asphalt Using the Indirect Tensile Test Device”, AASHTO
Designation: TP 322-03, American Association of State Highways and Transportation
Officials , Washington D.C.
50. Mohammad, L.N., 2004, “Characterization of Fracture and Fatigue Resistance on
Recycled Polymer-Modified Asphalt pavements,” 5th International Conference, Limoges,
France, pp.375-382, May 2004.
51. Mohammad, L.N., Mull, M.A., and Othman, A., 2006, “Fatigue Crack Growth Analysis
of Hot-Mix Asphalt Employing the Semicircular Notched Bend Specimen”, 85th Annual
Meeting CD-ROM, Transportation Research Board.
52. Dongre, R., Sharma, M.G., and Anderson, D.A. 1989. “Development of Fracture
Criterion for Asphalt Mixes at Low Temperatures.” Transportation Research Record:
Journal of the Transportation Research Board, No. 1228, Transportation Research Board
of the National Academies, Washington, D.C., pp.94-405.
53. A. A. Abdulshafi and K. Majidzadeh, Transportation Research Record, 1034, TRB,
National Research Council, Washington, DC, 1985, p. 112.
54. Roque, R., Birgisson, B., Zhang, Z., Sangpetngam, B. and Grant, T. 2002,
“Implementation of SHRPP Indirect Tension Tester to Mitigate Cracking in Asphalt
Pavements and Overlays.” Final Report Submitted to Florida Department of
Transportation, University of Florida, Gainesville.
55. Roque, R., Birgisson, B., Drakos, C., and Dietrich, B. 2004, “Development and Field
Evaluation of Energy-Based Criteria for Top-down Cracking Performance of Hot Mix
Asphalt.” Journal of the Association of Asphalt Paving Technologists, Vol.73, pp. 229-
260.
56. Witczak, M.W. 2004. “Laboratory Determination of resilient Modulus for Flexible
Pavement Design.” Research Results Digest, National Cooperative Highway Research
Program (NCHRP) Report 1-28A, Transportation Research Board of the National
Academies, No. 285, Washington, D.C.
57. Alshamsi, K.S., 2006, “Development of Mix Design Methodology for Asphalt Mixtures
with Analytically Formulated Aggregate Structures”, Ph.D. Dissertation, Louisiana State
University and Agricultural and Mechanical College, Baton Rouge, Louisiana, May,
2006.
58. Kabir Sharear Md, 2008, "Effect of Hydrated Lime on the Laboratory Performance of
Superpave Mixtures", Master's Thesis, Louisiana State University & Agricultural and
Medical College, Louisiana, USA.
152
59. AASHTO 2006, “Standard Method of Test for Determining the Fatigue Life of
Compacted Hot-Mix Asphalt (HMA) Subjected to Repeated Flexural Bending”,
AASHTO T 321-03, American Association of State Highways and Transportation
Officials, Washington, D.C.
60. AASHTO 2006, "Standard Test Method for Thermal Stress Restrained Specimen Tensile
Strength", AASHTO TP 10, American Association of State Highways and Transportation
Officials, Washington, D.C.
61. AASHTO 2006, “Standard Method of Test for Resistance of Compacted Hot Mix
Asphalt (HMA) to Moisture-Induced Damage”, AASHTO T 283, American Association
of State Highways and Transportation Officials Washington, D.C.
62. Rebitzer, G., “Life Cycle Assessment Part 1: Framework, Goal and Scope Definition,
Inventory Analysis, and Applications.” Environment International 30: pp. 701-720, 2004.
63. International Organization for Standardization. Environmental Management – Life Cycle
Assessment – Principals and Framework, ISO 14040, 1997.
64. Hassan, M. M., “Evaluation of the Environmental and Economic Impacts of Warm-Mix
Asphalt Using Life-Cycle Assessment.” International Journal of Construction on
Education and Research 6.3: pp. 238-250, 2010.
65. Robinette, C., and J. Epps. “Energy, Emissions, Material Conservation and Prices
Associated with Construction, Rehabilitation and Material Alternatives for Flexible
Pavement.” 89th Annual Meeting CD-ROM, Transportation Research Board, 2009.
66. Lecomte, M., “Emission and Occupational Exposure at Lower Asphalt Production and
Laying Temperatures.” Shell Bitumen, 2007.
67. Lippiat, B. “Building for Environmental and Economic Sustainability (BEES) Technical
Manual and User Guide.” National Institute of Standards and technology, Wellington,
2007.
68. Pellinen, T.K., M.W. Witczak, 2002, “Stress Dependant Master Curve Construction for
Dynamic (Complex) Modulus,” Journal of the Association of Asphalt
PavingTechnologists, Volume 7.
69. Rashwan, M., and Ronald, C. W., "An Evaluation of Warm Mix Asphalt Additives and
Reclaimed Asphalt Pavement on Performance Properties of Asphalt Mixtures."
Transportation Research Board 91st Annual Meeting. No. 12-4469. 2012.
70. Prowell, B. D., Hurley, G. C., and Crews, E. (2007). “Field Performance of Warm-Mix
Asphalt at National Center for Asphalt Technology Test Track.” Journal of the
Transportation Research Board, Transportation Research Record 1998, pp. 96-102.
153
71. Kvasnak, A., Taylor, A., Signore, J., and Bukhari, S. (2010). Evaluation of Gencor Green
Machine Ultrafoam GX. National Center for Asphalt Technology, NCAT Report 10-03.
72. Zhao, Sheng, et al. "Laboratory Performance Evaluation of Warm Mix Asphalt
Containing High Percentages of RAP." 91st Annual Meeting of Transportation Research
Board, Washington DC. 2012.
73. Mohammad, L.N., B. Huang, and C. Abadie. “Performance Evaluation of Louisiana’s
Superpave Implementation Projects Utilizing the Superpave Shear Tester.” LTRC Report
98-1B, Baton Rouge, LA, 1998.
74. Bhasin, A., Button, J.W., and Chowdhury, A. 2005. “Evaluation of Selected Laboratory
Procedures and Development of Databases for HMA.” Texas Department of
Transportation Research and Technology Implementation Office, Report No.-0-4203-3,
College Station, Texas.

154
APPENDIX: MECHANISTIC TEST RESULTS
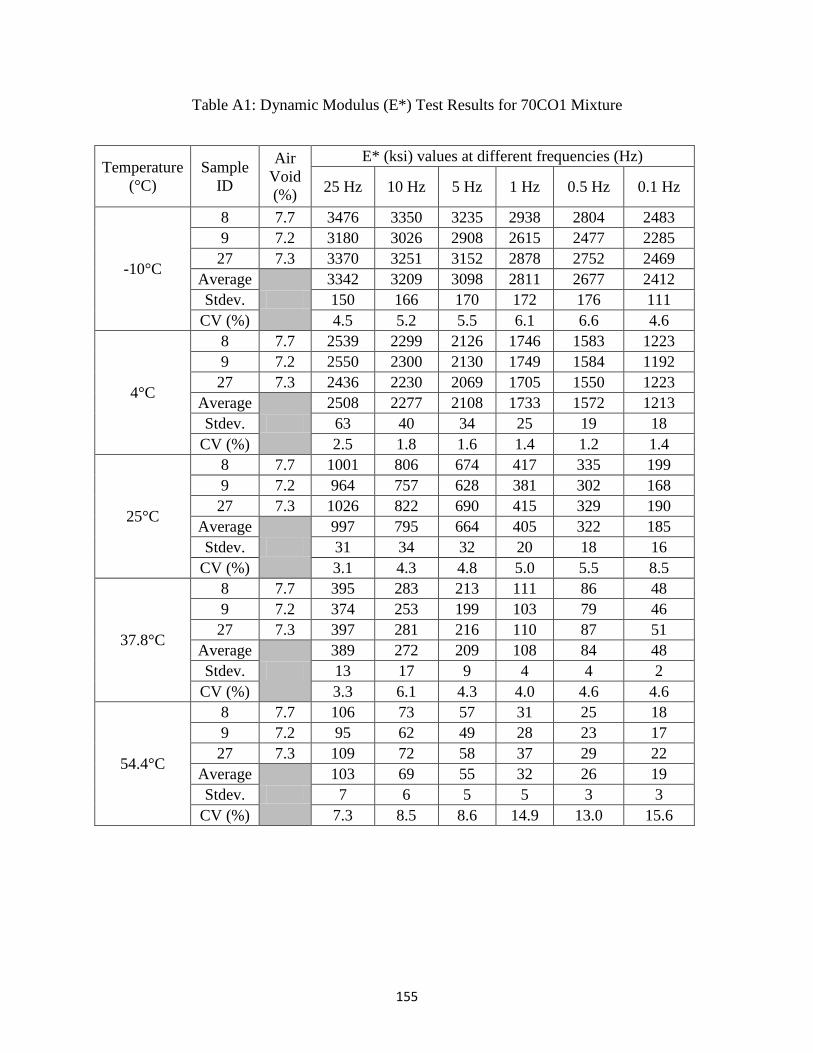
155
Table A1: Dynamic Modulus (E*) Test Results for 70CO1 Mixture
Temperature
(°C)
Sample
ID
Air
Void
(%)
E* (ksi) values at different frequencies (Hz)
25 Hz 10 Hz 5 Hz 1 Hz 0.5 Hz 0.1 Hz
-10°C
8 7.7 3476 3350 3235 2938 2804 2483
9 7.2 3180 3026 2908 2615 2477 2285
27 7.3 3370 3251 3152 2878 2752 2469
Average
3342 3209 3098 2811 2677 2412
Stdev. 150 166 170 172 176 111
CV (%) 4.5 5.2 5.5 6.1 6.6 4.6
4°C
8 7.7 2539 2299 2126 1746 1583 1223
9 7.2 2550 2300 2130 1749 1584 1192
27 7.3 2436 2230 2069 1705 1550 1223
Average
2508 2277 2108 1733 1572 1213
Stdev. 63 40 34 25 19 18
CV (%) 2.5 1.8 1.6 1.4 1.2 1.4
25°C
8 7.7 1001 806 674 417 335 199
9 7.2 964 757 628 381 302 168
27 7.3 1026 822 690 415 329 190
Average
997 795 664 405 322 185
Stdev. 31 34 32 20 18 16
CV (%) 3.1 4.3 4.8 5.0 5.5 8.5
37.8°C
8 7.7 395 283 213 111 86 48
9 7.2 374 253 199 103 79 46
27 7.3 397 281 216 110 87 51
Average
389 272 209 108 84 48
Stdev. 13 17 9 4 4 2
CV (%) 3.3 6.1 4.3 4.0 4.6 4.6
54.4°C
8 7.7 106 73 57 31 25 18
9 7.2 95 62 49 28 23 17
27 7.3 109 72 58 37 29 22
Average
103 69 55 32 26 19
Stdev. 7 6 5 5 3 3
CV (%) 7.3 8.5 8.6 14.9 13.0 15.6

156
Table A2: Dynamic Modulus (E*) Test Results for 70W15E Mixture
Temperature
(°C)
Sample
ID
Air
Void
(%)
E* (ksi) values at different frequencies (Hz)
25 Hz 10 Hz 5 Hz 1 Hz 0.5 Hz 0.1 Hz
-10°C
7 8.6 2974 2891 2808 2556 2443 2204
8 7.6 3358 3193 3066 2747 2599 2217
12 8.0 3227 3099 2975 2658 2513 2151
Average
3186 3061 2950 2654 2518 2191
Stdev. 195 155 131 96 78 35
CV (%) 6.1 5.1 4.4 3.6 3.1 1.6
4°C
7 8.6 2374 2168 2001 1612 1452 1094
8 7.6 2295 2059 1854 1435 1266 899
12 8.0 2255 2102 1906 1481 1297 883
Average
2308 2110 1921 1509 1338 959
Stdev. 61 55 75 92 99 117
CV (%) 2.6 2.6 3.9 6.1 7.4 12.2
25°C
7 8.6 1000 819 659 370 289 164
8 7.6 730 530 425 229 168 87
12 8.0 732 563 440 244 185 97
Average
820 637 508 281 214 116
Stdev. 155 158 131 77 66 42
CV (%) 18.9 24.9 25.8 27.5 30.7 36.2
37.8°C
7 8.6 312 221 167 89 72 47
8 7.6 232 149 111 55 45 30
12 8.0 249 166 122 60 48 30
Average
264 179 133 68 55 36
Stdev. 42 38 30 18 15 10
CV (%) 16.0 21.1 22.5 26.9 26.9 27.8
54.4°C
7 8.6 101 70 54 32 28 21
8 7.6 75 52 39 26 25 20
12 8.0 64 43 39 25 22 19
Average
80 55 44 28 25 20
Stdev. 19 14 9 4 3 1
CV (%) 24.1 25.0 19.9 13.2 11.7 6.5
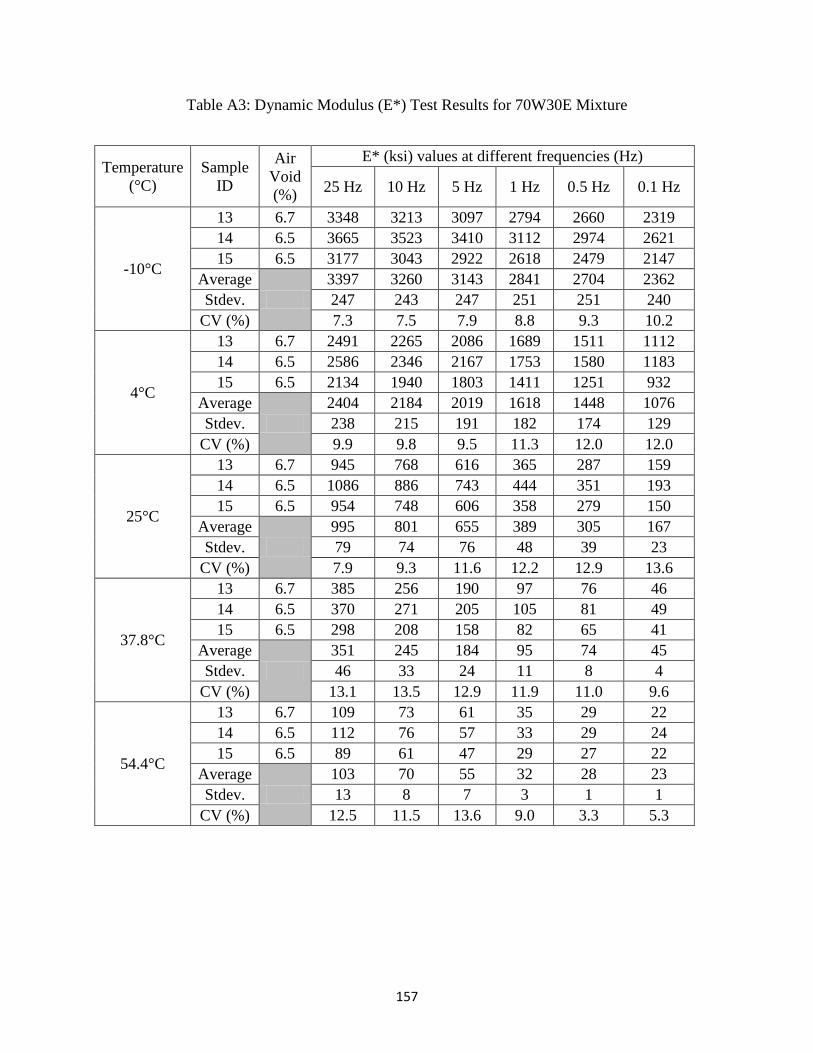
157
Table A3: Dynamic Modulus (E*) Test Results for 70W30E Mixture
Temperature
(°C)
Sample
ID
Air
Void
(%)
E* (ksi) values at different frequencies (Hz)
25 Hz 10 Hz 5 Hz 1 Hz 0.5 Hz 0.1 Hz
-10°C
13 6.7 3348 3213 3097 2794 2660 2319
14 6.5 3665 3523 3410 3112 2974 2621
15 6.5 3177 3043 2922 2618 2479 2147
Average
3397 3260 3143 2841 2704 2362
Stdev. 247 243 247 251 251 240
CV (%) 7.3 7.5 7.9 8.8 9.3 10.2
4°C
13 6.7 2491 2265 2086 1689 1511 1112
14 6.5 2586 2346 2167 1753 1580 1183
15 6.5 2134 1940 1803 1411 1251 932
Average
2404 2184 2019 1618 1448 1076
Stdev. 238 215 191 182 174 129
CV (%) 9.9 9.8 9.5 11.3 12.0 12.0
25°C
13 6.7 945 768 616 365 287 159
14 6.5 1086 886 743 444 351 193
15 6.5 954 748 606 358 279 150
Average
995 801 655 389 305 167
Stdev. 79 74 76 48 39 23
CV (%) 7.9 9.3 11.6 12.2 12.9 13.6
37.8°C
13 6.7 385 256 190 97 76 46
14 6.5 370 271 205 105 81 49
15 6.5 298 208 158 82 65 41
Average
351 245 184 95 74 45
Stdev. 46 33 24 11 8 4
CV (%) 13.1 13.5 12.9 11.9 11.0 9.6
54.4°C
13 6.7 109 73 61 35 29 22
14 6.5 112 76 57 33 29 24
15 6.5 89 61 47 29 27 22
Average
103 70 55 32 28 23
Stdev. 13 8 7 3 1 1
CV (%) 12.5 11.5 13.6 9.0 3.3 5.3
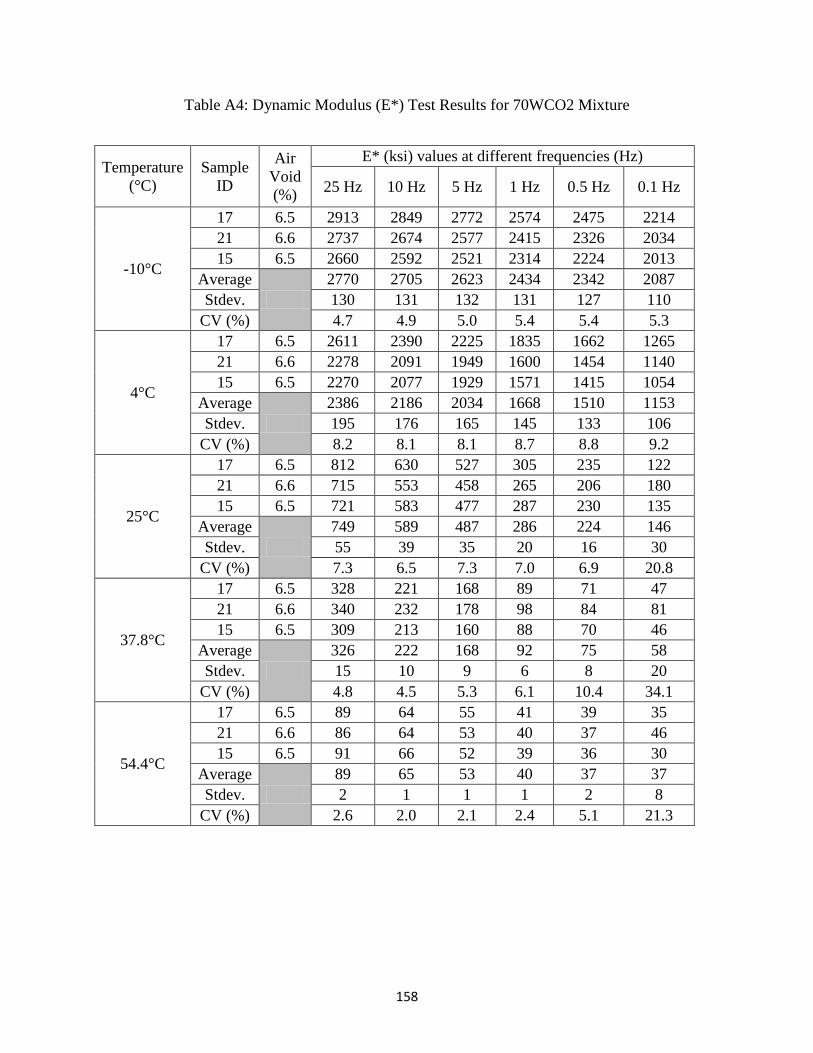
158
Table A4: Dynamic Modulus (E*) Test Results for 70WCO2 Mixture
Temperature
(°C)
Sample
ID
Air
Void
(%)
E* (ksi) values at different frequencies (Hz)
25 Hz 10 Hz 5 Hz 1 Hz 0.5 Hz 0.1 Hz
-10°C
17 6.5 2913 2849 2772 2574 2475 2214
21 6.6 2737 2674 2577 2415 2326 2034
15 6.5 2660 2592 2521 2314 2224 2013
Average
2770 2705 2623 2434 2342 2087
Stdev. 130 131 132 131 127 110
CV (%) 4.7 4.9 5.0 5.4 5.4 5.3
4°C
17 6.5 2611 2390 2225 1835 1662 1265
21 6.6 2278 2091 1949 1600 1454 1140
15 6.5 2270 2077 1929 1571 1415 1054
Average
2386 2186 2034 1668 1510 1153
Stdev. 195 176 165 145 133 106
CV (%) 8.2 8.1 8.1 8.7 8.8 9.2
25°C
17 6.5 812 630 527 305 235 122
21 6.6 715 553 458 265 206 180
15 6.5 721 583 477 287 230 135
Average
749 589 487 286 224 146
Stdev. 55 39 35 20 16 30
CV (%) 7.3 6.5 7.3 7.0 6.9 20.8
37.8°C
17 6.5 328 221 168 89 71 47
21 6.6 340 232 178 98 84 81
15 6.5 309 213 160 88 70 46
Average
326 222 168 92 75 58
Stdev. 15 10 9 6 8 20
CV (%) 4.8 4.5 5.3 6.1 10.4 34.1
54.4°C
17 6.5 89 64 55 41 39 35
21 6.6 86 64 53 40 37 46
15 6.5 91 66 52 39 36 30
Average
89 65 53 40 37 37
Stdev. 2 1 1 1 2 8
CV (%) 2.6 2.0 2.1 2.4 5.1 21.3

159
Table A5: Dynamic Modulus (E*) Test Results for 70W15F Mixture
Temperature
(°C)
Sample
ID
Air
Void
(%)
E* (ksi) values at different frequencies (Hz)
25 Hz 10 Hz 5 Hz 1 Hz 0.5 Hz 0.1 Hz
-10°C
24 6.5 2914 2865 2774 2575 2503 2267
22 6.0 2960 2874 2772 2543 2453 2178
16 6.6 2796 2706 2617 2392 2307 2036
Average
2890 2815 2721 2503 2421 2160
Stdev. 84 94 90 98 102 117
CV (%) 2.9 3.4 3.3 3.9 4.2 5.4
4°C
24 6.5 2405 2204 2045 1670 1529 1177
22 6.0 2160 1962 1816 1474 1329 980
16 6.6 2301 2115 1962 1599 1443 1091
Average
2289 2094 1941 1581 1434 1083
Stdev. 123 123 116 99 101 99
CV (%) 5.4 5.9 6.0 6.3 7.0 9.1
25°C
24 6.5 913 726 594 343 266 156
22 6.0 934 736 608 341 259 138
16 6.6 829 666 535 304 232 131
Average
892 709 579 330 252 141
Stdev. 55 38 39 22 18 13
CV (%) 6.2 5.4 6.7 6.7 7.0 9.2
37.8°C
24 6.5 325 232 175 95 73 49
22 6.0 312 213 165 88 70 48
16 6.6 322 230 173 95 74 48
Average
320 225 171 93 73 48
Stdev. 7 10 6 4 2 1
CV (%) 2.1 4.7 3.3 4.3 2.9 1.2
54.4°C
24 6.5 90 62 51 36 31 26
22 6.0 104 72 59 43 39 34
16 6.6 85 62 51 38 35 31
Average
93 65 54 39 35 30
Stdev. 10 6 5 4 4 4
CV (%) 10.6 9.2 9.0 9.5 11.1 13.8
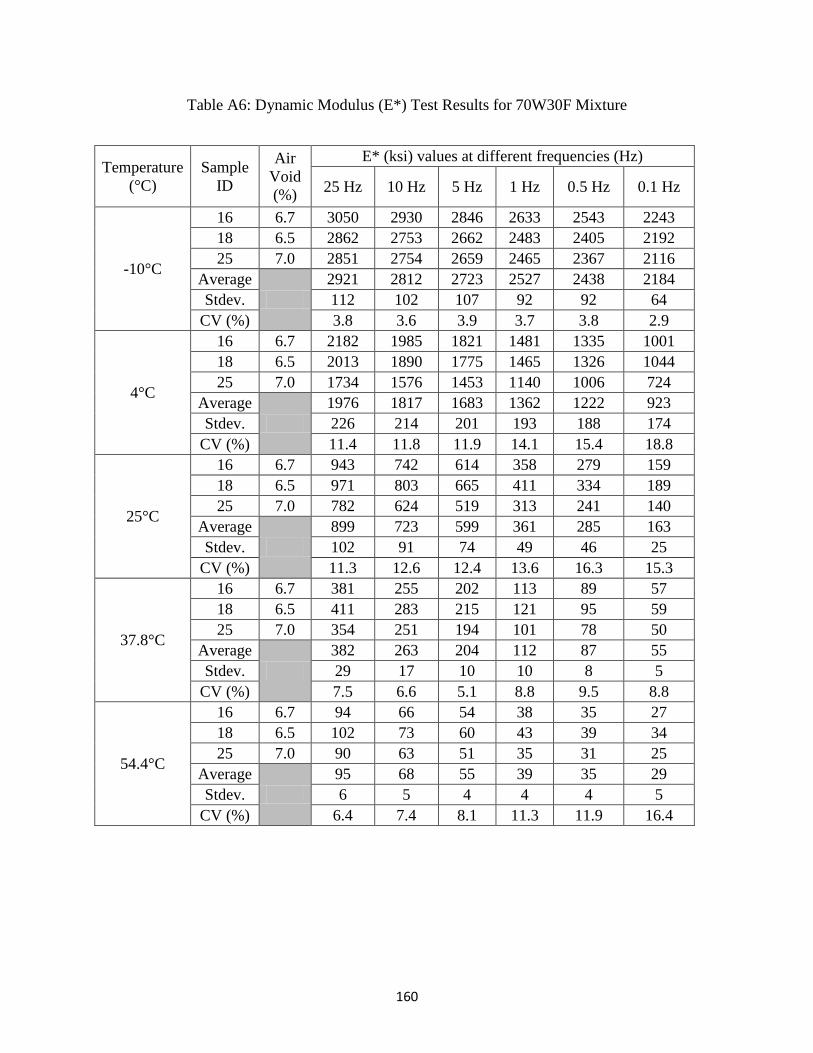
160
Table A6: Dynamic Modulus (E*) Test Results for 70W30F Mixture
Temperature
(°C)
Sample
ID
Air
Void
(%)
E* (ksi) values at different frequencies (Hz)
25 Hz 10 Hz 5 Hz 1 Hz 0.5 Hz 0.1 Hz
-10°C
16 6.7 3050 2930 2846 2633 2543 2243
18 6.5 2862 2753 2662 2483 2405 2192
25 7.0 2851 2754 2659 2465 2367 2116
Average
2921 2812 2723 2527 2438 2184
Stdev. 112 102 107 92 92 64
CV (%) 3.8 3.6 3.9 3.7 3.8 2.9
4°C
16 6.7 2182 1985 1821 1481 1335 1001
18 6.5 2013 1890 1775 1465 1326 1044
25 7.0 1734 1576 1453 1140 1006 724
Average
1976 1817 1683 1362 1222 923
Stdev. 226 214 201 193 188 174
CV (%) 11.4 11.8 11.9 14.1 15.4 18.8
25°C
16 6.7 943 742 614 358 279 159
18 6.5 971 803 665 411 334 189
25 7.0 782 624 519 313 241 140
Average
899 723 599 361 285 163
Stdev. 102 91 74 49 46 25
CV (%) 11.3 12.6 12.4 13.6 16.3 15.3
37.8°C
16 6.7 381 255 202 113 89 57
18 6.5 411 283 215 121 95 59
25 7.0 354 251 194 101 78 50
Average
382 263 204 112 87 55
Stdev. 29 17 10 10 8 5
CV (%) 7.5 6.6 5.1 8.8 9.5 8.8
54.4°C
16 6.7 94 66 54 38 35 27
18 6.5 102 73 60 43 39 34
25 7.0 90 63 51 35 31 25
Average
95 68 55 39 35 29
Stdev. 6 5 4 4 4 5
CV (%) 6.4 7.4 8.1 11.3 11.9 16.4
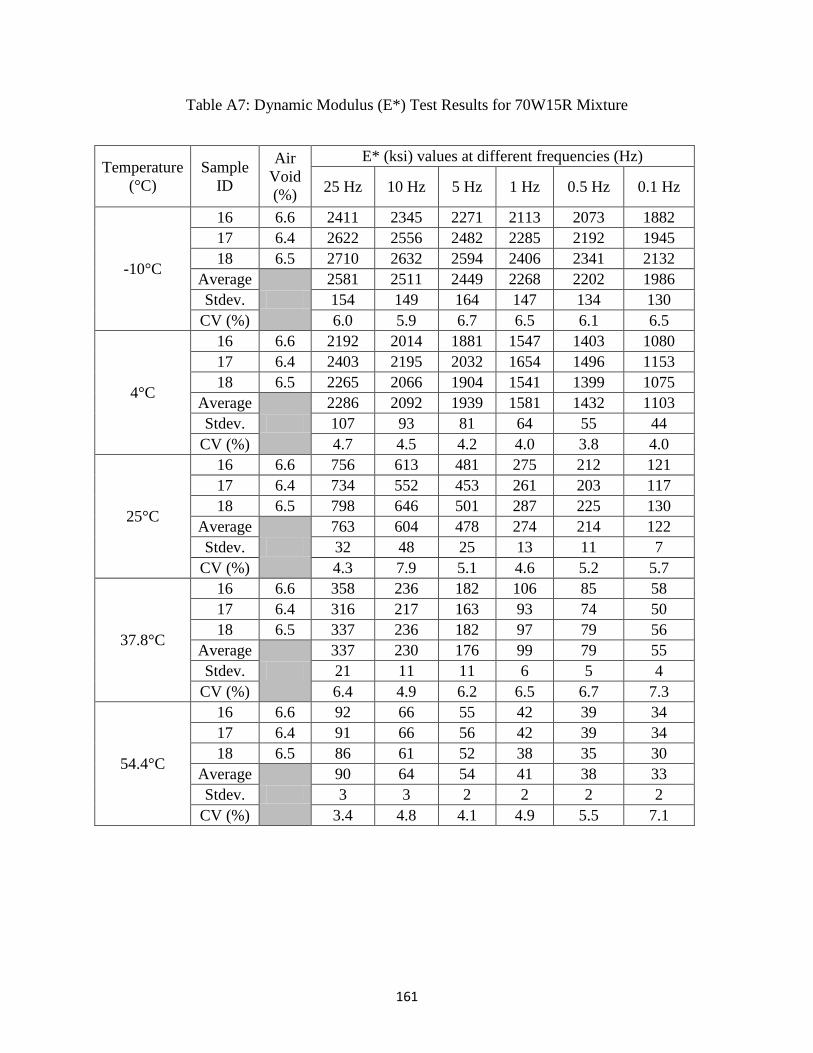
161
Table A7: Dynamic Modulus (E*) Test Results for 70W15R Mixture
Temperature
(°C)
Sample
ID
Air
Void
(%)
E* (ksi) values at different frequencies (Hz)
25 Hz 10 Hz 5 Hz 1 Hz 0.5 Hz 0.1 Hz
-10°C
16 6.6 2411 2345 2271 2113 2073 1882
17 6.4 2622 2556 2482 2285 2192 1945
18 6.5 2710 2632 2594 2406 2341 2132
Average
2581 2511 2449 2268 2202 1986
Stdev. 154 149 164 147 134 130
CV (%) 6.0 5.9 6.7 6.5 6.1 6.5
4°C
16 6.6 2192 2014 1881 1547 1403 1080
17 6.4 2403 2195 2032 1654 1496 1153
18 6.5 2265 2066 1904 1541 1399 1075
Average
2286 2092 1939 1581 1432 1103
Stdev. 107 93 81 64 55 44
CV (%) 4.7 4.5 4.2 4.0 3.8 4.0
25°C
16 6.6 756 613 481 275 212 121
17 6.4 734 552 453 261 203 117
18 6.5 798 646 501 287 225 130
Average
763 604 478 274 214 122
Stdev. 32 48 25 13 11 7
CV (%) 4.3 7.9 5.1 4.6 5.2 5.7
37.8°C
16 6.6 358 236 182 106 85 58
17 6.4 316 217 163 93 74 50
18 6.5 337 236 182 97 79 56
Average
337 230 176 99 79 55
Stdev. 21 11 11 6 5 4
CV (%) 6.4 4.9 6.2 6.5 6.7 7.3
54.4°C
16 6.6 92 66 55 42 39 34
17 6.4 91 66 56 42 39 34
18 6.5 86 61 52 38 35 30
Average
90 64 54 41 38 33
Stdev. 3 3 2 2 2 2
CV (%) 3.4 4.8 4.1 4.9 5.5 7.1
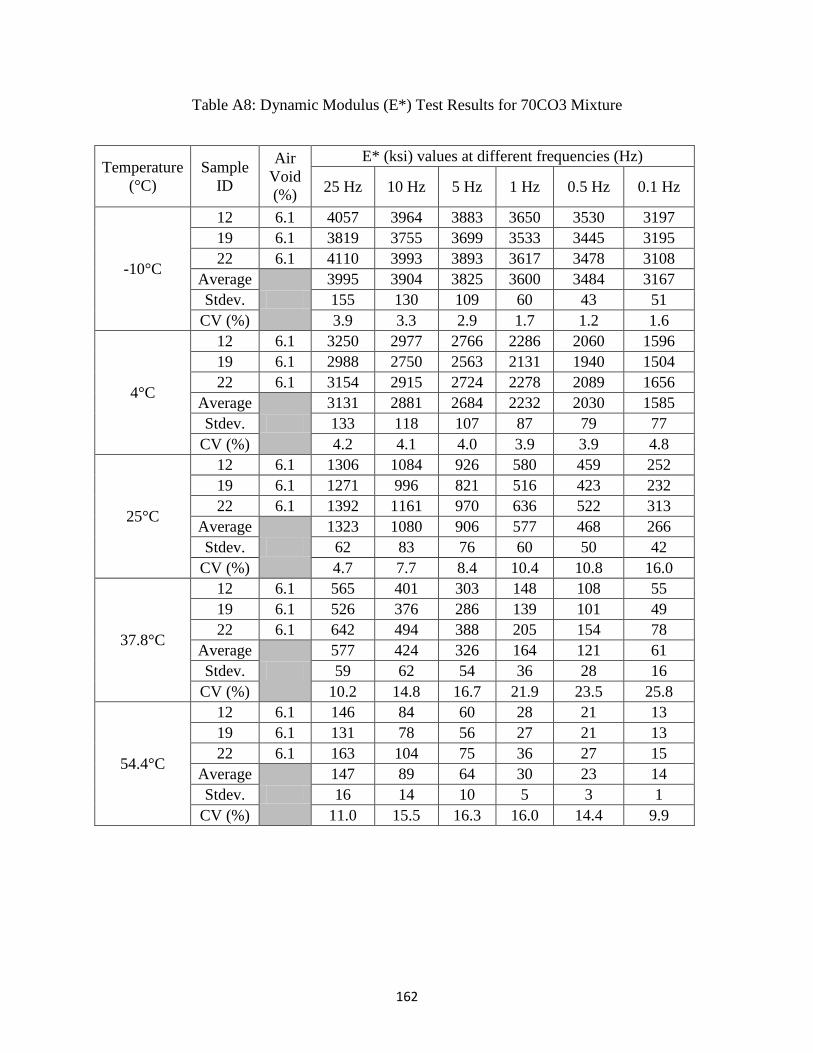
162
Table A8: Dynamic Modulus (E*) Test Results for 70CO3 Mixture
Temperature
(°C)
Sample
ID
Air
Void
(%)
E* (ksi) values at different frequencies (Hz)
25 Hz 10 Hz 5 Hz 1 Hz 0.5 Hz 0.1 Hz
-10°C
12 6.1 4057 3964 3883 3650 3530 3197
19 6.1 3819 3755 3699 3533 3445 3195
22 6.1 4110 3993 3893 3617 3478 3108
Average
3995 3904 3825 3600 3484 3167
Stdev. 155 130 109 60 43 51
CV (%) 3.9 3.3 2.9 1.7 1.2 1.6
4°C
12 6.1 3250 2977 2766 2286 2060 1596
19 6.1 2988 2750 2563 2131 1940 1504
22 6.1 3154 2915 2724 2278 2089 1656
Average
3131 2881 2684 2232 2030 1585
Stdev. 133 118 107 87 79 77
CV (%) 4.2 4.1 4.0 3.9 3.9 4.8
25°C
12 6.1 1306 1084 926 580 459 252
19 6.1 1271 996 821 516 423 232
22 6.1 1392 1161 970 636 522 313
Average
1323 1080 906 577 468 266
Stdev. 62 83 76 60 50 42
CV (%) 4.7 7.7 8.4 10.4 10.8 16.0
37.8°C
12 6.1 565 401 303 148 108 55
19 6.1 526 376 286 139 101 49
22 6.1 642 494 388 205 154 78
Average
577 424 326 164 121 61
Stdev. 59 62 54 36 28 16
CV (%) 10.2 14.8 16.7 21.9 23.5 25.8
54.4°C
12 6.1 146 84 60 28 21 13
19 6.1 131 78 56 27 21 13
22 6.1 163 104 75 36 27 15
Average
147 89 64 30 23 14
Stdev. 16 14 10 5 3 1
CV (%) 11.0 15.5 16.3 16.0 14.4 9.9
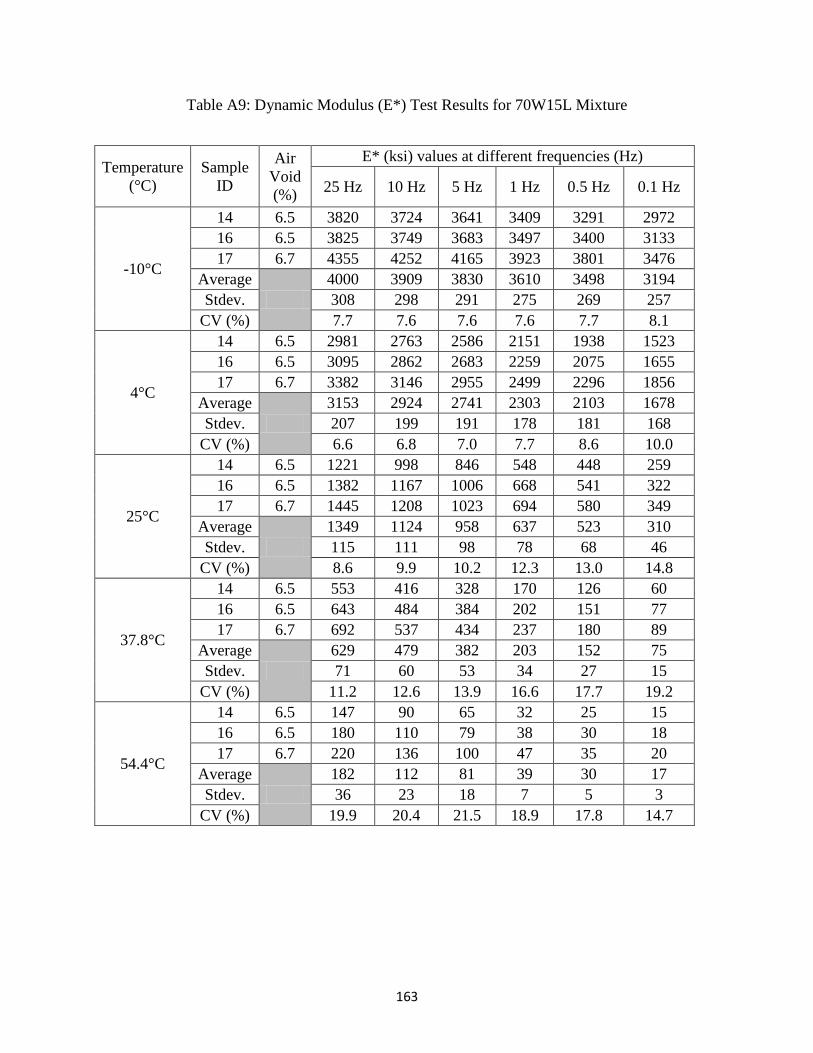
163
Table A9: Dynamic Modulus (E*) Test Results for 70W15L Mixture
Temperature
(°C)
Sample
ID
Air
Void
(%)
E* (ksi) values at different frequencies (Hz)
25 Hz 10 Hz 5 Hz 1 Hz 0.5 Hz 0.1 Hz
-10°C
14 6.5 3820 3724 3641 3409 3291 2972
16 6.5 3825 3749 3683 3497 3400 3133
17 6.7 4355 4252 4165 3923 3801 3476
Average
4000 3909 3830 3610 3498 3194
Stdev. 308 298 291 275 269 257
CV (%) 7.7 7.6 7.6 7.6 7.7 8.1
4°C
14 6.5 2981 2763 2586 2151 1938 1523
16 6.5 3095 2862 2683 2259 2075 1655
17 6.7 3382 3146 2955 2499 2296 1856
Average
3153 2924 2741 2303 2103 1678
Stdev. 207 199 191 178 181 168
CV (%) 6.6 6.8 7.0 7.7 8.6 10.0
25°C
14 6.5 1221 998 846 548 448 259
16 6.5 1382 1167 1006 668 541 322
17 6.7 1445 1208 1023 694 580 349
Average
1349 1124 958 637 523 310
Stdev. 115 111 98 78 68 46
CV (%) 8.6 9.9 10.2 12.3 13.0 14.8
37.8°C
14 6.5 553 416 328 170 126 60
16 6.5 643 484 384 202 151 77
17 6.7 692 537 434 237 180 89
Average
629 479 382 203 152 75
Stdev. 71 60 53 34 27 15
CV (%) 11.2 12.6 13.9 16.6 17.7 19.2
54.4°C
14 6.5 147 90 65 32 25 15
16 6.5 180 110 79 38 30 18
17 6.7 220 136 100 47 35 20
Average
182 112 81 39 30 17
Stdev. 36 23 18 7 5 3
CV (%) 19.9 20.4 21.5 18.9 17.8 14.7
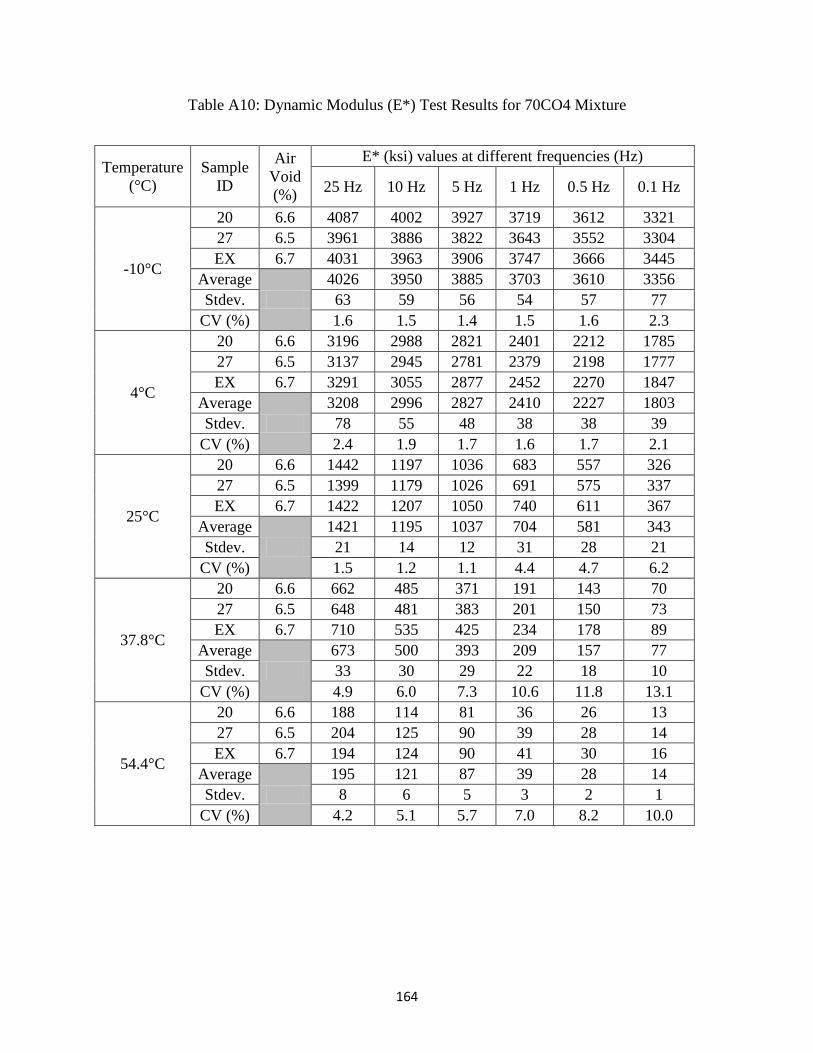
164
Table A10: Dynamic Modulus (E*) Test Results for 70CO4 Mixture
Temperature
(°C)
Sample
ID
Air
Void
(%)
E* (ksi) values at different frequencies (Hz)
25 Hz 10 Hz 5 Hz 1 Hz 0.5 Hz 0.1 Hz
-10°C
20 6.6 4087 4002 3927 3719 3612 3321
27 6.5 3961 3886 3822 3643 3552 3304
EX 6.7 4031 3963 3906 3747 3666 3445
Average
4026 3950 3885 3703 3610 3356
Stdev. 63 59 56 54 57 77
CV (%) 1.6 1.5 1.4 1.5 1.6 2.3
4°C
20 6.6 3196 2988 2821 2401 2212 1785
27 6.5 3137 2945 2781 2379 2198 1777
EX 6.7 3291 3055 2877 2452 2270 1847
Average
3208 2996 2827 2410 2227 1803
Stdev. 78 55 48 38 38 39
CV (%) 2.4 1.9 1.7 1.6 1.7 2.1
25°C
20 6.6 1442 1197 1036 683 557 326
27 6.5 1399 1179 1026 691 575 337
EX 6.7 1422 1207 1050 740 611 367
Average
1421 1195 1037 704 581 343
Stdev. 21 14 12 31 28 21
CV (%) 1.5 1.2 1.1 4.4 4.7 6.2
37.8°C
20 6.6 662 485 371 191 143 70
27 6.5 648 481 383 201 150 73
EX 6.7 710 535 425 234 178 89
Average
673 500 393 209 157 77
Stdev. 33 30 29 22 18 10
CV (%) 4.9 6.0 7.3 10.6 11.8 13.1
54.4°C
20 6.6 188 114 81 36 26 13
27 6.5 204 125 90 39 28 14
EX 6.7 194 124 90 41 30 16
Average
195 121 87 39 28 14
Stdev. 8 6 5 3 2 1
CV (%) 4.2 5.1 5.7 7.0 8.2 10.0
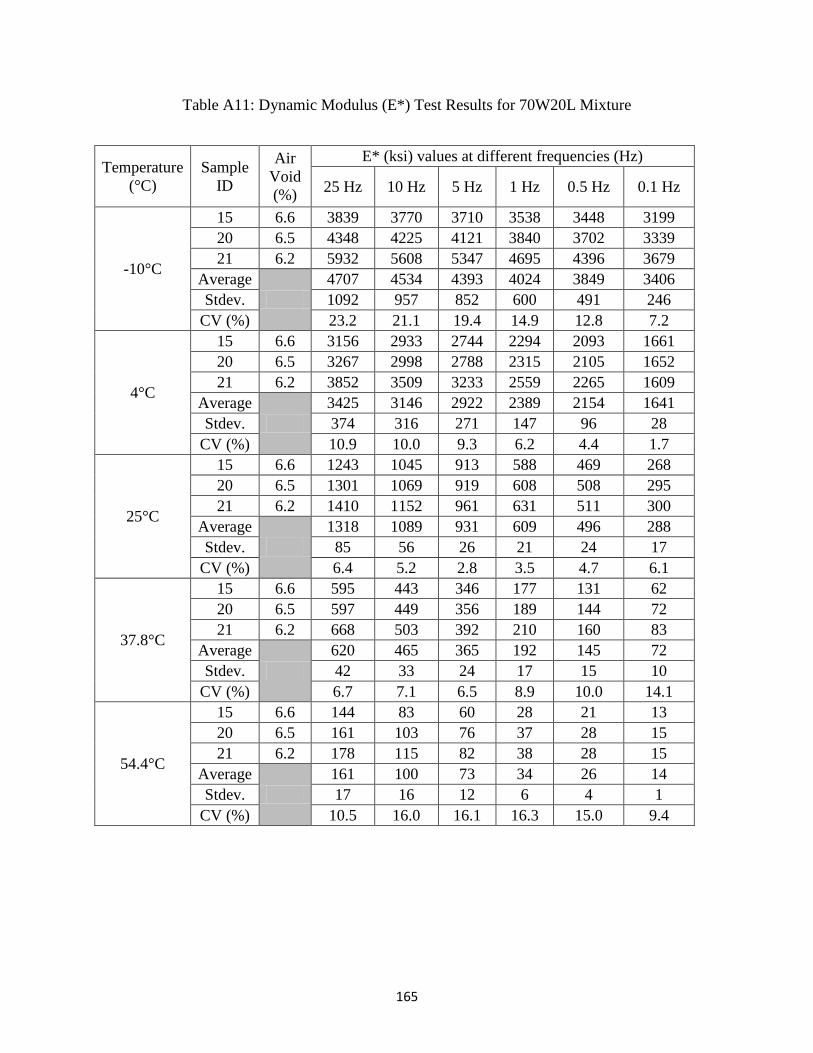
165
Table A11: Dynamic Modulus (E*) Test Results for 70W20L Mixture
Temperature
(°C)
Sample
ID
Air
Void
(%)
E* (ksi) values at different frequencies (Hz)
25 Hz 10 Hz 5 Hz 1 Hz 0.5 Hz 0.1 Hz
-10°C
15 6.6 3839 3770 3710 3538 3448 3199
20 6.5 4348 4225 4121 3840 3702 3339
21 6.2 5932 5608 5347 4695 4396 3679
Average
4707 4534 4393 4024 3849 3406
Stdev. 1092 957 852 600 491 246
CV (%) 23.2 21.1 19.4 14.9 12.8 7.2
4°C
15 6.6 3156 2933 2744 2294 2093 1661
20 6.5 3267 2998 2788 2315 2105 1652
21 6.2 3852 3509 3233 2559 2265 1609
Average
3425 3146 2922 2389 2154 1641
Stdev. 374 316 271 147 96 28
CV (%) 10.9 10.0 9.3 6.2 4.4 1.7
25°C
15 6.6 1243 1045 913 588 469 268
20 6.5 1301 1069 919 608 508 295
21 6.2 1410 1152 961 631 511 300
Average
1318 1089 931 609 496 288
Stdev. 85 56 26 21 24 17
CV (%) 6.4 5.2 2.8 3.5 4.7 6.1
37.8°C
15 6.6 595 443 346 177 131 62
20 6.5 597 449 356 189 144 72
21 6.2 668 503 392 210 160 83
Average
620 465 365 192 145 72
Stdev. 42 33 24 17 15 10
CV (%) 6.7 7.1 6.5 8.9 10.0 14.1
54.4°C
15 6.6 144 83 60 28 21 13
20 6.5 161 103 76 37 28 15
21 6.2 178 115 82 38 28 15
Average
161 100 73 34 26 14
Stdev. 17 16 12 6 4 1
CV (%) 10.5 16.0 16.1 16.3 15.0 9.4
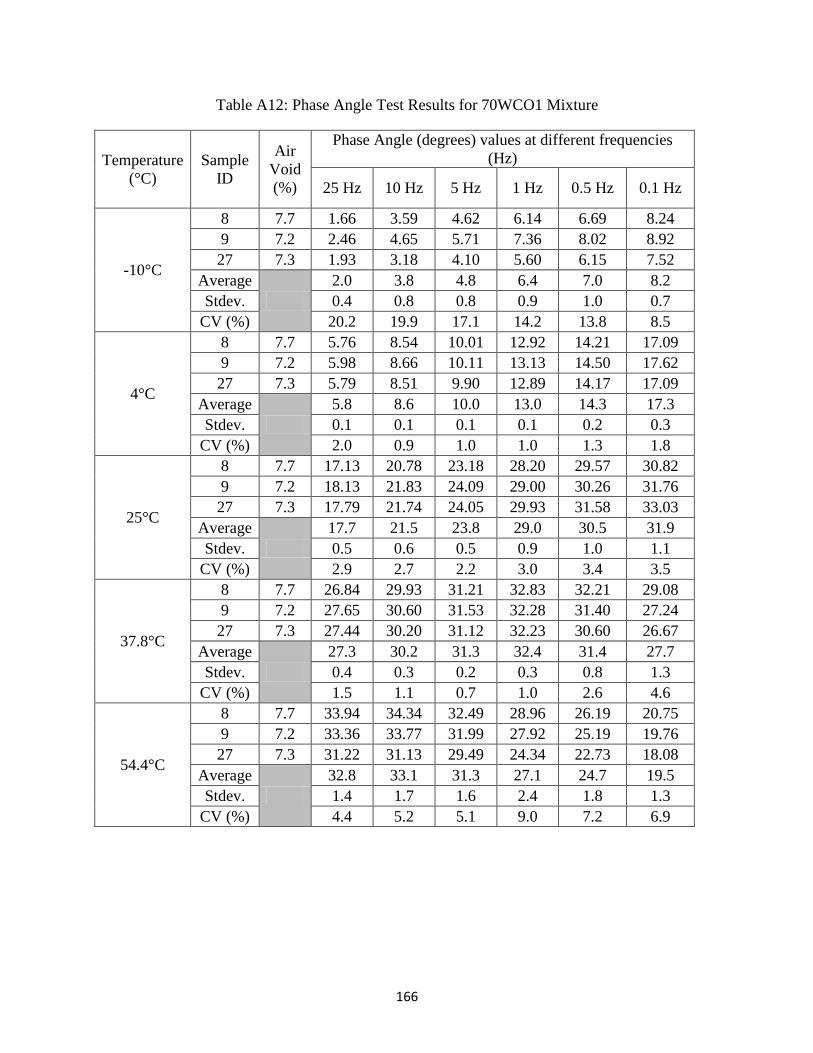
166
Table A12: Phase Angle Test Results for 70WCO1 Mixture
Temperature
(°C)
Sample
ID
Air
Void
(%)
Phase Angle (degrees) values at different frequencies
(Hz)
25 Hz 10 Hz 5 Hz 1 Hz 0.5 Hz 0.1 Hz
-10°C
8 7.7 1.66 3.59 4.62 6.14 6.69 8.24
9 7.2 2.46 4.65 5.71 7.36 8.02 8.92
27 7.3 1.93 3.18 4.10 5.60 6.15 7.52
Average
2.0 3.8 4.8 6.4 7.0 8.2
Stdev. 0.4 0.8 0.8 0.9 1.0 0.7
CV (%) 20.2 19.9 17.1 14.2 13.8 8.5
4°C
8 7.7 5.76 8.54 10.01 12.92 14.21 17.09
9 7.2 5.98 8.66 10.11 13.13 14.50 17.62
27 7.3 5.79 8.51 9.90 12.89 14.17 17.09
Average
5.8 8.6 10.0 13.0 14.3 17.3
Stdev. 0.1 0.1 0.1 0.1 0.2 0.3
CV (%) 2.0 0.9 1.0 1.0 1.3 1.8
25°C
8 7.7 17.13 20.78 23.18 28.20 29.57 30.82
9 7.2 18.13 21.83 24.09 29.00 30.26 31.76
27 7.3 17.79 21.74 24.05 29.93 31.58 33.03
Average
17.7 21.5 23.8 29.0 30.5 31.9
Stdev. 0.5 0.6 0.5 0.9 1.0 1.1
CV (%) 2.9 2.7 2.2 3.0 3.4 3.5
37.8°C
8 7.7 26.84 29.93 31.21 32.83 32.21 29.08
9 7.2 27.65 30.60 31.53 32.28 31.40 27.24
27 7.3 27.44 30.20 31.12 32.23 30.60 26.67
Average
27.3 30.2 31.3 32.4 31.4 27.7
Stdev. 0.4 0.3 0.2 0.3 0.8 1.3
CV (%) 1.5 1.1 0.7 1.0 2.6 4.6
54.4°C
8 7.7 33.94 34.34 32.49 28.96 26.19 20.75
9 7.2 33.36 33.77 31.99 27.92 25.19 19.76
27 7.3 31.22 31.13 29.49 24.34 22.73 18.08
Average
32.8 33.1 31.3 27.1 24.7 19.5
Stdev. 1.4 1.7 1.6 2.4 1.8 1.3
CV (%) 4.4 5.2 5.1 9.0 7.2 6.9
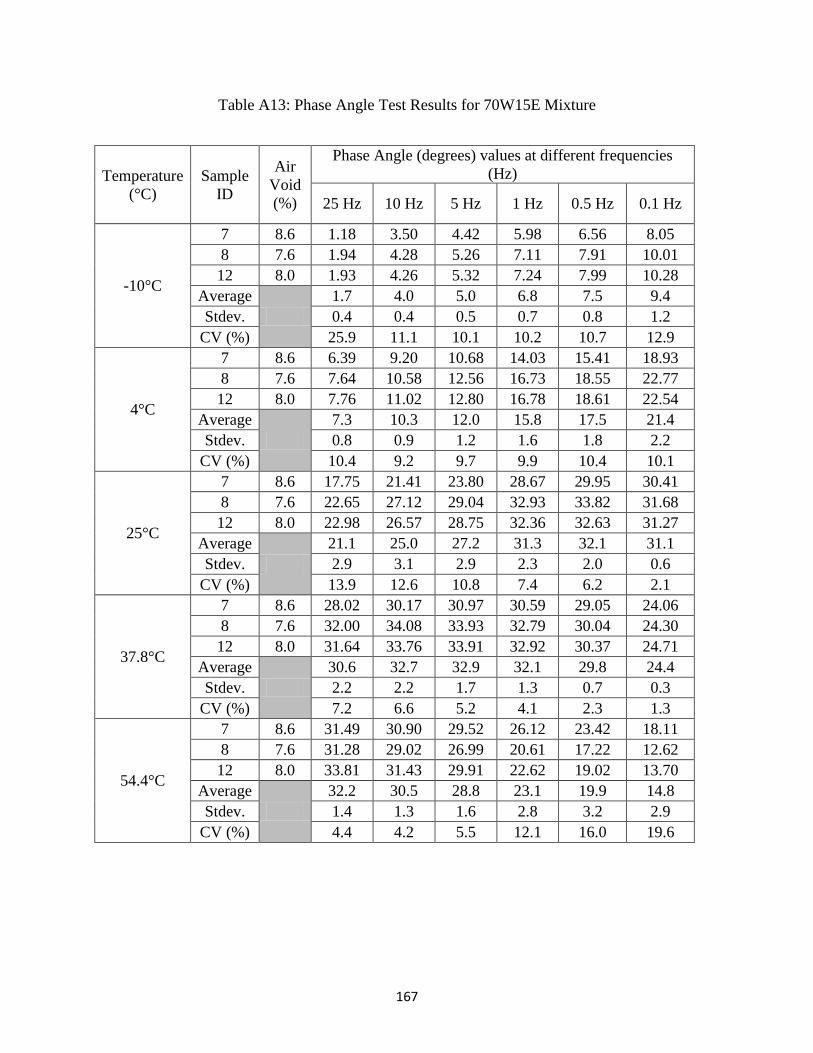
167
Table A13: Phase Angle Test Results for 70W15E Mixture
Temperature
(°C)
Sample
ID
Air
Void
(%)
Phase Angle (degrees) values at different frequencies
(Hz)
25 Hz 10 Hz 5 Hz 1 Hz 0.5 Hz 0.1 Hz
-10°C
7 8.6 1.18 3.50 4.42 5.98 6.56 8.05
8 7.6 1.94 4.28 5.26 7.11 7.91 10.01
12 8.0 1.93 4.26 5.32 7.24 7.99 10.28
Average
1.7 4.0 5.0 6.8 7.5 9.4
Stdev. 0.4 0.4 0.5 0.7 0.8 1.2
CV (%) 25.9 11.1 10.1 10.2 10.7 12.9
4°C
7 8.6 6.39 9.20 10.68 14.03 15.41 18.93
8 7.6 7.64 10.58 12.56 16.73 18.55 22.77
12 8.0 7.76 11.02 12.80 16.78 18.61 22.54
Average
7.3 10.3 12.0 15.8 17.5 21.4
Stdev. 0.8 0.9 1.2 1.6 1.8 2.2
CV (%) 10.4 9.2 9.7 9.9 10.4 10.1
25°C
7 8.6 17.75 21.41 23.80 28.67 29.95 30.41
8 7.6 22.65 27.12 29.04 32.93 33.82 31.68
12 8.0 22.98 26.57 28.75 32.36 32.63 31.27
Average
21.1 25.0 27.2 31.3 32.1 31.1
Stdev. 2.9 3.1 2.9 2.3 2.0 0.6
CV (%) 13.9 12.6 10.8 7.4 6.2 2.1
37.8°C
7 8.6 28.02 30.17 30.97 30.59 29.05 24.06
8 7.6 32.00 34.08 33.93 32.79 30.04 24.30
12 8.0 31.64 33.76 33.91 32.92 30.37 24.71
Average
30.6 32.7 32.9 32.1 29.8 24.4
Stdev. 2.2 2.2 1.7 1.3 0.7 0.3
CV (%) 7.2 6.6 5.2 4.1 2.3 1.3
54.4°C
7 8.6 31.49 30.90 29.52 26.12 23.42 18.11
8 7.6 31.28 29.02 26.99 20.61 17.22 12.62
12 8.0 33.81 31.43 29.91 22.62 19.02 13.70
Average
32.2 30.5 28.8 23.1 19.9 14.8
Stdev. 1.4 1.3 1.6 2.8 3.2 2.9
CV (%) 4.4 4.2 5.5 12.1 16.0 19.6
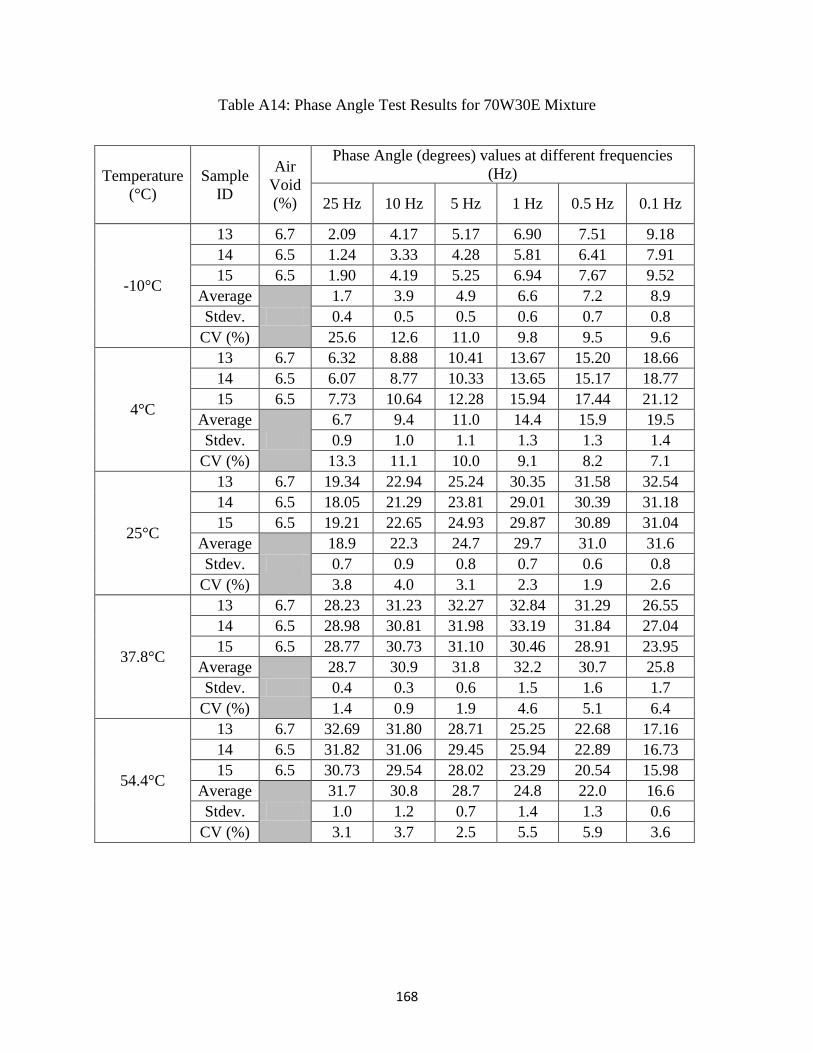
168
Table A14: Phase Angle Test Results for 70W30E Mixture
Temperature
(°C)
Sample
ID
Air
Void
(%)
Phase Angle (degrees) values at different frequencies
(Hz)
25 Hz 10 Hz 5 Hz 1 Hz 0.5 Hz 0.1 Hz
-10°C
13 6.7 2.09 4.17 5.17 6.90 7.51 9.18
14 6.5 1.24 3.33 4.28 5.81 6.41 7.91
15 6.5 1.90 4.19 5.25 6.94 7.67 9.52
Average
1.7 3.9 4.9 6.6 7.2 8.9
Stdev. 0.4 0.5 0.5 0.6 0.7 0.8
CV (%) 25.6 12.6 11.0 9.8 9.5 9.6
4°C
13 6.7 6.32 8.88 10.41 13.67 15.20 18.66
14 6.5 6.07 8.77 10.33 13.65 15.17 18.77
15 6.5 7.73 10.64 12.28 15.94 17.44 21.12
Average
6.7 9.4 11.0 14.4 15.9 19.5
Stdev. 0.9 1.0 1.1 1.3 1.3 1.4
CV (%) 13.3 11.1 10.0 9.1 8.2 7.1
25°C
13 6.7 19.34 22.94 25.24 30.35 31.58 32.54
14 6.5 18.05 21.29 23.81 29.01 30.39 31.18
15 6.5 19.21 22.65 24.93 29.87 30.89 31.04
Average
18.9 22.3 24.7 29.7 31.0 31.6
Stdev. 0.7 0.9 0.8 0.7 0.6 0.8
CV (%) 3.8 4.0 3.1 2.3 1.9 2.6
37.8°C
13 6.7 28.23 31.23 32.27 32.84 31.29 26.55
14 6.5 28.98 30.81 31.98 33.19 31.84 27.04
15 6.5 28.77 30.73 31.10 30.46 28.91 23.95
Average
28.7 30.9 31.8 32.2 30.7 25.8
Stdev. 0.4 0.3 0.6 1.5 1.6 1.7
CV (%) 1.4 0.9 1.9 4.6 5.1 6.4
54.4°C
13 6.7 32.69 31.80 28.71 25.25 22.68 17.16
14 6.5 31.82 31.06 29.45 25.94 22.89 16.73
15 6.5 30.73 29.54 28.02 23.29 20.54 15.98
Average
31.7 30.8 28.7 24.8 22.0 16.6
Stdev. 1.0 1.2 0.7 1.4 1.3 0.6
CV (%) 3.1 3.7 2.5 5.5 5.9 3.6
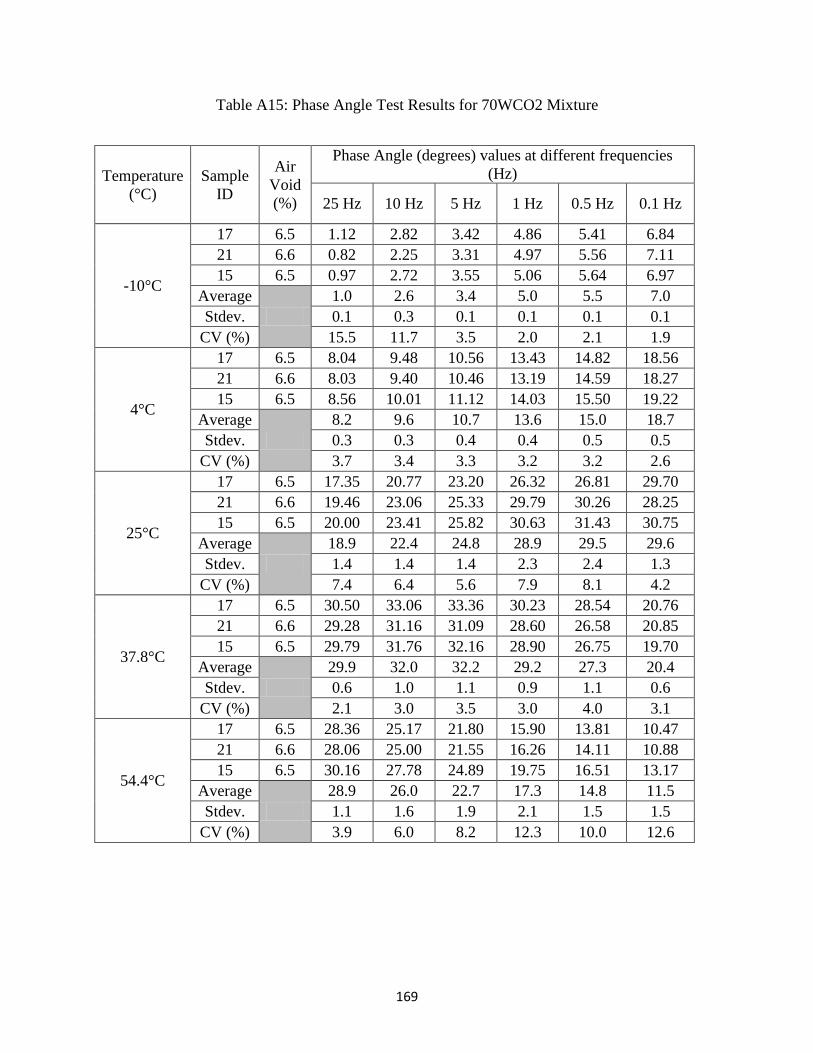
169
Table A15: Phase Angle Test Results for 70WCO2 Mixture
Temperature
(°C)
Sample
ID
Air
Void
(%)
Phase Angle (degrees) values at different frequencies
(Hz)
25 Hz 10 Hz 5 Hz 1 Hz 0.5 Hz 0.1 Hz
-10°C
17 6.5 1.12 2.82 3.42 4.86 5.41 6.84
21 6.6 0.82 2.25 3.31 4.97 5.56 7.11
15 6.5 0.97 2.72 3.55 5.06 5.64 6.97
Average
1.0 2.6 3.4 5.0 5.5 7.0
Stdev. 0.1 0.3 0.1 0.1 0.1 0.1
CV (%) 15.5 11.7 3.5 2.0 2.1 1.9
4°C
17 6.5 8.04 9.48 10.56 13.43 14.82 18.56
21 6.6 8.03 9.40 10.46 13.19 14.59 18.27
15 6.5 8.56 10.01 11.12 14.03 15.50 19.22
Average
8.2 9.6 10.7 13.6 15.0 18.7
Stdev. 0.3 0.3 0.4 0.4 0.5 0.5
CV (%) 3.7 3.4 3.3 3.2 3.2 2.6
25°C
17 6.5 17.35 20.77 23.20 26.32 26.81 29.70
21 6.6 19.46 23.06 25.33 29.79 30.26 28.25
15 6.5 20.00 23.41 25.82 30.63 31.43 30.75
Average
18.9 22.4 24.8 28.9 29.5 29.6
Stdev. 1.4 1.4 1.4 2.3 2.4 1.3
CV (%) 7.4 6.4 5.6 7.9 8.1 4.2
37.8°C
17 6.5 30.50 33.06 33.36 30.23 28.54 20.76
21 6.6 29.28 31.16 31.09 28.60 26.58 20.85
15 6.5 29.79 31.76 32.16 28.90 26.75 19.70
Average
29.9 32.0 32.2 29.2 27.3 20.4
Stdev. 0.6 1.0 1.1 0.9 1.1 0.6
CV (%) 2.1 3.0 3.5 3.0 4.0 3.1
54.4°C
17 6.5 28.36 25.17 21.80 15.90 13.81 10.47
21 6.6 28.06 25.00 21.55 16.26 14.11 10.88
15 6.5 30.16 27.78 24.89 19.75 16.51 13.17
Average
28.9 26.0 22.7 17.3 14.8 11.5
Stdev. 1.1 1.6 1.9 2.1 1.5 1.5
CV (%) 3.9 6.0 8.2 12.3 10.0 12.6

170
Table A16: Phase Angle Test Results for 70W15F Mixture
Temperature
(°C)
Sample
ID
Air
Void
(%)
Phase Angle (degrees) values at different frequencies
(Hz)
25 Hz 10 Hz 5 Hz 1 Hz 0.5 Hz 0.1 Hz
-10°C
24 6.5 0.59 2.05 2.77 4.15 4.59 5.77
22 6.0 0.83 2.47 3.24 4.75 5.25 6.66
16 6.6 0.30 2.06 2.99 4.49 4.98 6.42
Average
0.6 2.2 3.0 4.5 4.9 6.3
Stdev. 0.3 0.2 0.2 0.3 0.3 0.5
CV (%) 46.3 10.9 7.8 6.7 6.7 7.3
4°C
24 6.5 8.51 9.94 11.03 13.84 15.18 18.90
22 6.0 5.17 7.62 9.03 12.25 13.59 16.86
16 6.6 8.15 9.60 10.72 13.56 15.00 18.90
Average
7.3 9.1 10.3 13.2 14.6 18.2
Stdev. 1.8 1.3 1.1 0.8 0.9 1.2
CV (%) 25.2 13.8 10.5 6.4 6.0 6.5
25°C
24 6.5 19.90 23.94 26.27 31.27 32.07 31.21
22 6.0 19.51 23.95 26.37 31.60 32.79 32.14
16 6.6 20.37 24.16 26.61 31.44 32.79 30.78
Average
19.9 24.0 26.4 31.4 32.6 31.4
Stdev. 0.4 0.1 0.2 0.2 0.4 0.7
CV (%) 2.2 0.5 0.7 0.5 1.3 2.2
37.8°C
24 6.5 30.51 32.33 32.79 30.25 28.33 22.25
22 6.0 31.53 33.51 33.83 31.51 28.30 20.97
16 6.6 29.57 31.70 32.04 29.69 27.33 20.85
Average
30.5 32.5 32.9 30.5 28.0 21.4
Stdev. 1.0 0.9 0.9 0.9 0.6 0.8
CV (%) 3.2 2.8 2.7 3.1 2.0 3.6
54.4°C
24 6.5 31.16 28.98 25.88 19.45 17.02 13.79
22 6.0 29.45 27.31 24.16 17.81 15.34 11.49
16 6.6 28.96 25.45 22.61 16.46 13.94 9.79
Average
29.9 27.2 24.2 17.9 15.4 11.7
Stdev. 1.2 1.8 1.6 1.5 1.5 2.0
CV (%) 3.9 6.5 6.8 8.4 10.0 17.2
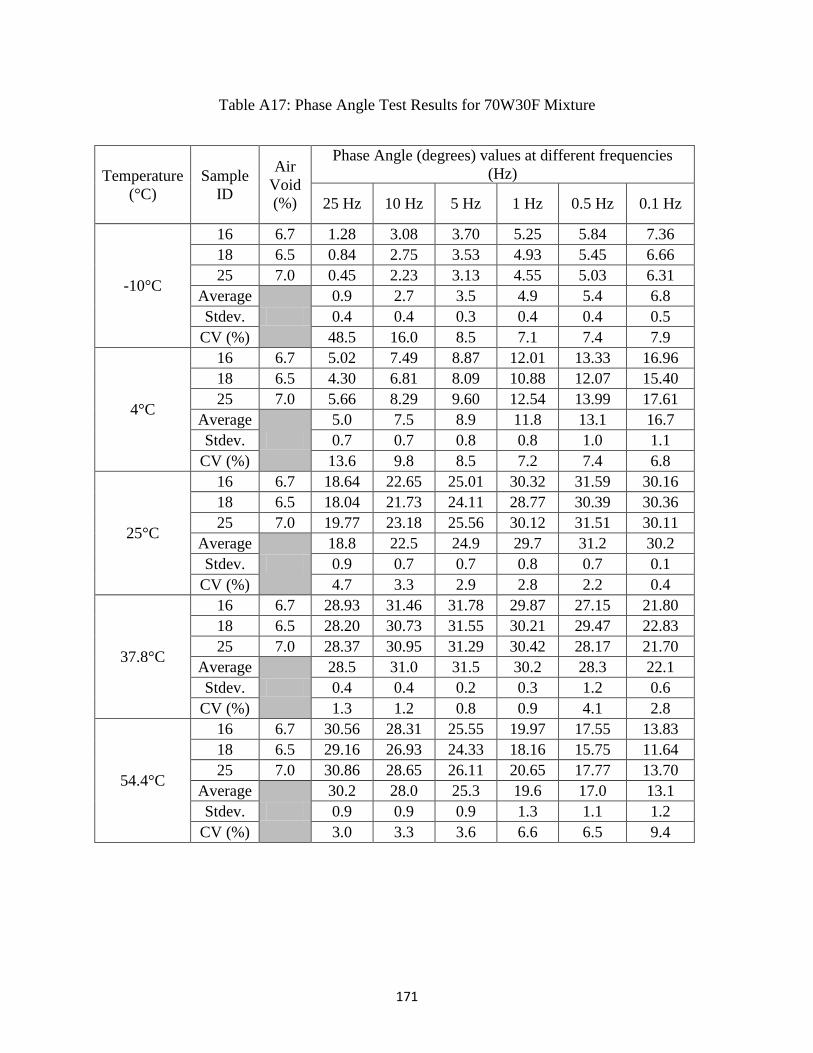
171
Table A17: Phase Angle Test Results for 70W30F Mixture
Temperature
(°C)
Sample
ID
Air
Void
(%)
Phase Angle (degrees) values at different frequencies
(Hz)
25 Hz 10 Hz 5 Hz 1 Hz 0.5 Hz 0.1 Hz
-10°C
16 6.7 1.28 3.08 3.70 5.25 5.84 7.36
18 6.5 0.84 2.75 3.53 4.93 5.45 6.66
25 7.0 0.45 2.23 3.13 4.55 5.03 6.31
Average
0.9 2.7 3.5 4.9 5.4 6.8
Stdev. 0.4 0.4 0.3 0.4 0.4 0.5
CV (%) 48.5 16.0 8.5 7.1 7.4 7.9
4°C
16 6.7 5.02 7.49 8.87 12.01 13.33 16.96
18 6.5 4.30 6.81 8.09 10.88 12.07 15.40
25 7.0 5.66 8.29 9.60 12.54 13.99 17.61
Average
5.0 7.5 8.9 11.8 13.1 16.7
Stdev. 0.7 0.7 0.8 0.8 1.0 1.1
CV (%) 13.6 9.8 8.5 7.2 7.4 6.8
25°C
16 6.7 18.64 22.65 25.01 30.32 31.59 30.16
18 6.5 18.04 21.73 24.11 28.77 30.39 30.36
25 7.0 19.77 23.18 25.56 30.12 31.51 30.11
Average
18.8 22.5 24.9 29.7 31.2 30.2
Stdev. 0.9 0.7 0.7 0.8 0.7 0.1
CV (%) 4.7 3.3 2.9 2.8 2.2 0.4
37.8°C
16 6.7 28.93 31.46 31.78 29.87 27.15 21.80
18 6.5 28.20 30.73 31.55 30.21 29.47 22.83
25 7.0 28.37 30.95 31.29 30.42 28.17 21.70
Average
28.5 31.0 31.5 30.2 28.3 22.1
Stdev. 0.4 0.4 0.2 0.3 1.2 0.6
CV (%) 1.3 1.2 0.8 0.9 4.1 2.8
54.4°C
16 6.7 30.56 28.31 25.55 19.97 17.55 13.83
18 6.5 29.16 26.93 24.33 18.16 15.75 11.64
25 7.0 30.86 28.65 26.11 20.65 17.77 13.70
Average
30.2 28.0 25.3 19.6 17.0 13.1
Stdev. 0.9 0.9 0.9 1.3 1.1 1.2
CV (%) 3.0 3.3 3.6 6.6 6.5 9.4

172
Table A18: Phase Angle Test Results for 70W15R Mixture
Temperature
(°C)
Sample
ID
Air
Void
(%)
Phase Angle (degrees) values at different frequencies
(Hz)
25 Hz 10 Hz 5 Hz 1 Hz 0.5 Hz 0.1 Hz
-10°C
16 6.6 1.25 2.94 3.76 5.32 5.77 6.77
17 6.4 2.12 3.62 4.33 5.96 6.58 8.22
18 6.5 1.11 2.69 3.36 4.75 5.24 6.57
Average
1.5 3.1 3.8 5.3 5.9 7.2
Stdev. 0.5 0.5 0.5 0.6 0.7 0.9
CV (%) 36.6 15.6 12.8 11.3 11.5 12.5
4°C
16 6.6 8.17 9.52 10.55 13.27 14.65 18.41
17 6.4 8.14 9.60 10.67 13.52 14.96 18.84
18 6.5 8.08 9.50 10.57 13.33 14.68 18.44
Average
8.1 9.5 10.6 13.4 14.8 18.6
Stdev. 0.0 0.1 0.1 0.1 0.2 0.2
CV (%) 0.6 0.6 0.6 1.0 1.2 1.3
25°C
16 6.6 17.43 21.09 22.75 26.78 27.62 27.53
17 6.4 18.44 22.60 25.36 29.30 30.25 28.50
18 6.5 18.61 22.01 23.57 27.88 28.62 27.30
Average
18.2 21.9 23.9 28.0 28.8 27.8
Stdev. 0.6 0.8 1.3 1.3 1.3 0.6
CV (%) 3.5 3.5 5.6 4.5 4.6 2.3
37.8°C
16 6.6 28.59 30.67 30.98 28.80 25.79 19.59
17 6.4 30.74 32.56 32.93 29.81 27.39 20.50
18 6.5 29.59 31.38 31.28 29.62 26.63 19.90
Average
29.6 31.5 31.7 29.4 26.6 20.0
Stdev. 1.1 1.0 1.1 0.5 0.8 0.5
CV (%) 3.6 3.0 3.3 1.8 3.0 2.3
54.4°C
16 6.6 28.35 25.59 22.65 16.91 15.13 11.28
17 6.4 27.49 24.63 21.02 15.49 13.25 9.78
18 6.5 28.97 26.39 23.68 18.37 15.29 12.53
Average
28.3 25.5 22.5 16.9 14.6 11.2
Stdev. 0.7 0.9 1.3 1.4 1.1 1.4
CV (%) 2.6 3.5 6.0 8.5 7.8 12.3

173
Table A19: Phase Angle Test Results for 70CO3 Mixture
Temperature
(°C)
Sample
ID
Air
Void
(%)
Phase Angle (degrees) values at different frequencies
(Hz)
25 Hz 10 Hz 5 Hz 1 Hz 0.5 Hz 0.1 Hz
-10°C
12 6.1 0.44 2.42 3.06 4.40 4.92 6.17
19 6.1 0.16 2.35 2.88 4.13 4.73 6.09
22 6.1 0.80 2.19 2.80 4.27 4.83 6.25
Average
0.5 2.3 2.9 4.3 4.8 6.2
Stdev. 0.3 0.1 0.1 0.1 0.1 0.1
CV (%) 68.7 5.1 4.6 3.2 2.0 1.3
4°C
12 6.1 7.58 8.95 10.02 12.69 13.94 17.38
19 6.1 7.72 8.93 9.91 12.46 13.77 17.17
22 6.1 7.13 8.33 9.24 11.48 12.50 15.44
Average
7.5 8.7 9.7 12.2 13.4 16.7
Stdev. 0.3 0.4 0.4 0.6 0.8 1.1
CV (%) 4.1 4.0 4.3 5.3 5.9 6.4
25°C
12 6.1 21.67 23.94 25.45 29.32 30.30 32.61
19 6.1 21.10 23.89 25.60 29.74 30.74 32.95
22 6.1 19.35 21.92 23.50 27.37 28.47 31.43
Average
20.7 23.3 24.9 28.8 29.8 32.3
Stdev. 1.2 1.2 1.2 1.3 1.2 0.8
CV (%) 5.8 5.0 4.7 4.4 4.0 2.5
37.8°C
12 6.1 30.94 32.78 33.47 34.76 34.55 33.72
19 6.1 30.87 32.86 33.59 34.93 34.65 33.93
22 6.1 28.73 30.87 31.77 33.91 33.88 34.06
Average
30.2 32.2 32.9 34.5 34.4 33.9
Stdev. 1.3 1.1 1.0 0.5 0.4 0.2
CV (%) 4.2 3.5 3.1 1.6 1.2 0.5
54.4°C
12 6.1 37.02 38.35 37.20 34.16 31.86 26.99
19 6.1 36.70 37.85 36.62 33.53 30.96 25.74
22 6.1 36.10 37.36 36.37 34.05 32.19 28.09
Average
36.6 37.9 36.7 33.9 31.7 26.9
Stdev. 0.5 0.5 0.4 0.3 0.6 1.2
CV (%) 1.3 1.3 1.2 1.0 2.0 4.4
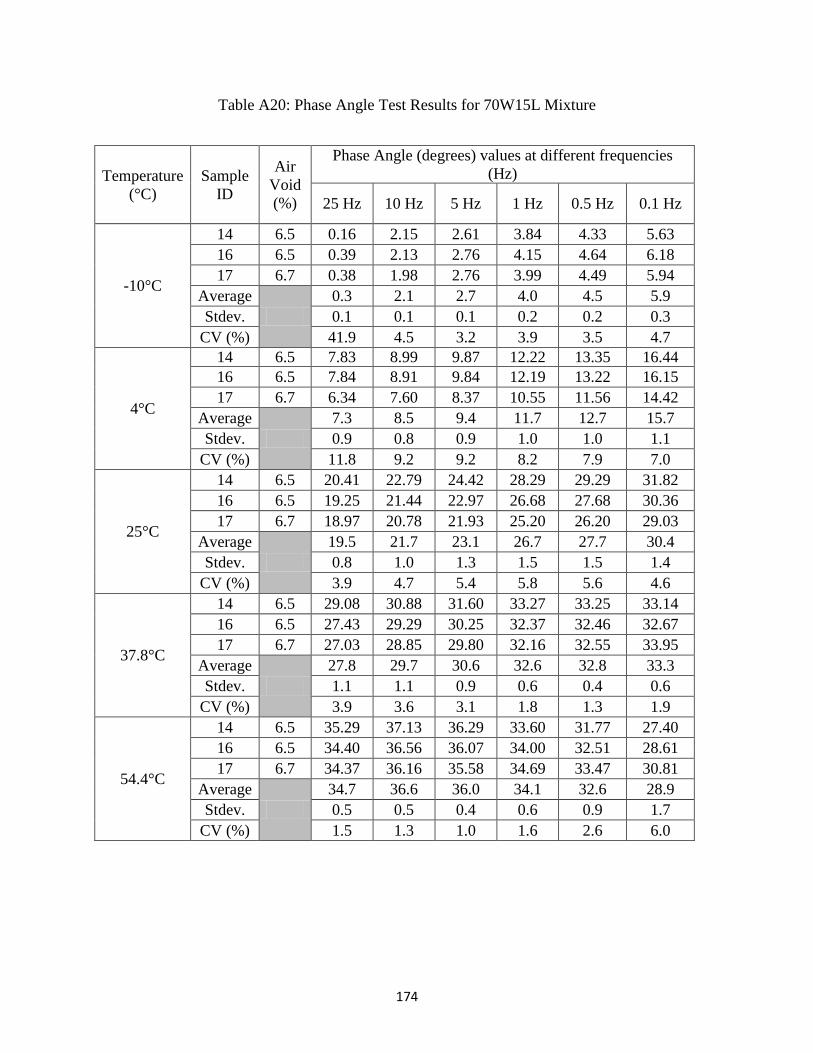
174
Table A20: Phase Angle Test Results for 70W15L Mixture
Temperature
(°C)
Sample
ID
Air
Void
(%)
Phase Angle (degrees) values at different frequencies
(Hz)
25 Hz 10 Hz 5 Hz 1 Hz 0.5 Hz 0.1 Hz
-10°C
14 6.5 0.16 2.15 2.61 3.84 4.33 5.63
16 6.5 0.39 2.13 2.76 4.15 4.64 6.18
17 6.7 0.38 1.98 2.76 3.99 4.49 5.94
Average
0.3 2.1 2.7 4.0 4.5 5.9
Stdev. 0.1 0.1 0.1 0.2 0.2 0.3
CV (%) 41.9 4.5 3.2 3.9 3.5 4.7
4°C
14 6.5 7.83 8.99 9.87 12.22 13.35 16.44
16 6.5 7.84 8.91 9.84 12.19 13.22 16.15
17 6.7 6.34 7.60 8.37 10.55 11.56 14.42
Average
7.3 8.5 9.4 11.7 12.7 15.7
Stdev. 0.9 0.8 0.9 1.0 1.0 1.1
CV (%) 11.8 9.2 9.2 8.2 7.9 7.0
25°C
14 6.5 20.41 22.79 24.42 28.29 29.29 31.82
16 6.5 19.25 21.44 22.97 26.68 27.68 30.36
17 6.7 18.97 20.78 21.93 25.20 26.20 29.03
Average
19.5 21.7 23.1 26.7 27.7 30.4
Stdev. 0.8 1.0 1.3 1.5 1.5 1.4
CV (%) 3.9 4.7 5.4 5.8 5.6 4.6
37.8°C
14 6.5 29.08 30.88 31.60 33.27 33.25 33.14
16 6.5 27.43 29.29 30.25 32.37 32.46 32.67
17 6.7 27.03 28.85 29.80 32.16 32.55 33.95
Average
27.8 29.7 30.6 32.6 32.8 33.3
Stdev. 1.1 1.1 0.9 0.6 0.4 0.6
CV (%) 3.9 3.6 3.1 1.8 1.3 1.9
54.4°C
14 6.5 35.29 37.13 36.29 33.60 31.77 27.40
16 6.5 34.40 36.56 36.07 34.00 32.51 28.61
17 6.7 34.37 36.16 35.58 34.69 33.47 30.81
Average
34.7 36.6 36.0 34.1 32.6 28.9
Stdev. 0.5 0.5 0.4 0.6 0.9 1.7
CV (%) 1.5 1.3 1.0 1.6 2.6 6.0
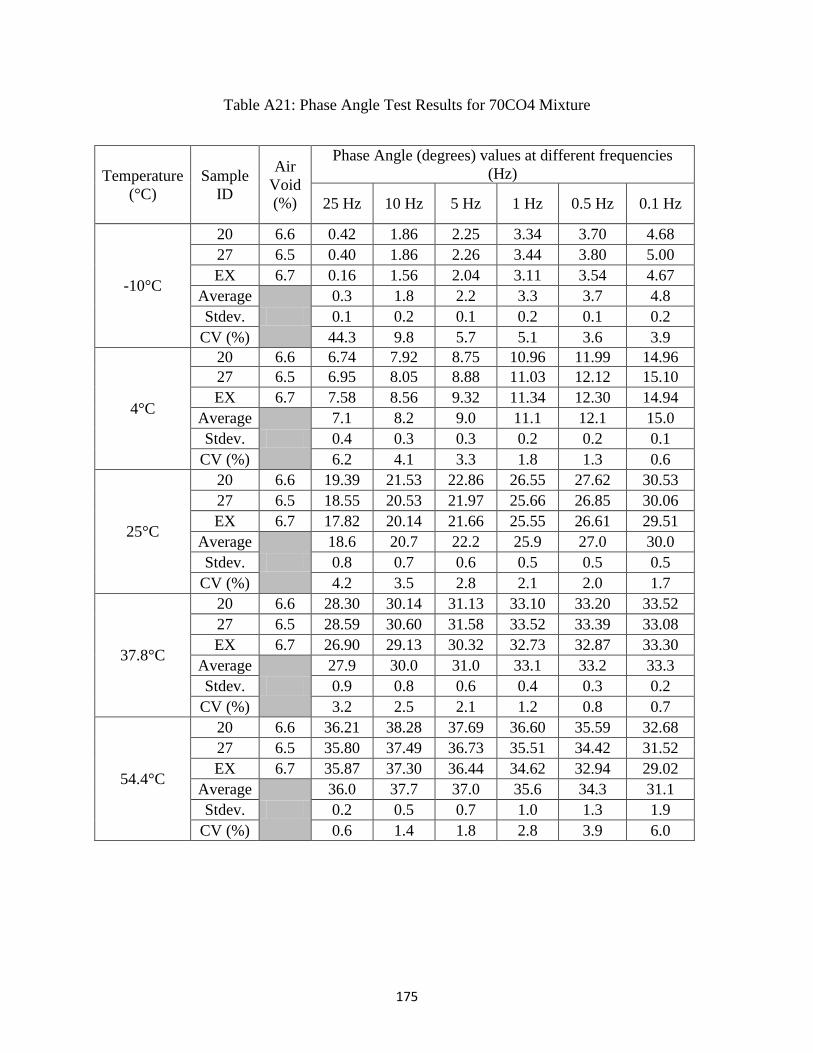
175
Table A21: Phase Angle Test Results for 70CO4 Mixture
Temperature
(°C)
Sample
ID
Air
Void
(%)
Phase Angle (degrees) values at different frequencies
(Hz)
25 Hz 10 Hz 5 Hz 1 Hz 0.5 Hz 0.1 Hz
-10°C
20 6.6 0.42 1.86 2.25 3.34 3.70 4.68
27 6.5 0.40 1.86 2.26 3.44 3.80 5.00
EX 6.7 0.16 1.56 2.04 3.11 3.54 4.67
Average
0.3 1.8 2.2 3.3 3.7 4.8
Stdev. 0.1 0.2 0.1 0.2 0.1 0.2
CV (%) 44.3 9.8 5.7 5.1 3.6 3.9
4°C
20 6.6 6.74 7.92 8.75 10.96 11.99 14.96
27 6.5 6.95 8.05 8.88 11.03 12.12 15.10
EX 6.7 7.58 8.56 9.32 11.34 12.30 14.94
Average
7.1 8.2 9.0 11.1 12.1 15.0
Stdev. 0.4 0.3 0.3 0.2 0.2 0.1
CV (%) 6.2 4.1 3.3 1.8 1.3 0.6
25°C
20 6.6 19.39 21.53 22.86 26.55 27.62 30.53
27 6.5 18.55 20.53 21.97 25.66 26.85 30.06
EX 6.7 17.82 20.14 21.66 25.55 26.61 29.51
Average
18.6 20.7 22.2 25.9 27.0 30.0
Stdev. 0.8 0.7 0.6 0.5 0.5 0.5
CV (%) 4.2 3.5 2.8 2.1 2.0 1.7
37.8°C
20 6.6 28.30 30.14 31.13 33.10 33.20 33.52
27 6.5 28.59 30.60 31.58 33.52 33.39 33.08
EX 6.7 26.90 29.13 30.32 32.73 32.87 33.30
Average
27.9 30.0 31.0 33.1 33.2 33.3
Stdev. 0.9 0.8 0.6 0.4 0.3 0.2
CV (%) 3.2 2.5 2.1 1.2 0.8 0.7
54.4°C
20 6.6 36.21 38.28 37.69 36.60 35.59 32.68
27 6.5 35.80 37.49 36.73 35.51 34.42 31.52
EX 6.7 35.87 37.30 36.44 34.62 32.94 29.02
Average
36.0 37.7 37.0 35.6 34.3 31.1
Stdev. 0.2 0.5 0.7 1.0 1.3 1.9
CV (%) 0.6 1.4 1.8 2.8 3.9 6.0

176
Table A22: Phase Angle Test Results for 70W20L Mixture
Temperature
(°C)
Sample
ID
Air
Void
(%)
Phase Angle (degrees) values at different frequencies
(Hz)
25 Hz 10 Hz 5 Hz 1 Hz 0.5 Hz 0.1 Hz
-10°C
15 6.6 0.51 1.87 2.17 3.21 3.65 4.82
20 6.5 0.30 2.44 2.99 4.22 4.80 6.30
21 6.2 0.60 1.53 1.99 2.92 3.30 4.31
Average
0.5 1.9 2.4 3.5 3.9 5.1
Stdev. 0.2 0.5 0.5 0.7 0.8 1.0
CV (%) 32.8 23.6 22.4 19.8 20.0 20.1
4°C
15 6.6 7.16 8.48 9.79 12.24 13.40 16.50
20 6.5 7.28 8.47 9.35 11.72 12.78 15.82
21 6.2 7.50 8.85 9.87 12.45 13.68 17.07
Average
7.3 8.6 9.7 12.1 13.3 16.5
Stdev. 0.2 0.2 0.3 0.4 0.5 0.6
CV (%) 2.4 2.5 2.9 3.1 3.5 3.8
25°C
15 6.6 20.28 22.57 24.12 27.99 29.14 32.03
20 6.5 19.87 21.90 23.30 26.91 27.97 30.60
21 6.2 20.10 22.25 23.71 27.34 28.19 30.36
Average
20.1 22.2 23.7 27.4 28.4 31.0
Stdev. 0.2 0.3 0.4 0.5 0.6 0.9
CV (%) 1.0 1.5 1.7 2.0 2.2 2.9
37.8°C
15 6.6 29.97 32.04 33.07 35.17 35.07 35.20
20 6.5 29.06 30.93 31.76 33.46 33.19 32.79
21 6.2 28.64 30.55 31.36 33.03 32.81 32.33
Average
29.2 31.2 32.1 33.9 33.7 33.4
Stdev. 0.7 0.8 0.9 1.1 1.2 1.5
CV (%) 2.3 2.5 2.8 3.3 3.6 4.6
54.4°C
15 6.6 35.99 38.27 37.43 34.81 32.88 28.97
20 6.5 35.48 37.01 36.19 34.16 32.53 28.97
21 6.2 35.14 36.44 35.33 33.16 31.63 28.12
Average
35.5 37.2 36.3 34.0 32.3 28.7
Stdev. 0.4 0.9 1.1 0.8 0.6 0.5
CV (%) 1.2 2.5 2.9 2.4 2.0 1.7
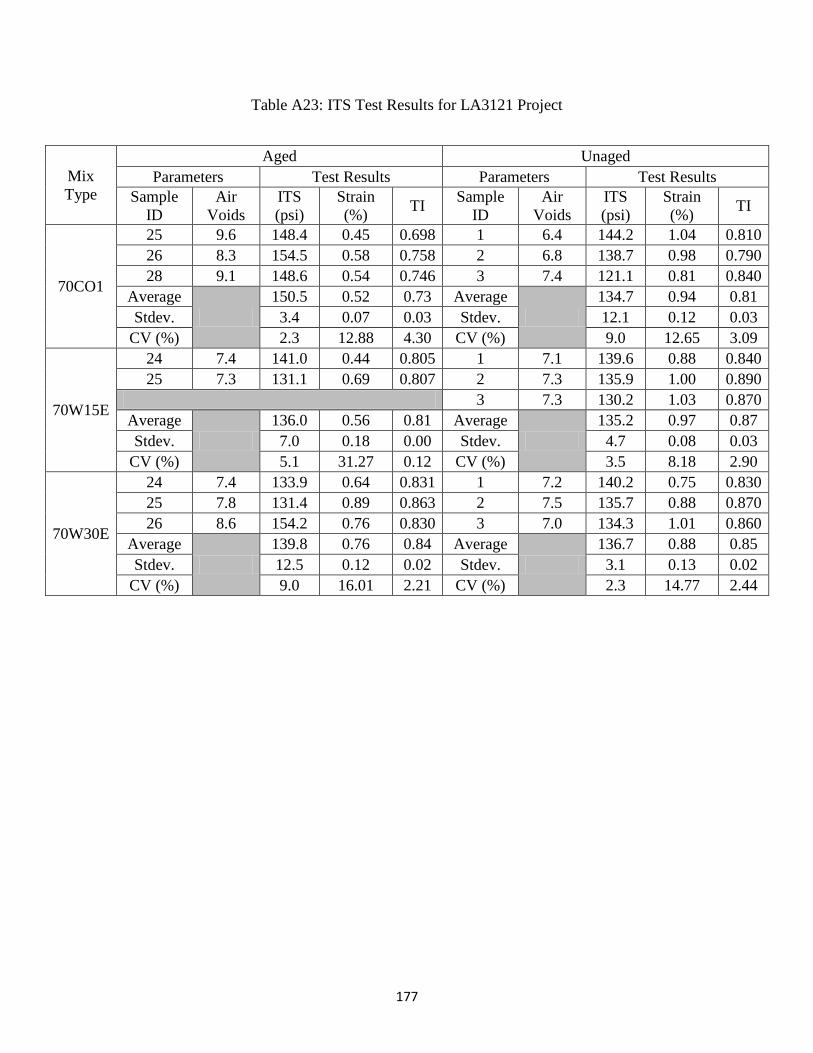
177
Table A23: ITS Test Results for LA3121 Project
Mix
Type
Aged Unaged
Parameters Test Results Parameters Test Results
Sample
ID
Air
Voids
ITS
(psi)
Strain
(%) TI
Sample
ID
Air
Voids
ITS
(psi)
Strain
(%) TI
70CO1
25 9.6 148.4 0.45 0.698 1 6.4 144.2 1.04 0.810
26 8.3 154.5 0.58 0.758 2 6.8 138.7 0.98 0.790
28 9.1 148.6 0.54 0.746 3 7.4 121.1 0.81 0.840
Average
150.5 0.52 0.73 Average
134.7 0.94 0.81
Stdev. 3.4 0.07 0.03 Stdev. 12.1 0.12 0.03
CV (%) 2.3 12.88 4.30 CV (%) 9.0 12.65 3.09
70W15E
24 7.4 141.0 0.44 0.805 1 7.1 139.6 0.88 0.840
25 7.3 131.1 0.69 0.807 2 7.3 135.9 1.00 0.890
3 7.3 130.2 1.03 0.870
Average
136.0 0.56 0.81 Average
135.2 0.97 0.87
Stdev. 7.0 0.18 0.00 Stdev. 4.7 0.08 0.03
CV (%) 5.1 31.27 0.12 CV (%) 3.5 8.18 2.90
70W30E
24 7.4 133.9 0.64 0.831 1 7.2 140.2 0.75 0.830
25 7.8 131.4 0.89 0.863 2 7.5 135.7 0.88 0.870
26 8.6 154.2 0.76 0.830 3 7.0 134.3 1.01 0.860
Average
139.8 0.76 0.84 Average
136.7 0.88 0.85
Stdev. 12.5 0.12 0.02 Stdev. 3.1 0.13 0.02
CV (%) 9.0 16.01 2.21 CV (%) 2.3 14.77 2.44
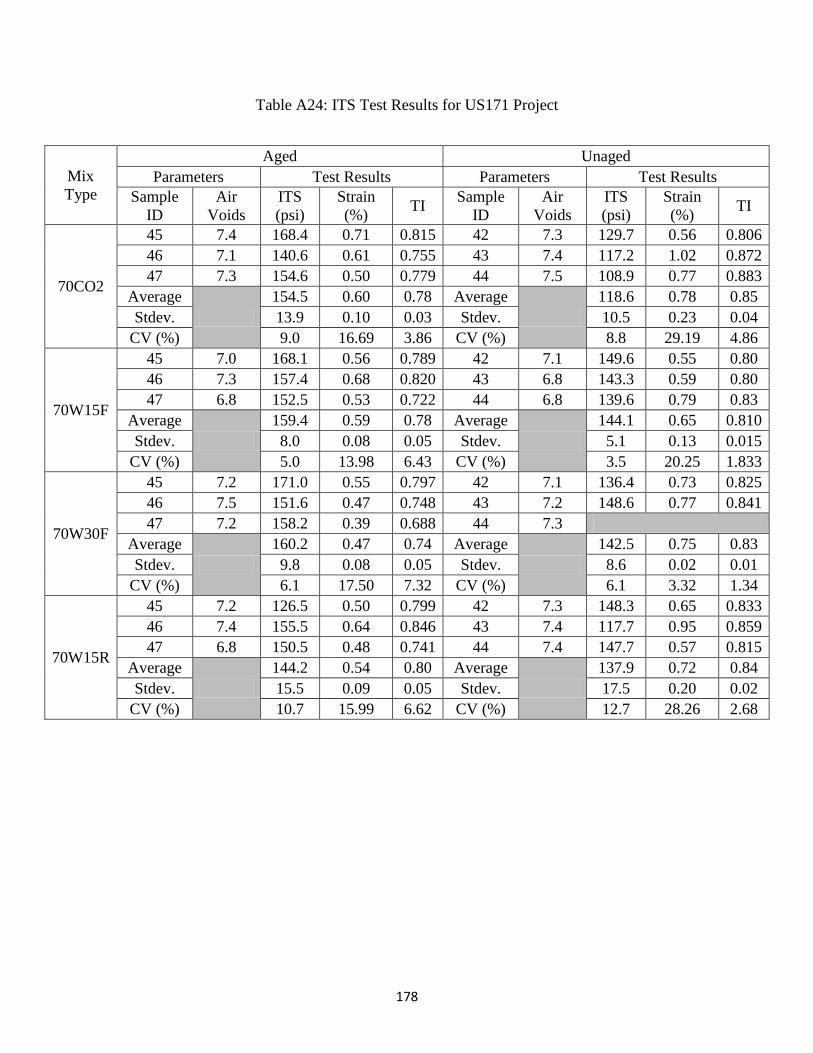
178
Table A24: ITS Test Results for US171 Project
Mix
Type
Aged Unaged
Parameters Test Results Parameters Test Results
Sample
ID
Air
Voids
ITS
(psi)
Strain
(%) TI
Sample
ID
Air
Voids
ITS
(psi)
Strain
(%) TI
70CO2
45 7.4 168.4 0.71 0.815 42 7.3 129.7 0.56 0.806
46 7.1 140.6 0.61 0.755 43 7.4 117.2 1.02 0.872
47 7.3 154.6 0.50 0.779 44 7.5 108.9 0.77 0.883
Average
154.5 0.60 0.78 Average
118.6 0.78 0.85
Stdev. 13.9 0.10 0.03 Stdev. 10.5 0.23 0.04
CV (%) 9.0 16.69 3.86 CV (%) 8.8 29.19 4.86
70W15F
45 7.0 168.1 0.56 0.789 42 7.1 149.6 0.55 0.80
46 7.3 157.4 0.68 0.820 43 6.8 143.3 0.59 0.80
47 6.8 152.5 0.53 0.722 44 6.8 139.6 0.79 0.83
Average
159.4 0.59 0.78 Average
144.1 0.65 0.810
Stdev. 8.0 0.08 0.05 Stdev. 5.1 0.13 0.015
CV (%) 5.0 13.98 6.43 CV (%) 3.5 20.25 1.833
70W30F
45 7.2 171.0 0.55 0.797 42 7.1 136.4 0.73 0.825
46 7.5 151.6 0.47 0.748 43 7.2 148.6 0.77 0.841
47 7.2 158.2 0.39 0.688 44 7.3
Average
160.2 0.47 0.74 Average
142.5 0.75 0.83
Stdev. 9.8 0.08 0.05 Stdev. 8.6 0.02 0.01
CV (%) 6.1 17.50 7.32 CV (%) 6.1 3.32 1.34
70W15R
45 7.2 126.5 0.50 0.799 42 7.3 148.3 0.65 0.833
46 7.4 155.5 0.64 0.846 43 7.4 117.7 0.95 0.859
47 6.8 150.5 0.48 0.741 44 7.4 147.7 0.57 0.815
Average
144.2 0.54 0.80 Average
137.9 0.72 0.84
Stdev. 15.5 0.09 0.05 Stdev. 17.5 0.20 0.02
CV (%) 10.7 15.99 6.62 CV (%) 12.7 28.26 2.68
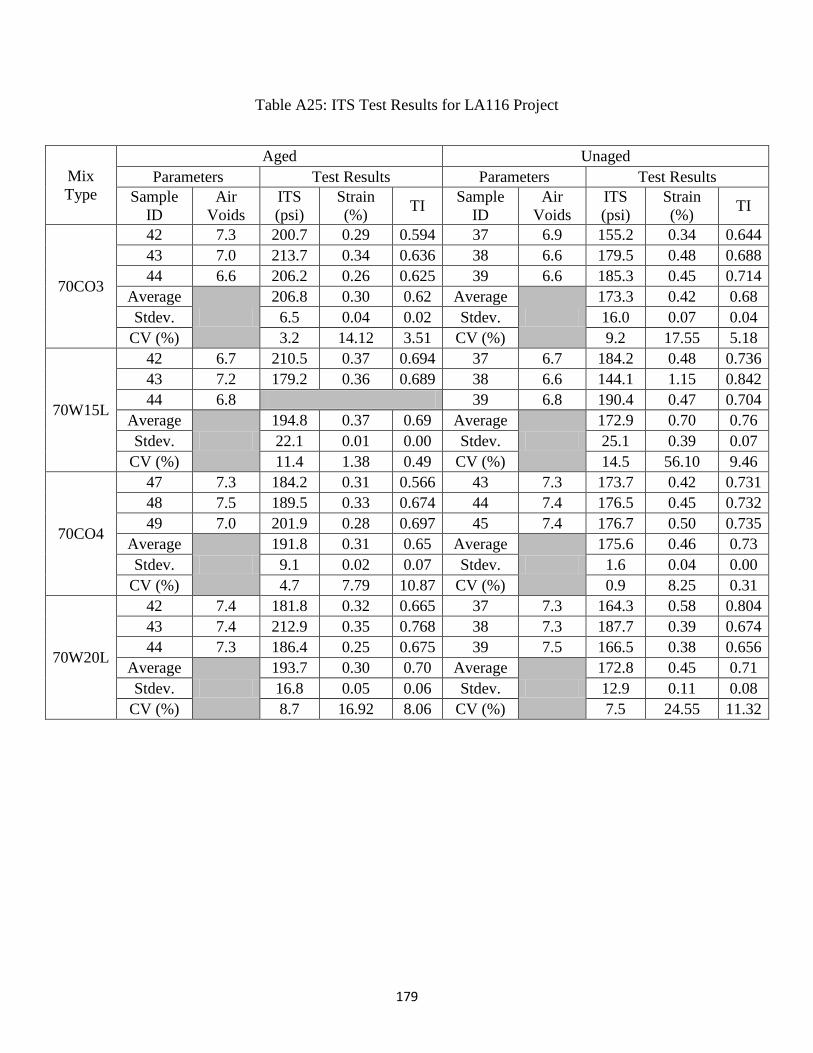
179
Table A25: ITS Test Results for LA116 Project
Mix
Type
Aged Unaged
Parameters Test Results Parameters Test Results
Sample
ID
Air
Voids
ITS
(psi)
Strain
(%) TI
Sample
ID
Air
Voids
ITS
(psi)
Strain
(%) TI
70CO3
42 7.3 200.7 0.29 0.594 37 6.9 155.2 0.34 0.644
43 7.0 213.7 0.34 0.636 38 6.6 179.5 0.48 0.688
44 6.6 206.2 0.26 0.625 39 6.6 185.3 0.45 0.714
Average
206.8 0.30 0.62 Average
173.3 0.42 0.68
Stdev. 6.5 0.04 0.02 Stdev. 16.0 0.07 0.04
CV (%) 3.2 14.12 3.51 CV (%) 9.2 17.55 5.18
70W15L
42 6.7 210.5 0.37 0.694 37 6.7 184.2 0.48 0.736
43 7.2 179.2 0.36 0.689 38 6.6 144.1 1.15 0.842
44 6.8 39 6.8 190.4 0.47 0.704
Average
194.8 0.37 0.69 Average
172.9 0.70 0.76
Stdev. 22.1 0.01 0.00 Stdev. 25.1 0.39 0.07
CV (%) 11.4 1.38 0.49 CV (%) 14.5 56.10 9.46
70CO4
47 7.3 184.2 0.31 0.566 43 7.3 173.7 0.42 0.731
48 7.5 189.5 0.33 0.674 44 7.4 176.5 0.45 0.732
49 7.0 201.9 0.28 0.697 45 7.4 176.7 0.50 0.735
Average
191.8 0.31 0.65 Average
175.6 0.46 0.73
Stdev. 9.1 0.02 0.07 Stdev. 1.6 0.04 0.00
CV (%) 4.7 7.79 10.87 CV (%) 0.9 8.25 0.31
70W20L
42 7.4 181.8 0.32 0.665 37 7.3 164.3 0.58 0.804
43 7.4 212.9 0.35 0.768 38 7.3 187.7 0.39 0.674
44 7.3 186.4 0.25 0.675 39 7.5 166.5 0.38 0.656
Average
193.7 0.30 0.70 Average
172.8 0.45 0.71
Stdev. 16.8 0.05 0.06 Stdev. 12.9 0.11 0.08
CV (%) 8.7 16.92 8.06 CV (%) 7.5 24.55 11.32
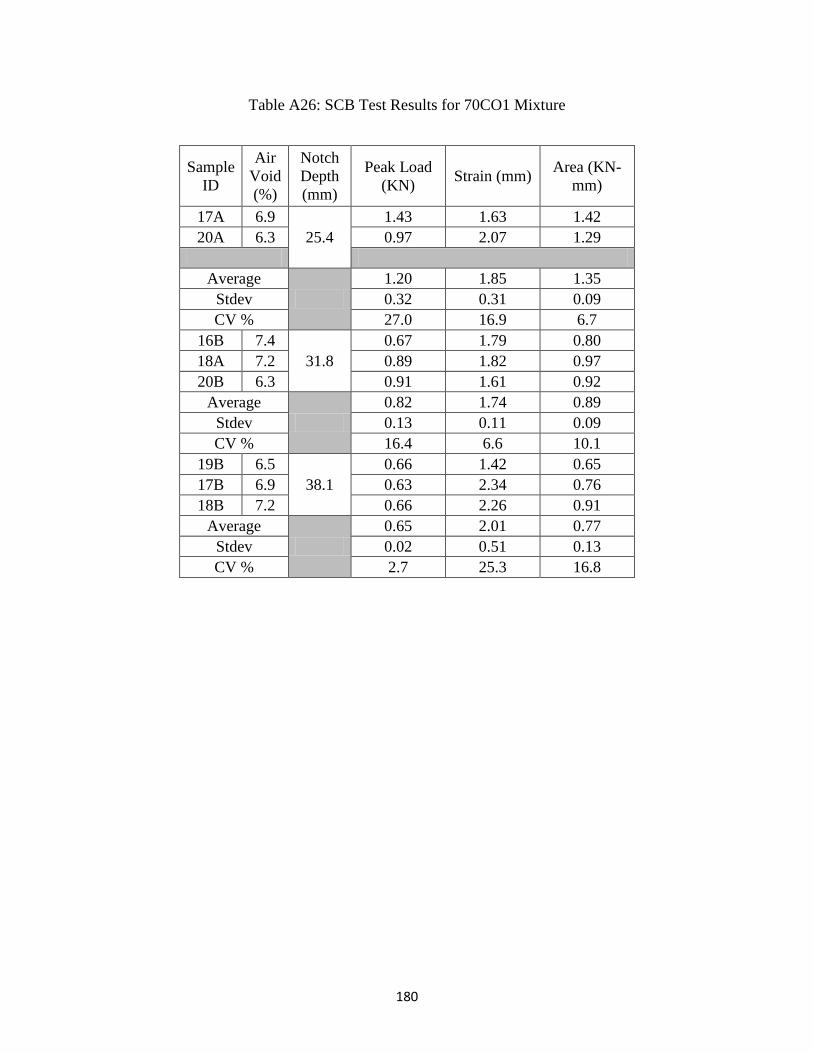
180
Table A26: SCB Test Results for 70CO1 Mixture
Sample
ID
Air
Void
(%)
Notch
Depth
(mm)
Peak Load
(KN) Strain (mm)
Area (KN-
mm)
17A 6.9
25.4
1.43 1.63 1.42
20A 6.3 0.97 2.07 1.29
Average
1.20 1.85 1.35
Stdev 0.32 0.31 0.09
CV % 27.0 16.9 6.7
16B 7.4
31.8
0.67 1.79 0.80
18A 7.2 0.89 1.82 0.97
20B 6.3 0.91 1.61 0.92
Average
0.82 1.74 0.89
Stdev 0.13 0.11 0.09
CV % 16.4 6.6 10.1
19B 6.5
38.1
0.66 1.42 0.65
17B 6.9 0.63 2.34 0.76
18B 7.2 0.66 2.26 0.91
Average
0.65 2.01 0.77
Stdev 0.02 0.51 0.13
CV % 2.7 25.3 16.8
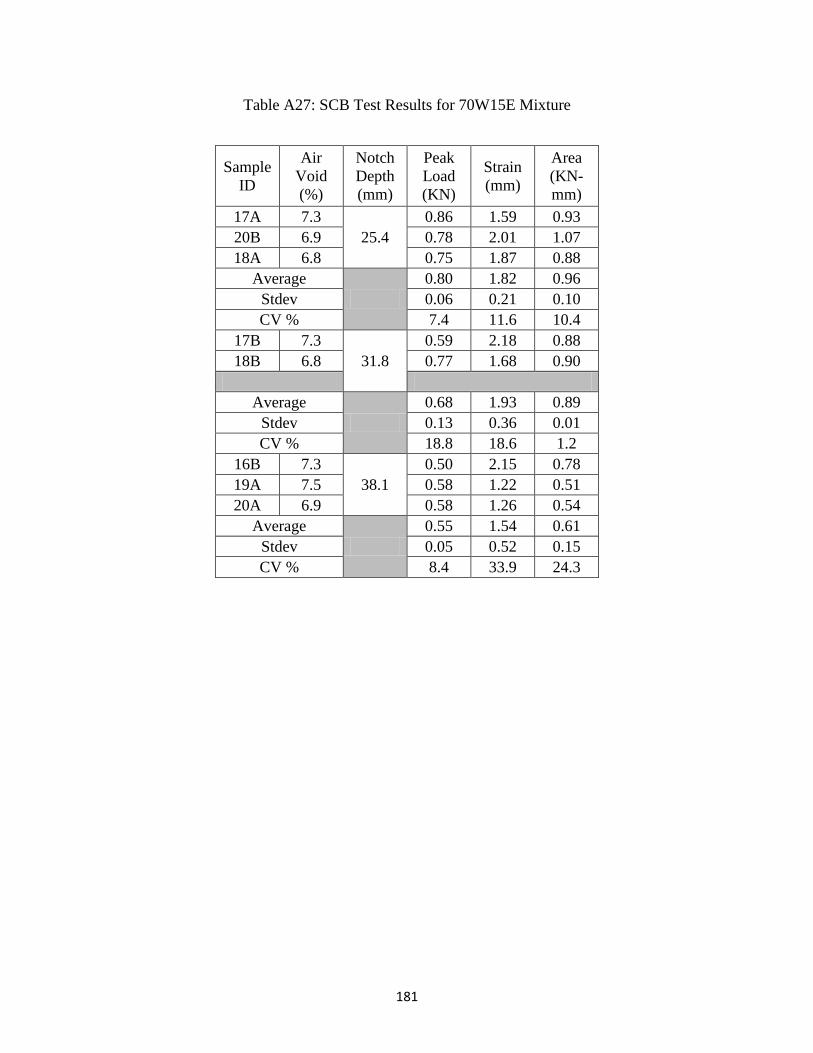
181
Table A27: SCB Test Results for 70W15E Mixture
Sample
ID
Air
Void
(%)
Notch
Depth
(mm)
Peak
Load
(KN)
Strain
(mm)
Area
(KN-
mm)
17A 7.3
25.4
0.86 1.59 0.93
20B 6.9 0.78 2.01 1.07
18A 6.8 0.75 1.87 0.88
Average
0.80 1.82 0.96
Stdev 0.06 0.21 0.10
CV % 7.4 11.6 10.4
17B 7.3
31.8
0.59 2.18 0.88
18B 6.8 0.77 1.68 0.90
Average
0.68 1.93 0.89
Stdev 0.13 0.36 0.01
CV % 18.8 18.6 1.2
16B 7.3
38.1
0.50 2.15 0.78
19A 7.5 0.58 1.22 0.51
20A 6.9 0.58 1.26 0.54
Average
0.55 1.54 0.61
Stdev 0.05 0.52 0.15
CV % 8.4 33.9 24.3
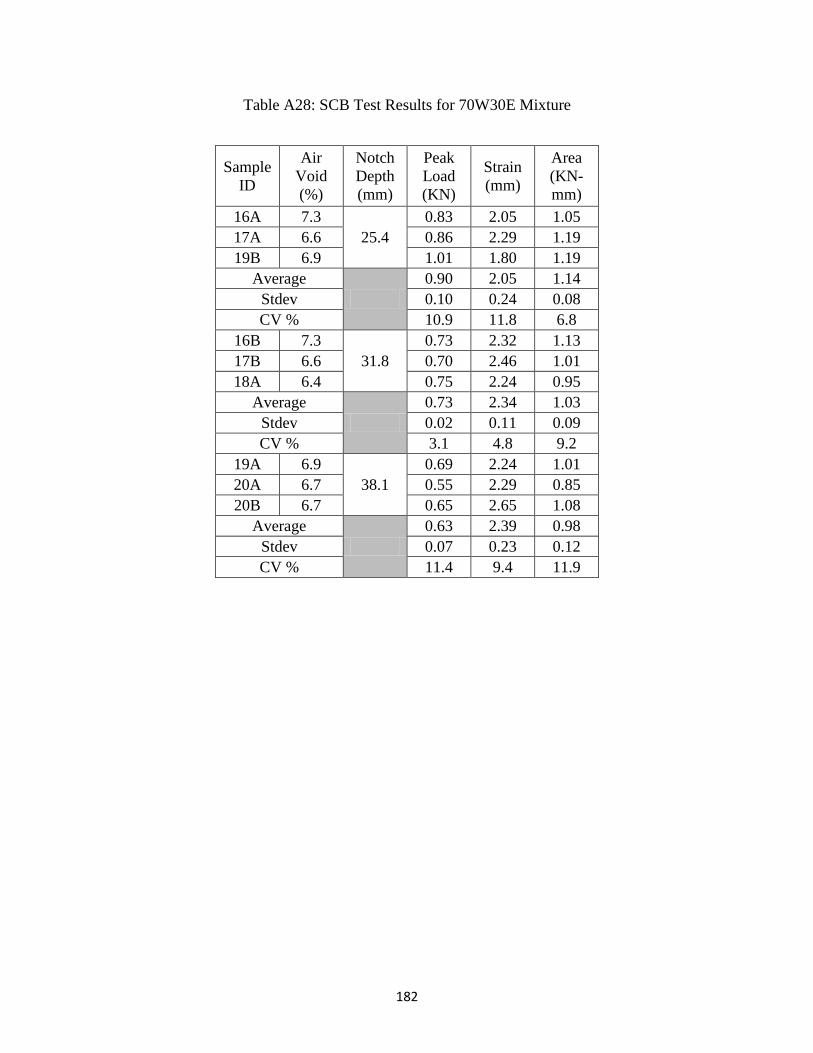
182
Table A28: SCB Test Results for 70W30E Mixture
Sample
ID
Air
Void
(%)
Notch
Depth
(mm)
Peak
Load
(KN)
Strain
(mm)
Area
(KN-
mm)
16A 7.3
25.4
0.83 2.05 1.05
17A 6.6 0.86 2.29 1.19
19B 6.9 1.01 1.80 1.19
Average
0.90 2.05 1.14
Stdev 0.10 0.24 0.08
CV % 10.9 11.8 6.8
16B 7.3
31.8
0.73 2.32 1.13
17B 6.6 0.70 2.46 1.01
18A 6.4 0.75 2.24 0.95
Average
0.73 2.34 1.03
Stdev 0.02 0.11 0.09
CV % 3.1 4.8 9.2
19A 6.9
38.1
0.69 2.24 1.01
20A 6.7 0.55 2.29 0.85
20B 6.7 0.65 2.65 1.08
Average
0.63 2.39 0.98
Stdev 0.07 0.23 0.12
CV % 11.4 9.4 11.9

183
Table A29: SCB Test Results for 70CO2 Mixture
Sample
ID
Air
Void
(%)
Notch
Depth
(mm)
Peak Load
(KN) Strain (mm)
Area (KN-
mm)
25.4
30A 7.0 0.69 1.40 0.60
35A 6.1 0.73 1.22 0.58
Average
0.71 1.31 0.59
Stdev 0.02 0.13 0.02
CV % 3.2 10.1 2.9
31A 6.9
31.8
0.57 1.26 0.47
33B 7.0 0.59 1.31 0.52
35B 6.1 0.34 1.46 0.33
Average
0.50 1.34 0.44
Stdev 0.14 0.10 0.10
CV % 27.5 7.7 22.8
31B 6.9
38.1
0.25 1.11 0.21
33A 7.0 0.36 1.05 0.26
34B 6.5 0.37 1.23 0.32
Average
0.33 1.13 0.26
Stdev 0.07 0.09 0.06
CV % 20.0 7.9 21.9
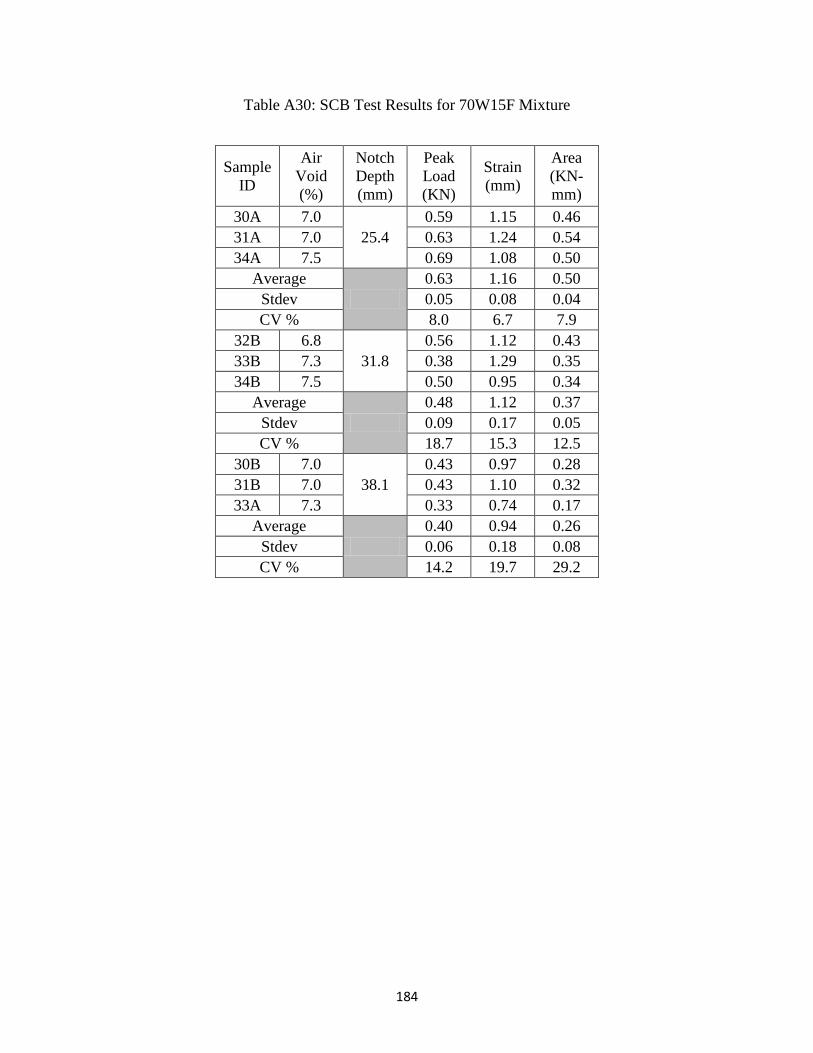
184
Table A30: SCB Test Results for 70W15F Mixture
Sample
ID
Air
Void
(%)
Notch
Depth
(mm)
Peak
Load
(KN)
Strain
(mm)
Area
(KN-
mm)
30A 7.0
25.4
0.59 1.15 0.46
31A 7.0 0.63 1.24 0.54
34A 7.5 0.69 1.08 0.50
Average
0.63 1.16 0.50
Stdev 0.05 0.08 0.04
CV % 8.0 6.7 7.9
32B 6.8
31.8
0.56 1.12 0.43
33B 7.3 0.38 1.29 0.35
34B 7.5 0.50 0.95 0.34
Average
0.48 1.12 0.37
Stdev 0.09 0.17 0.05
CV % 18.7 15.3 12.5
30B 7.0
38.1
0.43 0.97 0.28
31B 7.0 0.43 1.10 0.32
33A 7.3 0.33 0.74 0.17
Average
0.40 0.94 0.26
Stdev 0.06 0.18 0.08
CV % 14.2 19.7 29.2
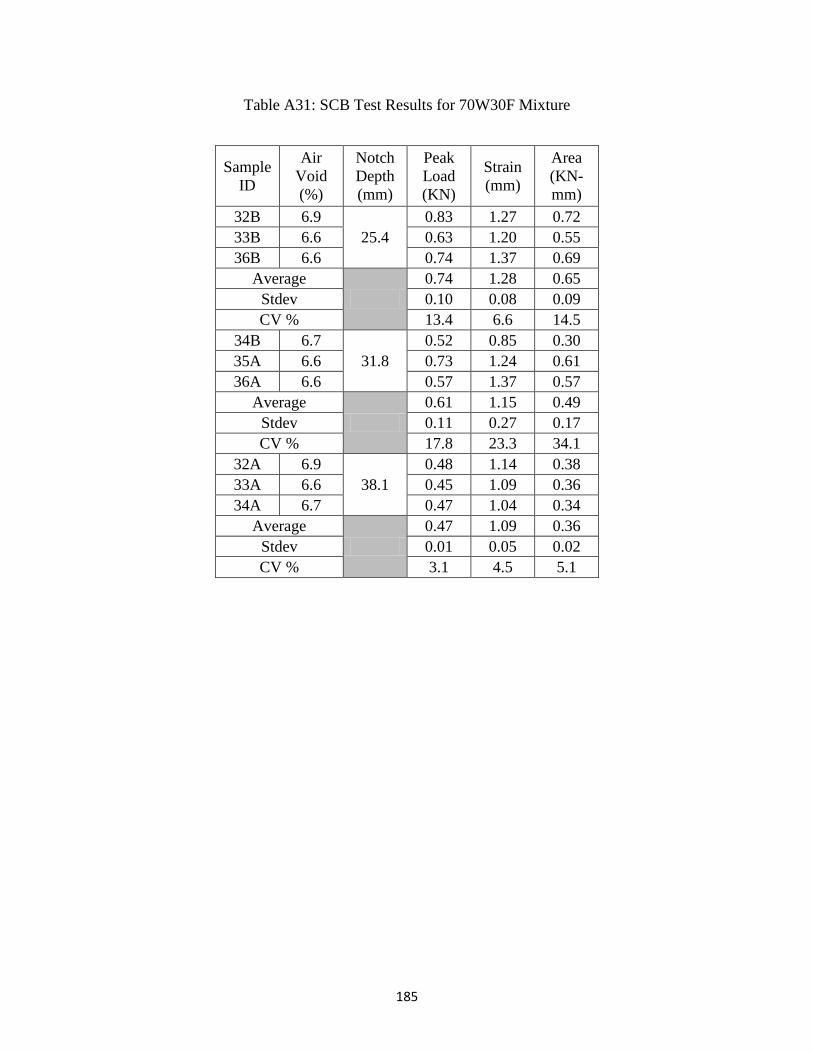
185
Table A31: SCB Test Results for 70W30F Mixture
Sample
ID
Air
Void
(%)
Notch
Depth
(mm)
Peak
Load
(KN)
Strain
(mm)
Area
(KN-
mm)
32B 6.9
25.4
0.83 1.27 0.72
33B 6.6 0.63 1.20 0.55
36B 6.6 0.74 1.37 0.69
Average
0.74 1.28 0.65
Stdev 0.10 0.08 0.09
CV % 13.4 6.6 14.5
34B 6.7
31.8
0.52 0.85 0.30
35A 6.6 0.73 1.24 0.61
36A 6.6 0.57 1.37 0.57
Average
0.61 1.15 0.49
Stdev 0.11 0.27 0.17
CV % 17.8 23.3 34.1
32A 6.9
38.1
0.48 1.14 0.38
33A 6.6 0.45 1.09 0.36
34A 6.7 0.47 1.04 0.34
Average
0.47 1.09 0.36
Stdev 0.01 0.05 0.02
CV % 3.1 4.5 5.1
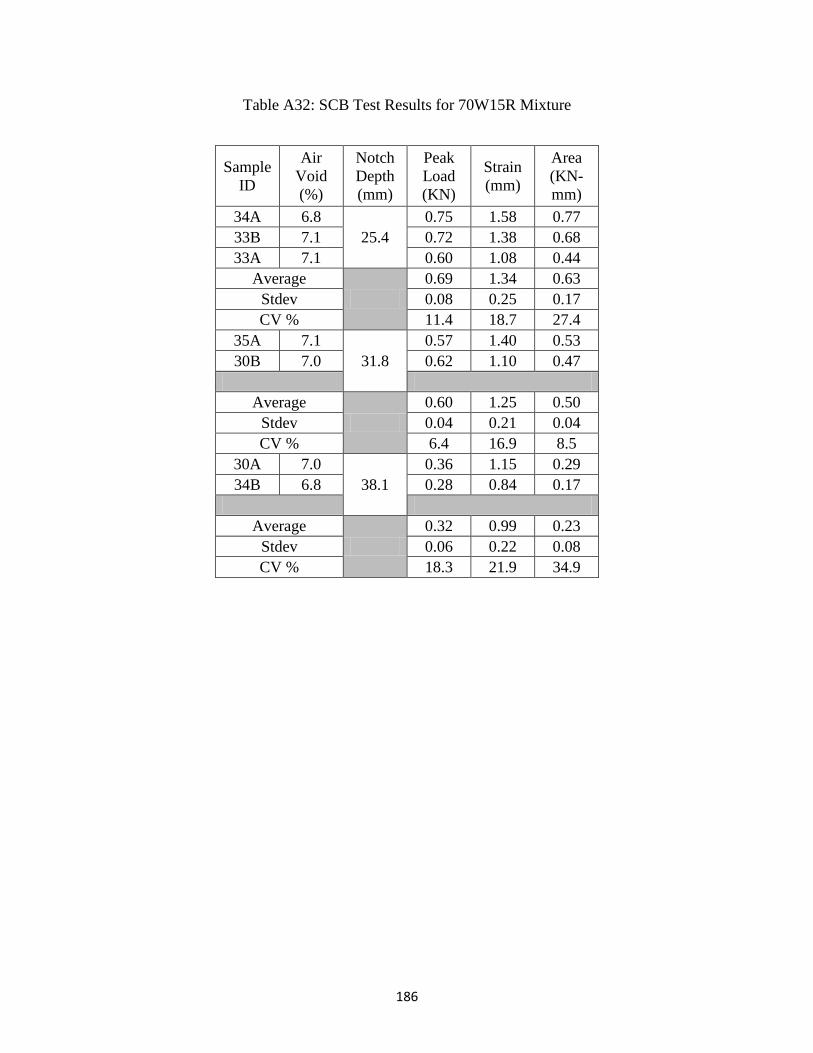
186
Table A32: SCB Test Results for 70W15R Mixture
Sample
ID
Air
Void
(%)
Notch
Depth
(mm)
Peak
Load
(KN)
Strain
(mm)
Area
(KN-
mm)
34A 6.8
25.4
0.75 1.58 0.77
33B 7.1 0.72 1.38 0.68
33A 7.1 0.60 1.08 0.44
Average
0.69 1.34 0.63
Stdev 0.08 0.25 0.17
CV % 11.4 18.7 27.4
35A 7.1
31.8
0.57 1.40 0.53
30B 7.0 0.62 1.10 0.47
Average
0.60 1.25 0.50
Stdev 0.04 0.21 0.04
CV % 6.4 16.9 8.5
30A 7.0
38.1
0.36 1.15 0.29
34B 6.8 0.28 0.84 0.17
Average
0.32 0.99 0.23
Stdev 0.06 0.22 0.08
CV % 18.3 21.9 34.9
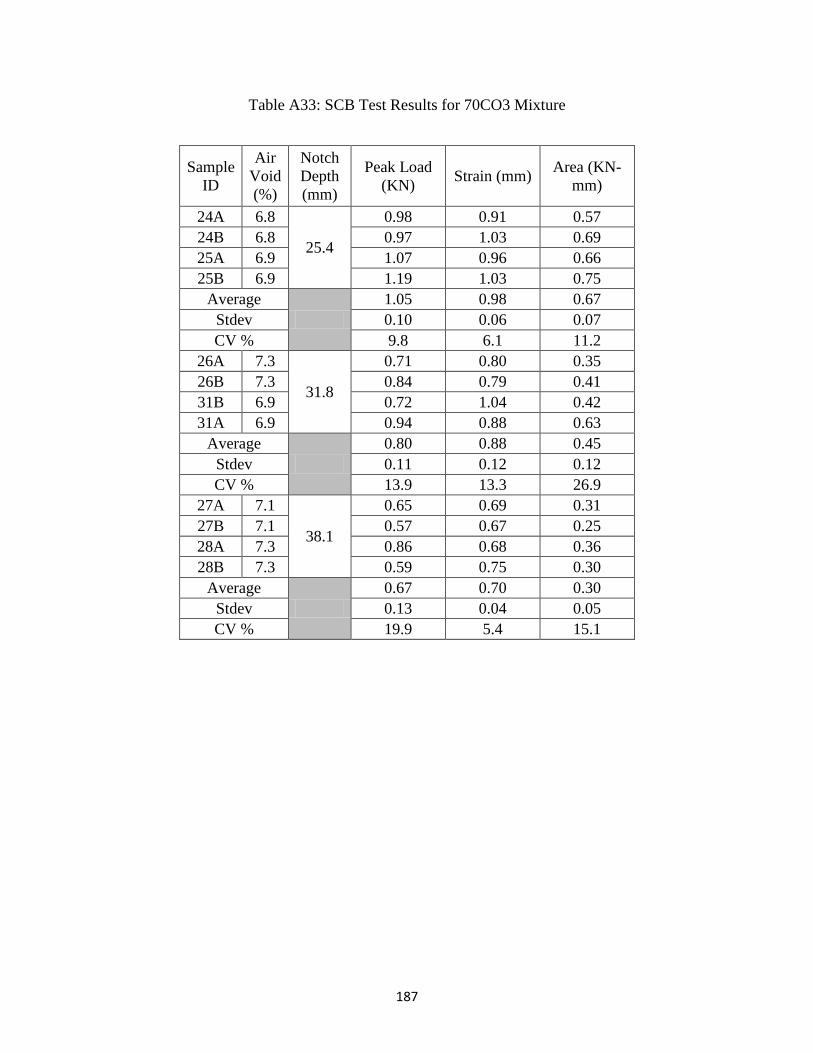
187
Table A33: SCB Test Results for 70CO3 Mixture
Sample
ID
Air
Void
(%)
Notch
Depth
(mm)
Peak Load
(KN) Strain (mm)
Area (KN-
mm)
24A 6.8
25.4
0.98 0.91 0.57
24B 6.8 0.97 1.03 0.69
25A 6.9 1.07 0.96 0.66
25B 6.9 1.19 1.03 0.75
Average
1.05 0.98 0.67
Stdev 0.10 0.06 0.07
CV % 9.8 6.1 11.2
26A 7.3
31.8
0.71 0.80 0.35
26B 7.3 0.84 0.79 0.41
31B 6.9 0.72 1.04 0.42
31A 6.9 0.94 0.88 0.63
Average
0.80 0.88 0.45
Stdev 0.11 0.12 0.12
CV % 13.9 13.3 26.9
27A 7.1
38.1
0.65 0.69 0.31
27B 7.1 0.57 0.67 0.25
28A 7.3 0.86 0.68 0.36
28B 7.3 0.59 0.75 0.30
Average
0.67 0.70 0.30
Stdev 0.13 0.04 0.05
CV % 19.9 5.4 15.1
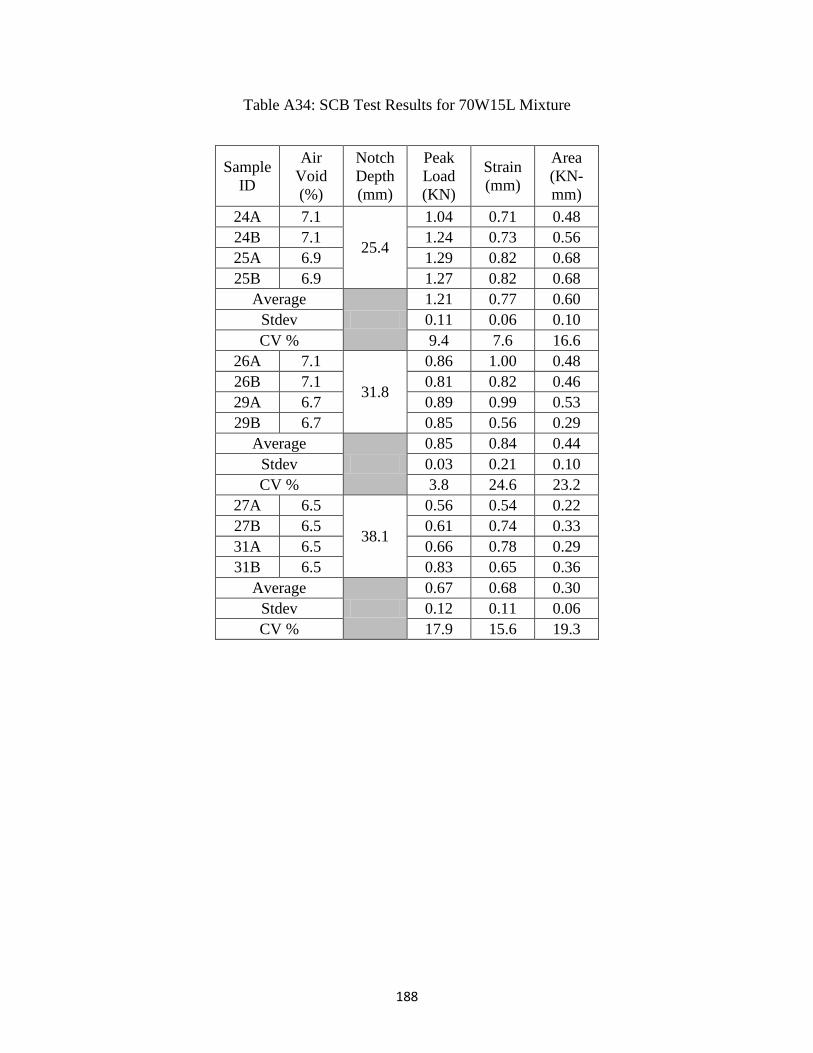
188
Table A34: SCB Test Results for 70W15L Mixture
Sample
ID
Air
Void
(%)
Notch
Depth
(mm)
Peak
Load
(KN)
Strain
(mm)
Area
(KN-
mm)
24A 7.1
25.4
1.04 0.71 0.48
24B 7.1 1.24 0.73 0.56
25A 6.9 1.29 0.82 0.68
25B 6.9 1.27 0.82 0.68
Average
1.21 0.77 0.60
Stdev 0.11 0.06 0.10
CV % 9.4 7.6 16.6
26A 7.1
31.8
0.86 1.00 0.48
26B 7.1 0.81 0.82 0.46
29A 6.7 0.89 0.99 0.53
29B 6.7 0.85 0.56 0.29
Average
0.85 0.84 0.44
Stdev 0.03 0.21 0.10
CV % 3.8 24.6 23.2
27A 6.5
38.1
0.56 0.54 0.22
27B 6.5 0.61 0.74 0.33
31A 6.5 0.66 0.78 0.29
31B 6.5 0.83 0.65 0.36
Average
0.67 0.68 0.30
Stdev 0.12 0.11 0.06
CV % 17.9 15.6 19.3

189
Table A35: SCB Test Results for 70CO4 Mixture
Sample
ID
Air
Void
(%)
Notch
Depth
(mm)
Peak
Load
(KN)
Strain
(mm)
Area
(KN-
mm)
28A 6.5
25.4
1.40 0.98 0.83
28B 6.5 1.37 0.77 0.62
29A 6.7 1.23 0.92 0.66
29B 6.7 1.42 0.95 0.81
Average
1.35 0.91 0.73
Stdev 0.09 0.10 0.11
CV % 6.4 10.7 14.5
30A 7.0
31.8
0.79 0.83 0.37
30B 7.0 0.97 0.89 0.50
31A 6.8 0.96 0.95 0.52
31B 6.8 1.01 0.88 0.53
Average
0.93 0.88 0.48
Stdev 0.10 0.05 0.07
CV % 10.5 5.6 14.9
32A 7.2
38.1
0.71 0.71 0.32
32B 7.2 0.57 0.64 0.26
33A 7.0 0.62 0.89 0.32
33B 7.0 0.63 0.69 0.26
Average
0.63 0.73 0.29
Stdev 0.06 0.11 0.04
CV % 9.4 15.1 12.4
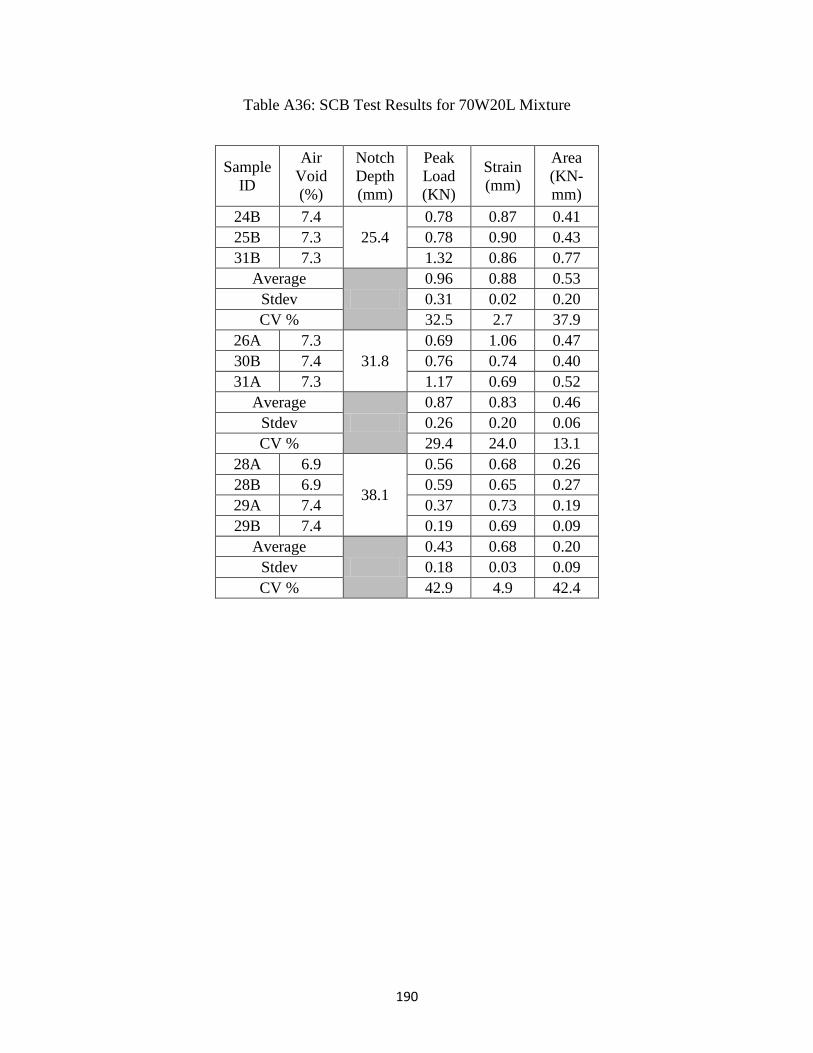
190
Table A36: SCB Test Results for 70W20L Mixture
Sample
ID
Air
Void
(%)
Notch
Depth
(mm)
Peak
Load
(KN)
Strain
(mm)
Area
(KN-
mm)
24B 7.4
25.4
0.78 0.87 0.41
25B 7.3 0.78 0.90 0.43
31B 7.3 1.32 0.86 0.77
Average
0.96 0.88 0.53
Stdev 0.31 0.02 0.20
CV % 32.5 2.7 37.9
26A 7.3
31.8
0.69 1.06 0.47
30B 7.4 0.76 0.74 0.40
31A 7.3 1.17 0.69 0.52
Average
0.87 0.83 0.46
Stdev 0.26 0.20 0.06
CV % 29.4 24.0 13.1
28A 6.9
38.1
0.56 0.68 0.26
28B 6.9 0.59 0.65 0.27
29A 7.4 0.37 0.73 0.19
29B 7.4 0.19 0.69 0.09
Average
0.43 0.68 0.20
Stdev 0.18 0.03 0.09
CV % 42.9 4.9 42.4
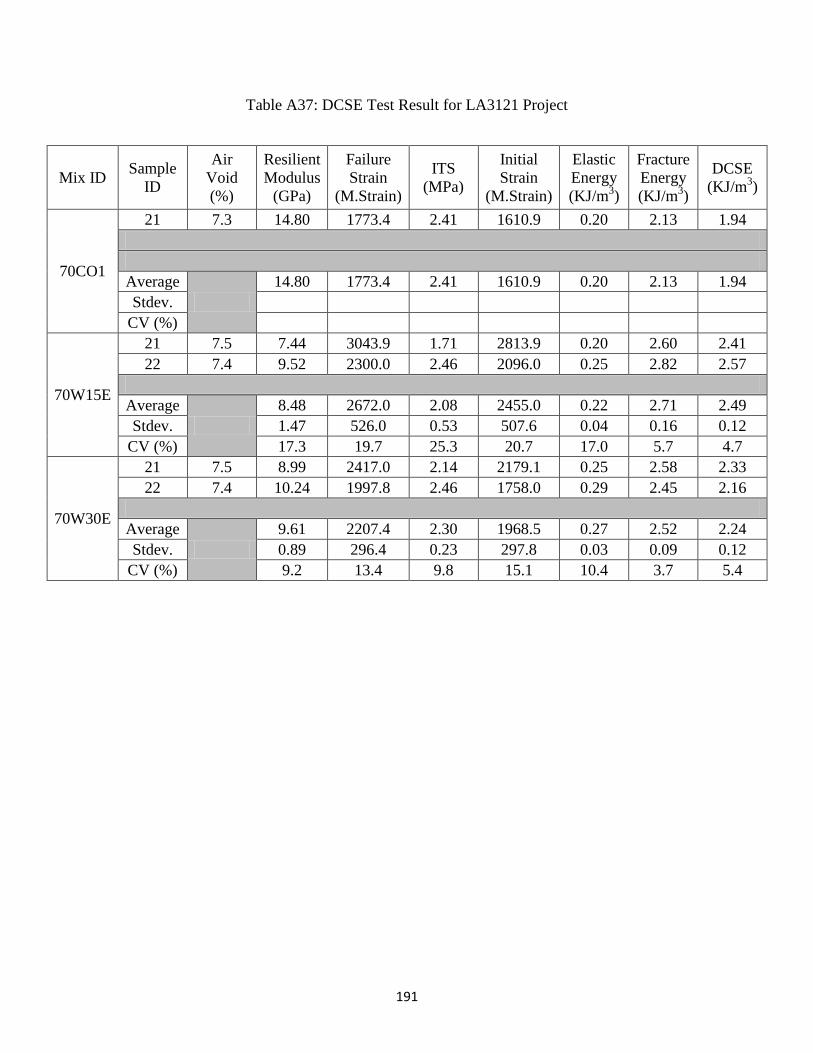
191
Table A37: DCSE Test Result for LA3121 Project
Mix ID Sample
ID
Air
Void
(%)
Resilient
Modulus
(GPa)
Failure
Strain
(M.Strain)
ITS
(MPa)
Initial
Strain
(M.Strain)
Elastic
Energy
(KJ/m3)
Fracture
Energy
(KJ/m3)
DCSE
(KJ/m3)
70CO1
21 7.3 14.80 1773.4 2.41 1610.9 0.20 2.13 1.94
Average
14.80 1773.4 2.41 1610.9 0.20 2.13 1.94
Stdev.
CV (%)
70W15E
21 7.5 7.44 3043.9 1.71 2813.9 0.20 2.60 2.41
22 7.4 9.52 2300.0 2.46 2096.0 0.25 2.82 2.57
Average
8.48 2672.0 2.08 2455.0 0.22 2.71 2.49
Stdev. 1.47 526.0 0.53 507.6 0.04 0.16 0.12
CV (%) 17.3 19.7 25.3 20.7 17.0 5.7 4.7
70W30E
21 7.5 8.99 2417.0 2.14 2179.1 0.25 2.58 2.33
22 7.4 10.24 1997.8 2.46 1758.0 0.29 2.45 2.16
Average
9.61 2207.4 2.30 1968.5 0.27 2.52 2.24
Stdev. 0.89 296.4 0.23 297.8 0.03 0.09 0.12
CV (%) 9.2 13.4 9.8 15.1 10.4 3.7 5.4
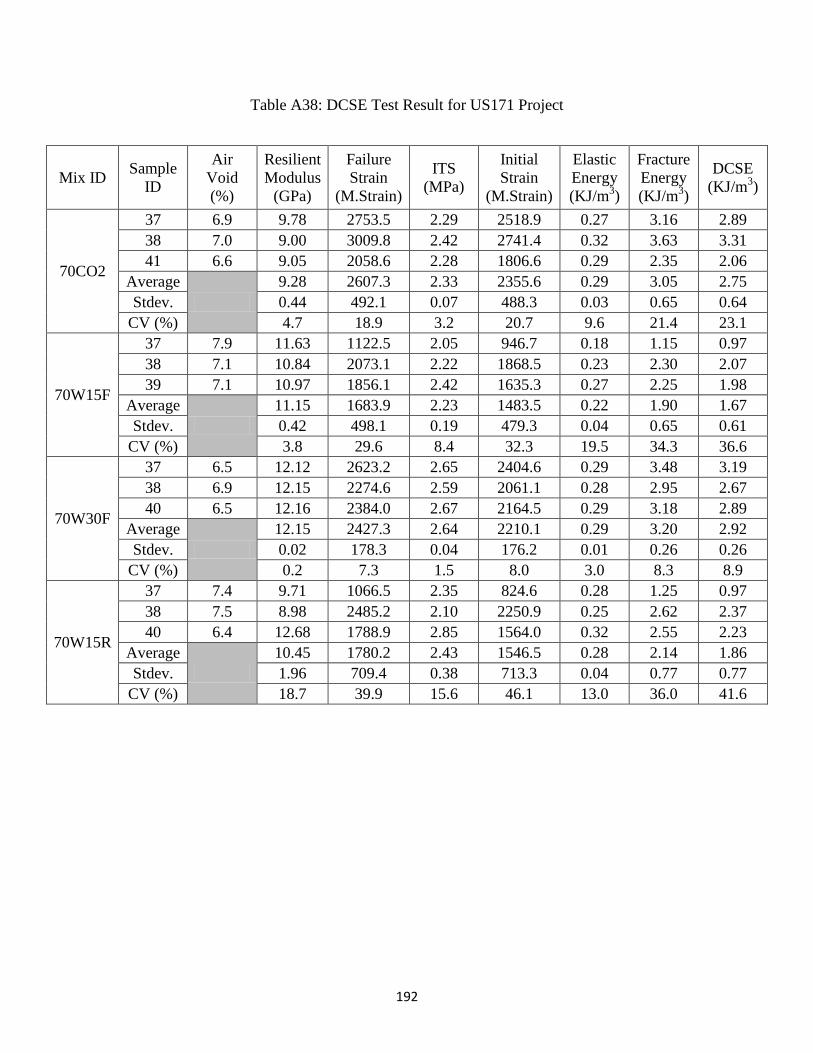
192
Table A38: DCSE Test Result for US171 Project
Mix ID Sample
ID
Air
Void
(%)
Resilient
Modulus
(GPa)
Failure
Strain
(M.Strain)
ITS
(MPa)
Initial
Strain
(M.Strain)
Elastic
Energy
(KJ/m3)
Fracture
Energy
(KJ/m3)
DCSE
(KJ/m3)
70CO2
37 6.9 9.78 2753.5 2.29 2518.9 0.27 3.16 2.89
38 7.0 9.00 3009.8 2.42 2741.4 0.32 3.63 3.31
41 6.6 9.05 2058.6 2.28 1806.6 0.29 2.35 2.06
Average
9.28 2607.3 2.33 2355.6 0.29 3.05 2.75
Stdev. 0.44 492.1 0.07 488.3 0.03 0.65 0.64
CV (%) 4.7 18.9 3.2 20.7 9.6 21.4 23.1
70W15F
37 7.9 11.63 1122.5 2.05 946.7 0.18 1.15 0.97
38 7.1 10.84 2073.1 2.22 1868.5 0.23 2.30 2.07
39 7.1 10.97 1856.1 2.42 1635.3 0.27 2.25 1.98
Average
11.15 1683.9 2.23 1483.5 0.22 1.90 1.67
Stdev. 0.42 498.1 0.19 479.3 0.04 0.65 0.61
CV (%) 3.8 29.6 8.4 32.3 19.5 34.3 36.6
70W30F
37 6.5 12.12 2623.2 2.65 2404.6 0.29 3.48 3.19
38 6.9 12.15 2274.6 2.59 2061.1 0.28 2.95 2.67
40 6.5 12.16 2384.0 2.67 2164.5 0.29 3.18 2.89
Average
12.15 2427.3 2.64 2210.1 0.29 3.20 2.92
Stdev. 0.02 178.3 0.04 176.2 0.01 0.26 0.26
CV (%) 0.2 7.3 1.5 8.0 3.0 8.3 8.9
70W15R
37 7.4 9.71 1066.5 2.35 824.6 0.28 1.25 0.97
38 7.5 8.98 2485.2 2.10 2250.9 0.25 2.62 2.37
40 6.4 12.68 1788.9 2.85 1564.0 0.32 2.55 2.23
Average
10.45 1780.2 2.43 1546.5 0.28 2.14 1.86
Stdev. 1.96 709.4 0.38 713.3 0.04 0.77 0.77
CV (%) 18.7 39.9 15.6 46.1 13.0 36.0 41.6
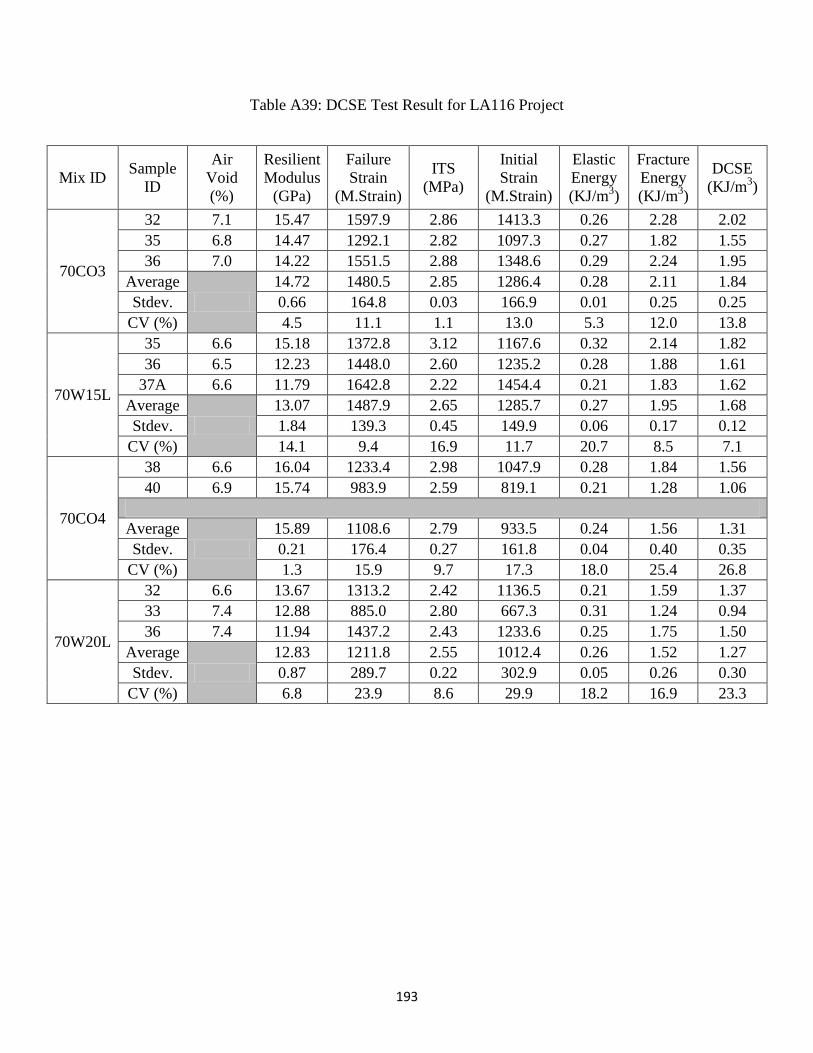
193
Table A39: DCSE Test Result for LA116 Project
Mix ID Sample
ID
Air
Void
(%)
Resilient
Modulus
(GPa)
Failure
Strain
(M.Strain)
ITS
(MPa)
Initial
Strain
(M.Strain)
Elastic
Energy
(KJ/m3)
Fracture
Energy
(KJ/m3)
DCSE
(KJ/m3)
70CO3
32 7.1 15.47 1597.9 2.86 1413.3 0.26 2.28 2.02
35 6.8 14.47 1292.1 2.82 1097.3 0.27 1.82 1.55
36 7.0 14.22 1551.5 2.88 1348.6 0.29 2.24 1.95
Average
14.72 1480.5 2.85 1286.4 0.28 2.11 1.84
Stdev. 0.66 164.8 0.03 166.9 0.01 0.25 0.25
CV (%) 4.5 11.1 1.1 13.0 5.3 12.0 13.8
70W15L
35 6.6 15.18 1372.8 3.12 1167.6 0.32 2.14 1.82
36 6.5 12.23 1448.0 2.60 1235.2 0.28 1.88 1.61
37A 6.6 11.79 1642.8 2.22 1454.4 0.21 1.83 1.62
Average
13.07 1487.9 2.65 1285.7 0.27 1.95 1.68
Stdev. 1.84 139.3 0.45 149.9 0.06 0.17 0.12
CV (%) 14.1 9.4 16.9 11.7 20.7 8.5 7.1
70CO4
38 6.6 16.04 1233.4 2.98 1047.9 0.28 1.84 1.56
40 6.9 15.74 983.9 2.59 819.1 0.21 1.28 1.06
Average
15.89 1108.6 2.79 933.5 0.24 1.56 1.31
Stdev. 0.21 176.4 0.27 161.8 0.04 0.40 0.35
CV (%) 1.3 15.9 9.7 17.3 18.0 25.4 26.8
70W20L
32 6.6 13.67 1313.2 2.42 1136.5 0.21 1.59 1.37
33 7.4 12.88 885.0 2.80 667.3 0.31 1.24 0.94
36 7.4 11.94 1437.2 2.43 1233.6 0.25 1.75 1.50
Average
12.83 1211.8 2.55 1012.4 0.26 1.52 1.27
Stdev. 0.87 289.7 0.22 302.9 0.05 0.26 0.30
CV (%) 6.8 23.9 8.6 29.9 18.2 16.9 23.3
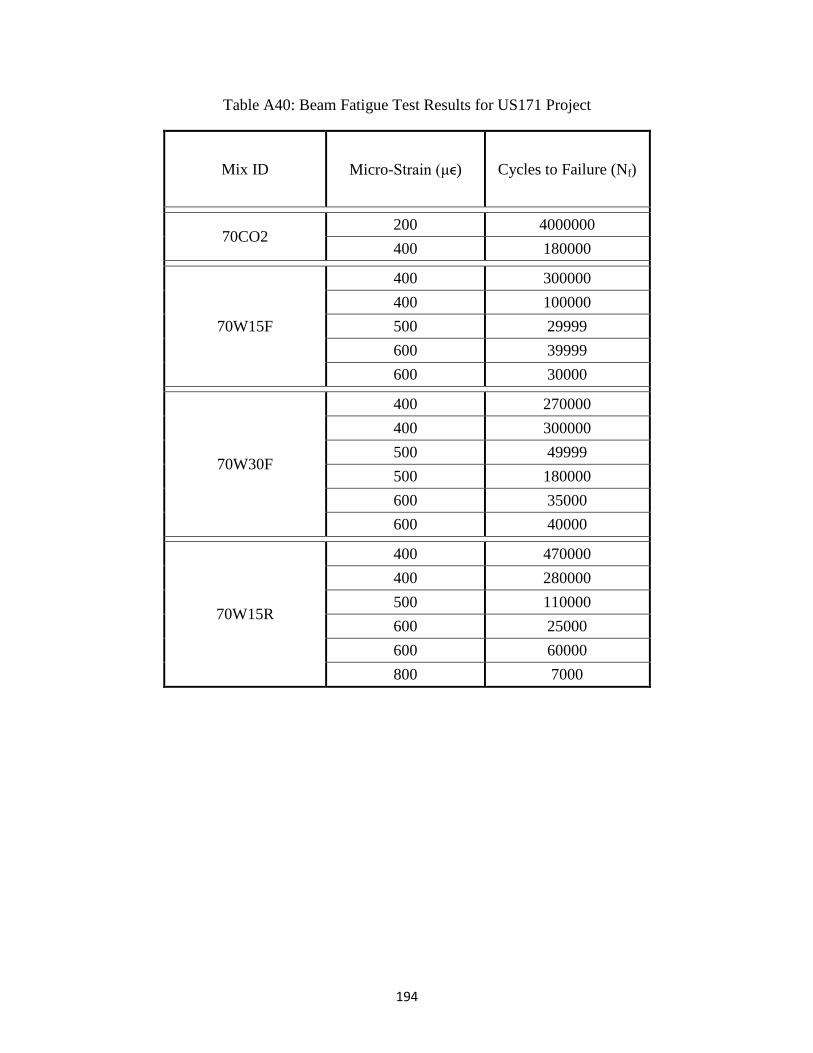
194
Table A40: Beam Fatigue Test Results for US171 Project
Mix ID Micro-Strain (μϵ) Cycles to Failure (Nf)
70CO2 200 4000000
400 180000
70W15F
400 300000
400 100000
500 29999
600 39999
600 30000
70W30F
400 270000
400 300000
500 49999
500 180000
600 35000
600 40000
70W15R
400 470000
400 280000
500 110000
600 25000
600 60000
800 7000
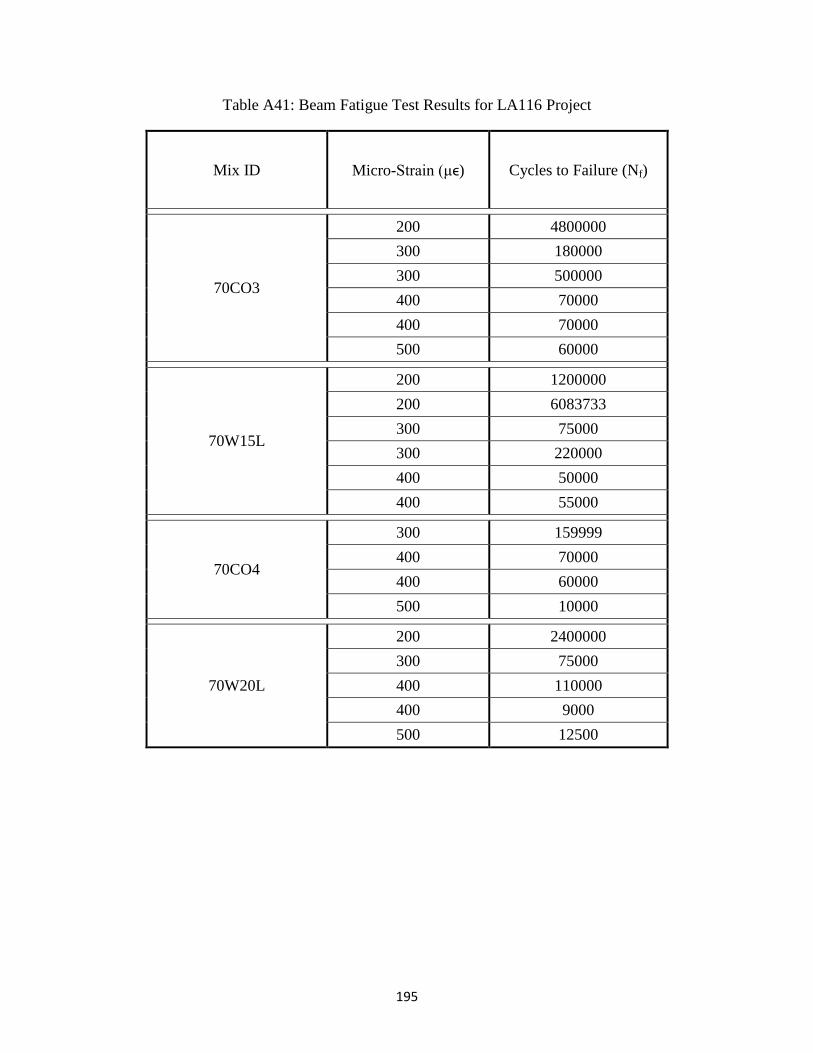
195
Table A41: Beam Fatigue Test Results for LA116 Project
Mix ID Micro-Strain (μϵ) Cycles to Failure (Nf)
70CO3
200 4800000
300 180000
300 500000
400 70000
400 70000
500 60000
70W15L
200 1200000
200 6083733
300 75000
300 220000
400 50000
400 55000
70CO4
300 159999
400 70000
400 60000
500 10000
70W20L
200 2400000
300 75000
400 110000
400 9000
500 12500
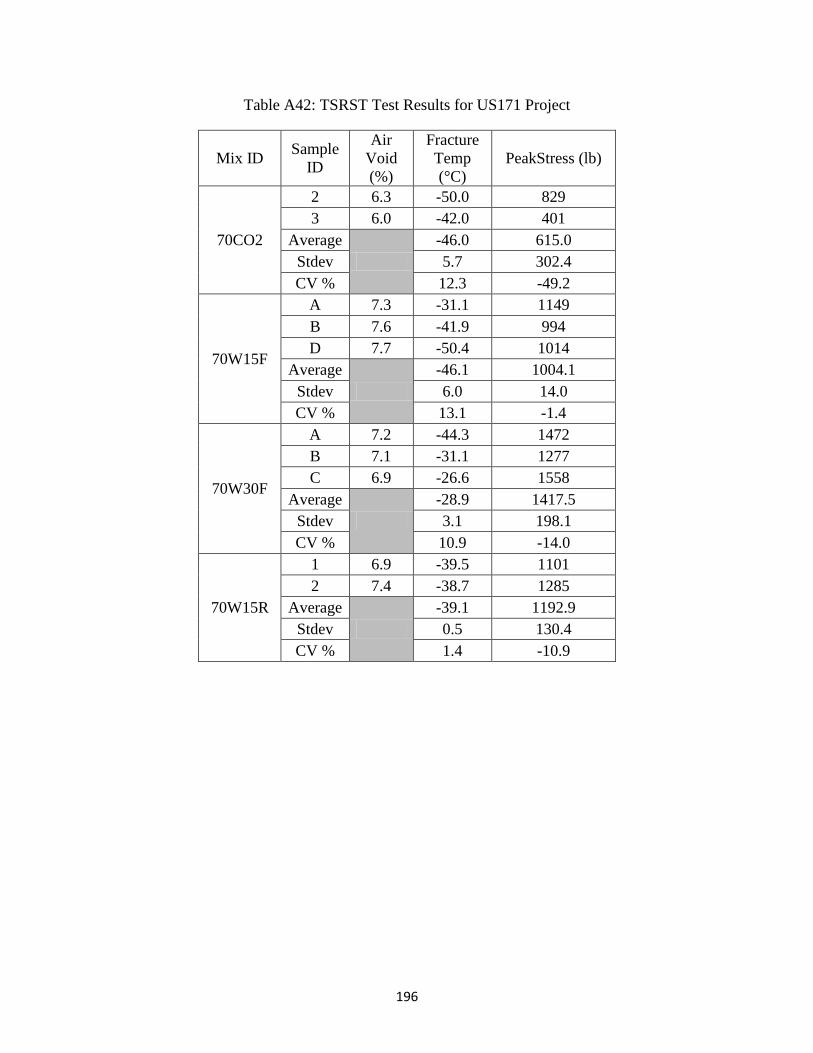
196
Table A42: TSRST Test Results for US171 Project
Mix ID Sample
ID
Air
Void
(%)
Fracture
Temp
(°C)
PeakStress (lb)
70CO2
2 6.3 -50.0 829
3 6.0 -42.0 401
Average
-46.0 615.0
Stdev 5.7 302.4
CV % 12.3 -49.2
70W15F
A 7.3 -31.1 1149
B 7.6 -41.9 994
D 7.7 -50.4 1014
Average
-46.1 1004.1
Stdev 6.0 14.0
CV % 13.1 -1.4
70W30F
A 7.2 -44.3 1472
B 7.1 -31.1 1277
C 6.9 -26.6 1558
Average
-28.9 1417.5
Stdev 3.1 198.1
CV % 10.9 -14.0
70W15R
1 6.9 -39.5 1101
2 7.4 -38.7 1285
Average
-39.1 1192.9
Stdev 0.5 130.4
CV % 1.4 -10.9
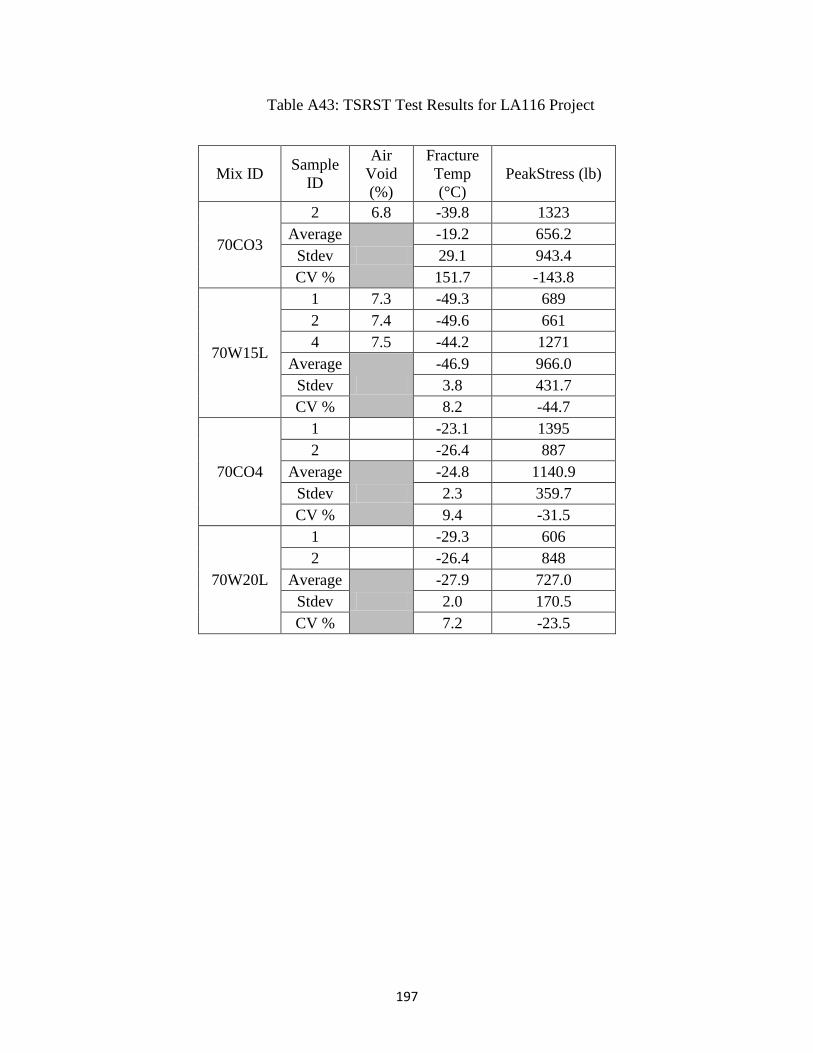
197
Table A43: TSRST Test Results for LA116 Project
Mix ID Sample
ID
Air
Void
(%)
Fracture
Temp
(°C)
PeakStress (lb)
70CO3
2 6.8 -39.8 1323
Average
-19.2 656.2
Stdev 29.1 943.4
CV % 151.7 -143.8
70W15L
1 7.3 -49.3 689
2 7.4 -49.6 661
4 7.5 -44.2 1271
Average
-46.9 966.0
Stdev 3.8 431.7
CV % 8.2 -44.7
70CO4
1 -23.1 1395
2 -26.4 887
Average
-24.8 1140.9
Stdev 2.3 359.7
CV % 9.4 -31.5
70W20L
1 -29.3 606
2 -26.4 848
Average
-27.9 727.0
Stdev 2.0 170.5
CV % 7.2 -23.5
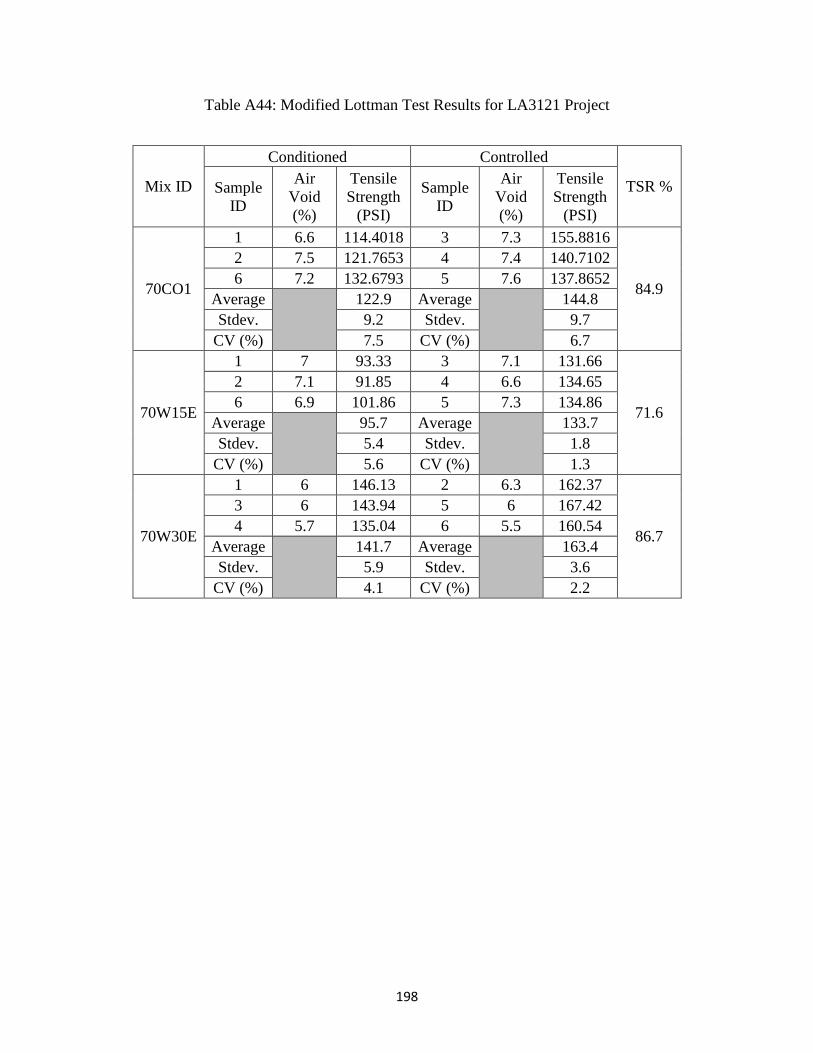
198
Table A44: Modified Lottman Test Results for LA3121 Project
Mix ID
Conditioned Controlled
TSR % Sample
ID
Air
Void
(%)
Tensile
Strength
(PSI)
Sample
ID
Air
Void
(%)
Tensile
Strength
(PSI)
70CO1
1 6.6 114.4018 3 7.3 155.8816
84.9
2 7.5 121.7653 4 7.4 140.7102
6 7.2 132.6793 5 7.6 137.8652
Average
122.9 Average
144.8
Stdev. 9.2 Stdev. 9.7
CV (%) 7.5 CV (%) 6.7
70W15E
1 7 93.33 3 7.1 131.66
71.6
2 7.1 91.85 4 6.6 134.65
6 6.9 101.86 5 7.3 134.86
Average
95.7 Average
133.7
Stdev. 5.4 Stdev. 1.8
CV (%) 5.6 CV (%) 1.3
70W30E
1 6 146.13 2 6.3 162.37
86.7
3 6 143.94 5 6 167.42
4 5.7 135.04 6 5.5 160.54
Average
141.7 Average
163.4
Stdev. 5.9 Stdev. 3.6
CV (%) 4.1 CV (%) 2.2

199
Table A45: Modified Lottman Test Results for US171 Project
Mix ID
Conditioned Controlled
TSR % Sample
ID
Air
Void
(%)
Tensile
Strength
(PSI)
Sample
ID
Air
Void
(%)
Tensile
Strength
(PSI)
70CO2
2 6.3 118.47 3 6.2 148.31
77.0
5 6.9 111.68 6 7 160.98
7 6.5 122.22 8 6.5 148.54
Average
117.5 Average
152.6
Stdev. 5.3 Stdev. 7.2
CV (%) 4.5 CV (%) 4.8
70W15F
4 7.3 96.05 2 7.7 136.93
64.5
7 7.3 87.34 3 7.9 130.9
8 7.3 90.41 5 6.3 156.48
Average
91.3 Average
141.4
Stdev. 4.4 Stdev. 13.4
CV (%) 4.8 CV (%) 9.5
70W30F
5 6.6 127.93 1 6.6 176.85
77.2
6 6.6 131.97 3 6.5 160.32
7 6.6 122.55 4 6.7 158.14
Average
127.5 Average
165.1
Stdev. 4.7 Stdev. 10.2
CV (%) 3.7 CV (%) 6.2
70W15R
1 7.8 83.44 2 7.8 121.93
69.5
3 7.9 84.27 7 7.8 118.98
4 8.1 85.59 8 7.5 123.34
Average
84.4 Average
121.4
Stdev. 1.1 Stdev. 2.2
CV (%) 1.3 CV (%) 1.8
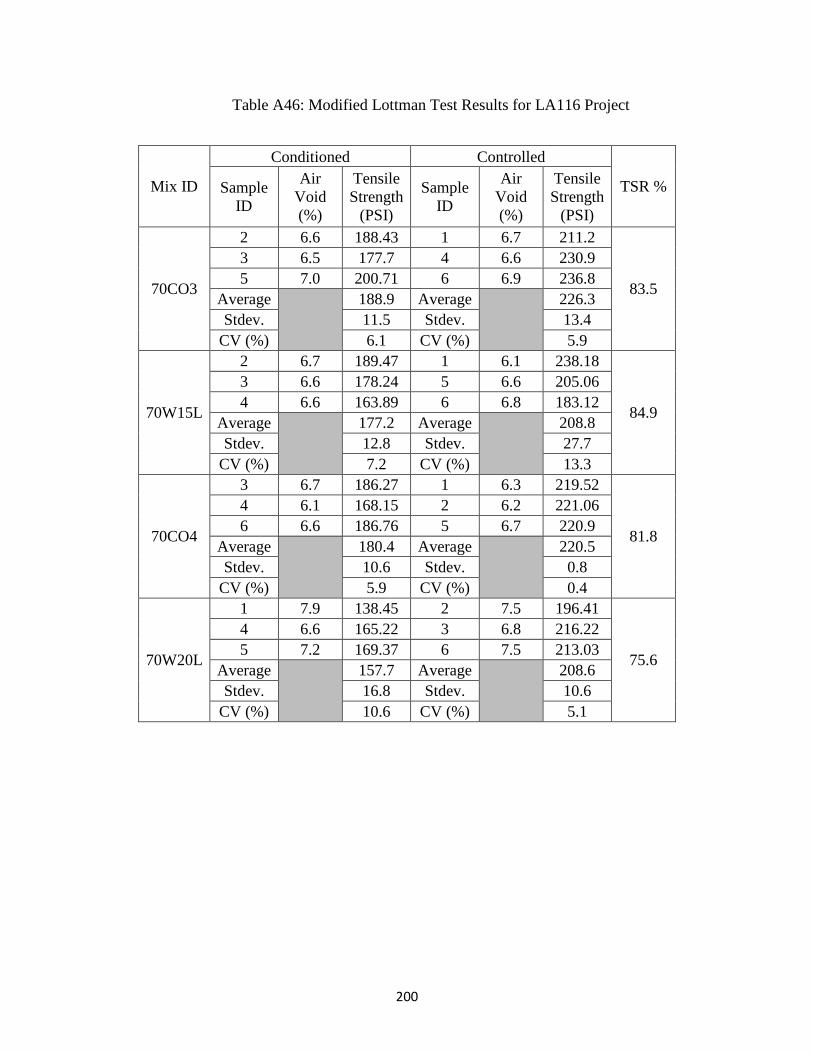
200
Table A46: Modified Lottman Test Results for LA116 Project
Mix ID
Conditioned Controlled
TSR % Sample
ID
Air
Void
(%)
Tensile
Strength
(PSI)
Sample
ID
Air
Void
(%)
Tensile
Strength
(PSI)
70CO3
2 6.6 188.43 1 6.7 211.2
83.5
3 6.5 177.7 4 6.6 230.9
5 7.0 200.71 6 6.9 236.8
Average
188.9 Average
226.3
Stdev. 11.5 Stdev. 13.4
CV (%) 6.1 CV (%) 5.9
70W15L
2 6.7 189.47 1 6.1 238.18
84.9
3 6.6 178.24 5 6.6 205.06
4 6.6 163.89 6 6.8 183.12
Average
177.2 Average
208.8
Stdev. 12.8 Stdev. 27.7
CV (%) 7.2 CV (%) 13.3
70CO4
3 6.7 186.27 1 6.3 219.52
81.8
4 6.1 168.15 2 6.2 221.06
6 6.6 186.76 5 6.7 220.9
Average
180.4 Average
220.5
Stdev. 10.6 Stdev. 0.8
CV (%) 5.9 CV (%) 0.4
70W20L
1 7.9 138.45 2 7.5 196.41
75.6
4 6.6 165.22 3 6.8 216.22
5 7.2 169.37 6 7.5 213.03
Average
157.7 Average
208.6
Stdev. 16.8 Stdev. 10.6
CV (%) 10.6 CV (%) 5.1
201
VITA
Bhanu Vijay Vallabhu was born in December, 1986, in the city of Hyderabad,
India. He completed his Bachelor of Engineering degree in Civil Engineering (BE, CE)
from Osmania University, Hyderabad, India in April 2008. He joined Louisiana State
University, Baton Rouge, United States of America, to pursue his master’s degree in civil
engineering in the spring of 2009. He expects to receive the degree of Master of Science
in Civil Engineering (MSCE) in December 2012.