full textefficiency in midwest us corn ethanol plants: a plant survey
TRANSCRIPT

University of Nebraska - LincolnDigitalCommons@University of Nebraska - Lincoln
Faculty Publications: Agricultural Economics Agricultural Economics Department
1-9-2009
Efficiency in Midwest US Corn Ethanol Plants: APlant SurveyRichard K. PerrinUniversity of Nebraska, [email protected]
Nickolas F. FretesHarvard University, [email protected]
Juan P. SesmeroUniversity of Nebraska at Lincoln, [email protected]
Follow this and additional works at: http://digitalcommons.unl.edu/ageconfacpubPart of the Agricultural and Resource Economics Commons
This Article is brought to you for free and open access by the Agricultural Economics Department at DigitalCommons@University of Nebraska -Lincoln. It has been accepted for inclusion in Faculty Publications: Agricultural Economics by an authorized administrator ofDigitalCommons@University of Nebraska - Lincoln.
Perrin, Richard K.; Fretes, Nickolas F.; and Sesmero, Juan P., "Efficiency in Midwest US Corn Ethanol Plants: A Plant Survey" (2009).Faculty Publications: Agricultural Economics. Paper 86.http://digitalcommons.unl.edu/ageconfacpub/86

1. Introduction
The role of corn ethanol as a sustainable alternative fuel to gas-oline has recently been the subject of much debate. While the scientific community has been debating the net-energy value of ethanol conversion, policymakers have become concerned about the role of the ethanol industry on rising international food prices. As a result, US policy support of corn ethanol is at issue. It is important that policy debates be informed by accu-rate information about the technical efficiency and economic viability of the industry.
This study reports the results of a recent survey of corn eth-anol plants in seven states in the North Central of the US, ex-amining performance during 2006 and 2007. We first charac-terize the plants surveyed, and then present results on their technical and price efficiencies. We calculate industry shut-down price relationships for corn and oil prices. Next, we esti-mate the cost of drying distillers grains. Finally, we construct a cost function so as to allow updating the results for changed prices, and we then use it to evaluate the industry’s economic viability in mid-2008.
2. The surveyed plants
Table 1 presents the characteristics of the plants surveyed for this report. Seven dry-grind ethanol plants were surveyed from north-central Midwest states. The selection criteria for plants to be contacted were as follows. The plant must have started production (or been updated) after mid-2005 with a ca-pacity of about 50,000 million gallons per year or more, so as
to represent recent technology. Plants must have a minimum of three quarters of operating data, starting at least one month after the plant opened. Finally, the plants should be located in or near small towns of approximately 10,000 or less, to facil-itate companion studies of the impact of the plants on rural communities within the twelve-state North Central region of the US The eighteen plants that met these criteria were con-tacted, but only seven were persuaded to participate in this research project, because participation entailed a non-trivial effort on their part, and some firms were unwilling to share confidential data.
The seven plants produced an average rate of 53.1 million gallons of denatured ethanol per year, with a range from 42.5 million gallons per year to 88.1 million gallons per year. (All references in this report refer to denatured ethanol. Denatured ethanol must contain between 1.96% and 4.76% denaturant, which is usually gasoline. The amounts of denaturant for the sample firms were not obtained.) The period surveyed began in the third quarter of 2006 and lasted until the fourth quar-ter of 2007 (six consecutive quarters), though not all plants re-ported results for all quarters. For plants that started up dur-ing this period, we include data only for quarters at least one month subsequent to startup. The surveyed plants employed an average of 39.6 employees.
Plants varied in their handling of distillers grains and solu-bles (DGS). Some plants in the sample produced modified wet distillers grains and solubles (MWDGS), produced by drying wet distillers grains (WDGS, essentially centrifuge cake, with about 70% moisture) and then adding solubles to bring the moisture content to about 50–55%. Most plants also produced
Published in Energy Policy 37:4 (April 2009), pp. 1309–1316; doi: 10.1016/j.enpol.2008.11.022 Copyright © 2008 Elsevier Ltd. Used by permission.
Submitted August 20, 2008; accepted November 11, 2008; published online January 9, 2009.
Efficiency in Midwest US Corn Ethanol Plants: A Plant Survey
Richard K. Perrin, Nickolas F. Fretes, and Juan Pablo Sesmero
Department of Agricultural Economics, University of Nebraska–Lincoln, Lincoln, NE 68583, USACorresponding author — R. K. Perrin, tel 402 472-9818, fax 402 472-3460, email [email protected]
AbstractContinuation of policy support for the US corn ethanol industry is being debated due to doubts about the green-house gas effects of the industry and the effects of the industry on food prices. Yet there is no publicly available data on the economic and technical performance of the current generation of plants, which constitute the overwhelming majority of the industry. This study helps to fill that gap. Seven recently constructed ethanol plants in seven Mid-west US states provided details on input requirements and operating costs during 2006 and 2007. Results show that technical performance is substantially better than current estimates available in the literature. Average net operat-ing returns exceeded capital costs during the survey period, but price changes by mid-2008 reduced these margins to near zero. While the economic performance of the industry is currently viable, this study demonstrates that it can be threatened by current price trends, and certainly would be in the absence of current subsidies.
Keywords: Corn ethanol efficiency
1309

1310 Per r i n, Fr ete s, & ses me r o i n En E r g y Pol i c y 37 (2009)
dry distillers grains and solubles (DDGS) by further drying to about 10%moisture. While it is costly to do this additional dry-ing, the product is more storable and transportable, and thus more valuable. On average among survey plants, 54% of by-product was sold as DDGS, but this ranged from one plant that sold absolutely no byproduct as DDGS to another plant that sold nearly all byproduct (97%) as DDGS.
Finally, Table 1 briefly reports plant marketing techniques. In purchasing feedstock, nearly all plants (5) purchased most corn via direct customer contracts. In selling ethanol, nearly all plants (5 of 7) employed third parties or agents. Byproduct marketing techniques varied more across plants. Marketing of DDGS was split fairly evenly between spot markets and third parties/agents. Even more variability was observed in market-ing methods for MWDGS, where no one marketing strategy (spot market, customer contract, or third party/agent) pre-vailed. Most if not all plants participated in futures and op-tion markets for either products or inputs or both, but we did not inquire into the details of these transactions because of the difficulty of quantifying the kinds and extent of these activi-ties. Quarterly output and input prices reported in this study are net prices realized from the combination of commodity transactions and futures transactions, as reported by the plant managers.
3. Technical efficiency
Because input prices can fluctuate substantially, any given estimate of production cost can become quickly out of date.
What will persist are technical efficiencies—output–input ra-tios. Here, we present technical efficiency coefficients for this sample of plants, and contrast them with other estimates cur-rently in use in the literature on ethanol plant performance.
3.1. Technical efficiencies across surveyed plants
Table 2 presents the technical efficiencies in terms of input re-quirements per gallon of denatured ethanol, and outputs of denatured ethanol and DGS byproduct (all distillers grains and solubles, measured in pounds of dry matter) per bushel of corn. We report the average input efficiency coefficients across all seven plants along with the average of the two plants with lowest processing costs and the two with the highest process-ing costs. We report output efficiency in terms of gallons of ethanol and pounds of byproduct dry matter per bushel of corn, with low- and high-performing plants determined ac-cording to revenue per bushel of corn feedstock.
Electricity requirement was dispersed around an average of 0.570kWh per gallon of ethanol; the low-cost plants required about 2% less, whereas the high-cost plants required 2% more. Average natural gas requirement was 0.026 MMBTU/gal of ethanol, with low- and high-cost plants each varying about 8% from that level.
Output per unit of feedstock, on the other hand, varied less than 1% between the best, worst and average plant. This was true whether we considered output of denatured ethanol (av-eraging 2.87 gal/bu) or of dry matter in DGS (averaging 14.75 lbs/bu.) The coefficient of variation across plants (standard
Table 1. Characteristics of the seven surveyed plants.
States represented Iowa, Michigan, Minnesota, Missouri, Nebraska, S. Dakota, Wisconsin
Annual production rate (m. gal/yr) Smallest 42.5 Average 53.1 Largest 88.1
Number of plants by start-up year 2005 5 2006 2a
Number of employees Smallest 36 Average 39.6 Largest 46.4
Number of survey responses by quarter 03_2006 5 04_2006 6 01_2007 7 02_2007 7 03_2007 7 04_2007 2
Percent of byproduct sold as dry DGS Smallest 0 Average 54 Largest 97
Primary market technique reported Corn Ethanol DDGS MWDGS Spot market 0 0 3 1 Customer contract 5 1 0 1 Third party/agent 0 5 2 2
a. One of these plants was originally constructed prior to 2004, but was updated and expanded in 2006.
eF F i c i en c y i n mi d w e s t Us c o r n e th an o l P l an ts 1311
deviation divided by mean) for both coefficients was small: 0.036 for output of DGS and 0.024 for output of ethanol. Dif-ferences across firms in total revenue per bushel, which is our output ranking criterion, were apparently more a matter of differences in prices than in technical coefficients.
3.2. Technical efficiencies of surveyed plants versus previous estimates
The plants in our sample are substantially more technically ef-ficient than other recent sources attribute to the industry. Ta-ble 3 summarizes these comparisons.
The studies by McAloon et al. (2000), and Kwiatkowski et al. (2006) are original process engineering economic studies. They reveal a considerable improvement in plant efficiency between 2000 and 2006, at least as that is understood from the engineering economic perspective. Compared to the av-erage of our sample plants, Kwiatkowski et al. underestimate electricity requirements by 7%, but overestimate natural gas requirements by 31%. The Shapouri and Gallagher (2005) re-port was based on a USDA-sponsored survey of plants for the year 2002. Those plants used twice as much electricity and a third more natural gas compared to current plants, while at the same time extracted 6% less ethanol (but leaving 8% more DGS.)
Natural gas usage, which represents nearly half of sam-ple plants’ processing costs, depends on the extent to which DGS is dried. Several of the studies summarized in Table 3 as-sumed that all distillers grains were sold as DDGS (McAloon et al., Pimental and Patzek, Kwiatkowski, Eidman and Pleven
and Mueller), thus increasing estimated natural gas usage rel-ative to the plants in this sample, which sold only 54% of by-product as DDGS. Wang et al., estimate .0333 MMBTU/gal for DDGS plants, .0218 for WDGS plants, which, when weighted by the share dried in our sample, yields results essentially the same as realized in our sample plants.
The studies by Wang et al. (2007), and Plevin and Muel-ler (2008), are based on spreadsheet models of the industry (GREET and BEACCON, respectively), for which sources of efficiency estimates are not readily available. The studies by Pimentel and Patzek (2005), and by Eidman (2007), also do not clearly indicate the source of estimates.
The most recent of all these studies seem to exhibit a con-sensus that requirements for both electricity and natural gas are considerably higher than our sample plants used, and that the yield of ethanol is slightly lower, leaving DGS yields slightly higher.
4. Cost efficiency and shutdown prices
A central objective of the project supporting this research was to evaluate the financial viability of the corn ethanol industry. In this section, we construct ethanol production budgets and describe financial performance across plants and through the six-quarter sampling period. From this information we iden-tify combinations of corn and ethanol prices that result in op-erating losses, and would thus cause plants to shut down. Some expenditure categories were reported in dollar amounts, thus we could not identify quantities used and we could not report technical efficiencies for those categories.
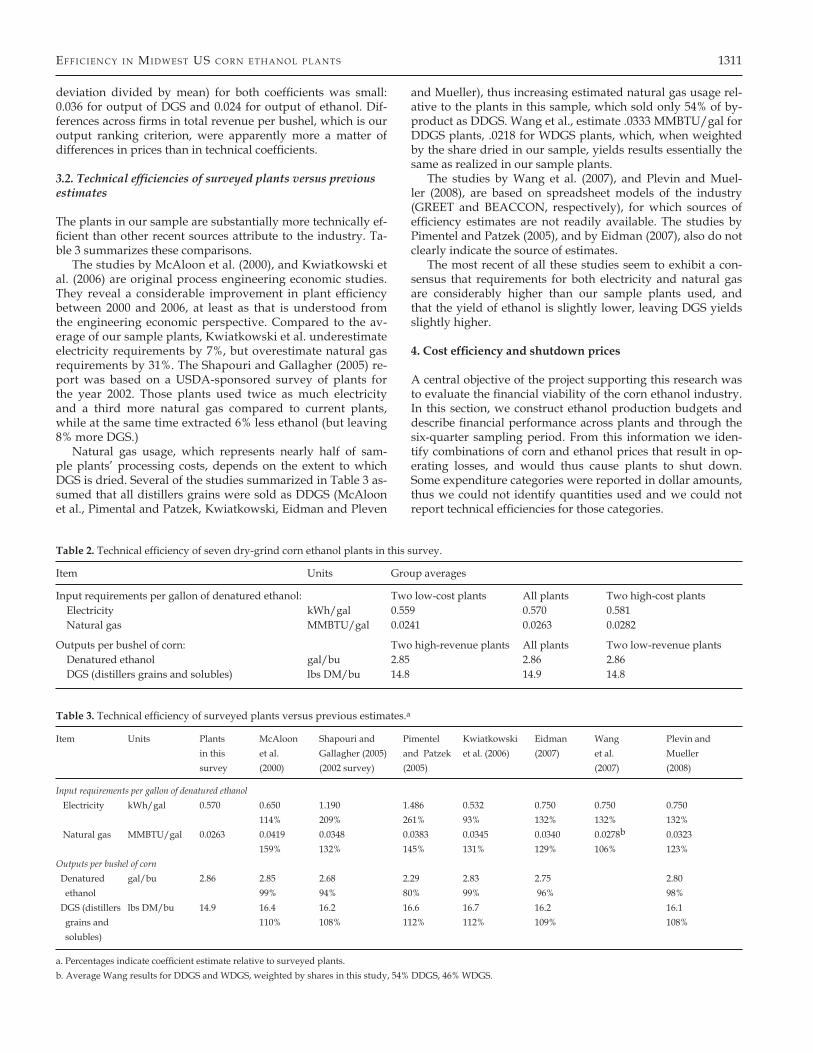
Table 2. Technical efficiency of seven dry-grind corn ethanol plants in this survey.
Item Units Group averages
Input requirements per gallon of denatured ethanol: Two low-cost plants All plants Two high-cost plants Electricity kWh/gal 0.559 0.570 0.581 Natural gas MMBTU/gal 0.0241 0.0263 0.0282
Outputs per bushel of corn: Two high-revenue plants All plants Two low-revenue plants Denatured ethanol gal/bu 2.85 2.86 2.86 DGS (distillers grains and solubles) lbs DM/bu 14.8 14.9 14.8
Table 3. Technical efficiency of surveyed plants versus previous estimates.a
Item Units Plants McAloon Shapouri and Pimentel Kwiatkowski Eidman Wang Plevin and in this et al. Gallagher (2005) and Patzek et al. (2006) (2007) et al. Mueller survey (2000) (2002 survey) (2005) (2007) (2008)
Input requirements per gallon of denatured ethanol Electricity kWh/gal 0.570 0.650 1.190 1.486 0.532 0.750 0.750 0.750 114% 209% 261% 93% 132% 132% 132% Natural gas MMBTU/gal 0.0263 0.0419 0.0348 0.0383 0.0345 0.0340 0.0278b 0.0323 159% 132% 145% 131% 129% 106% 123%Outputs per bushel of corn Denatured gal/bu 2.86 2.85 2.68 2.29 2.83 2.75 2.80 ethanol 99% 94% 80% 99% 96% 98% DGS (distillers lbs DM/bu 14.9 16.4 16.2 16.6 16.7 16.2 16.1 grains and 110% 108% 112% 112% 109% 108% solubles)
a. Percentages indicate coefficient estimate relative to surveyed plants.b. Average Wang results for DDGS and WDGS, weighted by shares in this study, 54% DDGS, 46% WDGS.

1312 Per r i n, Fr ete s, & ses me r o i n En E r g y Pol i c y 37 (2009)
4.1. Average reported operating costs and revenues
In Table 4, we present average operating costs at the surveyed plants. Operating cost was broken down into two categories: processing cost and net feedstock cost (cost of corn feedstock minus revenues from DGS.) Processing costs consist of all op-erating expenditures other than feedstock cost. Capital costs were not reported in the survey, are not included in the bud-get. To provide an idea of dispersion of prices and costs within the industry, we also present average budget information for the two plants with the highest processing costs and the two with the lowest processing costs.
In the previous section, we noted that there was little dis-persion of technical coefficients across firms. Yet here we note that processing costs vary by at least $0.16/gal, from $0.37/gal for the two low-cost firms to $0.53/gal for the high-cost firms, a range equal to 36% of the average cost. Electricity cost per gallon varies by 24% of the average and natural gas by 22% of average. A cost range of $0.06/gal arose from either the technical coefficients or prices paid for chemicals, yeasts, etc., which together comprise half of the processing cost.
Two other processing cost items that varied the most be-tween high-cost and low-cost plants are labor/management costs and miscellaneous costs. In follow-up discussions with respondents, we learned that much of the labor/management variability was due to payments of bonuses, which were re-ported jointly with normal salary and wage payments. Given that net revenues were quite high during the first two quarters of this survey, bonuses were probably quite high, rendering these estimates of labor/ management commensurately high. Miscellaneous costs reported by at least one plant include con-tract payments for consulting, whereas others do not, and may not have had such expenditures. In addition, it is quite pos-sible that the survey period miscellaneous costs included two semi-annual payments for services at some plants, but only one such payment at other plants. However, we have no way to determine exactly why miscellaneous expenses varied so much across plants.
Net feedstock costs, on the other hand, showed a spread of only $0.05/gal, or about 6%, determined mostly by differences in corn price that varied by about 8%, and differences in by-product price that varied by about 20% of average prices. Dif-ferences in prices (corn, ethanol and byproduct) reflect spa-tial differences in spot prices, some temporal differences due to periods reported, and some managerial differences due to marketing skills and futures market transactions. In a follow-
up study, we will attempt to learn what we can about the im-portance of these factors in explaining price differences. Fi-nally, net operating costs varied $0.11/gal between low-cost and high-cost firms, about 8% of the average cost of $1.29/gal.
Average prices received for ethanol of $1.95/gal were aug-mented slightly by an average of $0.03/gal in production sub-sidies, leaving average net operating returns of $0.90, $0.69 and $0.62/gal for the three groups of firms. Operating subsidies consisted of the Federal Small Ethanol Producer Tax Credit (plants producing 60 million gallons per year or less are eligible for $0.10/gal on the first 15 million gallons of production) and state production subsidies for which two of the plants quali-fied. The major federal subsidy during this period was the Vol-umetric Ethanol Excise Tax Credit (VEETC) of $0.51/gal, but as this was paid to blenders of ethanol and gasoline rather than to the plants, it affects the plants through higher prices for ethanol than they would otherwise have received.
Clearly the average net operating returns of $0.69/gal dur-ing this period were adequate to keep the plants in produc-tion, and provide substantial returns to capital. A view of net returns over the six-quarter operating period, however (Fig-ure 1) reveals that the average operating margin declined from $1.11 in the third quarter of 2006 to $0.43 in the third quarter of 2007. Are these operating costs sufficient to cover capital costs? While our survey did not gather any information about capital costs, construction costs are in the vicinity of $1.80/gal of annual capacity. For a life of 10 years at a 15% rate of in-terest, amortization of that investment amounts to $0.36/gal. Hence, even at the lowest average quarterly operating return of $0.43/gal, the average plant would make sufficient earnings to cover capital cost of this magnitude. (Capital leveraged at higher interest rates than 15%, or over shorter periods than 10 years could create cash-flow problems if debt repayment ex-penses exceeded the $0.36/gal/year amortization.)
4.2. Reported costs of surveyed plants versus previous estimates
As with technical efficiencies, we compared the average costs from our survey to some previously published estimates, namely those of Shapouri and Gallagher (2005), Kwiatkowski et al. (2006), Eidman (2007), and Plevin and Mueller (2008, cit-ing the spreadsheet program, BEACCON). The results of this comparison are shown in Table 5. For both processing and feedstock costs, our survey results lie within the range of pre-vious estimates. For processing cost alone, the previous esti-
Table 4. Average reported operating costs and revenues at seven surveyed ethanol plants.
Item Units Price/unit Input cost per gallon of denatured ethanol
Two low-cost plants All plants Two high-cost plants Two low-cost plants All plants Two high-cost plants
Electricity kWh 0.037 0.044 0.047 0.021 0.025 0.027Natural gas MMBTU 6.42 7.20 6.99 0.155 0.190 0.197Denaturant 0.067 0.070 0.078Enzymes, yeasts, chemicals 0.058 0.063 0.062Labor, mgt (incl. bonuses) 0.033 0.051 0.066Maintenance and repairs 0.021 0.019 0.020Misc—water, taxes, fees, ins, … 0.014 0.037 0.081Total processing costs 0.370 0.454 0.533Feedstock cost (corn) bu 3.23 3.04 2.98 1.136 1.063 1.042Byproduct (distillers grains) lbs dry matter 0.051 0.044 0.042 –0.265 –0.229 –0.224Net feedstock costs 0.871 0.834 0.819Net operating costs 1.240 1.288 1.352Ethanol revenue 2.089 1.951 1.941Operating subsidies 0.047 0.031 0.029Return over operating cost 0.895 0.694 0.617

eF F i c i en c y i n mi d w e s t Us c o r n e th an o l P l an ts 1313
mates ranged from $0.41/gal (Shapouri and Gallagher (2005), for the operating year 2002) to $0.59/gal (Eidman, 2007); our survey reports a processing cost of $0.45/gal. Feedstock cost estimates have been more variable as corn prices have risen in recent years. The previous estimates ranged widely from $0.48/gal (Kwiatkowski et al., 2006) to $1.60/gal (Plevin and Mueller, 2008); our survey reports a net feedstock cost of $0.83/gal.
4.3. Shutdown prices for corn and ethanol at surveyed plants
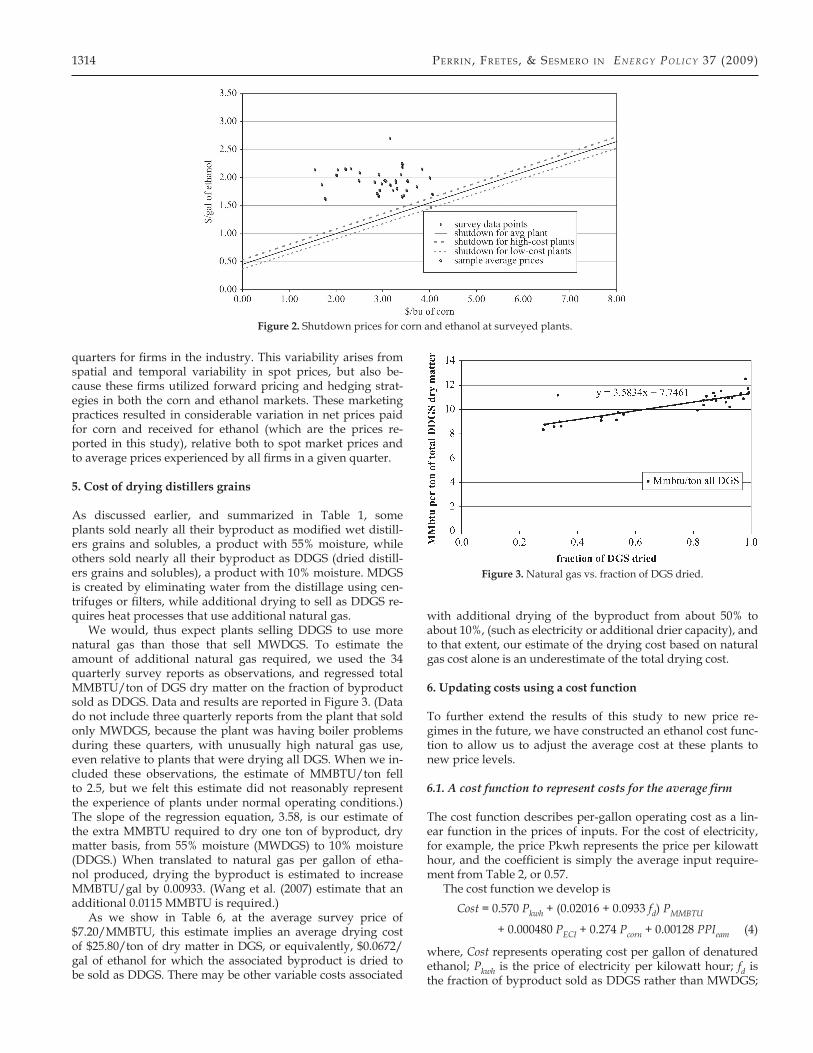
If the price for ethanol falls below a plant’s operating cost, the plant cannot continue operating for very long. The shutdown of a single plant can have grave consequences for the commu-nity in which the plant is located, particularly so because most corn ethanol plants are located in small communities.We are therefore interested in circumstances that might lead to shut-downs, and since ethanol price and corn price are the two most significant prices affecting economic performance, we construct shutdown price lines as shown in Figure 2.
Shutdown of a plant would presumably occur when etha-nol price falls below operating cost per gallon. In the case of the average of plants in our sample, the prices that would trig-ger shutdown are
Pe = 0.454 + 1 Pc – 5.21 PDGS – Subsidy (1) 2.86
where Pe is the price of a gallon of denatured ethanol, 0.454 is the average processing cost, 2.86 is the average yield of dena-tured ethanol per bushel of corn, Pc is the price of corn, 5.21 is the number of dry matter pounds of DGS per gallon (14.9 lb/bu divided by 2.86 gal/bu), PDGS is the price per dry matter pound of DGS, and Subsidy is the average operating subsidy received ($0.03/gal). The price of DGS is closely related to the price of corn (they are substitute feeds), so we approximate it from corn price as
PDGS = ( P̄ DGS ) Pc = 0.0145 Pc (2)
P̄ c
where overbars represent the average prices from our sample. Substituting this into (1) and collecting terms yields the break-even operating relationship between ethanol and corn prices
Pe = 0.424 + 0.2742 Pc (3)
Changes in processing costs shift the intercept, and changes in the relative prices of DGS and corn would alter the slope.
Plotted with these curves in Figure 2 are all the quarterly price combinations reported by the plants in the survey. With the exception of one plant for one quarter, these 34 points are scattered above the breakeven lines, confirming that all plants ran an operating surplus in virtually all quarters during this period. The scatter of points, however, offers some sense of variability in corn and ethanol prices among plants and across
Figure 1. Average quarterly operating costs and revenue at survey plants.
Table 5. Surveyed plant operating costs compared with other estimates.
Item Units Plants in this Shapouri and Gallagher Kwiatkowski et al. Eidman Plevin and Mueller survey (2005) (2002 survey)c (2006)a (2007) (2008)a,b
Price Cost per Price Cost per Price Cost per Price Cost per Price Cost per gallon gallon gallon gallon gallon
Electricity kWh 0.044 0.025 NA 0.037 0.050 0.027 0.080 0.056 0.073 0.055Natural gas MMBTU 7.20 0.190 NA 0.136 6.00 0.207 9.00 0.306 8.16 0.260Denaturant 0.070 0.035 0.026 0.062Enzymes, etc. 0.063 0.064 0.075 0.095 0.205Labor and mgt 0.051 0.009 0.026 0.036 0.025Maint. and rep. 0.019 0.054 0.033 0.013Misc. 0.037 0.078 0.041 0.025 0.016
Total processing 0.454 0.412 0.434 0.592 0.561Feedstock bu 3.04 1.063 2.23 0.803 2.20 0.776 3.00 1.069 6.00 2.143Distillers grains lbs DM 0.044 –0.229 0.038 –0.258 0.041 –0.294 0.058 –0.351 0.094 –0.544
Net feedstock 0.834 0.545 0.482 0.718 1.599Net op. costs 1.288 0.957 0.916 1.310 2.160
a. Steam costs in the study added to natural gas cost here.b. ‘‘Current’’ costs—see BEACCON for details.c. Cost for undenatured alcohol.
1314 Per r i n, Fr ete s, & ses me r o i n En E r g y Pol i c y 37 (2009)
quarters for firms in the industry. This variability arises from spatial and temporal variability in spot prices, but also be-cause these firms utilized forward pricing and hedging strat-egies in both the corn and ethanol markets. These marketing practices resulted in considerable variation in net prices paid for corn and received for ethanol (which are the prices re-ported in this study), relative both to spot market prices and to average prices experienced by all firms in a given quarter.
5. Cost of drying distillers grains
As discussed earlier, and summarized in Table 1, some plants sold nearly all their byproduct as modified wet distill-ers grains and solubles, a product with 55% moisture, while others sold nearly all their byproduct as DDGS (dried distill-ers grains and solubles), a product with 10% moisture. MDGS is created by eliminating water from the distillage using cen-trifuges or filters, while additional drying to sell as DDGS re-quires heat processes that use additional natural gas.
We would, thus expect plants selling DDGS to use more natural gas than those that sell MWDGS. To estimate the amount of additional natural gas required, we used the 34 quarterly survey reports as observations, and regressed total MMBTU/ton of DGS dry matter on the fraction of byproduct sold as DDGS. Data and results are reported in Figure 3. (Data do not include three quarterly reports from the plant that sold only MWDGS, because the plant was having boiler problems during these quarters, with unusually high natural gas use, even relative to plants that were drying all DGS. When we in-cluded these observations, the estimate of MMBTU/ton fell to 2.5, but we felt this estimate did not reasonably represent the experience of plants under normal operating conditions.) The slope of the regression equation, 3.58, is our estimate of the extra MMBTU required to dry one ton of byproduct, dry matter basis, from 55% moisture (MWDGS) to 10% moisture (DDGS.) When translated to natural gas per gallon of etha-nol produced, drying the byproduct is estimated to increase MMBTU/gal by 0.00933. (Wang et al. (2007) estimate that an additional 0.0115 MMBTU is required.)
As we show in Table 6, at the average survey price of $7.20/MMBTU, this estimate implies an average drying cost of $25.80/ton of dry matter in DGS, or equivalently, $0.0672/gal of ethanol for which the associated byproduct is dried to be sold as DDGS. There may be other variable costs associated
with additional drying of the byproduct from about 50% to about 10%, (such as electricity or additional drier capacity), and to that extent, our estimate of the drying cost based on natural gas cost alone is an underestimate of the total drying cost.
6. Updating costs using a cost function
To further extend the results of this study to new price re-gimes in the future, we have constructed an ethanol cost func-tion to allow us to adjust the average cost at these plants to new price levels.
6.1. A cost function to represent costs for the average firm
The cost function describes per-gallon operating cost as a lin-ear function in the prices of inputs. For the cost of electricity, for example, the price Pkwh represents the price per kilowatt hour, and the coefficient is simply the average input require-ment from Table 2, or 0.57.
The cost function we develop is Cost = 0.570 Pkwh + (0.02016 + 0.0933 fd) PMMBTU
+ 0.000480 PECI + 0.274 Pcorn + 0.00128 PPIeam (4)
where, Cost represents operating cost per gallon of denatured ethanol; Pkwh is the price of electricity per kilowatt hour; fd is the fraction of byproduct sold as DDGS rather than MWDGS;
Figure 2. Shutdown prices for corn and ethanol at surveyed plants.
Figure 3. Natural gas vs. fraction of DGS dried.
eF F i c i en c y i n mi d w e s t Us c o r n e th an o l P l an ts 1315
PMMBTU is the price of natural gas per MMBTU; PECI is the Em-ployment Cost Index (series CIS101) from the Bureau of La-bor Statistics (http://www.bls.gov/news.release/eci.nr0.htm); Pcorn is the price of corn per bushel; PPIeam is the Pro-ducer Price Index for the ethyl alcohol manufacturing industry (series PCU325193325193) from the Bureau of Labor Statistics (http://www.bls.gov/data/#prices).
Coefficients for prices of electricity and natural gas repre-sent quantities per gallon of ethanol, with natural gas require-ment adjustable for the fraction of byproduct that is dried (fd.) But coefficients for PECI and PPIeam are implicit quantity in-dexes calculated by dividing survey sample expenditures on personnel and on all other processing inputs by the sample-period average values of the respective price indexes. The coefficient for the price of corn measures the net feedstock quantity—the quantity of corn required per gallon minus the corn-equivalent value of byproduct, with byproduct price set at the average sample value relative to corn.
To adjust operating cost to the level of prices in July, 2008, we utilize the cost function as detailed in Table 7. Column four shows average prices from our survey and column five shows the resulting cost of the respective components in survey av-erage cost of production. Columns five and six adjust to ap-proximate prices as of early July, 2008. The effect of input price increases was to increase the average cost of production from $1.28/gal in our sample, to $2.30/gal in July, 2008. The main contributors to this $1.02/gal cost increase were the net feed-stock cost, which increased by $0.81/gal, and natural gas cost, which increased by $0.18/gal.
6.2. Updated shutdown prices and firm performance using the cost function
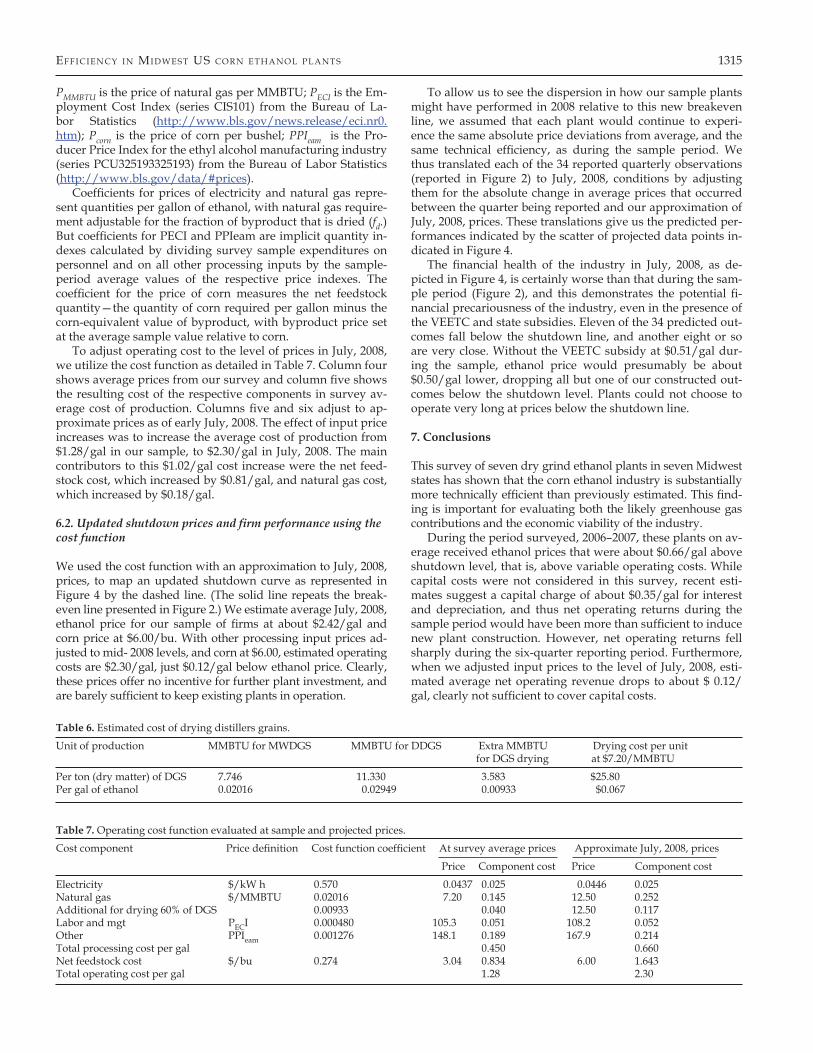
We used the cost function with an approximation to July, 2008, prices, to map an updated shutdown curve as represented in Figure 4 by the dashed line. (The solid line repeats the break-even line presented in Figure 2.) We estimate average July, 2008, ethanol price for our sample of firms at about $2.42/gal and corn price at $6.00/bu. With other processing input prices ad-justed to mid- 2008 levels, and corn at $6.00, estimated operating costs are $2.30/gal, just $0.12/gal below ethanol price. Clearly, these prices offer no incentive for further plant investment, and are barely sufficient to keep existing plants in operation.
To allow us to see the dispersion in how our sample plants might have performed in 2008 relative to this new breakeven line, we assumed that each plant would continue to experi-ence the same absolute price deviations from average, and the same technical efficiency, as during the sample period. We thus translated each of the 34 reported quarterly observations (reported in Figure 2) to July, 2008, conditions by adjusting them for the absolute change in average prices that occurred between the quarter being reported and our approximation of July, 2008, prices. These translations give us the predicted per-formances indicated by the scatter of projected data points in-dicated in Figure 4.
The financial health of the industry in July, 2008, as de-picted in Figure 4, is certainly worse than that during the sam-ple period (Figure 2), and this demonstrates the potential fi-nancial precariousness of the industry, even in the presence of the VEETC and state subsidies. Eleven of the 34 predicted out-comes fall below the shutdown line, and another eight or so are very close. Without the VEETC subsidy at $0.51/gal dur-ing the sample, ethanol price would presumably be about $0.50/gal lower, dropping all but one of our constructed out-comes below the shutdown level. Plants could not choose to operate very long at prices below the shutdown line.
7. Conclusions
This survey of seven dry grind ethanol plants in seven Midwest states has shown that the corn ethanol industry is substantially more technically efficient than previously estimated. This find-ing is important for evaluating both the likely greenhouse gas contributions and the economic viability of the industry.
During the period surveyed, 2006–2007, these plants on av-erage received ethanol prices that were about $0.66/gal above shutdown level, that is, above variable operating costs. While capital costs were not considered in this survey, recent esti-mates suggest a capital charge of about $0.35/gal for interest and depreciation, and thus net operating returns during the sample period would have been more than sufficient to induce new plant construction. However, net operating returns fell sharply during the six-quarter reporting period. Furthermore, when we adjusted input prices to the level of July, 2008, esti-mated average net operating revenue drops to about $ 0.12/gal, clearly not sufficient to cover capital costs.
Table 6. Estimated cost of drying distillers grains.
Unit of production MMBTU for MWDGS MMBTU for DDGS Extra MMBTU Drying cost per unit for DGS drying at $7.20/MMBTU
Per ton (dry matter) of DGS 7.746 11.330 3.583 $25.80Per gal of ethanol 0.02016 0.02949 0.00933 $0.067
Table 7. Operating cost function evaluated at sample and projected prices.
Cost component Price definition Cost function coefficient At survey average prices Approximate July, 2008, prices
Price Component cost Price Component cost
Electricity $/kW h 0.570 0.0437 0.025 0.0446 0.025Natural gas $/MMBTU 0.02016 7.20 0.145 12.50 0.252Additional for drying 60% of DGS 0.00933 0.040 12.50 0.117Labor and mgt PECI 0.000480 105.3 0.051 108.2 0.052Other PPIeam 0.001276 148.1 0.189 167.9 0.214Total processing cost per gal 0.450 0.660Net feedstock cost $/bu 0.274 3.04 0.834 6.00 1.643Total operating cost per gal 1.28 2.30

1316 Per r i n, Fr ete s, & ses me r o i n En E r g y Pol i c y 37 (2009)
The survey revealed substantial variability across firms in financial performance, but relatively small differences in tech-nical efficiency measures. Only one of the 34 quarterly per-formances reported was near the shutdown level, but when we projected each of the 34 reported quarterly performances to July, 2008, market price conditions, 11 of them would have been operating at or below shutdown levels. If these prices were to persist for a quarter or two, there would no doubt be a number of plants across the industry shutting down, with perhaps severe consequences for their small communities. It is important that this possibility be evident not only to plant owners and managers, but also to community leaders and pol-icy makers.
Direct production subsidies played a minor role in the fi-nances of these plants. Two of the seven plants received no operating subsidies, others were eligible for federal or state subsidies that averaged $0.03/gal across all plants—signifi-cant amounts in the aggregate, but relatively small in deter-mining financial viability of the industry. The most significant subsidy affecting the industry, the federal Volumetric Etha-nol Excise Tax Credit (VEETC) of $0.50/gal is paid to blend-ers, and thus is reflected in the market price for ethanol. In the absence of VEETC, ethanol price would presumably be $0.50/gal lower, and had that been so, these plants would have av-eraged only $0.16 in net operating returns during the report-ing period, or only about half enough to cover capital costs for new plant construction. Under July, 2008 prices, operating rev-enues would have plummeted to $–0.38/gal or so, accompa-nied surely by widespread plant shutdowns.
In general, we conclude that the corn ethanol industry has better performance characteristics than generally acknowl-edged, and while it remains viable even under July, 2008,
prices, returns would not be sufficient to pay capital costs for new plants, and without VEETC, these prices would not have been sufficient for most of these plants to continue operation.
Acknowledgments — This study was supported by the Agri-cultural Research Service, University of Nebraska, and USDA regional project NC506.
References
Eidman, Vernon R., 2007. Ethanol Economics of Dry Mill Plants, Ch3 in Corn-Based Ethanol in Illinois and the US. Department of Agri-cultural and Consumer Economics, University of Illinois.
Kwiatkowski, Jason R., McAloon, Andrew J., Taylor, Frank, John-son, David B., 2006. Modeling the process and costs of fuel etha-nol production by the corn drygrind process. Industrial Crops and Products 23, 288–296.
McAloon, Andrew, Taylor, Frank, Yee, Winne, 2000. Determining the cost of producing ethanol from corn starch and lignocellu-losic feedstocks. National Renewable Energy Laboratory NREL/TP-580-28893.
Pimentel, David, Patzek, Tad W., 2005. Ethanol production using corn, switchgrass, and wood; biodiesel production using soybean and sunflower. Natural Resources Research 14 (1).
Plevin, R.J., Mueller, S., 2008. The effect of CO2 regulations on the cost of corn ethanol production. Environmental Research Letters 3, 024003.
Shapouri, Hosein, Gallagher, Paul, 2005. USDA’s 2002 Ethanol Cost-of-Production Survey. Agricultural Economic Report no. 841, US Dept. of Agriculture.
Wang, Michael, Wu, May, Huo, Hong, 2007. Life-cycle energy and greenhouse gas emission impacts of different corn ethanol plant types. Environmental Research Letters 2.
Figure 4. Shutdown corn and ethanol prices, updated to July, 2008, input prices.