full set of fact sheets - solutions.marvin.vito.be
TRANSCRIPT

RiBaTox – Full Set of Fact Sheets
1
The SOLUTIONS project has received funding from the European Union’s Seventh Framework
Programme for research, technological development and demonstration under grant agreement no.
603437
Solutions for present and future emerging pollutants in land and water
resources management
THEME
ENV.2013.6.2-2
Toxicants, environmental pollutants and land and water resources management
Start date of project: 1st October 2013 Duration: 5 years
Full Set of Fact Sheets
Version: 28.09.2018
In cooperation with
All SOLUTIONS Partners

RiBaTox – Full Set of Fact Sheets
2
This document provides the full set of Fact Sheets produced for the online web-based service RiBaTox
(Guide to Tools and Services for River Basin Toxicants). A manual for RiBaTox can be downloaded here.
Contents
1 Monitoring strategies ................................................................................................................... 5 1.1 General ........................................................................................................................................ 5
FS044 Strategies for monitoring of chemicals and their effects ....................................................... 5 1.2 Sampling strategies ...................................................................................................................... 9
FS047 Sampling strategies ................................................................................................................ 9 FS048 Grab sampling...................................................................................................................... 13 FS039 Passive sampling for monitoring of trace organic chemicals in surface waters .................. 16 FS094 Passive sampling for monitoring of trace metals in surface waters .................................... 19 FS049 Large-volume solid phase extraction (LVSPE) ................................................................... 22 FS050 Event sampling .................................................................................................................... 27
1.3 Analytical strategies .................................................................................................................. 30 FS051 Analytical strategies for emerging contaminants in aquatic environments ......................... 30 FS001 Protocols for target analysis of emerging contaminants (including metabolites and transformation products) in water and biota .................................................................................... 33 FS078 Standard operational procedures (SOPs) for individual organic compounds ...................... 36 FS079 Standard operational procedures (SOPs) for organic compounds classes ........................... 40 FS005 Syntheses of reference standards for SOLUTIONS ............................................................ 49 FS052 Screening for 'known unknown' or 'suspect' pollutants ....................................................... 51 FS003 Non-target screening and structure elucidation workflow .................................................. 56
1.4 Strategies for effect-based monitoring ...................................................................................... 60 FS002 Effect-Based Tools (EBT) ................................................................................................... 60 FS053 in vivo Bioassays ................................................................................................................. 64 FS054 in vitro Bioassays ................................................................................................................. 66 FS055 Benchmarks and trigger values............................................................................................ 70 FS056 Biological early warning systems (BEWS) ......................................................................... 72
1.5 Strategies for toxicant identification ......................................................................................... 76 FS045 Strategies for the identification of toxicity drivers .............................................................. 76 FS057 Ecotoxicological mass balances .......................................................................................... 79 FS058 Virtual Effect-Directed Analysis .......................................................................................... 82 FS046 Higher Tier Effect-Directed Analysis .................................................................................. 86
1.6 Strategies for ecological assessment ......................................................................................... 92 FS059 Strategies for ecological assessment .................................................................................... 92 FS004 Statistical approaches to discriminate multiple stressor influences on the community level ......................................................................................................................................................... 94 FS083 Pollution-induced community tolerance for the in situ identification of ecological chemical impacts on microbial communities .................................................................................................. 97 FS085 Fish biomarkers – biomarkers for exposure to and effects of chemicals in fish ............... 100 FS087 Weight of evidence approaches ......................................................................................... 103

RiBaTox – Full Set of Fact Sheets
3
2 Modelling strategies ................................................................................................................ 106 2.1 General .................................................................................................................................... 106
FS060 Modelling strategies .......................................................................................................... 106 2.2 SOLUTIONS model train ....................................................................................................... 110
FS016 From emissions to effects: Model Train for SOLUTIONS ............................................... 110 FS017 SOLUTIONS emissions model ......................................................................................... 114 FS018 Spatially and temporally-resolved transport and fate modelling ....................................... 119 FS065 REACH-compatible approach to 'typical' exposure estimation ........................................ 123 FS019 Risk Characterisation Model: Advanced tiered mixture risk assessment .......................... 126 FS035 Ecological risk quantification via Species Sensitivity Distributions (SSD) ...................... 130 FS037 Ecotoxicological modelling to estimate the total toxic pressure of water bodies ............. 137 FS026 Combination Toxicity Calculator (CTC) ........................................................................... 140 FS086 Estimation of toxic pressure from distributions ................................................................ 143 FS014 Identification of new substances potentially posing a high risk to river basins ................ 148 FS027 Risk based prioritization (RBP) of emerging contaminants in drinking water ................. 151
2.3 Substance property estimation ................................................................................................. 154 FS020 Substances Properties and Use Data .................................................................................. 154 FS062 Modelled Substance Property Data ................................................................................... 157 FS006 Models for predicting environmental fate endpoint - Neutral hydrolysis ......................... 159 FS007 Models for predicting environmental fate and ecotoxicity endpoints – Biodegradation, Bioaccumulation, Acute aquatic toxicity ....................................................................................... 161
2.4 Models for predicting human health endpoints ....................................................................... 164 FS068 Models for predicting human health endpoints ................................................................. 164 FS008 Models for predicting human health endpoints – Eye irritation ........................................ 169 FS012 Models for predicting human health endpoints – Skin irritation/corrosion....................... 171 FS013 Models for predicting human health endpoints - Skin sensitization ................................. 174 FS011 Model for predicting Photo-induced toxicity..................................................................... 176 FS009 Models for predicting in vitro genotoxicity endpoints ...................................................... 179 FS010 Models for predicting in vivo genotoxicity endpoints ....................................................... 182 FS080 Models for predicting receptor mediated effects (estrogen/androgen binding) ................ 185 FS081 TIMES model for predicting aromatase inhibition potency .............................................. 188 FS082 TIMES model for predicting aryl hydrocarbon receptor (AHR) binding potency ............ 191
3 Data ......................................................................................................................................... 196 3.1 General .................................................................................................................................... 196
FS061 Databases needed for integrated risk evaluation of chemicals .......................................... 196 3.2 Data bases ................................................................................................................................ 201
FS024 Integrated Data Portal for SOLUTIONS ........................................................................... 201 FS021 Spatial Data in Support to Risk Assessments for Emerging Compounds on a European Scale ............................................................................................................................................... 204 FS043 SOLUTIONS Database of physico-chemical, chemical and ecotoxicological monitoring data ................................................................................................................................................. 207 FS089 List of substances that can be modelled ............................................................................ 209 FS090 Database of substance-specific emissions per sub-catchment ........................................... 211 FS091 Substance Property Data .................................................................................................... 213 FS036 Ecotoxicity database for Species Sensitivity Distributions impact modelling .................. 215 FS025 Macro-invertebrate Trait Database – as part of the IDPS .................................................. 219

RiBaTox – Full Set of Fact Sheets
4
4 Prioritization strategies ............................................................................................................ 221 4.1 General .................................................................................................................................... 221
FS069 Prioritization strategies ...................................................................................................... 221 4.2 Prioritization ............................................................................................................................ 226
FS041 Advanced methodological framework for the identification and prioritization of contaminants and contaminant mixtures ....................................................................................... 226 FS027 Risk based prioritization (RBP) of emerging contaminants in drinking water ................. 231 FS014 Identification of new substances potentially posing a high risk to river basins ................ 234
4.3 Future pollutants ...................................................................................................................... 237 FS030 Developments in society and the pollutants of tomorrow ................................................. 237 FS031 Future pollutants: How to predict? .................................................................................... 241 FS032 Future pollutants: Which pollutants can we expect? ......................................................... 244 FS033 Future pollutants: How to avoid? ...................................................................................... 247 FS034 Avoid problems from the beginning: Criteria for sustainable chemicals .......................... 249
5 Abatement strategies ............................................................................................................... 253 5.1 General .................................................................................................................................... 253
FS015 Strategy for cost-efficient employment of abatement options ........................................... 253 5.2 Abatement strategies ............................................................................................................... 256
FS028 Technical and non-technical abatement options ................................................................ 256 FS029 Tool-box for the evaluation of abatement options in wastewater and drinking water treatment ........................................................................................................................................ 259 FS070 Footprint reduction ............................................................................................................ 265
6 Policy strategies ....................................................................................................................... 270 6.1 General .................................................................................................................................... 270
FS071 Policy strategies for a safe and efficient regulation of chemicals ..................................... 270 6.2 Policy strategies ....................................................................................................................... 272
FS022 Policy framework database ................................................................................................ 272 FS072 Recommendations – future policy possibilities ................................................................. 274
7 Cases studies ............................................................................................................................ 276 7.1 Danube river basin ................................................................................................................... 276
FS042 Joint Danube Survey 3 (JDS3) .......................................................................................... 276 FS043 SOLUTIONS Database of physico-chemical, chemical and ecotoxicological monitoring data ................................................................................................................................................. 278 FS092 Sampling concept for WWTPs effluent monitoring .......................................................... 280
7.2 Iberian river basins .................................................................................................................. 286 FS040 Priority pollutants in Iberian Rivers .................................................................................. 286 FS077 Relationships between chemical pollution and environmental stressors and ecosystem effects in Mediterranean river basins ............................................................................................. 289
7.3 Rhine river basin ..................................................................................................................... 292 FS075 Assessment of wastewater-impacted streams .................................................................... 292 FS027 Risk based prioritization (RBP) of emerging contaminants in drinking water ................. 296
8 Communication ....................................................................................................................... 299 8.1 General .................................................................................................................................... 299
FS076 SOLUTIONS online .......................................................................................................... 299 9 Acknowledgement ................................................................................................................... 302
RiBaTox – Full Set of Fact Sheets
5
1 Monitoring strategies
1.1 General
FP7 SOLUTIONS project - Fact Sheet 044
Name SOLUTIONS Tool or Service
FS044 Strategies for monitoring of chemicals and their effects
Description
1. Objective
You have reached this Fact Sheet because you are planning monitoring activities in surface waters in order to survey the status of contamination and related adverse effects, to assess pollution risks, to understand cause-effect relationships, to identify sources of contamination etc. Monitoring according to the Water Framework Directive (WFD) addresses an ecological (Biological Quality Elements, hydro-morphology, River Basin Specific Pollutants) and a chemical status (Priority Pollutants) and is defined as:
• Surveillance monitoring to support impact assessment and assess long term changes in natural conditions and anthropogenic impacts
• Operational monitoring to establish the status of water bodies under risk of failing to meet their environmental objectives and to assess changes in these water bodies resulting from programmes of measures
• Investigative monitoring to identify reasons for exceedances of environmental objectives and to ascertain the magnitude and impacts of accidental pollution.
There is extensive guidance by the European Commission for Monitoring under the Water Framework Directive (EC, 2003) [Ref01]. The present factsheet does neither attempt to repeat or summarize this guidance nor to follow the concept of chemical and ecological status as defined by the WFD but addresses objectives and approaches in monitoring of chemicals and their effects beyond the monitoring approaches defined by the WFD. In this factsheet the term chemical contamination is used as the totality of chemicals occurring in a water body and possibly causing adverse effects to aquatic organisms, ecosystems and/or human health.
Typical objectives of chemical and effects monitoring one might follow are: • Survey chemical contamination in a river basin, stream, lake or water body
• Survey potential toxic effects in a river basin, stream, lake or water body
• Identify hot spots of contamination
• Understand the temporal variability of contamination and identify time windows of concern
• Link ecological observations to chemical contamination
• Identify chemicals and mixtures driving adverse effects
• Identify sources of contamination

RiBaTox – Full Set of Fact Sheets
6
• Monitor the success of abatement measures
Awareness is strongly increasing that chemical contamination is always occurring in complex mixtures rather than as individual chemicals and measurable effects and observable degradation may be a mixture effect rather the effect of individual chemicals. Thus, SOLUTIONS provides strategies to explicitly address chemical mixtures FS002 in monitoring and assessment (Altenburger et al., 2015) [Ref02].
2. Methodology
There are three general approaches for the monitoring of chemical mixtures and their effects recommended by RiBaTox. They include:
• Chemical monitoring FS047, FS051, FS045
• Effect-based monitoring FS002
• Ecological monitoring FS004, FS059
as well as combinations thereof.
All types of monitoring strongly depend on the sampling strategy FS047. For chemical and effect-based monitoring be aware that grab sampling might be not very representative and may miss important contaminants with a highly dynamic occurrence such as pesticides. Time-integrated sampling strategies may provide more representative information on average concentrations in a time window of concern, while event sampling helps to characterize maximum concentrations. The thorough and representative selection of sampling sites according to the specific objectives of the study is important as well. While characterization of typical contamination of a river might require sampling sites where effluents and tributaries are completely mixed in, investigation of the impact of specific contamination sources may require sampling in the wastewater effluent plume. In the context of ecological investigations sampling sites reflecting gradients of pollution may be a good choice. Depending on the chemicals in the focus, the matrix to be sampled and analysed should be selected. While hydrophobic chemicals such as many persistent organic pollutants (POPs) are analysed best in hydrophobic matrices such as sediments, biota tissues or passive samplers, more hydrophilic chemicals should be monitored in the water phase. If volatile chemicals are of concern measures should be taken to avoid losses to the atmosphere during sampling.
Chemical monitoring FS051 may be performed as target FS001, suspect FS052 or non-target analysis FS003. Depending on the approach one chooses, chemical monitoring may provide concentrations of pre-selected target analytes in water, sediment or biota, or information on the presence of suspected or unknown chemicals in a sample. Chemical monitoring may support your risk assessment, help you to identify hot spots and sources of contamination as well as to understand temporal variability. Keys to meaningful chemical monitoring are the:
• Selection of chemicals. In order to satisfy regulatory needs a focus on WFD Priority Pollutants or River Basin Specific Pollutants may be required. However, such a selection may completely fail to address major toxicants on the local scale. An intensive study of existing sources of information may be very helpful to select specific chemicals from emissions by local industries, agriculture, hospitals etc.
• Selection of analytical tools strongly determines the compounds that can be detected and quantified. Typical types of tools for the analysis of organic compounds are gas chromatography mass spectrometry (GC-MS) for low-polarity, semi-volatile compounds while liquid chromatography mass spectrometry (LC-MS) is an excellent tool for more polar and hydrophilic chemicals.
RiBaTox – Full Set of Fact Sheets
7
Effect-based monitoring FS002 provides you with an integrated measure on all chemicals affecting the toxicological endpoint used in a specific bioassay and may be used as biological early warning system (BEWS) FS056 to detect rapid changes in environmental conditions, such as chemical spills. This approach directly considers mixture effects that might significantly exceed the effects of the individual components of a mixture. In contrast to chemical target and suspect monitoring no assumptions are required on chemicals of concern. Effect-based monitoring may also provide a characterization of hazardous contamination if risks are posed by complex mixtures rather than distinct chemicals. However, effect-based monitoring does not provide information on the identity of chemicals causing effects. So far, effect-based monitoring is not required by the WFD but discussed as a complementary tool. Effect-based monitoring relies on the selection of toxicological endpoints and test systems. Effect based monitoring tools may include:
• in vitro tests FS054, typically based on cellular systems often characterized by small volumes, high throughput and specific effects (e.g. binding to specific nuclear receptors),
• in vivo tests FS053 using whole organisms. They are tested for effects on apical endpoints such as lethality, and inhibition of growth and reproduction or biomarker responses detecting more specific responses. Acute effects on whole organisms may be used for early warning FS056.
Ecological monitoring FS059 provides you with an assessment of the ecological status with view on possible chemical impacts at a specific site in the aquatic environment. The detection of chemical impacts on biota, may range from individual level impairment (see above) up to the composition of communities. It shall discriminate these impacts from the impact of other stressors such as general water quality, hydro-morphological parameters or local habitat. The ecological status of a community of e.g. macro-invertebrates, macrophytes or fish at a specific site in an absolute sense shall answer the question whether chemicals are likely to be the cause for an impaired status.
The detection of chemical impacts on biota and discrimination from other, non-chemical stressors can focus on (sub-)individual or community levels. Individual level assessment can include for example the use of in situ biomarkers in fish. Such an assessment is further elaborated in FS085. In this case the required data consists mainly of the results of biomarker measurements from fish samples. The identification of chemical effects, in contrast to other stressors, is suggested by statistical approaches, further elaborated in FS004. The impact of pollutants on algae communities is topic of FS083.
The assessment of the ecological quality for a certain site or a number of sites combines multiple lines of evidence in a weight of evidence (WOE) approach. This approach is combining tests and tools from different levels of biological organisation (from cell tests to community data) with chemical exposure data in a schematic way, further outlined in FS087. An application has been included as Diagnostic Toolbox in RiBaTox. The aim is to identify the biological quality of a certain site, in connection to the question whether chemicals have a possible impact.
All three monitoring approaches have significant strengths and weaknesses. None of them alone is able to provide a comprehensive picture of chemical contamination and its effects and risks on aquatic organisms and ecosystems or human health, for example via drinking water consumption. The WFD requires chemical and ecological monitoring, however, often lacking links between both of them that might be provided by effect-based monitoring. Thus, intelligent combinations of all three monitoring approaches may help to understand pollution induced degradation. Quality triad approaches following this philosophy have been developed already in the early 1990s (Chapman, 1990) [Ref03].
More specific strategies for the identification of toxicity drivers FS045 and to establish cause

RiBaTox – Full Set of Fact Sheets
8
effect-relationships between chemical contamination and measurable effects have been developed by SOLUTIONS. Depending on the degree of pre-knowledge on candidate chemicals possibly causing effects, the scale of the study and the ambitions of study objectives mass balance approaches FS057, virtual effect-directed analysis (EDA) FS058 or higher tier EDA FS046 are available for toxicant identification.
References
1. European Commission (2003). Common Implementation Strategy for the Water Framework Directive (2000/60/EC). Guidance document No 7. Monitoring under the Water Framework Directive; https://circabc.europa.eu/sd/a/63f7715f-0f45-4955-b7cb-58ca305e42a8/Guidance%20No%207%20-%20Monitoring%20(WG%202.7).pdf
2. Altenburger, R., S. Ait-Aissa, P. Antczak, T. Backhaus, D. Barceló, T.B. Seiler, F. Brion, W. Busch, K. Chipman, M. López de Alda, G. de Aragão Umbuzeiro, B.I. Escher, F. Falciani, M. Faust, A. Focks, K. Hilscherova, J. Hollender, H. Hollert, F. Jäger, A. Jahnke, A. Kortenkamp, M. Krauss, G.F. Lemkine, J. Munthe, S. Neumann, E.L. Schymanski, M. Scrimshaw, H. Segner, J. Slobodnik, F. Smedes, S. Kughathas, I. Teodorovic, A. J. Tindall, K.E. Tollefsen, K.H. Walz, T.D.Williams, P.J. Van den Brink, J. van Gils, B. Vrana, X. Zhang, W. Brack (2015). Future water quality monitoring — Adapting tools to deal with mixtures of pollutants in water resource management. Sci. Total Environ. 512-513: 540-551; https://doi.org/10.1016/j.scitotenv.2014.12.057
3. Chapman (1990). The sediment quality triad approach to determining pollution-induced degradation. Sci. Tot. Environ. 97/98: 815-825; https://doi.org/10.1016/0048-9697(90)90277-2
Keywords
mixtures, chemical monitoring, effect-based monitoring, ecological monitoring, triad, WFD monitoring
Related topics
Sampling strategies FS047 Analytical strategies FS051 Effect-Based Tools (EBT) FS002 Strategies for the identification of toxicity drivers FS045 Ecological toolbox FS059
Contact information
Werner Brack ([email protected])
Helmholtz Centre for Environmental Research – UFZ, Leipzig, Germany

RiBaTox – Full Set of Fact Sheets
9
1.2 Sampling strategies
FP7 SOLUTIONS project - Fact Sheet 047
Name SOLUTIONS Tool or Service
FS047 Sampling strategies
Description
1. Objective
You have reached this Fact Sheet because you are planning a monitoring campaign on micro-pollutants in a river or in wastewater effluents and want to develop a tailor-made sampling strategy. This monitoring campaign may involve chemical analytical FS051 or effect-based methods FS002 and may address different matrices including (surface) water, sediments and biota. You may address pre-selected individual target chemicals or the complex mixture of contaminants in a water body. Please be aware that sampling campaigns for other purposes (e.g. characterization of organism populations and communities) and in other environments and matrices (groundwater, soil, atmosphere, etc.) are not addressed in this factsheet.
Surveillance and operational monitoring under the Water Framework Directive (WFD) is well defined and described [Ref01] from a regulatory perspective and will not be repeated or summarized here. In agreement with the concept of the SOLUTIONS project the present factsheet guides you to innovative sampling strategies that go beyond the current WFD approach and might help to enhance the explanatory power of monitoring.
Sampling is the attempt to obtain information about an entire system (such as a whole river extending in space and time and consisting of different compartments including the water body, sediments, biota) by examining only a part of it (e.g. a set of water samples taken at specific locations and specific time points). Thus, the significance of the information drawn from a monitoring campaign and the conclusions that can be drawn on the whole system strongly depend on the sampling strategy. In the present factsheet decision support on the selection of sampling strategies will be given related to the objectives you might have for your monitoring campaign. By selecting appropriate strategies you may arrive at more detailed descriptions of these approaches based on the extensive experience gained in SOLUTIONS.
2. Decisions to be made and methodology
Sampling strategies need to consider • the objectives of a monitoring campaign and the endpoints that shall be considered, • system properties such as variability in time and space, and • logistic and budgetary conditions and limitations.
Keeping these three issues in mind, decisions are required on the • matrix to be sampled, • sampling technology to be applied, • design of the monitoring network in space, and • frequency and timing of sampling.

RiBaTox – Full Set of Fact Sheets
10
Matrix to be sampled: Samples may include water (different sampling techniques depending on the objectives), sediment and different types of biota (fish, invertebrates, biofilms, etc.) to be subjected to chemical analysis FS051, effect-based monitoring FS002 and combined approaches for toxicant identification FS045. The following table provides a brief characterization of typical fields of application for different sample matrices.
matrix chemicals variability in time
relevance
water hydrophilic and moderate hydrophobic
high aquatic ecosystems and drinking water
sediments hydrophobic, often persistent
low, time integrating
long term sink and source, historic pollution, benthic organisms
biota hydrophobic, persistent
medium, time integrating
bioavailable and bioaccumulating pollution, organisms and human health (e.g., fish consumption)
Sampling technologies: Description of sampling technologies shall be discussed here only for water. Extensive guidance on techniques for sediment sampling is available elsewhere [Ref02]. Water sampling technologies include at least four approaches [Ref03]: • Grab sampling FS048: Sampling of water in appropriate vessels at a specific time and
location. Strengths: Simple and cheap. Used for monitoring according to WFD. Allows for direct injection into LC-MS for organic chemical analyses minimizing losses, contamination etc. Concerns: Snapshot sampling. Representativeness may be limited. Water samples are of low stability requiring particular attention for transport and storage conditions, such as cooling and conservation. For effect-based monitoring often larger volumes (e.g. 50 L of water) are required that create additional challenges.
• Passive sampling FS039: In situ deployment of non-mechanical devices of simple construction capable of accumulating contaminants dissolved in water. Strengths: Time-integrated sampling typically providing average concentrations on the time of deployment (typically 2-6 weeks). Particularly suitable for hydrophobic chemicals in water helping to improve limits of detection. Some passive samplers can be considered as biomimetic, indicating the amount of a compound that might be accumulated in biota lipids. Limited logistic efforts. No transport of water samples. High stability of compounds on the sampler. Concerns: Mixture in the passive sampler typically does not resemble the mixture in water. Compound-specific calibration is required to translate concentrations in the sampler to water concentrations. Limited applicability if the whole mixture is in the focus of chemical or effect-based monitoring.
• On-site large-volume solid phase extraction (LVSPE) FS049: Extraction of water samples by active pumping through columns filled with adsorbents. Strengths: Solid phase extraction (SPE) is a well-established tool to extract organic chemicals from water in the laboratory with high recovery and for a broad range of typical water contaminants (depending on the solid phase that is used). Application at the sampling site

RiBaTox – Full Set of Fact Sheets
11
allows for the extraction of large volumes (10 to 1,000 L) of water avoiding any transport of water. Time-integrated sampling with highly flexible extraction times (from half an hour to a month) depending on the objective. Within the extraction domain the mixture resembles the one in water. Thus, the sampling method is appropriate for addressing mixtures of known and unknown chemicals with chemical analysis as well as effect-based tools. High stability of the compounds on the solid phase is an additional strength.
Concerns: Higher costs and logistic efforts compared to passive sampling. Electricity required. • Event sampling FS050: Chemicals may occur with high peak concentrations in rivers that may
drive toxicity but are not covered by random grab sampling and hardly by long-term integrated sampling (averages instead of peaks). This holds particularly for pesticides from agricultural run-off and compounds from urban run-off at heavy rainfall events. Strengths: Event sampling addresses peak events triggered by continuously measured parameters such as conductivity or water level. Depending on the objective and system properties sampling operation includes simple grab samplers (bottles filling when a specific water level is exceeded), active event-triggered grab samples (e.g. by pumping water into a vessel) or LVSPE sampling procedures.
Concerns: Installation and triggering of sampling may require substantial logistic efforts.
Design of monitoring network in space Concentrations of chemicals as well as other parameters change when we follow a river downstream due to the occurrence of sources of contaminants and dilution with uncontaminated water. In addition, partitioning with other compartments such as groundwater, sediments and the atmosphere as well as biological, chemical and photochemical transformation processes may occur. Thus, it is a key question when establishing a monitoring network how to select an optimal number of sampling sites and distances between them to properly characterize the system with minimum efforts. Spatial autocorrelation analysis for individual chemicals or parameters has been demonstrated to be a powerful tool to address this challenge (illustrated in the figure below) [Ref04]. This was demonstrated for the monitoring of 235 chemicals along the river Danube by the determination of correlation length using the Moran autocorrelation index.
Figure 1. Schematic representation of river monitoring optimisation using the Spatial Autocorrelation
Model approach
RiBaTox – Full Set of Fact Sheets
12
Frequency and timing of sampling: While some compounds occur quite constantly in wastewater effluents and receiving river waters, others undergo significant seasonal, even weekly or daily fluctuations FS050. Typical examples are the seasonal application of pesticides or consumption of specific pharmaceuticals, or the increased consumption of illicit drugs during weekends. Other compounds are discharged mainly during peak events, e.g. after heavy rainfall. In order to be meaningful, sampling strategies, in particular frequencies and timing should be adapted to these fluctuations. The analysis of temporal autocorrelation for individual chemicals may help identify optimal frequencies of sampling in a time series.
References
1. European Commission, 2003. Common Implementation Strategy for the Water Framework Directive (2000/60/EC). Guidance document No 7. Monitoring under the Water Framework Directive; https://circabc.europa.eu/sd/a/63f7715f-0f45-4955-b7cb-58ca305e42a8/Guidance%20No%207%20-%20Monitoring%20(WG%202.7).pdf
2. Mudroch, A. and MacKnight, S.D., 1994. Handbook of techniques for aquatic sediments sampling. CRC Press, Boca Raton, pp.235; https://www.crcpress.com/Handbook-of-Techniques-for-Aquatic-Sediments-Sampling/Mudroch-MacKnight/p/book/9781566700276
3. Brack, W., S. Ait-Aissa, R.M. Burgess, W. Busch, N. Creusot, C. Di Paolo, B.I. Escher, L.M. Hewitt, K. Hilscherova, J. Hollender, H. Hollert, W. Jonker, J. Kool, M. Lamoree, M. Muschket, S., Neumann, P. Rostkowski, C. Ruttkies, J. Schollee, E.L. Schymanski, T. Schulze, T.-B. Seiler, A.J. Tindall, G. de Aragao Umbuzeiro, B. Vrana and M. Krauss, 2016. Effect-directed analysis supporting monitoring of aquatic environments – An in depth overview. Sci. Total Environ. 544: 1073-1118; https://doi.org/10.1016/j.scitotenv.2015.11.102
4. Ginebreda, A., Sabater-Liesa, L., Rico, A., Focks, A. and Barceló, D., 2017. Reconciling monitoring and modeling: An appraisal of river monitoring networks based on a spatial autocorrelation approach - emerging pollutants in the Danube River as a case study. Sci. Total Environ. 618: 323-335; https://doi.org/10.1016/j.scitotenv.2017.11.020
Keywords
sampling technologies, monitoring network
Related topics
Strategies for monitoring of chemicals and their effects FS044 Grab sampling FS048 Passive sampling for monitoring of trace organic contaminants in surface waters FS039 Passive sampling for monitoring of trace metals in surface waters FS094 Large-volume solid phase extraction FS049 Event sampling FS050
Contact information
Werner Brack ([email protected])
Helmholtz Centre for Environmental Research – UFZ, Leipzig, Germany

RiBaTox – Full Set of Fact Sheets
13
FP7 SOLUTIONS project - Fact Sheet 048
Name SOLUTIONS Tool or Service
FS048 Grab sampling
Description
1. Objective
You have arrived on this Fact Sheet because you are interested to learn more about sampling, in particular Grab sampling, which is often used under the EU Water Framework Directive (WFD, Directive 2000/60/EC, [Ref03]) for ecological and chemical status monitoring [Ref01].
The objective of sampling is to collect a portion of material from an environmental compartment small enough in volume to be transported conveniently and handled in the laboratory, while still accurately representing the part of the environment sampled. Representativity is the key word in this definition, not only in terms of whether the portion of the sample truly represents the natural environment sampled, but also whether the sampling and following sample handling is under sufficient control that no changes (contamination, loss) occur.
As stated in the Fact sheet Sampling strategies FS047, several other sampling strategies can be distinguished. Next to Grab sampling, one may use Integrated sampling, covering a given transect or area and/or period of time, which may consist of a series of grab samples that are collected and pooled, but the continuous collection by pumping system is also an option. This approach undoubtedly may give better representativity of the samples. Other integrating methods include Passive sampling FS039, Large-volume solid phase extraction FS049, and Event sampling FS050.
2. Methodology
Grab sampling, also called Spot sampling, is the most basic form of sampling, which may be carried out in all compartments, water, sediment and/or biota. Sampling involves a sampling device (sampler, pumping system, sediment corer, nets, etc.) that collects a sample at a given location and time. Hence the samples are in principle representative only for these conditions. When the water body is expected to be more or less homogeneous (in space and time), these samples may still provide valuable information. Analytical results of grab samples are in principle valid for the specific location at the time of sampling. However, in the representation of these results in line charts, subsequently taken samples are connected by straight lines, which is no more than wishful thinking.
For logistic (and statistical) reasons sampling is often performed at regular intervals. Sampling is often not performed at higher frequencies, such as daily/weekly intervals, but e.g. only every two months. In river systems where water discharge (m3/s) and suspended matter (mg/l) are fluctuating, the 'peaks' in flow/load that are often of relatively short duration, are often not detected. This will then result in an underestimation of the calculated load [Ref02]. In addition to frequency, the sampling location is of importance. Often accessibility from the shore determines the site, while distance from the shore or vertical distribution may seriously affect the representativity [Ref05].
The higher the sampling frequency the more representative the information obtained will be, but there are obvious logistic and financial constraints. A balance between information content and financial means shall be sought. The WFD in Annex V 1.3.4 sets minimum sampling frequencies for biological, hydro-morphological and physico-chemical parameters e.g. for rivers and lakes. For priority substances minimum is at monthly intervals, other pollutants at 3 months intervals. The Common implementation strategy for the WFD - Guidance Document No. 19 further details the

RiBaTox – Full Set of Fact Sheets
14
sampling strategy of surface waters (higher frequencies may be needed) [Ref03]. Similarly, the CIS-Guidance Document 25 on the chemical monitoring of sediment and biota, and details sampling and sampling tools for the other two compartments [Ref04].
3. Application
Grab sampling was used e.g. in the case studies of the Solutions project, depending on the parameters: • Danube: Joint Danube Survey 3 FS042
• Rhine river basin FS075
• Priority pollutants in Iberian Rivers FS040
In addition, other sampling methods were applied (e.g. use of centrifugation to collect suspended particulate matter over river stretches in the JDS3).
References
1. Quevauviller, Ph., U. Borchers, K.C. Thompson & T. Simonart (Eds), 2008. The Water Framework Directive. Ecological and chemical status monitoring. Wiley Publ. Chichester, pp. 476; http://eu.wiley.com/WileyCDA/WileyTitle/productCd-0470518367.html
2. Walling, D.E. and B.W. Webb, 1985. Estimating the discharge of contaminants to coastal waters by rivers: some cautionary comments. Mar. Poll. Bull. 16: 488-492; https://doi.org/10.1016/0025-326X(85)90382-0
3. European Communities, 2009. Common implementation strategy for the Water Framework Directive (2000/60/EC). Guidance Document No. 19. Guidance on surface water chemical monitoring under the Water Framework Directive. EC - Technical Report 2009-25, Luxembourg, pp. 222; https://publications.europa.eu/en/publication-detail/-/publication/91d313f0-2cc7-4874-b101-a7dba97401b0
4. European Communities, 2010. Common implementation strategy for the Water Framework Directive (2000/60/EC). Guidance Document No. 25. On chemical monitoring of sediment and biota under the water Framework Directive. EC - Technical Report 2010-041, Luxembourg, pp. 74 https://publications.europa.eu/en/publication-detail/-/publication/5ff7a8ec-995b-4d90-a140-0cc9b4bf980d
5. Kramer, K.J.M., 1994. Inorganic contaminants in the water column: sampling and sampling strategy. Intern. J. Environ. Anal. Chem. 57: 179-188 http://dx.doi.org/10.1080/03067319408027424
Keywords
Spot sampling, grab sampling, sampling frequency
Related topics
Strategies for monitoring of chemicals and their effects FS044 Sampling strategies FS047 Passive sampling for monitoring of trace organic chemicals in surface waters FS039 Passive sampling for monitoring of trace metals in surface waters FS094 Large-volume solid phase extraction FS049 Event sampling FS050

RiBaTox – Full Set of Fact Sheets
15
Contact information
Kees Kramer ([email protected])
Mermayde, Groet, Netherlands

RiBaTox – Full Set of Fact Sheets
16
FP7 SOLUTIONS project - Fact Sheet 039
Name SOLUTIONS Tool or Service
FS039 Passive sampling for monitoring of trace organic chemicals in surface waters
Description
1. Objective
You have reached this Fact Sheet because you are planning monitoring activities in surface waters in order to survey the status of pollution and related adverse effects, to assess pollution risks, to identify sources of pollution, temporal and/or spatial pollution trends, etc. The general strategies for monitoring of chemicals and their effects in surface waters have been addressed in Fact Sheet FS044. Depending on objectives of monitoring chemicals and their effects, you are now looking for sampling tools and approaches fit for the purpose of your monitoring study or programme. A general overview of available sampling strategies and tools has been provided FS047. Among them, passive sampling presented in this Fact Sheet is a sampling approach that allows time-integrative sampling of pollutants at ultra-trace levels. The objectives include the development and use of a representative passive sampling method able to monitor low levels of organic chemicals in water.
2. Methodology
Organic chemicals are often present in the water column at trace concentrations that are often difficult to detect using conventional low volume spot/grab sampling of water FS048. Passive samplers can be applied for screening and analysis FS001 of trace organic pollutants and their toxic potentials in the water column of rivers and lakes, as well as for the assessment of their spatial and temporal gradients in water bodies.
Passive sampling involves the deployment of a device, which uses a gradient in chemical activity between sampler and water to spontaneously (by diffusion) collect chemicals over a period of days to weeks. This is followed by extraction and analysis of chemicals in a laboratory to provide a measure of concentrations of chemicals to which the sampler was exposed. Freely dissolved concentrations of priority substances in the water phase (cfree) can be derived from the uptake of toxic substances by passive samplers, and because the accumulated chemicals represent a large water volume, low limits of quantification can be obtained. Cfree is a more stable parameter than a concentration measured in whole water as the level is not influenced by variable amounts of the substance bound to dissolved and suspended particulate organic matter. Cfree is proportional to the chemical activity and consequently reflects the uptake of chemicals by aquatic organisms at the base of the food chain.
Uptake rates of chemicals by passive samplers are low in stagnant water and they increase with the level of water turbulence. A ‘dynamic’ passive sampling (DPS) device was developed in which water is pumped over a passive sampler to artificially increase and stabilise the turbulence level. The enhanced uptake rate of chemicals into passive samplers in the DPS device allows to reduce the exposure time needed for accumulation of sufficient chemical amounts for analysis. At the same time the uptake principle in the DPS remains the same as in classical ‘caged’ passive sampling and the monitoring results can be evaluated using the same passive sampler calibration parameters. Results for DPS and caged passive sampling are inter changeable. Besides deployment at stationary sampling sites DPS can be applied as a mobile passive sampler operated from ships for temporally and spatially integrative sampling of trace organic chemicals.

RiBaTox – Full Set of Fact Sheets
17
Thus a representative picture of the pollution levels along defined stretches or transects of large water bodies including rivers, lakes or seas is obtained.
Figure 1. The dynamic passive sampling device. It consists of a rectangular stainless-steel plate chamber. Samplers are placed on a wire mesh support inside the chamber and the box is closed by two lids. During sampling, each sampler is exposed to water only from one side. The box always remains open at the left-hand and the right-hand side. The left-hand side of the box is connected to a submersible pump (ca 9 m3/h) that forces water at high flow velocity (1-2 m/s) through the sampler exposure chamber. During sampling operation, the DPS device is fully immersed in water.
3. Application
A spatial-integrative passive sampling approach was tested during Joint Danube Survey 3 (JDS3) FS042 by applying the DPS approach (Vrana et al., 2015) [Ref01], [Ref02], [Ref03]. Two DPS devices were implemented in parallel: one for target chemical analyses, the other extracted chemicals from water for testing in bioassays. Samples were obtained by operating the samplers on the ship that moved downstream the Danube river. This approach provided a representative picture of the state of pollution of hydrophobic and polar contaminants as well as their toxicity profiles in eight defined stretches of the Danube river FS043, [Ref04].
References
1. Vrana, B., F. Smedes, T. Rusina, K. Okonski, I. Allan, M. Grung, M. Hilscherova, J. Novák, P. Táribek and Jaroslav Slobodnik, 2015. Passive sampling: chemical analysis and toxicological profiling. In: I. Liška, F. Wagner, M. Sengl, K. Deutsch and J. Slobodník (Eds.) Joint Danube Survey 3. ICPDR – International Commission for the Protection of the Danube River, Vienna, pp. 304–315; http://www.danubesurvey.org/results
2. Guidelines describing passive sampling and analytical aspects of the procedure for relevant compounds. SOLUTIONS internal deliverable T2.3, http://www.solutions-project.eu/wp-content/uploads/2017/01/SOLUTIONS_Guidelines_Passive_Sampling.pdf
3. Vrana, B., Smedes, F., Allan, I., Rusina, T., Okonski, K., Hilscherová, K., Novák, J., Tarábek, P., Slobodník, J., 2018. Mobile dynamic passive sampling of trace organic compounds: Evaluation of sampler performance in the Danube River. Sci. Total Environ. 636: 1597-

RiBaTox – Full Set of Fact Sheets
18
1607; https://doi.org/10.1016/j.scitotenv.2018.03.242 4. Novák, J., Vrana, B., Rusina, T., Okonski, K., Grabic, R., Neale, P.A., Escher, B.I., Macová, M.,
Ait-Aissa, S., Creusot, N., Allan, I., Hilscherová, K., 2018. Effect-based monitoring of the Danube River using mobile passive sampling. Sci. Total Environ. 636, 1608-1619; https://doi.org/10.1016/j.scitotenv.2018.02.201
Keywords
monitoring, passive sampling, Joint Danube Survey, priority substances, river basin specific pollutants, toxicity profiling
Related topics
Strategies for monitoring of chemicals and their effects FS044 Sampling strategies FS047 Grab sampling FS048 Passive sampling for monitoring of trace metals in surface waters FS094 Large-volume solid phase extraction FS049 Event sampling FS050
Contact information
Branislav Vrana ([email protected]) Research Centre for Toxic Compounds in the Environment (RECETOX), Brno, Czech Republic

RiBaTox – Full Set of Fact Sheets
19
FP7 SOLUTIONS project - Fact Sheet 094
Name SOLUTIONS Tool or Service
FS094 Passive sampling for monitoring of trace metals in surface waters
Description
1. Objective
You have reached this Fact Sheet because you are planning monitoring activities in surface waters in order to survey the status of pollution and related adverse effects, to assess pollution risks, to identify sources of pollution, temporal and/or spatial pollution trends etc. The general strategies for monitoring of chemicals and their effects in surface waters have been addressed FS044. Depending on objectives of monitoring chemicals and their effects, you are now looking for sampling tools and approaches fit for the purpose of your monitoring study or programme. A general overview of available sampling strategies and tools has been provided FS047. Among them, passive sampling is a sampling approach that allows time-integrative sampling of pollutants at trace level [Ref01].
Besides organic chemicals, trace metals often present a risk to aquatic organisms and human health. Passive sampling of organic chemicals in surface waters is addressed in a separate Fact Sheet FS039. The objective of this Fact Sheet is to provide basic information on passive sampling tools available for monitoring trace metals and organometallic compounds in surface waters [Ref01]. Metals and organometallic compounds occur in water in a wide range of species including ions and complexes with inorganic and organic ligands. The species differ in physicochemical properties and toxic potential. Relevant toxic metal species present in the water column are often difficult to sample and preserve using conventional low volume spot/grab sampling of water FS048. Often passive samplers can be applied for analysis of metals and their species in the water column of rivers and lakes, as well as for the assessment of spatial and temporal gradients of bioavailable metals.
2. Methodology
Available passive sampling techniques for the detection of elements and inorganic compounds in aqueous environments include the diffusive gradients in thin films (DGT) and Chemcatcher systems. They are well suited to in situ detection of bioavailable toxic trace metal contaminants in natural waters and sediments [Ref02], [Ref03].
Passive samplers can be deployed in the field for extended periods of time ranging from days to weeks. The metallic species of interest are sequestered by the samplers and these are retained on the receiving phase, typically a chelating resin. After retrieval from the environment the pollutants are eluted from the receiving phase and analysed in the laboratory using conventional instrumental methods (e.g. ICP/MS).
DGT relies on the quantitative diffusive transport of solutes across a well-defined gradient in concentration, typically established within a layer of hydrogel and outer filter membrane. The filter membrane is exposed directly to the deployment solution and acts as a protective layer for the diffusive gel. Once diffusing through these outer layers, solutes are irreversibly removed or chelated at the back side of the diffusive gel by a selective binding agent, typically Chelex 100, which is immobilized in a second layer of hydrogel. The hydrogels used in DGT are typically made of polyacrylamide, which can be manufactured with a range of properties [Ref02].
DGT is sensitive to the chemical speciation in solution, as it will measure only those complexes that can dissociate (labile) and diffuse through the gel (mobile). Measuring those species is more

RiBaTox – Full Set of Fact Sheets
20
relevant for assessment of exposure risk to aquatic organisms than a concentration measurement in whole water as the level since labile species better reflect the bioavailability of metals in aquatic organisms.
Another techniques that is available for passive sampling of metals in the aquatic environment is based on a variant of the versatile passive sampler Chemcatcher® [Ref03]. Chemcatcher comprises a reusable three component, water-tight PTFE body. Two different designs are available to accommodate different types of commercially available 47 mm diameter receiving phase disks: M EmporeTM Chemcatcher® and Horizon AtlanticTM Chemcatcher® with variants suitable for monitoring metals and inorganic ions.
Figure 1. Two versions of the Chemcatcher® deployed in surface waters.
3. Application
Passive sampling techniques are applicable for monitoring of significant number of elements and compounds, including cationic metals, phosphate and other oxyanions (V, CrVI, As, Se, Mo, Sb, W), stable isotopes of Cs and Sr, radionuclides of Cs and Tc and nano-particles. They find their application in speciation measurements, bioavailability studies as well as in routine environmental monitoring.
References
1. Vrana, B., Allan, I.J., Greenwood, R., Mills, G. a., Dominiak, E., Svensson, K., Knutsson, J., Morrison, G., 2005. Passive sampling techniques for monitoring pollutants in water. TrAC Trends Anal. Chem. 24, 845–868. https://doi.org/10.1016/j.trac.2005.06.006
2. https://en.wikipedia.org/wiki/Diffusive_gradients_in_thin_films 3. https://en.wikipedia.org/wiki/Chemcatcher 4. Warnken K.W., Zhang H. and Davison W., 2007. In situ monitoring and dynamic speciation
measurements in solution using DGT. In: Greenwood, R., Mills, G. and Vrana, B. (Eds.), Comprehensive Analytical Chemistry 48. Passive sampling techniques in environmental monitoring. Elsevier, Amsterdam, pp. 251-275. https://doi.org/10.1016/S0166-526X(06)48007-7
Keywords
monitoring, passive sampling, priority substances, river basin specific pollutants, metals, bioavailability

RiBaTox – Full Set of Fact Sheets
21
Related topics
Strategies for monitoring of chemicals and their effects FS044 Sampling strategies FS047 Grab sampling FS048 Passive sampling for monitoring of trace organic chemicals in surface waters FS039 Large-volume solid phase extraction FS049 Event sampling FS050
Contact information
Branislav Vrana ([email protected]) Research Centre for Toxic Compounds in the Environment (RECETOX), Brno, Czech Republic

RiBaTox – Full Set of Fact Sheets
22
FP7 SOLUTIONS project - Fact Sheet 049
Name SOLUTIONS Tool or Service
FS049 Large-volume solid phase extraction (LVSPE)
Description
1. Objective
You have reached this Fact Sheet because you are interested to learn more about large-volume solid phase extraction (LVSP), its design and method of operation, as part of strategies for sampling FS047 and monitoring FS044 of organic contaminants in the aquatic environment.
LVSPE [Ref01] is a highly mobile sampling tool for the automated on-site solid phase extraction of larger water volumes to support the integrated effect-based and chemical monitoring and investigation of water resources and effect-directed analysis [Ref02], [Ref03]. It was proven as a robust technology for the time-integrative collection of a wide range of water burden organic compounds with different physico-chemical properties such as pharmaceuticals, pesticides and other chemicals of emerging concern [Ref04], [Ref05], [Ref06].
LVSPE fills the gaps of grab FS048, classical automated FS050 and passive sampling FS039 with respect to integrity and representativeness of the samples.
2. Methodology
The LVSPE was developed in two different versions. The LVSPE50 device allows for the collection of up to 50 L of water (Figure 1), while the LVSPE1000 model was designed for volumes up to 1,000 L (Figure 2). The main parts of the devices are the pre-filter, the sampling and dosing chamber, the ball valve, the pressure chamber and the controller.
With both devices, water is sucked by vacuum into the borosilicate glass dosing system (1). The water enters the Sartopure GF+ MidiCap pre-filter (Sartorius) (2) in the inflow pipe to remove suspended particulate matter. A conductivity sensor controls the maximal water level in the glass tube (volume: 600 mL) and a dip tube allows exact dosing of the sample volume (500 mL). The ball valve (3) keeps the water in the dosing system and releases it into the pressure chamber (4) when opened. After release, the ball valve closes and the water is pumped with a positive pressure of approximately 100 kPa through one cartridge (5) or a sequence of cartridges with different sorbents (Figures 1a and 2a). The cartridges are filled from the bottom to avoid preferential flow paths through the solid phase bed. The controller allows a customized programming of the sampling frequency and the total number of sub-samples of 500 mL each until the desired total volume is reached.
The extraction cartridge of the LVSPE50 device is built of polyvinylidene fluoride (Figure 1b). Cartridges made of stainless steel or other tailored materials can also be used. The cartridges are available in different sizes (4 to 10 g of sorbent). The solid phases are packed between the glass filter plates, and the cartridges are closed with two screw caps with O-ring type silicone tights.

RiBaTox – Full Set of Fact Sheets
23
Figure 1 (a) Picture of the LVSPE50 device; (1): Dosing system (500 mL), (2): pre-filter, (3): ball valve, (4): pressure chamber (550 mL), (5): extraction cartridge, (6): controller (Photo by MAXX GmbH); (b) Scheme of the LVSPE50 cartridge; (1): inlet fitting, (2) lower and upper screw caps with mortises to take in the (3) silicone tights, (4) outlet fitting, (5) glass filter disc, (6) body containing the sorbent (from [Ref01]).
Figure 2 (a) Picture of the LVSPE1000 device; (1): Dosing system (500 mL), (2): pre-filter (3): ball valve, (4): pressure chamber (550 mL), (5): extraction cartridge, (6): controller (Photo by MAXX GmbH). (b) Scheme of the LVSPE1000 cartridge; (1): inlet fitting with ball valve, (2) filter segments, (3) silicone tights, (4) outlet fitting with ball valve, (5) body containing the resin (from [Ref01]).
The extraction cartridge of the LVSPE1000 device consists of stainless steel parts, the tights with putative water contact are made from silicone, the fittings of the centre rings between the segments are made from Viton (not in contact with water) (Figure 2b). The outer ring is equipped with ISO-K flanges for easy assembling of the segments to a sandwich cartridge using inner centre rings and clamps. In each segment, a smaller ring is mounted. The gap between the inner and outer ring is tightened by a silicone O-ring. Stainless steel gauze (pore size: 36 µm) is welded into the inner ring to retain the sorbent in the cartridge. The fabric is supported by a perforated stainless steel plate. Each segment can hold between 100 and 160 g of bulk solid phases. The

RiBaTox – Full Set of Fact Sheets
24
segment is closed with a similar ring on the top of the segment. The whole cartridge is equipped with two cones with ball valves on the top and bottom to connect the column to the in- and outflow and to close it tightly for storage and transport.
LVSPE is a comprehensive tool for the automated and composite sampling of water resources for all purposes of effect based monitoring FS002 and toxicant identification FS045, also in combination with chemical analysis FS051. The device and method can be tailored to the specific needs and goals of the sampling campaign and monitoring program. It is possible to run LVSPE to collect a large-volume sample in short term over some hours on-site, but also to gain a time-integrated large-volume sample over a longer time frame (e.g. 7 days) with frequent collection of sub-samples. In comparison with grab, classical automated and passive sampling, LVSPE has the following advantages:
1. Time-integrative sampling ensures representativeness of the sample in terms of baseline and peak loads of chemicals.
2. Within the limitations of solid-phase extraction, LVSPE ensures a representative sampling of the complex contamination of water bodies including known and unknown organic chemicals with minimal bias and discrimination.
3. The fixation of the compounds on the solid phase preserves degradation.
4. The exact volume of water extracted is registered and known.
5. On-site extraction prevents logistical, technical, economic and scientific issues related to the storage and transport of large water volumes to the laboratory and subsequent processing.
3. Application
LVSPE was successfully applied in the SOLUTIONS project during the Danube River Case Study, and the Rhine River Case Study, and in the EDA-EMERGE project for the purpose of effect-based and chemical analyses ([Ref06], [Ref07]). During the Joint Danube Survey3 (JDS3) FS042, along the Danube River 21 LVSPE samples have been collected to apply bioanalytical tools complementary to chemical analysis including in vitro FS054 and in vivo bioassays FS053 [Ref04]. Chemical fingerprints did explain between 0.2% and 80% of the effects in the bioassays and thus the importance of fingerprinting the effects of detected chemicals was highlighted FS055.
A further LVSPE study on a hotspot site at Danube River in Novi Sad (untreated waste water effluent) confirmed the previous results, showing that endocrine disruption could be explained by the concentration of the measured hormones but not the other effects [Ref05].
In the River Rhine case study FS075, a well performing effect-directed analysis study FS046 based on a LVSPE sample unraveled a possible cause for the long-known mutagenicity in Rhine River (Muz et al. 2017 [Ref07]. They found that there is a co-mutagenicity of weakly mutagenic aromatic amines and the known alkaloid comutagen norharman along with related β-carboline alkaloids FS046 and resulting mixture toxicity effects FS041.
In the European Demonstration Program of EDA-EMERGE, a simplified effect-directed analysis approach was evaluated using sampling at 18 sites in four European river basins. LVSPE extracts were subjected to simplified effect-based analysis with a set of in vitro FS054 and in vivo bioassays FS053 and to target analysis of 151 relevant organic compounds [Ref06].
References
1. Schulze T., M. Ahel, J. Ahlheim, S. Aït-Aïssa, F. Brion, C. Di Paolo, J. Froment, A.O. Hidasi, J. Hollender, H. Hollert, Meng Hu, A. Kloß, S. Koprivica, M. Krauss, M. Muz, P. Oswald, M. Petre, J.E. Schollée, Th.-B. Seiler, Ying Shao, J. Slobodnik, M. Sonavane, M.J.-F.Suter, K.E.

RiBaTox – Full Set of Fact Sheets
25
Tollefsen, Z. Tousova, K.-H. Walz and W. Brack, 2017. Assessment of a novel device for onsite integrative large-volume solid phase extraction of water samples to enable a comprehensive chemical and effect-based analysis. Sci. Total Environ. 581-582: 350-358; https://dx.doi.org/10.1016/j.scitotenv.2016.12.140
2. Altenburger, R., S. Ait-Aissa, P. Antczak, T. Backhaus, D. Barceló, T.-B. Seiler, F. Brion, W. Busch, K. Chipman, M. López de Alda, G. Aragão Umbuzeiro, B.I. Escher, F. Falciani, M. Faust, A. Focks, K. Hilscherova, J. Hollender, H. Hollert, F. Jäger, A. Jahnke, A. Kortenkamp, M. Krauss, G.F. Lemkine, J. Munthe, S. Neumann, E.L. Schymanski, M. Scrimshaw, H. Segner, J. Slobodnik, F. Smedes, S. Kughathas, I. Teodorovic, A.J. Tindall, K.E. Tollefsen, K.-H. Walz, T.D. Williams, P.J. Van den Brink, J. van Gils, B. Vrana, X. Zhang and W. Brack, 2015. Future water quality monitoring - Adapting tools to deal with mixtures of pollutants in water resource management. Sci. Total Environ. 512–513: 540-551; https://dx.doi.org/10.1016/j.scitotenv.2014.12.057
3. Brack, W., S. Ait-Aissa, R.M. Burgess, W. Busch, N. Creusot, C. Di Paolo, B.I. Escher, L.M. Hewitt, K. Hilscherova, J. Hollender, H. Hollert, W. Jonker, J. Kool, M. Lamoree, M. Muschket, S. Neumann, P. Rostkowski, C. Ruttkies, J. Schollee, E.L. Schymanski, T. Schulze, T.-B. Seiler, A.J. Tindall, G. De Aragão Umbuzeiro, B. Vrana and M. Krauss, 2016. Effect-directed analysis supporting monitoring of aquatic environments — An in-depth overview. Sci. Total Environ. 544: 1073-1118; https://dx.doi.org/10.1016/j.scitotenv.2015.11.102
4. Neale, P.A., S. Ait-Aissa, W. Brack, N. Creusot, M.S. Denison, B. Deutschmann, K. Hilscherová, H. Hollert, M. Krauss, J Novák, T. Schulze, T.-B. Seiler, H. Serra, Ying Shao and B.I. Escher, 2015. Linking in vitro effects and detected organic micropollutants in surface water using mixture toxicity modeling. Environ. Sci. Technol. 49: 14614-14624; https://dx.doi.org/10.1021/acs.est.5b04083
5. König, M., Escher B.I., Neale P.A., Krauss M., Hilscherová K., Novák J., Teodorović I., Schulze T., Seidensticker S., Kamal Hashmi M.A., Ahlheim J. and Brack W., 2017. Impact of untreated wastewater on a major European river evaluated with a combination of in vitro bioassays and chemical analysis. Environ. Pollut. 220: 1220-1230; https://dx.doi.org/10.1016/j.envpol.2016.11.011
6. Tousova Z., Oswald P., Slobodnik J., Blaha L., Muz M., Hu M., Brack W., Krauss M., Di Paolo C., Tarcai Z., Seiler T.B., Hollert H., Koprivica S., Ahel M., Schollée J.E., Hollender J., Suter M.J., Hidasi A.O., Schirmer K., Sonavane M., Ait-Aissa S., Creusot N., Brion F., Froment J., Almeida A.C., Thomas K., Tollefsen K.E., Tufi S., Ouyang X., Leonards P., Lamoree M., Torrens V.O., Kolkman A., Schriks M., Spirhanzlova P., Tindall A. and Schulze T., 2017. European demonstration program on the effect-based and chemical identification and monitoring of organic pollutants in European surface waters. Sci. Total Environ. 601–602: 1849-1868; https://dx.doi.org/10.1016/j.scitotenv.2017.06.032
7. Muz M, Krauss M, Kutsarova S, Schulze T, Brack W., 2017. Mutagenicity in surface waters: synergistic effects of carboline alkaloids and aromatic amines. Environmental Sci. Technol. 51: 1830-1839; https://dx.doi.org/10.1021/acs.est.6b05468
Keywords
Large-volume solid phase extraction, Environmental monitoring, Sampling, Water, Monitoring strategies, Sampling strategies, Effect-based monitoring, Toxicant identification, Analytics
Related topics
Strategies for monitoring of chemicals and their effects FS044 Sampling strategies FS047

RiBaTox – Full Set of Fact Sheets
26
Grab sampling FS048 Passive sampling for monitoring of trace organic chemicals in surface waters FS039 Passive sampling for monitoring of trace metals in surface waters FS094 Event sampling FS050
Contact information
Tobias Schulze ([email protected])
Helmholtz Centre for Environmental Research – UFZ, Leipzig, Germany

RiBaTox – Full Set of Fact Sheets
27
FP7 SOLUTIONS project - Fact Sheet 050
Name SOLUTIONS Tool or Service
FS050 Event sampling
Description
1. Objective
You have arrived on this Fact Sheet because you are interested to learn more about sampling, in particular event sampling, which aims at capturing sudden and often short-lived peaks of contamination due to heavy rainfall leading to a combined sewer overflow (CSO) [Ref01] and surface runoff [Ref02], (accidental) spills, individual and distinct wastewater pulses [Ref03] or spray events. Due to increasing extreme weather events leading to more severe and frequent storm events, event sampling has gained more attention in aquatic research. Since these events are hardly predictable, samplers need to be suitable to be left on site at all times considering factors such as outdoor durability, possible power supply, appropriate sample storage and theft protection. At the same time, representative samples need to be taken in order to study event mean concentrations (EMCs) or the dynamics within an event and between events. Event sampling may be induced by Biological Early Warning Systems, BEWS (FS056).
2. Methodology
Event sampling depends on the researcher’s definition of an event (i.e, deviation from the ‘normal situation’) and the goal of the study. Event sampling makes use of existing sampling techniques, which are modified for the specific event conditions.
Thus, the scope of techniques for event sampling is quite large: 1) Stationary sampling with glass bottles: Brown glass bottles are installed e.g. at the edge of an
(agricultural) field in order to capture surface run-off into the water body [Ref02]. Likewise, bottles may also be installed in the water body. Here, bottles are mounted horizontally to the medium water level at different levels (e.g., 5 and 10 cm) to sample rising water levels due to rain events [Ref04]. Bottles have to be checked regularly to avoid sample degradation and rapid transfer of samples to laboratories shall be ensured for appropriate storage and analysis.
2) Flow dependent passive sampling: For the concept and methodology of passive sampling please refer to the fact sheets for passive sampling (FS039, FS094). The objective of passive sampling is mainly to obtain time-integrative samples. This in contrast to the task of event sampling. However, new efforts have been made to develop flow-through passive samplers, which are suitable for storm water event sampling. Velocity dependent passive sampling enables flow-integrative sampling of runoff events. Thus, samples during rain events are weighted higher than samples taken during dry weather conditions providing EMCs [Ref05].
While passive sampling techniques have the advantage to be independent from power, cost-efficient and are suitable for outdoor installation in remote locations including wastewater infrastructure, they cannot provide high time-resolved samples.
3) Automated samplers: Auto-samplers provide high time-resolved samples and are often equipped with a cooling unit to store samples until collection and transfer to the laboratory. Furthermore, technology allowing for on-site extraction of water samples such as large-volume solid phase extraction FS049 may be used for event sampling campaigns. Since auto-samplers can be equipped with different sensors, they may be used for several different event settings. The sampling programme may be triggered by e.g. rain fall, rising water level, change in conductivity, BEWS, etc. or even remotely via text messages. SMS modules allow for remote

RiBaTox – Full Set of Fact Sheets
28
control and real-time communication between users and the sampling instrument. Furthermore, all information about the sampling process is logged. Sampling time and frequency per sample and the total duration of the sampling period depends on the distance from the pollution source and the nature of events (e.g., individual spill/wastewater pulse or rain event) as well as dynamics and fate of studied micro-pollutant [Ref03].
Most auto-samplers can be programmed [Ref03] for a) time-proportional sampling: At defined time intervals a pre-defined sample volume is
collected; b) volume-proportional sampling: After a defined volume of water has passed the sampling
spot, a pre-defined sample volume is taken, and c) flow-proportional sampling: At defined time intervals, a sample volume is taken that is
proportional to the water flow at the sampling spot.
The samples may later be pooled to one representative composite sample giving an EMC or analysed individually to study within-event dynamics. Limitations of auto-samplers include costs, power supply and storage space for the samples.
3. Application
Event sampling has been applied in a SOLUTIONS study aiming at unravelling pollution dynamics of organic micro-pollutants in a small stream during heavy rainfall [Ref06]. Storm events were sampled with an auto-sampler (TP5, MAXX [Ref07]). The sampler was equipped with 24 glass 600 ml bottles and a cooling unit to store samples until collection and transport to the laboratory. The auto-sampler was placed in a container-based laboratory ensuring power supply. In case of a power failure, the auto-sampler was equipped with a battery. Events were defined as heavy rainfall leading to CSO at an upstream Waste Water Treatment Plant (WWTP). The communication scheme between the WWTP and auto-sampler is shown in Figure 1. Both SMS modules were also connected to the mobile phones of the sampling staff allowing for real-time communication with the auto-sampler. This way, quick transport of samples to the laboratory and remote control of the sampler by the staff in case of technical problems was ensured. The auto-sampler was set to collect 200 ml samples every 10 min for 8 hours. Three samples were pooled to a 30 min composite sample. The long sampling time allowed to sample surface runoff from nearby agricultural fields as well as to capture the wave of untreated wastewater coming from the CSO.
Figure 1. Communication scheme between WWTP and auto-sampler [Ref08]
References
1. Krein, A.; Keßler, S.; Meyer, B.; Pailler, J. Y.; Guignard, C.; Hoffmann, L., 2013. Concentrations and loads of dissolved xenobiotics and hormones in two small river catchments of different

RiBaTox – Full Set of Fact Sheets
29
land use in Luxembourg. Hydrol. Process. 27(2): 284-296; https://doi.org/10.1002/hyp.9209 2. Schulz, R.; Hauschild, M.; Ebeling, M.; Nanko-Drees, J.; Wogram, J. and Liess, M., 1998. A
qualitative field method for monitoring pesticides in the edge-of-field runoff. Chemosphere, 36(15): 3071-3082; https://doi.org/10.1016/S0045-6535(98)00012-5
3. Ort, C.; Lawrence, M. G.; Rieckermann, J. and Joss, A., 2010. Sampling for pharmaceuticals and personal care products (ppcps) and illicit drugs in wastewater systems: Are Your Conclusions Valid? A Critical Review. Environ. Sci. Technol. 44 (16): 6024-6035; https://doi.org/10.1021/es100779n
4. Schriever, C.A.; von der Ohe, P.C. and Liess, M., 2007. Estimating pesticide runoff in small streams. Chemosphere, 68 (11): 2161-2171; https://doi.org/10.1016/j.chemosphere.2007.01.086
5. Birch, H.; Sharma, A.K.; Vezzaro, L.; Lützhøft, H.-C.H. and Mikkelsen, P.S., 2013. Velocity dependent passive sampling for monitoring of micropollutants in dynamic stormwater discharges. Environ. Sci. Technol. 47(22): 12958-12965; https://doi.org/10.1021/es403129j
6. Beckers, L.-M.; Ahlheim, J.; Brack, W.; Schulze, T. and Krauss, M., 2018. Unravelling pollution dynamics and sources of organic micropollutants in a small stream during heavy rainfall. (in preparation).
7. MAXX Mess- u. Probenahmetechnik GmbH TP5 C Active Vakuum. http://www.maxx-gmbh.com/english/produkte_tragbar_tp5_c_a_vakuum.htm (04.12.2017)
8. Fuß, F. (n.d.). Ermittlung des Schmutzfrachtpotentials befestigter Flächen für die Parameter Stickstoff und Phosphor als Grundlage für die Langzeitsimulation von Entlastungsfrachten aus Mischwasserkanalisationen. Master thesis (LAU).
Keywords
Event sampling, passive sampling, auto-samplers, heavy rainfall, CSO, surface runoff
Related topics
Strategies for monitoring of chemicals and their effects FS044
Sampling strategies FS047
Grab sampling FS048
Passive sampling for monitoring of trace organic chemicals in surface waters FS039
Passive sampling for monitoring of trace metals in surface waters FS094
Large-volume solid phase extraction FS049
Contact information
Liza-Marie Beckers ([email protected])
Helmholtz Centre for Environmental Research – UFZ, Leipzig, Germany

RiBaTox – Full Set of Fact Sheets
30
1.3 Analytical strategies
FP7 SOLUTIONS project - Fact Sheet 051
Name SOLUTIONS Tool or Service
FS051 Analytical strategies for emerging contaminants in aquatic environments
Description
1. Objective
You have arrived here because you are interested to know more about the current analytical chemical strategies that are in practice for the monitoring of the aquatic environment (water, sediment, biota), and some tools that support the analyses. Chemical monitoring of complex mixtures of emerging contaminants in aquatic systems requires complementary analytical strategies which allow for
(i) a sensitive quantification of known drivers of risks and effects, (ii) confirming or rejecting the presence of suspected mixture components,
(iii) identifying previously unknown mixture constituents.
The objective of this section is to provide an overview on different analytical strategies to fulfil these tasks.
2. Methodology
Combinations of gas chromatography (GC) and liquid chromatography (LC) with (low resolution) mass spectrometry (MS) are the methods of choice for the analysis of emerging contaminants in aquatic environments. Both techniques are complementary to cover a large and overlapping fraction of the chemical domain of emerging contaminants.
A range of conceptually different analytical strategies have been developed for the monitoring of emerging contaminants, which are target analysis or target screening, suspect screening, and non-target screening (Krauss et al., 2010 [Ref02]; Schymanski et al., 2014 [Ref05]). The workflows may differ for GC and LC and low resolution and high resolution MS, but are basically similar for all kind of environmental matrices. Particularly high resolution mass spectrometry (HRMS) provides a unique selectivity to meet the prerequisites for suspect and non-target screening.
A clear distinction between target analysis and target screening methods is not possible FS001. Typically, target analytical methods focus on a smaller number of compounds, and the sample preparation and analysis has been particularly optimized for these compounds. In contrast, target screening methods strife to include hundreds of compounds and thus the sample preparation is often very limited avoiding steps resulting in a removal of compounds. Target screening methods are clearly domains of HRMS, as analysis is possible in full scan mode without a loss in sensitivity. Nevertheless, dedicated target methods are often required for a low level detection pf emerging contaminants (e.g., in case of highly active compounds such as steroid hormones) where screening methods are inferior.
The suspect screening strategy (Moschet et al., 2013 [Ref03]) aims at detecting known compounds in the absence of reference standards FS052. It starts from the known structure and

RiBaTox – Full Set of Fact Sheets
31
molecular formula, from which the ion masses can be calculated considering the ionization. These ions are searched for in the MS data in a first step. Considering the high selectivity, HRMS instruments are clearly superior for this approach. Positive findings require subsequent confirmation steps which is based on a comparison of observed and theoretical isotope patterns as well as of measured and in-silico predicted MS/MS spectra or retention times.
Non-target screening FS003 in a strict sense is based solely the analytical data in the first step without any knowledge of the compounds present (Krauss et al., 2010 [Ref02]; Schymanski et al., 2014 [Ref05]). It typically starts with a peak detection (also called peak picking) step, which finally results in a list of all detected peaks and includes a removal of peaks from laboratory background and blank samples. The selectivity of HRMS offers here a clear benefit, making them the instruments of choice for nontarget screening. Often, peak lists from HRMS data of environmental samples contain several thousand peaks. Thus a prioritisation for the peaks of interest is the next step, which can be based on peak intensity, frequency across a set of samples or other criteria depending on the purpose of the study.
For prioritized peaks, spectral library search and/or molecular formula determination are the next steps. While for GC-electron ionisation-MS large libraries are available with a good chance of finding a match, LC-(HR)MS libraries are growing rapidly, but still comparably small, lowering the chance of a match. The main approach within LC-HRMS nontarget screening is therefore the determination of molecular formulas for the compounds of interest using accurate mass and isotope pattern information. Subsequently, candidate structures for these molecular formulas are searched in large chemical compound libraries (such as ChemSpider or PubChem), and the retrieved candidate list have to be ranked and filtered for the most probable structure. This ranking is based on a comparison between predicted properties of each structure with the experimental information. To this end, candidate selection workflows have been developed including MS/MS fragmentation prediction, retention time prediction, and commercial relevance of a compound (Gago-Ferrero et al., 2015 [Ref01]; Ruttkies et al., 2016 [Ref04]). Ideally, these workflows result in a low number of likely candidates, for which reference standards have to be obtained from commercial suppliers or synthesized for a final confirmation.
In support of the identification and quantification of compounds in the aquatic environment not all (suspect) compounds are available as analytical standards. In part this can be solved by syntheses of reference standards FS005. Further, some 200 Standard Operating Procedures (SOPs) for compounds have been developed for water and sediment FS078, and another set Standard operational procedures (SOPs) for compounds classes has become available FS079.
References
1. Gago-Ferrero, P., Schymanski, E.L., Bletsou, A.A., Aalizadeh, R., Hollender, J. and Thomaidis, N.S., 2015. Extended suspect and non-target strategies to characterize emerging polar organic contaminants in raw wastewater with LC-HRMS/MS. Environ. Sci. Technol. 49: 12333-12341; https://doi.org/10.1021/acs.est.5b03454
2. Krauss, M., Singer, H. and Hollender, J., 2010. LC–high resolution MS in environmental analysis: from target screening to the identification of unknowns. Anal. Bioanal. Chem. 397: 943-951; https://doi.org/10.1007/s00216-010-3608-9
3. Moschet, C., Piazzoli, A., Singer, H. and Hollender, J., 2013. Alleviating the reference standard dilemma using a systematic exact mass suspect screening approach with liquid chromatography-high resolution mass spectrometry. Anal. Chem. 85: 10312-10320; https://doi.org/10.1021/ac4021598

RiBaTox – Full Set of Fact Sheets
32
4. Ruttkies, C., Schymanski, E.L., Wolf, S., Hollender, J. and Neumann, S., 2016. MetFrag relaunched: incorporating strategies beyond in silico fragmentation. J. Cheminform. 8: 1-16.; https://doi.org/10.1186/s13321-016-0115-9
5. Schymanski, E. L., H. P. Singer, P. Longrée, M. Loos, M. Ruff, M. A. Stravs, C. Ripollés Vidal and J. Hollender, 2014. Strategies to characterize polar organic contamination in wastewater: exploring the capability of high resolution mass spectrometry. Environ. Sci. Technol. 48: 1811-1818; https://doi.org/10.1021/es4044374
Keywords
Chemical monitoring, target analysis, target screening, suspect screening, non-target screening
Related topics
Strategies for monitoring of chemicals and their effects FS044 Protocols for target analysis of emerging contaminants in water, sediment and biota FS001 Standard operational procedures (SOPs) for individual organic compounds FS078 Standard operational procedures (SOPs) for organic compounds classes FS079 Syntheses of reference standards for SOLUTIONS FS005 Screening for 'known unknown' or 'suspect' pollutants FS052 Non-target screening and structure elucidation workflow FS003
Contact information
Martin Krauss ([email protected])
Helmholtz Centre for Environmental Research – UFZ, Leipzig, Germany
RiBaTox – Full Set of Fact Sheets
33
FP7 SOLUTIONS project - Fact Sheet 001
Name SOLUTIONS Tool or Service
FS001 Protocols for target analysis of emerging contaminants (including metabolites and transformation products) in water and biota
Description
1. Objective
You have reached this Fact Sheet because you were looking for analytical methods to measure specific environmental contaminants.
Many priority and emerging contaminants are difficult to measure in the environment at the very low concentrations at which they can represent a risk. The objective of this section is to provide novel analytical methods for high-sensitivity determination of these pollutants, their metabolites and transformation products at levels below their predicted no-effect concentrations (PNEC).
2. Methodology
Novel analytical methods for high-sensitivity determination of target pollutants, metabolites and transformation products in water and biota have been developed for various target compounds. These methods are based on the use of the most advanced techniques (or under development) in the various fields of sampling (passive sampling, large volume solid phase extraction), sample preparation (HPCCC, high performance counter current chromatography), and analysis (gas chromatography and liquid chromatography coupled to high resolution tandem mass spectrometry).
3. Application
The work leads to the development of various analytical approaches used in the determination and identification of different classes of emerging pollutants and their metabolites and transformation products in diverse environmental matrices, such as surface water, drinking water, waste water and biota (see the references section). These methodologies have been applied to real samples in field monitoring studies demonstrating their robustness and their potential use in other laboratories/scenarios of study FS040. Other analytical methods are as yet in the development stage. Information on Standard Operational Procedures (SOPs) for compounds FS078 and compounds classes FS079 of particular concern and interest (Watch List, highly toxic, river basin specific pollutants, etc.) can be found in the factsheets indicated.
References
1. Palma, P., Köck-Schulmeyer M., Alvarenga P., Ledo L., Barbosa I.R., López de Alda M. and Barceló D., 2014. Risk assessment of pesticides detected in surface water of the Alqueva reservoir (Guadiana basin; southern Portugal). Sci. Total Environ. 488-489C: 208-219; https://doi.org/10.1016/j.scitotenv.2014.04.088
2. Mendoza, A., Rodríguez-Gil J.L., González-Alonso S., Mastroianni N., López de Alda M., Barceló D. and Valcárcel Y., 2014. Drugs of abuse and benzodiazepines in the Madrid Region (Central Spain): Seasonal variation in rivers waters, occurrence in tap water and potential environmental and human risk. Environ. Int. 70: 76-87; https://doi.org/10.1016/j.envint.2014.05.009
3. Negreira, N., de Alda M.L. and Barceló D., 2014. Cytostatic drugs and metabolites in
RiBaTox – Full Set of Fact Sheets
34
municipal and hospital wastewaters in Spain: filtration, occurrence, and environmental risk. Sci. Total Environ. 497-498: 68-77; https://doi.org/10.1016/j.scitotenv.2014.07.101
4. Negreira, N. and M. López de Alda, 2015. Degradation of the cytostatic etoposide in chlorinated water by liquid chromatography coupled to quadrupole-Orbitrap mass spectrometry: identification and quantification of by-products in real water samples. Sci. Total Environ. 506-507: 36-45; https://doi.org/10.1016/j.scitotenv.2014.10.097
5. Catalá, M., Domínguez-Morueco N., Migens A., Molina R., Martínez F., Valcárcel Y1., Mastroianni N., López de Alda M., Barceló D. and Segura Y., 2015. Elimination of drugs of abuse and their toxicity from natural waters by Photo-Fenton treatment. Sci. Total Environ. 520: 198-205; https://doi.org/10.1016/j.scitotenv.2015.03.042
6. Mendoza, A., J. Aceña, S. Pérez, M. López de Alda, D. Barceló, A. Gil and Y. Valcárcel, 2015. Pharmaceuticals and iodinated contrast media in a hospital wastewater; A case study to analyse their presence and characterise their environmental risk and hazard. Environ. Res. 140: 225-241; https://doi.org/10.1016/j.envres.2015.04.003
7. Negreira, N., López de Alda and D. Barceló, 2015. Degradation of the anticancer drug erlotinib during water chlorination: Non-targeted approach for the identification of transformation products. Water Res. 85: 103-113; https://doi.org/10.1016/j.watres.2015.08.005
8. Negreira, N., Regueiro J. and Barceló D., 2016. Transformation of tamoxifen and its major metabolites during water chlorination: Identification and in silico toxicity assessment of their disinfection byproducts. Water Res. 85: 199-207; https://doi.org/10.1016/j.scitotenv.2015.12.005
9. Negreira, N., López de Alda and D. Barceló, 2015. Reactivity of vinca alkaloids during water chlorination processes: Identification of their disinfection by-products by high-resolution quadrupole-Orbitrap mass spectrometry. Sci. Total Environ. 544: 635-644; https://doi.org/10.1016/j.scitotenv.2015.12.005
10. Schwanz, T.G., Llorca M., Farré M. and Barceló D., 2015. Perfluoroalkyl substances assessment in drinking waters from Brazil, France and Spain. Sci. Total Environ. 539: 143-152; https://doi.org/10.1016/j.scitotenv.2015.08.034
11. Heath, E., Česen M., Negreira N., de Alda M.L., Ferrando-Climent L., Blahova L., Nguyen T.V., Adahchour M., Ruebel A., Llewellyn N., Ščančar J., Novaković S., Mislej V., Stražar M., Barceló D. and Kosjek T., 2016. First interlaboratory comparison exercise for the determination of anticancer drugs in aqueous samples. Environ. Sci. Pollut. Res. 23: 14692-14704; https://doi.org/10.1007/s11356-015-4982-9
12. Zonja, B., Pérez S. and Barceló D., 2016. Human metabolite lamotrigine-N2-glucuronide is the principal source of lamotrigine-derived compounds in wastewater treatment plants and surface water. Environ. Sci. Technol. 50: 154-164; https://doi.org/10.1021/acs.est.5b03691
13. Zonja, B., Delgado A., Abad J.L., Pérez S. and Barcelo D., 2016. Abiotic amidine and guanidine hydrolysis of lamotrigine-N2-glucuronide and related compounds in wastewater: The role of pH and N2-substitution on reaction kinetics. Water Res. 100: 466-475.; https://doi.org/10.1016/j.watres.2016.04.072
14. Mendoza, A., Zonja B., Mastroianni N., Negreira N., López de Alda M., Pérez P., Barceló D., Gil A. and Valcárcel Y., 2016. Drugs of abuse, cytostatic drugs and iodinated contrast media in tap water from the Madrid region (central Spain): A case study to analyse their occurrence and human health risk characterization. Environ. Int. 86: 107-118; https://doi.org/10.1016/j.envint.2015.11.001
15. Mastroianni, N., Bleda M.J., López de Alda M. and Barcelo D., 2016. Occurrence of drugs of abuse in surface water from four Spanish river basins: Spatial and temporal variations and

RiBaTox – Full Set of Fact Sheets
35
environmental risk assessment. J. Hazard. Mat. 316: 134-142; https://doi.org/10.1016/j.jhazmat.2016.05.025
16. Ferre-Aracil, J., Valcarcel Y., Negreira N., López de Alda M., Barceló D., Cardona S.C. and Navarro-Laboulais J., 2016. Ozonation of hospital raw wastewaters for cytostatic compounds removal. Kinetic modelling and economic assessment of the process. Sci. Total Environ. 556: 70-79; https://doi.org/10.1016/j.scitotenv.2016.02.202
17. Esteban, S., Moreno Merino L., Matellanes R., Catalá M., Gorga M., Petrovic M., López de Alda M., Barceló D., Silva A., Durán J.J., López-Martínez J. and Valcárcel Y., 2016. Presence of endocrine disruptors in freshwater in the northern Antarctic Peninsula región. Environ. Res. 147: 179-192; https://doi.org/10.1016/j.envres.2016.01.034
18. Kosjek, T., Negreira N., Heath E., López de Alda M. and Barceló D., 2016. Biodegradability of the anticancer drug etoposide and identification of the transformation products. Environ. Sci. Pollut. Res. 23: 14706-14717; https://doi.org/10.1016/j.envres.2016.01.034
19. Giulivo, M., Lopez de Alda M., Capri E. and Barceló D., 2016. Human exposure to endocrine disrupting compounds: Their role in reproductive systems, metabolic syndrome and breast cancer. A review. Env. Res. 151: 251-264; https://doi.org/10.1016/j.envres.2016.07.011
20. Postigo, C., Cojocariu C.I., Richardson S.D., Silcock P.J. and Barcelo D., 2016. Characterization of iodinated disinfection by-products in chlorinated and chloraminated waters using Orbitrap based gas chromatography-mass spectrometry. Anal. Bioanal. Chem. 408: 3401-3411; https://doi.org/10.1007/s00216-016-9435-x
21. Isidori, M., Lavorgna M., Russo C., Kundi M., Zegura B., Novak M., Filipič M., Mišík M., Knasmueller S., López de Alda M., Barceló D., Žonja B., Česen M., Ščančar J., Kosjek T. and Heath E., 2016. Chemical and toxicological characterisation of anticancer drugs in hospital and municipal wastewaters from Slovenia and Spain. Environ. Pollut. 219: 275-287; https://doi.org/10.1016/j.envpol.2016.10.039
Keywords
Analytical methods, target analysis, high-sensitivity detection, water monitoring, biota, emerging contaminants
Related topics
Strategies for monitoring of chemicals and their effects FS044 Analytical strategies FS051 Standard operational procedures (SOPs) for individual organic compounds FS078 Standard operational procedures (SOPs) for organic compounds classes FS079 Syntheses of reference standards for SOLUTIONS FS005 Screening for 'known unknown' or 'suspect' pollutants FS052 Non-target screening and structure elucidation workflow FS003
Contact information
Miren López de Alda ([email protected]), Bozo Zonja ([email protected])
Water and Soil Quality Research Unit, IDAEA-CSIC, Barcelona, Spain

RiBaTox – Full Set of Fact Sheets
36
FP7 SOLUTIONS project - Fact Sheet 078
Name SOLUTIONS Tool or Service
FS078 Standard operational procedures (SOPs) for individual organic compounds
Description
1. Objective You have reached this Fact Sheet because you were looking for an analytical method to measure a specific environmental contaminant in water and/or biota. The objective of this fact sheet is to inform you on the
• kind of individual environmental organic pollutants, metabolites and transformation products for which detailed standard operational procedures (SOPs) have been prepared for their high-sensitivity determination in water and/or biota, and
• type of information that can be found in these SOPs.
2. Methodology
Detailed SOPs have been designed within the EC project SOLUTIONS in order to cover any aspect of an analytical method that is needed for reliable reproduction in any analytical chemical laboratory with the same instrumentation. SOPs have been divided into two sections: SOPs containing
• Master Methods, covered in FS079, where one can find all relevant general information pertaining to a certain method/group of compounds and
• Individual Compound Information Sheets (INCISE), this fact sheet, where essential and relevant information of individual compounds is presented for easy access to information.
SOPs developed for individual compounds were designed having in mind potential needs of future users. In order to make the search among the different compounds and methods as easy as possible, INCISEs were separated from the ‘master method’ to render quicker information for users. Therefore, apart from some general information regarding the compound, its limits of detection and quantification (LOD/LOQ) are reported together with general method information and the reference to the scientific publication where more detailed information can be found.
3. Application
The original template designed and a filled example corresponding to the analysis of the pharmaceutical tamoxifen in water can be found in the figures 1 and 2, respectively. These two files were distributed among the relevant SOLUTIONS partners (together with the ‘Master Method’ SOPs) for their input. The information compiled can be found in [Ref01].
Up to date, INCISEs for more than 250 compounds, covering the analysis of different pesticides, anti-cancer drugs, drugs of abuse, perfluorinated compounds, personal care products, organochlorine pesticides, polychlorinated biphenyls, musks, polycyclic hydrocarbons, polybrominated diphenyl ethers, and the alcohol metabolite ethyl sulfate in water, and different polybrominated flame retardants, perfluorinated compounds, organophosphate pesticides, pharmaceuticals, antibiotics, dechlorans, and a cocktail of micro-pollutants in biota, have been prepared. However, the idea is to expand this list of INCISEs for additional pollutants in water/biota as they become available from SOLUTIONS consortium scientific publications.

RiBaTox – Full Set of Fact Sheets
37
General Compound Information
Target Compound Compound name
Compound Family Family
Compound Class Class
CAS Number CAS
PubChem Number PubChem
SMILES Smiles
Parent Compound Yes/No
Human metabolite Yes/No
Transformation product
Yes/No
Matrix LOD LOQ ☒ Water ng/L ng/L ☐ Wastewater ☐ Surface water ☐ Drinking water ☐ Other (specify) ☐ Biota ng/g ng/g ☐ Fish sample (whole) ☐ Mussel ☐ Other (specify)
General Method Information
Extraction method ☐ Offline SPE ☐ Online SPE
☐ Other (please delete this and specify)
Clean-up method ☐ Offline SPE ☐ Online SPE
☐ Other (please delete this and specify)
Analytical method ☐ LC-MS/MS ☐ GC-MS/MS
☐ Other (please delete this and specify)
Calibration curve ☐ External ☐ Matrix matched ☒ Internal
Additional Information
Full Reference(s)
Figure 1. Template of ‘Individual compound information sheet’ (INCISE) agreed and distributed to SOLUTIONS partners (accompanied by the ‘Master Method’ template).

RiBaTox – Full Set of Fact Sheets
38
General Compound Information
Target Compound Tamoxifen
Compound Family Pharmaceuticals
Compound Class Anticancer drugs
CAS Number 10540-29-1
PubChem Number 2733526
SMILES CN(C)CCOc1ccc(cc1)/C(c2ccccc2)=C(/CC)c3ccccc3
Parent Compound Yes
Human metabolite No
Transformation product
No
Matrix LOD LOQ ☒ Water ng/L ng/L ☒ Wastewater 1.0 3.4 ☒ Surface water 0.7 2.3 ☐ Drinking water ☐ Other (specify) ☐ Biota ng/g ng/g ☐ Fish sample (whole) ☐ Mussel ☐ Other (specify)
General Method Information
Extraction method ☐ Offline SPE ☒ Online SPE ☐ Other
Clean-up method ☒ Offline SPE ☐ Online SPE ☐ Other
Analytical method ☒ LC-MS/MS ☐ GC-MS/MS ☐ Other
Calibration curve ☐ External ☐ Matrix matched ☒ Internal
Additional Information
Full Reference(s) 1. Negreira, N., Lopez de Alda, M. and Barcelo, D. (2013) On-line solid phase extraction-liquid chromatography-tandem mass spectrometry for the determination of 17 cytostatics and metabolites in waste, surface and ground water samples. J Chromatogr A 1280, 64-74.
2. Negreira, N., Lopez de Alda, M. and Barcelo, D. (2014) Cytostatic drugs and metabolites in municipal and hospital wastewaters in Spain: filtration, occurrence, and environmental risk. Sci. Total Environ. 497–498, 68–77.
Figure 2. Example of a completed INCISE corresponding to the analysis of the anti-cancer drug Tamoxifen in water.

RiBaTox – Full Set of Fact Sheets
39
References
1. Zonja, B., C. Postigo, J.C. Guillen Asensio, E. López García, S. Monllor Alcaraz and M. López de Alda, 2017. Guidelines for target and non-target analysis of emerging contaminants in water and biota. SOLUTIONS Deliverable D10.1 ED101.
Keywords
Analytical methods, target analysis, water monitoring, biota, emerging contaminants, Individual Compound Information Sheet.
Related topics
Analytical strategies FS051 Protocols for target analysis of emerging contaminants (including metabolites and transformation products) in water and biota FS001 Standard operational procedures (SOPs) for organic compounds classes FS079 Syntheses of reference standards for SOLUTIONS FS005 Screening for 'known unknown' or 'suspect' pollutants FS052 Non-target screening and structure elucidation workflow FS003 Strategies for monitoring of chemicals and their effects FS044
Contact information
Miren López de Alda ([email protected]) Damià Barceló ([email protected]) Bozo Zonja ([email protected])
Water and Soil Quality Research Unit, IDAEA-CSIC, Barcelona, Spain

RiBaTox – Full Set of Fact Sheets
40
FP7 SOLUTIONS project - Fact Sheet 079
Name SOLUTIONS Tool or Service
FS079 Standard operational procedures (SOPs) for organic compounds classes
Description
1. Objective You have reached this Fact Sheet because you are looking for an analytical method to measure a specific class of pollutants in water and/or biota. The objective of this factsheet is to inform on • the kind of information that can be found in the SOPs that have been prepared describing analytical methods
for high-sensitivity determination of different classes of environmental pollutants and • the classes of environmental pollutants covered.
2. Methodology
Detailed SOPs have been designed in order to cover any aspect of an analytical method that is needed for reliable reproduction in any laboratory with the same instrumentation. SOPs have been divided into two sections: SOPs containing
• Master Methods (this Fact Sheet), where one can find all relevant general information pertaining to a certain method/group of compounds, and
• Individual Compound Information Sheets (INCISE) where essential and relevant information of individual compounds is presented for easy lookup FS078.
The Master Method template was divided into various subsections offering detailed information on different experimental conditions and method performance parameters gathered from the project SOLUTIONS partners and/or their publications.
3. Application
The original template that was designed and a duly completed example corresponding to the analysis of anti-cancer drugs in water is presented in the figures 1 and 2, respectively. These two files were distributed among the relevant SOLUTIONS partners (together with the INCISE templates) for their input, and the information compiled can be found in [Ref01].
Up to date, nine analytical methods have been transformed to ‘Master Method’ SOPs for measuring organic environmental pollutants in water samples and seven for measurement of organic environmental pollutants in biological samples. Methods for water samples include pesticides, anti-cancer drugs, drugs of abuse, perfluorinated compounds, personal care products, organochlorine pesticides, polychlorinated biphenyls, musks, polycyclic hydrocarbons, polybrominated diphenyl ethers, and the alcohol metabolite ethyl sulphate. Methods for biological samples include polybrominated flame retardants, perfluorinated compounds, organophosphate pesticides, pharmaceuticals, antibiotics, dechlorans, and a multi-residue method for micropollutants.
The current number of INCISE (individual SOPs) includes more than 250 compounds. However, the idea is to extend these SOPs to novel analytical methods developed by the SOLUTIONS consortium as soon as they are made public via scientific publication.

RiBaTox – Full Set of Fact Sheets
41
Figure 1. Template of ‘Master Method’ agreed and distributed to SOLUTIONS partners.
Method general information
Running Title
Full Method Title
Method based on
☐ Offline SPE ☐ Online SPE ☐ Direct Injection ☐ Other (specify)
☐ LC ☐ GC ☐ Other (specify)
☐ MS ☐ MS/MS ☐ HRMS ☐ HRMS/MS ☐ Other (specify)
Number of compounds
Compounds
(in alphabetical order)
and SMILES
Safety
Additional Information
Add as many lines as needed
Sampling
Sample type ☐ Discrete sample ☐ Composite sample time integrated ☐ Composite sample flow integrated ☐ Other (specify)
Sampling technique ☐ Bucket ☐ Sampling vessel (specify) ☐ Scoops☐ Van Dorn sampler ☐ Pump (specify) ☐ Automatic sampler (specify) ☐ Large volume SPE ☐ Passive sampler (specify) ☐ Other (specify) ☐
Sampling norm applied Add reference here to the standard applied(e.g. ISO/5667-6 …)
In situ measurements required
☐ pH ☐ Conductivity ☐ Temperature ☐ Oxygen content
Sample container (number/ material/volume)
Sample pretreatment
Sample Preservation ☐ On-site (specify) ☐ In laboratory (specify)
Sample storage conditions
Maximum storage period
Equipment needed
Extraction
LC or GC (select as

RiBaTox – Full Set of Fact Sheets
42
appropriate)
Detector
Chromatography Column
Sample preparation (include main steps and conditions in the order they are performed)
Sample volume/amount (select as appropriate)
☐ mL ☐ mg
Storage conditions and time ☐ Not analysed ☐ Not applicable
Lyophilization ☐ Not used
Filtration
pH adjustment
Internal standard addition (conc)
☐ Not applicable
Extraction
Clean-up ☒ Not applicable
Chromatography (include main conditions as appropriate)
Mobile phase
Gradient
Flow rate
Injection volume ☐ Not applicable
Injection mode ☐ Not applicable
Inlet port temperature ☐ Not applicable
Type of carrier gas ☐ Not applicable
Column temperature ☐ Unspecified
Mass spectrometry (include main conditions as appropriate)
Ionization source
Ionization mode ☐ Positive ☐ Negative
Ion spray voltage
Source temperature
Source gases (curtain gas/GS1/GS2)
☐ Not applicable
Data acquisition mode
Analyte specific detection conditions
Analyte tRa (min)
Segb DPc (V) CEd (eV) MS/MS transition
IS Corresponding IS
SRM ratio (SRM1/SRM2)

RiBaTox – Full Set of Fact Sheets
43
Add as many lines as compounds
a Retention time b Segment c Declustering potential d Collision energy
Quality assurance
Recovery [%] ☐ Absolute ☐ Relative
Recovery Matrix ☐ wastewater influent
☐ wastewater effluent ☐ surface water ☐ Other (specify)
Results Conc1 Conc2 ConcX
Compd1 XX ± XX XX ± XX XX ± XX Add as many lines as compounds Compd2 XX ± XX XX ± XX XX ± XX
Recovery [%] ☐ Absolute ☐ Relative
Recovery Matrix ☐ wastewater influent
☐ wastewater effluent ☐ surface water ☐ Other (specify)
Results Conc1 Conc2 ConcX
Compd1 XX ± XX XX ± XX XX ± XX Add as many lines as compounds Compd2 XX ± XX XX ± XX XX ± XX
Add more Recovery Blocks (light green), if necessary using copy/paste
Repeatability (RSD) n = XX
Matrix ☐ wastewater influent
☐ wastewater effluent ☐ surface water ☐ Other (specify)
Results Conc1 Conc2 ConcX
Std. deviation [%] Compd1 XX ± XX XX ± XX XX ± XX Add as many lines as compounds Compd2 XX ± XX XX ± XX XX ± XX
Add more Repeatability Blocks (light green), if necessary using copy/paste
LOD/LOQ See INCISE
Data analysis
Software for data treatment:
Reference(s) (style Last Name, FN., …and Last author (Year) Title. Journal Journal Issue, pages)
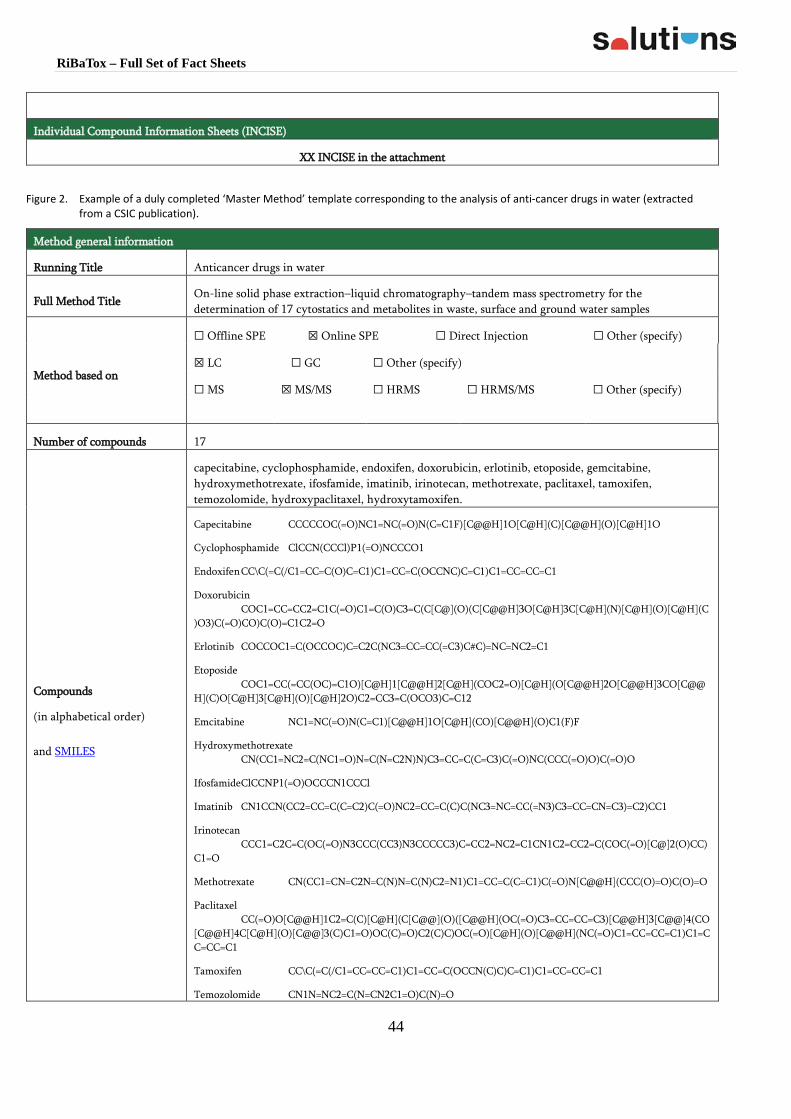
RiBaTox – Full Set of Fact Sheets
44
Individual Compound Information Sheets (INCISE)
XX INCISE in the attachment
Figure 2. Example of a duly completed ‘Master Method’ template corresponding to the analysis of anti-cancer drugs in water (extracted from a CSIC publication).
Method general information
Running Title Anticancer drugs in water
Full Method Title On-line solid phase extraction–liquid chromatography–tandem mass spectrometry for the determination of 17 cytostatics and metabolites in waste, surface and ground water samples
Method based on
☐ Offline SPE ☒ Online SPE ☐ Direct Injection ☐ Other (specify)
☒ LC ☐ GC ☐ Other (specify)
☐ MS ☒ MS/MS ☐ HRMS ☐ HRMS/MS ☐ Other (specify)
Number of compounds 17
Compounds
(in alphabetical order)
and SMILES
capecitabine, cyclophosphamide, endoxifen, doxorubicin, erlotinib, etoposide, gemcitabine, hydroxymethotrexate, ifosfamide, imatinib, irinotecan, methotrexate, paclitaxel, tamoxifen, temozolomide, hydroxypaclitaxel, hydroxytamoxifen.
Capecitabine CCCCCOC(=O)NC1=NC(=O)N(C=C1F)[C@@H]1O[C@H](C)[C@@H](O)[C@H]1O
Cyclophosphamide ClCCN(CCCl)P1(=O)NCCCO1
Endoxifen CC\C(=C(/C1=CC=C(O)C=C1)C1=CC=C(OCCNC)C=C1)C1=CC=CC=C1
Doxorubicin COC1=CC=CC2=C1C(=O)C1=C(O)C3=C(C[C@](O)(C[C@@H]3O[C@H]3C[C@H](N)[C@H](O)[C@H](C)O3)C(=O)CO)C(O)=C1C2=O
Erlotinib COCCOC1=C(OCCOC)C=C2C(NC3=CC=CC(=C3)C#C)=NC=NC2=C1
Etoposide COC1=CC(=CC(OC)=C1O)[C@H]1[C@@H]2[C@H](COC2=O)[C@H](O[C@@H]2O[C@@H]3CO[C@@H](C)O[C@H]3[C@H](O)[C@H]2O)C2=CC3=C(OCO3)C=C12
Emcitabine NC1=NC(=O)N(C=C1)[C@@H]1O[C@H](CO)[C@@H](O)C1(F)F
Hydroxymethotrexate CN(CC1=NC2=C(NC1=O)N=C(N=C2N)N)C3=CC=C(C=C3)C(=O)NC(CCC(=O)O)C(=O)O
Ifosfamide ClCCNP1(=O)OCCCN1CCCl
Imatinib CN1CCN(CC2=CC=C(C=C2)C(=O)NC2=CC=C(C)C(NC3=NC=CC(=N3)C3=CC=CN=C3)=C2)CC1
Irinotecan CCC1=C2C=C(OC(=O)N3CCC(CC3)N3CCCCC3)C=CC2=NC2=C1CN1C2=CC2=C(COC(=O)[C@]2(O)CC)C1=O
Methotrexate CN(CC1=CN=C2N=C(N)N=C(N)C2=N1)C1=CC=C(C=C1)C(=O)N[C@@H](CCC(O)=O)C(O)=O
Paclitaxel CC(=O)O[C@@H]1C2=C(C)[C@H](C[C@@](O)([C@@H](OC(=O)C3=CC=CC=C3)[C@@H]3[C@@]4(CO[C@@H]4C[C@H](O)[C@@]3(C)C1=O)OC(C)=O)C2(C)C)OC(=O)[C@H](O)[C@@H](NC(=O)C1=CC=CC=C1)C1=CC=CC=C1
Tamoxifen CC\C(=C(/C1=CC=CC=C1)C1=CC=C(OCCN(C)C)C=C1)C1=CC=CC=C1
Temozolomide CN1N=NC2=C(N=CN2C1=O)C(N)=O

RiBaTox – Full Set of Fact Sheets
45
Hydroxypaclitaxel CC1=C2C(C(=O)C3(C(CC4C(C3C(C(C2(C)C)(CC1OC(=O)C(C(C5=CC=C(C=C5)O)NC(=O)C6=CC=CC=C6)O)O)OC(=O)C7=CC=CC=C7)(CO4)OC(=O)C)O)C)OC(=O)C
Hydroxytamoxifen CC\C(=C(/C1=CC=CC=C1)C1=CC=C(OCCN(C)CO)C=C1)C1=CC=CC=C1
Safety Cytotoxic compounds require special safety precautions.
Additional Information
-
Sampling
Sample type ☐ Discrete sample ☐ Composite sample time integrated ☐ Composite sample flow integrated ☐ Other (specify)
Sampling technique ☐ Bucket ☐ Sampling vessel (specify) ☐ Scoops☐ Van Dorn sampler ☐ Pump (specify) ☐ Automatic sampler (specify) ☐ Large volume SPE ☐ Passive sampler (specify) ☐ Other (specify) ☐
Sampling norm applied -
In situ measurements required
☐ pH ☐ Conductivity ☐ Temperature ☐ Oxygen content
Sample container (number/ material/volume)
Sample pretreatment
Sample Preservation ☐ On-site (specify) ☐ In laboratory (specify)
Sample storage conditions
Maximum storage period
Equipment needed
Extraction SymbiosisTM Pico on-line SPE–LC device from Spark Holland (Emmen, The Netherlands)
LC or GC (select as appropriate)
Same as above
Detector 4000 QTRAP hybrid quadrupole linear ion trap mass spectrometer equipped with a Turbo Ion Spray source from Applied Biosystems-Sciex (Foster City, CA, USA)
Chromatography Column Purospher STAR RP-18e (125 mm × 2 mm, 5 µm particle size) from Merck (Darmstadt, Germany)
Sample preparation (include main steps and conditions in the order they are performed)
Sample volume/amount (select as appropriate)
5 ☒ mL ☐ mg
Storage conditions and time -20 oC, < 2 days ☐ Not analysed ☐ Not applicable
Lyophilization ☒ Not used
Filtration Cellulose acetate 0.45 μm
pH adjustment 2 (HCl 6M)

RiBaTox – Full Set of Fact Sheets
46
Internal standard addition (conc)
100 ng/L ☐ Not applicable
Extraction SPE with PLRP-s (10×2 mm,, 15–25 μm) cartridges from Spark Holland (Emmen, The Netherlands)
Clean-up ☒ Not applicable
Chromatography (include main conditions as appropriate)
Mobile phase (A) 0.1 % Formic acid in ultrapure water and (B) 0.1% Formic acid in methanol
Gradient 0–1 min, 5% (B); 2 min, 20% (B); 12 min, 80% (B; 25–30 min, 100% (B); 35–40 min, 5% (B)
Flow rate 0.2 mL/min
Injection volume ☒ Not applicable
Injection mode ☒ Not applicable
Inlet port temperature ☒ Not applicable
Type of carrier gas ☒ Not applicable
Column temperature 25 oC ☐ Unspecified
Mass spectrometry (include main conditions as appropriate)
Ionization source Electrospray
Ionization mode ☒ Positive ☐ Negative
Ion spray voltage 4000 V
Source temperature 700oC
Source gases (curtain gas/GS1/GS2)
10 V/40V/60V ☐ Not applicable
Data acquisition mode Selected Reaction Monitoring mode (SRM)
Analyte specific detection conditions
Analyte tRa (min)
Segb DPc (V) CEd (eV) MS/MS transition
IS Corresponding IS
SRM ratio (SRM1/SRM2)
Gemcitabine (GEM)
3.6 1 71 25 264.2 > 112.0
GEM – d3 267.0 > 115.0
6.8 ± 0.9 63 264.2 > 95.0 267.0 > 97.0
a Retention time b Segment c Declustering potential d Collision energy
Quality assurance
Recovery [%] ☐ Absolute ☒ Relative
Recovery Matrix ☒ wastewater influent
☐ wastewater effluent ☐ surface water ☐ Other (specify)

RiBaTox – Full Set of Fact Sheets
47
Results 20 ng/L 500 ng/L 5000 ng/L
Gemcitabine 96 ± 2 114 ± 2 110 ± 9 Add as many lines as compounds
Recovery [%] ☐ Absolute ☒ Relative
Recovery Matrix ☐ wastewater influent
☒ wastewater effluent ☐ surface water ☐ Other (specify)
Results 20 ng/L 500 ng/L 5000 ng/L
Gemcitabine 96 ± 15 93 ± 1 104 ± 5 Add as many lines as compounds
Add more Recovery Blocks (light green), if necessary using copy/paste
Repeatability (RSD) n = 5
Matrix ☒ wastewater influent
☐ wastewater effluent ☐ surface water ☐ Other (specify)
Results 20 ng/L 500 ng/L 5000 ng/L
Std. deviation [%] Gemcitabine 2.1 1.8 8.1 Add as many lines as compounds
Add more Repeatability Blocks (light green), if necessary using copy/paste
LOD/LOQ See INCISE
Data analysis
Software for data treatment: Analyst 1.4.2 Software from Applied Biosystems-Sciex (Foster City, CA, USA)
Reference(s) (style Last Name, FN., …and Last author (Year) Title. Journal Journal Issue, pages)
1. Negreira, N., Lopez de Alda, M. and Barcelo, D. (2013) On-line solid phase extraction-liquid chromatography-tandem mass spectrometry for the determination of 17 cytostatics and metabolites in waste, surface and ground water samples. J Chromatogr A 1280, 64-74.
2. Negreira, N., Lopez de Alda, M. and Barcelo, D. (2014) Cytostatic drugs and metabolites in municipal and hospital wastewaters in Spain: filtration, occurrence, and environmental risk. Sci. Total Environ. 497–498, 68–77.
Individual Compound Information Sheets (INCISE)
17 INCISE in the attachment
References
1. Zonja, B., C. Postigo, J.C. Guillen Asensio, E. López García, S. Monllor Alcaraz and M. López de Alda, 2017. Guidelines for target and non-target analysis of emerging contaminants in water and biota. SOLUTIONS Deliverable D10.1 ED101.
Keywords
Analytical methods, target analysis, water monitoring, biota, emerging contaminants, Master Method

RiBaTox – Full Set of Fact Sheets
48
Related topics
Analytical strategies FS051
Protocols for target analysis of emerging contaminants (including metabolites and transformation products) in water and biota FS001
Standard operational procedures (SOPs) for individual organic compounds FS078
Syntheses of reference standards for SOLUTIONS FS005
Screening for 'known unknown' or 'suspect' pollutants FS052
Non-target screening and structure elucidation workflow FS003
Contact information
Miren López de Alda ([email protected]) Damià Barceló ([email protected]) Bozo Zonja ([email protected])
Water and Soil Quality Research Unit, IDAEA-CSIC, Barcelona, Spain

RiBaTox – Full Set of Fact Sheets
49
FP7 SOLUTIONS project - Fact Sheet 005
Name SOLUTIONS Tool or Service
FS005 Syntheses of reference standards for SOLUTIONS
Description
1. Objective
You have reached this fact sheet because you are interested in reference samples that can be used as analytical standards. You are especially interested in such standards for organic (hazardous) compounds for which no such standards are (yet) available, such as for emerging pollutants.
For the SOLUTIONS project the analytical chemical laboratories involved analysed such compounds and – in order to calibrate their analyses – had a need for new analytical standards. As a consequence, several compounds were to be prepared by custom synthesis.
2. Methodology
The following metabolites (left) were synthesised; the synthesis was performed starting with the active molecules (between brackets):
N,N-diethyl-3-carboxybenzamide
(DEET Diethyltoluamide)
CAS#: 72236-23-8
N-Ethyl-2-(1-naphthalenyloxy)-propanamide
(Napropamide)
CAS#: 38641-90-6
2-Butyl-1-(4-carboxybenzyl)-1H-imidazole-5-carboxylic acid
(Eprosartan)
CAS#: 1027440-22-7
2,8-Diaminophenazine
(Diethylsafranine)
CAS#: 7704-40-7 was synthesized in a two-step synthesis, starting from phenazine-n-oxide.
The pure compounds considered were synthesized. Their structures have been confirmed by NMR-spectroscopy and mass-spectroscopy.
3. Application
The new standards were shipped to the respective analytical chemical laboratories in the SOLUTIONS project. They were successfully used as analytical standards for the analyses of their environmental samples, e.g. in the case studies of the Danube river basin FS042.
HOOCO
N
OO
NH
N
N
COOH
COOH
RiBaTox – Full Set of Fact Sheets
50
Ideas for the synthesis of standards for other compounds and structures (or metabolites) are welcomed.
References
1. www.Synchem.de/shop/
Keywords
Reference standards, metabolites, custom synthesis, active ingredients, hard to find compounds, biochemicals, building blocks
Related topics
Analytical strategies FS051 Protocols for target analysis of emerging contaminants in water, sediment and biota FS001 Standard operational procedures (SOPs) for individual organic compounds FS078 Standard operational procedures (SOPs) for organic compounds classes FS079 Screening for 'known unknown' or 'suspect' pollutants FS052 Non-target screening and structure elucidation workflow FS003 Joint Danube Survey 3 FS042 Priority pollutants in Iberian Rivers FS040 Strategies for monitoring of chemicals and their effects FS044
Contact information
Felix Jäger ([email protected]) Synchem, Felsberg / Altenburg, Germany

RiBaTox – Full Set of Fact Sheets
51
FP7 SOLUTIONS project - Fact Sheet 052
Name SOLUTIONS Tool or Service
FS052 Screening for 'known unknown' or 'suspect' pollutants
Description
1. Objective
You have reached this Fact Sheet because you are interested in identifying unknown substances with suspect screening, which is a subset of the non-target screening techniques described in the Fact Sheet ‘Non-target screening and structure elucidation workflow’ FS003.
Mass spectrometry (MS) is often used to analyse and determine the inventory of substances from various environmental samples. Target screening, the traditional approach using known reference standards available in house, requires a priori knowledge of the chemicals to be detected. In contrast, suspect and non-target screening cover more substances without necessarily having a reference standard available at the beginning of the analysis, and are thus becoming increasingly popular. In suspect screening, one looks for chemicals that one may ‘suspect’ to be present in an environmental sample (see Figure 1), such as certain substance classes or all chemicals covered by the REACH legislation. The knowledge about the possible chemicals can be used to search for these chemicals explicitly, which is often more efficient than full non-target screening. In non-target screening, no prior information is available, but rather detected non-target masses must be elucidated fully. This Fact Sheet covers suspect screening, whereas FS003 describes the full non-target screening workflow, of which suspect screening is an integral part.
Figure 1. Suspect screening in relation to target analysis (with reference standards) and non-target screening. Confirmation of suspects and targets is only possible if reference standards are available and purchased following tentative identification.
2. Methodology
Suspect screening is used to search for chemicals that are not available as analytical standards ‘in house’ (the ‘target’ compounds), but could reasonably be expected to be in the sample. Since the

RiBaTox – Full Set of Fact Sheets
52
term was coined, suspect screening has ranged from looking for very specific sets of suspect chemicals, such as country-specific pesticides or pharmaceuticals (‘screen smart’, e.g. [Ref01], [Ref02]), through to huge lists of chemicals (several thousands) covered by legislation. The Non-target Collaborative Trial run by the NORMAN Network showed in 2014 that suspect screening was popular amongst participants and on par with target screening to tentatively identify many non-target peaks. However, this trial also showed that there were more data sources for suspect lists than participants in the trial [Ref03].
The NORMAN Network addressed this by founding the NORMAN Suspect List Exchange in 2015 [Ref06] as a collection point for various ‘suspect lists’, together with details behind each list (e.g. publication or data source) and a list of the chemicals involved as InChIKeys, a chemical exchange format, for integration in the non-target screening workflow with MetFrag [Ref04], [Ref07]. A screen shot of the NORMAN Suspect List Exchange is shown in Figure 2.
Figure 2. Screenshot of the NORMAN Suspect List Exchange.
The key to successful suspect screening is firstly the exchange of information (as in the NORMAN Suspect List Exchange), then a high quality chemical curation to ensure the quality of the suspect list and then finally the combination with an advanced workflow for identification and confirmation. The workflow (and other possibilities) for SOLUTIONS is described further in FS003 and not covered here. Instead, this fact sheet will cover the exchange and curation of the chemical information in the suspect lists.
As shown in Figure 3 and discussed by Schymanski & Williams, 2017 [Ref05], there are many identifiers associated with different chemicals and not all of these chemical forms are suitable for screening with mass spectrometry. Instead, chemicals should be curated into the so-called ‘MS-ready’ form (middle of Figure 3) for mass spectrometry based screening, yet linked to the original identifiers to obtain the related metadata that is critical for successful identification with e.g. MetFrag [Ref04]. Workflows to perform this curation in the open programming language R are being developed within SOLUTIONS (package ‘RChemMass’, available upon request) in collaboration with SOLUTIONS and NORMAN members, along with Antony Williams from the US EPA CompTox Chemistry Dashboard [Ref08]). The lists from the NORMAN Suspect List Exchange are being curated and integrated within the Dashboard, to further improve the exchange of

RiBaTox – Full Set of Fact Sheets
53
information (see Figure 4); furthermore the Dashboard is already connected to MetFrag to be used within the non-target workflow FS003.
Figure 3. The challenge of chemical identifiers – valuable metadata for identification and interpretation exists for various forms of every chemical (see legend), whereas the mass spectrometer will only ‘see’ the corresponding MS-ready form. Reprinted with permission from [Ref05]. Copyright 2017 American Chemical Society.
Figure 4. List view in the CompTox Chemistry Dashboard, showing two NORMAN Suspect Exchange Lists.

RiBaTox – Full Set of Fact Sheets
54
3. Application
The resources mentioned above have all been integrated within the SOLUTIONS non-target screening workflow FS003. Suspect Screening was applied in the Rhine Case Study FS075 in collaboration with Stellan Fischer (KEMI), who has provided suspect lists for the NORMAN Suspect List Exchange, the CompTox Chemistry Dashboard and for fellow SOLUTIONS partners LMC and UFZ. The list provided to LMC and UFZ was curated with the MS-ready workflows in R and the Dashboard.
Suspect Screening has huge potential to help determining contaminants of emerging concern (and thus of interest) in environmental samples in a complementary matter to ‘Target analyses’ FS001 as part of ‘Analytical strategies’ FS051, in combination with comprehensive non-target screening workflows described in FS003.
References
1. Moschet, C., A. Piazzoli, H. Singer and J. Hollender, (2013). Alleviating the reference standard dilemma using a systematic exact mass suspect screening approach with liquid chromatography-high resolution mass spectrometry. Anal. Chem. 85(21): 10312-10320; https://doi.org/10.1021/ac4021598
2. Singer, H.P., A.E. Wössner, C.S. McArdell and K. Fenner, (2016). Rapid Screening for Exposure to "Non-Target" Pharmaceuticals from Wastewater Effluents by Combining HRMS-Based Suspect Screening and Exposure Modeling. Environ. Sci. Technol. 50(13): 6698-6707; https://doi.org/10.1021/acs.est.5b03332
3. Schymanski, E.L., H.P. Singer, J. Slobodnik, I.M. Ipolyi, P. Oswald, M. Krauss, T. Schulze, P. Haglund, T. Letzel, S. Grosse, N.S. Thomaidis, A. Bletsou, C. Zwiener, M. Ibáñez, T. Portolés, R. de Boer, M.J. Reid, M. Onghena, U. Kunkel, W. Schulz, A. Guillon, N. Noyon, G. Leroy, Ph. Bados, S. Bogialli, D. Stipaničev, P. Rostkowski and J. Hollender, (2015). Non-target screening with high-resolution mass spectrometry: critical review using a collaborative trial on water analysis. Anal. Bioanal. Chem. 407: 6237-6255; https://doi.org/10.1007/s00216-015-8681-7
4. Ruttkies, C., E.L. Schymanski, S. Wolf, J. Hollender and S. Neumann, (2016). MetFrag Relaunched: Incorporating strategies beyond in silico fragmentation, J. Cheminform. 8:3. DOI: 10.1186/s13321-016-0115-9; https://doi.org/10.1186/s13321-016-0115-9
5. Schymanski, E.L. and A.J. Williams (2017). Open Science for Identifying “Known Unknown” Chemicals. Environ. Sci. Technol. 51(10): 5357-5359; https://doi.org/10.1021/acs.est.7b01908
6. NORMAN Suspect List Exchange http://www.norman-network.com/?q=node/236 7. MetFrag http://c-ruttkies.github.io/MetFrag/ 8. US EPA CompTox Chemistry Dashboard https://comptox.epa.gov/dashboard/
Keywords
Suspect screening, non-target screening, mass spectrometry, structure elucidation, chemical curation, compound lists, identification
Related topics
Analytical strategies FS051 Protocols for target analysis of emerging contaminants in water, sediment and biota FS001 Standard operational procedures (SOPs) for individual organic compounds FS078

RiBaTox – Full Set of Fact Sheets
55
Standard operational procedures (SOPs) for organic compounds classes FS079 Syntheses of reference standards for SOLUTIONS FS005 Non-target screening and structure elucidation workflow FS003 Strategies for monitoring of chemicals and their effectsFS044
Contact information
E. Schymanski ([email protected]) J. Hollender ([email protected]) Eawag, Dübendorf, Switzerland
C. Ruttkies ([email protected]) S. Neumann ([email protected]) Leibniz Institute of Plant Biochemistry (IPB), Halle, Germany

RiBaTox – Full Set of Fact Sheets
56
FP7 SOLUTIONS project - Fact Sheet 003
Name SOLUTIONS Tool or Service
FS003 Non-target screening and structure elucidation workflow
Description
1. Objective
You have reached this Fact Sheet because you are interested in identifying unknown substances with non-target screening techniques.
Mass spectrometry (MS) is often used to analyse and determine the inventory of substances from rivers and other sampling sites. While target screening, the traditional approach, requires a priori knowledge of the chemicals to be detected, suspect and non-target screening cover more substances and are becoming increasingly popular. In suspect screening, chemicals such as all REACH chemicals are suspected to be present in an environmental sample and can be searched for explicitly. In non-target screening, no prior information is available.
2. Methodology
The non-target screening and structure elucidation workflow developed in SOLUTIONS enables a comprehensive chemical assessment of monitoring samples, especially water samples. Specifically, this workflow uses acquired chemical data (liquid chromatography-mass spectrometry data) as input and performs the data pre-processing and mass spectral interpretation steps involved in target, suspect and non-target screening. This workflow is designed to gather all information available from the analysed sample and combine this with the structure elucidation efforts to identify relevant emerging contaminants. The structure elucidation software includes meta-information specific for the environmental context, such as the number of references, patents, data sources, as well as compound filters and user-defined scores for candidate ranking including presence in suspect lists and information about the elemental composition or substructure occurrence. These user-defined scoring terms also allow the inclusion of toxicity information for candidate structures. Experimental information such as retention time and isotopic labelling can also be included. Together, these methods were used to identify non-target chemicals within the case studies on the rivers Rhine and Danube, and are applicable to many applications, e.g. screening for RBSP, surveillance monitoring, effect directed analysis.
The non-target screening workflow is shown in Figure 1. It was compiled to be as a flexible a workflow as possible, such that each user can tailor the workflow to their own needs. Thus, the focus was on a flexible combination of several ‘blocks‘ of a workflow that can be pieced together as needed, while each block can also be used alone and also accept alternative inputs. The focus has been on developing an open source workflow that uses external resources that are also open source or openly accessible wherever possible. The workflow is available in the programming language R and also comes with two graphical user interfaces. Additional functions in the workflow allow for the interpretation and plotting of the results, to assist in the selection of non-target substances for the structure elucidation efforts using the second part of the workflow, MetFrag.
The structure elucidation approach is shown in Figure 2. The MetFrag workflow starts by retrieving candidate structures, which are then fragmented using a bond dissociation approach. These fragments are then compared with the measured MS/MS spectrum to determine which candidate best matches the measured data. Additional criteria are also considered, including the number of references, data sources and/or patents for a substance (a high number of literature

RiBaTox – Full Set of Fact Sheets
57
references or the listing in many patents may imply the substance is of high use and thus more likely to be found in the environment). The use of retention time information is also possible, as well as element and substructure selection where available, as well as ways of ‘flagging’ structures potentially of interest. Furthermore, ‘suspect screening’ approaches were implemented to find candidates of interest in different lists of chemicals. User-defined scores were added to allow the inclusion of toxicity and other information. The information from hydrogen-deuterium exchange experiments was incorporated with three additional scores.
Figure 1. The non-target screening workflow, showing the interconnection between the various parts. The workflow parts are listed for every step (websites given below).
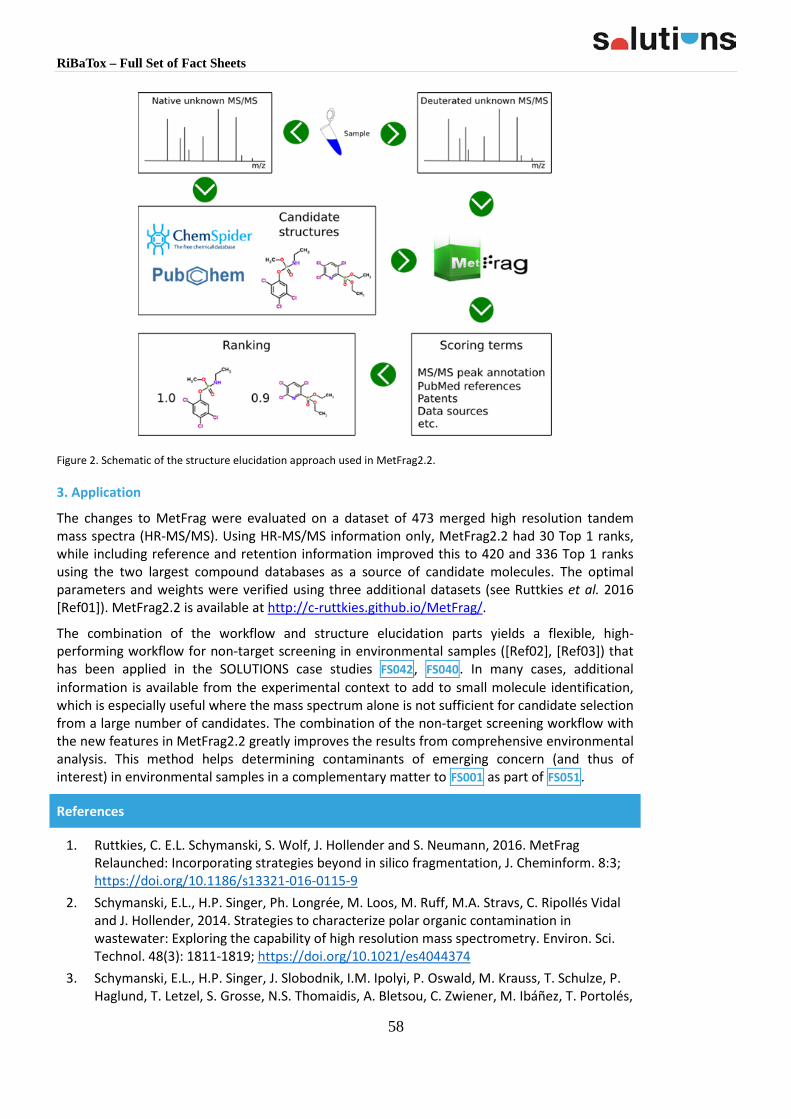
RiBaTox – Full Set of Fact Sheets
58
Figure 2. Schematic of the structure elucidation approach used in MetFrag2.2.
3. Application
The changes to MetFrag were evaluated on a dataset of 473 merged high resolution tandem mass spectra (HR-MS/MS). Using HR-MS/MS information only, MetFrag2.2 had 30 Top 1 ranks, while including reference and retention information improved this to 420 and 336 Top 1 ranks using the two largest compound databases as a source of candidate molecules. The optimal parameters and weights were verified using three additional datasets (see Ruttkies et al. 2016 [Ref01]). MetFrag2.2 is available at http://c-ruttkies.github.io/MetFrag/.
The combination of the workflow and structure elucidation parts yields a flexible, high-performing workflow for non-target screening in environmental samples ([Ref02], [Ref03]) that has been applied in the SOLUTIONS case studies FS042, FS040. In many cases, additional information is available from the experimental context to add to small molecule identification, which is especially useful where the mass spectrum alone is not sufficient for candidate selection from a large number of candidates. The combination of the non-target screening workflow with the new features in MetFrag2.2 greatly improves the results from comprehensive environmental analysis. This method helps determining contaminants of emerging concern (and thus of interest) in environmental samples in a complementary matter to FS001 as part of FS051.
References
1. Ruttkies, C. E.L. Schymanski, S. Wolf, J. Hollender and S. Neumann, 2016. MetFrag Relaunched: Incorporating strategies beyond in silico fragmentation, J. Cheminform. 8:3; https://doi.org/10.1186/s13321-016-0115-9
2. Schymanski, E.L., H.P. Singer, Ph. Longrée, M. Loos, M. Ruff, M.A. Stravs, C. Ripollés Vidal and J. Hollender, 2014. Strategies to characterize polar organic contamination in wastewater: Exploring the capability of high resolution mass spectrometry. Environ. Sci. Technol. 48(3): 1811-1819; https://doi.org/10.1021/es4044374
3. Schymanski, E.L., H.P. Singer, J. Slobodnik, I.M. Ipolyi, P. Oswald, M. Krauss, T. Schulze, P. Haglund, T. Letzel, S. Grosse, N.S. Thomaidis, A. Bletsou, C. Zwiener, M. Ibáñez, T. Portolés,

RiBaTox – Full Set of Fact Sheets
59
R. de Boer, M.J. Reid, M. Onghena, U. Kunkel, W. Schulz, A. Guillon, N. Noyon, G. Leroy, Ph. Bados, S. Bogialli, D. Stipaničev, P. Rostkowski and J. Hollender, (2015. Non-target screening with high-resolution mass spectrometry: critical review using a collaborative trial on water analysis. Anal. Bioanal. Chem. 407: 6237-6255; https://doi.org/10.1007/s00216-015-8681-7
Websites: enviMass https://github.com/blosloos/enviMass [30/09/2015] enviPat http://www.envipat.eawag.ch/index.php [30/01/2014] enviPick http://cran.r-project.org/web/packages/enviPick/index.html [30/09/2015] GenForm http://sourceforge.net/projects/genform/ [25/01/2016] MetFrag http://c-ruttkies.github.io/MetFrag/ [25/01/2016] MZmine2 http://mzmine.github.io/ [25/01/2016] Nontarget http://cran.r-project.org/web/packages/nontarget/index.html [30/09/2015] NORMAN Suspect List Exchange http://www.norman-network.com/?q=node/236 [30/09/2015] Proteowizard http://proteowizard.sourceforge.net/ [25/01/2016] RMassBank http://bioconductor.org/packages/release/bioc/html/RMassBank.html [25/01/2016] Xcms https://bioconductor.org/packages/release/bioc/html/xcms.html [25/01/2016]
Keywords
Non-target screening, mass spectrometry, structure elucidation, chemical assessment, identification
Related topics
Analytical strategies FS051 Protocols for target analysis of emerging contaminants in water, sediment and biota FS001 Standard operational procedures (SOPs) for individual organic compounds FS078 Standard operational procedures (SOPs) for organic compounds classes FS079 Syntheses of reference standards for SOLUTIONS FS005 Suspect screening FS052
Contact information
E. Schymanski ([email protected]), J. Hollender ([email protected]) Eawag, Dübendorf, Switzerland C. Ruttkies ([email protected]), S. Neumann ([email protected]) Leibniz Institute of Plant Biochemistry (IPB), Halle, Germany
RiBaTox – Full Set of Fact Sheets
60
1.4 Strategies for effect-based monitoring
FP7 SOLUTIONS project - Fact Sheet 002
Name SOLUTIONS Tool or Service
FS002 Effect-Based Tools (EBT)
Description
1. Objective
You have reached this Fact Sheet because you are interested in assessing biological effects of mixtures of contaminants in water bodies.
For water quality assessment, in vitro FS053 and low-complexity in vivo FS054 bioassays are versatile screening tools (Altenburger et al., 2015 [Ref01]). They provide information on the presence of environmental pollutants and can be linked to the mixture effects of pollutants found in samples (Escher and Leusch, 2012 [Ref02]). For the rapid detection of pollution – usually within the hour - by e.g. (accidental) spills, on-site biological early warning systems (BEWS, FS056) make use of changes in behaviour of living organisms (Kramer, 2009 [Ref03]).
Thus a versatile test battery of effect-based tools that cover a wide range of eco-toxicological endpoints is available. Focus is on cellular level assays including endpoints that describe the metabolism, as well as those that are indicative for certain modes of toxic action. These bioassays are complemented by low-complexity in vivo assays and BEWS including algae, daphnia, fish and bivalves.
2. Methodology in vitro Bioassays FS054 To interpret the information obtained with EBTs, we need to elucidate the meaning of the response. We can differentiate several steps inside a cell and within an organism and design bioassay indicative of these steps.
Endpoints indicative on metabolism in the toxicokinetic phase are not directly linked to toxicity but are indicators of the presence of chemicals and can be related to activation or detoxification.
The toxicodynamics describe the toxicity pathways that take place within the cell, starting with the initial molecular interaction of the chemical and its biological target through cellular defence mechanisms and other cell responses to observable toxic effect(s) or disease (Escher and Leusch, 2012 [Ref03]). Toxicity pathways are defined as “the cellular response pathways after chemical exposure expected to ultimately result in adverse health effects” (Collins et al., 2008 [Ref05]). As cellular responses (e.g., gene activation, production/depletion of proteins, changes in signalling) can occur via multiple steps, many overlaps and links exist between the many different toxicity pathways.
in vivo Bioassays FS053 They are linked to the adverse outcome pathway (AOP, Ankley et al., 2010 [Ref04]), which expands to organ, organism, population and ultimately ecosystem response.
To anchor bioassays within the AOP (Figure 1) we have to assign them to the appropriate step along the pathway, i.e. to the toxicokinetic stage, the molecular initiating event (MIE) and the cellular key events, including intermediate effects, cellular stress responses and ultimately cell

RiBaTox – Full Set of Fact Sheets
61
death. By using reporter gene assays we can single out specific processes and we can also quantify apical endpoints that integrate many modes of action.
Benchmarks and trigger values FS055 For surveillance monitoring applications, it becomes imperative to define thresholds, so called effect-based trigger values (EBT) that differentiate between good and poor water quality. While the similar types of bioanalytical test batteries are applied across different types of water from drinking water to sewage and even to sediments and biota, and accordingly there will different acceptable effects, ideally similar methods should applied for the derivation for EBT for different matrices and protection targets.
Biological early warning systems FS056 In contrast with the other assays discussed in this Fact Sheet, biological early-warning systems (BEWSs) are used to detect events like (accidental) spills, not to determine the average condition of the aquatic environment. These systems employ living organisms, usually exposed on site, to detect incidental pollution. BEWS make use of rapid biological responses, either changes in behaviour or in physiological parameters.
Requirements of a successful BEWS are a combination and integration of a suitable (preferably endemic) test organism, a method of detection-of changes in physiology or behaviour, and a means of signal processing, data evaluation and alarm generation. In BEWS the current behaviour/physiological status is compared with a past recording (e.g. of 1 h before). Once an abnormal situation is detected with sufficient confidence, an alarm is generated by the system.
Most BEWSs that are implemented in the field have been developed for monitoring freshwater/drinking water [Ref03]; most successful use either algae, daphnids, bivalves or fish.
3. Application
So far 54 individual bioassays are presently being tested for their suitability for water quality testing and definition of applicability domain (see FS054, Neale et al. 2017 [Ref09]). Any user will then be able to pick an appropriate battery of bioassays for their research or monitoring question.
The responses in the bioassays need to be quantified using dose-response assessment and will be translated into bioanalytical equivalents (Escher and Leusch, 2012 [Ref02]) to facilitate evaluation of spatial and temporal changes.
Application of the BEWS systems is mostly related to surface water monitoring. Implementation is often located at transboundary monitoring stations in river basins or at drinking water plants, testing intake waters.
References
1. Altenburger, R., Ait-Aissa, S., Antczak, P., Backhaus, T., Barcelo, D., Seiler, T.-B., Brion, F., Busch, W., Chipman, K., de Alda, M.L., de Aragao Umbuzeiro, G., Escher, B.I., Falciani, F., Faust, M., Focks, A., Hilscherova, K., Hollender, J., Hollert, H., Jager, F., Jahnke, A., Kortenkamp, A., Krauss, M., Lemkine, G.F., Munthe, J., Neumann, S., Schymanski, E.L., Scrimshaw, M., Segner, H., Slobodnik, J., Smedes, F., Kughathas, S., Teodorovic, I., Tindall, A.J., Tollefsen, K.E., Walz, K.-H., Williams, T.D., Van den Brink, P.J., van Gils, J., Vrana, B., Zhang, X. and Brack, W., 2015. Future water quality monitoring - Adapting tools to deal with mixtures of pollutants in water resource management. Sci. total environ. 512-513: 540-551; https://doi.org/10.1016/j.scitotenv.2014.12.057
2. Escher, B. and Leusch, F., 2012. Bioanalytical tools in water quality assessment. IWA
RiBaTox – Full Set of Fact Sheets
62
Publishing, London, UK; https://www.iwapublishing.com/books/9781843393689/bioanalytical-tools-water-quality-assessment
3. Kramer, K.J.M., 2009. Continuous Monitoring of Waters by Biological Early Warning Systems. In: Rapid chemical and biological techniques for water monitoring, C. Gonzalez, R. Greenwood & Ph. Quevauviller (Eds.), Wiley, Chichester, pp. 197-219.; https://doi.org/10.1002/9780470745427.ch3e
4. Ankley, G.T., Bennett, R.S., Erickson, R.J., Hoff, D.J., Hornung, M.W., Johnson, R.D., Mount, D.R., Nichols, J.W., Russom, C.L., Schmieder, P.K., Serrrano, J.A., Tietge, J.E. and Villeneuve, D.L., 2010. Adverse outcome pathways: a conceptual framework to support ecotoxicology research and risk assessment. Environ. Toxicol. Chem. 29(3): 730-741; https://doi.org/10.1002/etc.34
5. Collins, F., Gray, G.N. and Bucher, J.R., 2008. Transforming environmental health protection. Science, 319: 906-907; https://doi.org/10.1126/science.1154619
6. König, M., Escher, B.I., Neale, P.A., Krauss, M., Hilscherová, K., Novák, J., Teodorović, I., Schulze, T., Seidensticker, S., Kamal Hashmi, M.A., Ahlheim, J. and Brack W., 2017. Impact of untreated wastewater on a major European river evaluated with a combination of in vitro bioassays and chemical analysis. Environ. Pollut. 220: 1220-1230; https://doi.org/10.1016/j.envpol.2016.11.011
7. Neale, P.A., S. Ait-Aissa, W. Brack, N. Creusot, M.S. Denison, B. Deutschmann, K. Hilscherová, H. Hollert, M. Krauss, J. Novák, T. Schulze, Th.-B. Seiler, H. Serra, Y. Shao and B.I. Escher, 2015. Linking in vitro effects and detected organic micropollutants in surface water using mixture-toxicity modeling. Environ. Sci. Technol. 49(24): 14614-14624; https://doi.org/10.1021/acs.est.5b04083
8. Neale, P.A., Munz, N.A., Aїt-Aїssa, S., Altenburger, R., Brion, F., Busch, W., Escher, B.I., Hilscherová, K., Kienle, C., Novák, J., Seiler, T.B., Shao, Y., Stamm, C. and Hollender, J., 2017. Integrating chemical analysis and bioanalysis to evaluate the contribution of wastewater effluent on the micropollutant burden in small streams. Sci. Total Environ. 576: 785-795; https://doi.org/10.1016/j.scitotenv.2016.10.141
9. Neale, P.N., Altenburger, R., Aït-Aïssa, S., Brion, F., Busch, W., de Aragão Umbuzeiro, G., Denison, M.S., Du Pasquier, D., Hilscherová, K., Hollert, H., Morales, D.A., Novák, J., Schlichting, R., Seiler, T.B., Serra, H., Shao, Y., Tindall, A.J., Tollefsen, K.E., Williams, T.D. and Escher, B.I., 2017. Development of a bioanalytical test battery for water quality monitoring: Fingerprinting identified micropollutants and their contribution to effects in surface water. Water Res. 123: 734-750; https://doi.org/10.1016/j.watres.2017.07.016
Keywords
Effect-based tools, in vitro, in vivo, cell, reporter gene assay
Related topics
in vivo Tools FS053 in vitro Tools FS054 Benchmarks and trigger values FS055 Biological early warning systems (BEWS) FS056 Strategies for monitoring of chemicals and their effectsFS044

RiBaTox – Full Set of Fact Sheets
63
Contact information
Rolf Altenburger ([email protected]) and Beate Escher ([email protected]) Helmholtz Centre for Environmental Research – UFZ, Leipzig, Germany

RiBaTox – Full Set of Fact Sheets
64
FP7 SOLUTIONS project - Fact Sheet 053
Name SOLUTIONS Tool or Service
FS053 in vivo Bioassays
Description
1. Objective
You have reached this Fact Sheet because you are interested in assessing biological effects of a mixture of pollutants in water.
In vivo bioassays have a long tradition of application in effluent assessment and water quality monitoring studies (Escher and Leusch, 2012 [Ref02]). We recommend bioassays of bacteria, algae, daphnids and fish embryos for use in water quality monitoring (Neale et al. 2017b [Ref05]) because they are legally in vitro tests and do not pose ethical animal-welfare concerns.
2. Methodology
Whole organism assays indicative of apical effects, such as algal growth inhibition, Daphnia immobilization and fish embryo toxicity (FET), are more widely used for water quality assessment than cellular assays to date and can provide information about effects on mortality, growth, development and reproduction (Di Paolo et al. 2016 [Ref01], Wernersson et al. 2015 [Ref06]). They are comprehensive as they cover the effects from multiple toxicity pathways leading to the same apical endpoint. Consequently, whole organism assays integrate the mixture effects of all chemicals that are present in a sample, depending on their effect potency. Therefore, they constitute an important complement to the specific bioassays.
3. Application
In vivo tests have complemented the in vitro test battery applied in a series of case studies, where it was possible to show the pollution level along a river stretch (Neale et al. 2015 [Ref03]) and around wastewater treatment plants (Neale et al. 2017a [Ref04]).
References
1. Di Paolo, C., Ottermanns, R., Keiter, S., Ait-Aissa, S., Bluhm, K., Brack, W., Breitholtz, M., Buchinger, S., Carere, M., Chalon, C., Cousin, X., Dulio, V., Escher, B.I., Hamers, T., Hilscherova, K., Jarque, S., Jonas, A., Maillot-Marechal, E., Marneffe, Y., Nguyen, M.T., Pandard, P., Schifferli, A., Schulze, T., Seidensticker, S., Seiler, T.B., Tang, J., van der Oost, R., Vermeirssen, E., Zounkova, R., Zwart, N. and Hollert, H. (2016). Bioassay battery interlaboratory investigation of emerging contaminants in spiked water extracts - Towards the implementation of bioanalytical monitoring tools in water quality assessment and monitoring. Water Res. 104: 473-484; https://doi.org/10.1016/j.watres.2016.08.018
2. Escher, B.I. and Leusch, F.D.L. (2012) Bioanalytical tools in water quality assessment, IWA Publishing, London; https://www.iwapublishing.com/books/9781843393689/bioanalytical-tools-water-quality-assessment
3. Neale, P.A., Ait-Aissa, S., Brack, W., Creusot, N., Denison, M.S., Deutschmann, B., Hilscherová, K., Hollert, H., Krauss, M., Novák, J., Schulze, T., Seiler, T.-B., Serra, H., Shao, Y. and Escher, B.I. (2015). Linking in vitro effects and detected organic micropollutants in surface water using mixture-toxicity modeling. Environ. Sci. Technol. 49(24): 14614-14624; https://doi.org/10.1021/acs.est.5b04083
4. Neale, P.A., Munz, N.A., Ait-Aissa, S., Altenburger, R., Brion, F., Busch, W., Escher, B.I.,

RiBaTox – Full Set of Fact Sheets
65
Hilscherova, K., Kienle, C., Novak, J., Seiler, T.-B., Shao, Y., Stamm, C. and Hollender, J. (2017a) Integrating chemical analysis and bioanalysis to evaluate the contribution of wastewater effluent on the micropollutant burden in small streams. Sci. Total Environ. 576: 785-795; https://doi.org/10.1016/j.scitotenv.2016.10.141
5. Neale, P.N., Altenburger, R., Ait-Aissa, S., Brion, F., Busch, W., de Aragão Umbuzeiro, G., Denison, M.S., Du Pasquier, D., Hilscherova, K., Hollert, H., Morales, D.A., Novac, J., Schlichting, R., Seiler, T.-B., Serra, H., Shao, Y., Tindall, A.J., Tollefsen, K.E., Williams, T.D. and Escher, B.I. (2017b). Development of a bioanalytical test battery for water quality monitoring: Fingerprinting identified micropollutants and their contribution to effects in surface water. Water Res. 123: 734-750; https://doi.org/10.1016/j.watres.2017.07.016
6. Wernersson, A.-S., Carere, M., Maggi, C., Tusil, P., Soldan, P., James, A., Sanchez, W., Dulio, V., Broeg, K., Reifferscheid, G., Buchinger, S., Maas, H., Van Der Grinten, E., O’Toole, S., Ausili, A., Manfra, L., Marziali, L., Polesello, S., Lacchetti, I., Mancini, L., Lilja, K., Linderoth, M., Lundeberg, T., Fjällborg, B., Porsbring, T., Larsson, D.J., Bengtsson-Palme, J., Förlin, L., Kienle, C., Kunz, P., Vermeirssen, E., Werner, I., Robinson, C.D., Lyons, B., Katsiadaki, I., Whalley, C., den Haan, K., Messiaen, M., Clayton, H., Lettieri, T., Carvalho, R.N., Gawlik, B.M., Hollert, H., Di Paolo, C., Brack, W., Kammann, U. and Kase, R. (2015). The European technical report on aquatic effect-based monitoring tools under the water framework directive. Environ. Sci. Europe 27(7): 1-11; https://doi.org/10.1186/s12302-015-0039-4
Keywords
Effect-based methods, bioanalytical tools, Water Framework Directive, mode of action
Related topics
Effect-Based Tools (EBT) FS002 in vivo Tools FS053 Effect-based triggers FS055 Biological early warning systems (BEWS) FS056 Strategies for monitoring of chemicals and their effectsFS044
Contact information
Rolf Altenburger ([email protected]) Beate Escher ([email protected]) Helmholtz Centre for Environmental Research – UFZ, Leipzig, Germany

RiBaTox – Full Set of Fact Sheets
66
FP7 SOLUTIONS project - Fact Sheet 054
Name SOLUTIONS Tool or Service
FS054 in vitro Bioassays
Description
1. Objective
You have reached this Fact Sheet because you are interested in assessing biological effects of a mixture of pollutants in water.
In SOLUTIONS, a battery of in vitro bioassays based on human and fish cell lines and whole organism assays using bacteria, algae, daphnids and fish embryos was assembled for use in water quality monitoring (Neale et al. 2017b [Ref10]).
In vivo bioassays have a long tradition of application in effluent assessment and water quality monitoring studies (Escher and Leusch, 2012 [Ref03]). In contrast, in vitro cellular bioassays have mainly been applied to assess technical water treatment processes, such as sewage treatment (Prasse et al. 2015 [Ref11]), advanced water treatment (Leusch and Snyder, 2015 [Ref06]) and drinking water treatment (Neale et al. 2012 [Ref08]). In most applications, in vitro bioassays are not being used as a direct link to the ecological health of aquatic organisms, but rather as a complementary analytical tool to detect and quantify chemicals via their effects within environmental mixtures.
The selection of in vitro bioassays was guided by the principles of adverse outcome pathways (Ankley et al. 2010 [Ref01]) in order to cover relevant steps in toxicity pathways known to be triggered by environmental water samples (Escher et al. 2014 [Ref04]). Cellular effects are key parts of adverse outcome pathways (Ankley et al. 2010 [Ref01]), with the studied bioassays covering induction of xenobiotic metabolism, receptor-mediated effects, reactive modes of action, induction of adaptive stress response pathways and cell viability. To interpret the information obtained with in vitro bioassays, we need to elucidate the meaning of the response. We can differentiate several steps inside a cell and within an organism and design bioassay indicative of these steps (Figure 1). As specific and selective reporter gene assays will not capture all relevant modes of action, it is important to complement these endpoints with whole organism assays indicative of apical effects and to ensure that the bioassay battery covers different events/steps in selected toxicity pathways (see in vivo bioassays FS053)

RiBaTox – Full Set of Fact Sheets
67
Figure 1. The types of in vitro assays used in SOLUTIONS and their location along the adverse outcome pathway.
2. Methodology
Endpoints indicative on metabolism in the toxicokinetic phase are not directly linked to toxicity but are indicators of the presence of chemicals and can be related to activation or detoxification.
The toxicodynamics describe the toxicity pathways that take place within the cell, starting with the initial molecular interaction of the chemical and its biological target through cellular defence mechanisms and other cell responses to observable toxic effect(s) or disease (Escher and Leusch, 2012 [Ref03]). Toxicity pathways are defined as “the cellular response pathways after chemical exposure expected to ultimately result in adverse health effects” (Collins et al. 2008 [Ref02]). As cellular responses (e.g., gene activation, production/depletion of proteins, changes in signalling) can occur via multiple steps, many overlaps and links exist between the many different toxicity pathways.
Only a combination of diverse in vitro assays that cover different steps of the toxicity pathway will give a comprehensive view on the pollution level of surface water. Ideally, a bioanalytical test battery for water quality monitoring should be motivated by effects found typically in water and include assays covering a wide range of environmentally relevant modes of action and different stages of cellular toxicity pathways (Figure 1). To narrow down the large number of available bioassays to a smaller list of indicator bioassays, a balance must be struck between the desire to cover all possible effects and practicability issues. Broad coverage of modes of action, inclusion of the contributions from all chemicals and relevance for ecological health. Practicability, assay robustness, applicability for less specialized laboratories and the possibility to run the assays in a high-throughput mode for low-volume tests were further considered (Escher and Leusch, 2012 [Ref03]).
3. Application The in vitro test battery was applied in a series of case studies, where it was possible to show the pollution level along a river stretch (Neale et al. 2015 [Ref07]), around wastewater treatment plants (Neale et al. 2017a [Ref09]) and close to inflows of untreated wastewater (König et al. 2017 [Ref05]). In general we found estrogenic effects and anti-estrogenic effects as markers of treated and untreated wastewater and could calculate the contribution of wastewater streams to surface water and assess the overall water quality (see Effect-based triggers FS055).

RiBaTox – Full Set of Fact Sheets
68
References
1. Ankley, G.T., Bennett, R.S., Erickson, R.J., Hoff, D.J., Hornung, M.W., Johnson, R.D., Mount, D.R., Nichols, J.W., Russom, C.L., Schmieder, P.K., Serrrano, J.A., Tietge, J.E. and Villeneuve, D.L. (2010). Adverse outcome pathways: a conceptual framework to support ecotoxicology research and risk assessment. Environ. Toxicol. Chem. 29(3): 730-741; https://doi.org/10.1002/etc.34
2. Collins, F., Gray, G.N. and Bucher, J.R. (2008) Transforming environmental health protection. Science 319, 906-907; https://doi.org/10.1126/science.1154619
3. Escher, B. and Leusch, F. (2012). Bioanalytical tools in water quality assessment, IWA Publishing, London, UK; https://www.iwapublishing.com/books/9781843393689/bioanalytical-tools-water-quality-assessment
4. Escher, B.I., Allinson, M., Altenburger, R., Bain, P., Balaguer, P., Busch, W., Crago, J., Humpage, A., Denslow, N.D., Dopp, E., Hilscherova, K., Kumar, A., Grimaldi, M., Jayasinghe, B.S., Jarosova, B., Jia, A., Makarov, S., Maruya, K.A., Medvedev, A., Mehinto, A.C., Mendez, J.E., Poulsen, A., Prochazka, E., Richard, J., Schifferli, A., Schlenk, D., Scholz, S., Shiraishi, F., Snyder, S., Su, G., Tang, J., van der Burg, B., van der Linden, S., Werner, I., Westerheide, S.D., Wong, C.K.C., Yang, M., Yeung, B., Zhang, X. and Leusch, F.D.L. (2014). Benchmarking organic micropollutants in wastewater, recycled water and drinking water with in vitro bioassays. Environ. Sci. Technol. 48: 1940-1956; https://doi.org/10.1021/es403899t
5. König, M., Escher, B.I., Neale, P.A., Krauss, M., Hilscherová, K., Novák, J., Teodorović, I., Schulze, T., Seidensticker, S., Kamal Hashmi, M.A., Ahlheim, J. and Brack, W. (2017) Impact of untreated wastewater on a major European river evaluated with a combination of in vitro bioassays and chemical analysis. Environ. Pollut. 220: 1220-1230; https://doi.org/10.1016/j.envpol.2016.11.011
6. Leusch, F.D.L. and Snyder, S.A. (2015). Bioanalytical tools: half a century of application for potable reuse. Environ. Sci. Water Res. Technol. 1: 606-621; https://doi.org/10.1039/C5EW00115C
7. Neale, P.A., Ait-Aissa, S., Brack, W., Creusot, N., Denison, M.S., Deutschmann, B., Hilscherová, K., Hollert, H., Krauss, M., Novák, J., Schulze, T., Seiler, T.-B., Serra, H., Shao, Y. and Escher, B.I. (2015). Linking in Vitro Effects and Detected Organic Micropollutants in Surface Water Using Mixture-Toxicity Modeling. Environ. Sci. Technol. 49(24): 14614-14624; https://doi.org/10.1021/acs.est.5b04083
8. Neale, P.A., Antony, A., Bartkow, M., Farre, M., Heitz, A., Kristiana, I., Tang, J.Y.M. and Escher, B.I. (2012). Bioanalytical assessment of the formation of disinfection by-products in a drinking water treatment plant. Environ. Sci. Technol. 46(18): 10317–10325; https://doi.org/10.1021/es302126t
9. Neale, P.A., Munz, N.A., Ait-Aissa, S., Altenburger, R., Brion, F., Busch, W., Escher, B.I., Hilscherova, K., Kienle, C., Novak, J., Seiler, T.-B., Shao, Y., Stamm, C. and Hollender, J. (2017a). Integrating chemical analysis and bioanalysis to evaluate the contribution of wastewater effluent on the micropollutant burden in small streams. Sci. Total Environ. 576: 785-795; https://doi.org/10.1016/j.scitotenv.2016.10.141
10. Neale, P.N., Altenburger, R., Ait-Aissa, S., Brion, F., Busch, W., de Aragão Umbuzeiro, G., Denison, M.S., Du Pasquier, D., Hilscherova, K., Hollert, H., Morales, D.A., Novac, J., Schlichting, R., Seiler, T.-B., Serra, H., Shao, Y., Tindall, A.J., Tollefsen, K.E., Williams, T.D. and Escher, B.I. (2017b). Development of a bioanalytical test battery for water quality monitoring: Fingerprinting identified micropollutants and their contribution to effects in surface water. Water Res. 123: 734-750; https://doi.org/10.1016/j.watres.2017.07.016

RiBaTox – Full Set of Fact Sheets
69
11. Prasse, C., Stalter, D., Schulte-Oehlmann, U. and Oehlmann, J. (2015). Spoilt for choice: A critical review on the chemical and biological assessment of current wastewater treatment technologies. Water Res. 87: 237-270; https://doi.org/10.1016/j.watres.2015.09.023
Keywords
Effect-based methods, bioanalytical tools, Water Framework Directive, mode of action
Related topics
Effect-Based Tools (EBT) FS002 in vivo Tools FS053 Effect-based triggers FS055 Biological early warning systems (BEWS) FS056 Strategies for monitoring of chemicals and their effectsFS044
Contact information
Rolf Altenburger ([email protected]) Beate Escher ([email protected]) Helmholtz Centre for Environmental Research – UFZ, Leipzig, Germany

RiBaTox – Full Set of Fact Sheets
70
FP7 SOLUTIONS project - Fact Sheet 055
Name SOLUTIONS Tool or Service
FS055 Benchmarks and trigger values
Description
1. Objective
You have reached this Fact Sheet because you are interested in assessing biological effects of a mixture of pollutants in water and what the effects you observe mean for the water quality, and how they compare to other water types (benchmarking).
Chemicals occur in complex mixtures in the aquatic environment, though current regulations typically focus on (a rather limited set of) single chemicals. Effect-based trigger values (EBT), based on bioanalytical equivalent concentrations (BEQ), are a way to include the mixture effects of chemicals in water quality assessment by defining an acceptable level of effect in a bioassay. The objective of the SOLUTIONS study was to develop scientifically sound and robust EBTs for water quality assessment. The EBTs will be anchored in the European Union (EU) Environmental Quality Standards (EQS). EBTs are developed for both in vitro and in vivo assays that cover a wide range of relevant effects for water quality.
2. Methodology
Effect-based methods are tools that can be applied to evaluate water quality. EBTs are developed for bioassays indicative of several specific modes of action, including hormone-receptor mediated effects, as well as assays indicative of adaptive stress responses and apical endpoints (e.g. growth, mortality). Freshwater annual average EQS (AA-EQS) values for 100 chemicals were collected from the ETOX database (2017 [Ref02]); the EU EQS were used preferentially over the Swiss Ecotox Centre EQS. Effect concentration (EC) data for the 100 chemicals were collected from the US EPA ToxCast Database (US EPA, 2015 [Ref03]), the peer reviewed literature and SOLUTIONS list of selected bioassays FS054. Bioassay-specific EBTs are derived by reading across from AA-EQS using a transparent algorithm that does not require any user assumptions or judgements about the data. A similar approach to deriving EBTs has been developed by Escher et al. 2015 [Ref01] using Australian water quality guidelines.
3. Application
Bioassay-specific Effect-Based Trigger values (EBTs) are key for the interpretation of results from water quality assessment. Importantly, the developed approach can be applied to any bioassay, provided there is sufficient effect data available. Further, if new Environmental Quality Standards become available, it will be possible to instantly update the EBT.
References
1. Escher, B.I., Neale, P.A. and Leusch, F.D. (2015). Effect-based trigger values for in vitro bioassays: Reading across from existing water quality guideline values. Water Res. 81: 137-148; https://doi.org/10.1016/j.watres.2015.05.049
2. ETOX (2017). ETOX: Information System Ecotoxicology and Environmental Quality Targets, Umweltbundesamt (UBA, Germany), https://webetox.uba.de/webETOX/index.do
3. US EPA (2015). Interactive Chemical Safety for Sustainability (ICSS) Dashboard V2. https://actor.epa.gov/dashboard/

RiBaTox – Full Set of Fact Sheets
71
Keywords
Effect-based trigger values, Water Framework Directive, Environmental Quality Standards
Related topics
Effect-Based Tools (EBT) FS002 in vivo Tools FS053 in vitro Tools FS054 Biological early warning systems (BEWS) FS056 Strategies for monitoring of chemicals and their effects FS044
Contact information
Rolf Altenburger ([email protected]) Beate Escher ([email protected]) Helmholtz Centre for Environmental Research – UFZ, Leipzig, Germany

RiBaTox – Full Set of Fact Sheets
72
FP7 SOLUTIONS project - Fact Sheet 056
Name SOLUTIONS Tool or Service
FS056 Biological early warning systems (BEWS)
Description
1. Objective
You have reached this Fact Sheet because you are interested in the principles and applications of biological early warning systems (BEWS). BEWS have recently been included in the WFD Common Implementation Strategy Guideline 19 on surface water chemical monitoring as complementary method ([Ref06]).
BEWS form a special class of biological effect tests: they aim at the rapid (usually <1 hour) detection of (accidental) pollution in the water column (spills), and if certain criteria are passed, send out an alarm signal. This alarm may trigger the collection of water samples, necessary to determine by chemical analysis the nature of the pollutant(s) as evidence and proof.
The common approach of (grab) sampling followed by chemical analysis is common practice throughout the EU, it may, however, not always provide sufficient information. E.g. it will fail to identify contaminants which are not included in the routine set of chemical analyses, it is usually infrequent, it may fail to identify sporadic discharges to the environment, and the time lag between sampling and the availability of the analytical result usually does not allow timely action to prevent further harm. Biological monitoring techniques make use of organisms that 'sense' the toxicant(s). It will depend on the nature of the compound, its environmental concentration and on the organism whether a (toxic effect) reaction is induced. In general, organisms tend to be sensitive to many more toxic compounds than analysed by analytical chemical methods in routine monitoring programmes. Organisms are wide-range sensors. Unfortunately, organisms will never be able to identify the compound(s), and their response is usually only quantitative. Their biological response will be a reaction to (the combination of) one or more of the pollutants from a wide range of chemical classes. BEWS tell you that something is wrong, not what is causing the effect. Biological early warning systems shall therefore be complementary to routine chemical analyses. BEWS fill the time gap between sampling and toxicological analysis: they provide a quantifiable response to a pollution incident within an hour, often within a half hour. BEWS have explicitly been developed to provide a rapid warning of the occurrence of contaminants at concentrations which could be of immediate threat to living organisms. They will react mainly to sudden changes in environmental conditions, as is the case of (non)-accidental discharges of toxicants into the water body. BEWS are automated, continuous (7/7d, 24/24h) monitors which employ an organism or biological material as a primary sensing element (Gruber and Diamond, 1988; Baldwin and Kramer, 1994) [Ref02], [Ref03].
2. Methodology
The basic principle of all BEWS is that suitable organisms are continuously exposed to the test water, either in situ or in line. The organism is the primary sensor. To allow for a fast response, a physiological or behavioural function of the organism has to be used as response parameter. This parameter must show a response to changing environmental conditions, notably to an increase in the concentration of one or more toxic compounds in the water. Behavioural responses that are used include for example: activity, locomotion, or escape behaviour. Physiological parameters include: respiration rate, gill ventilation frequency, bio-electric potential, and bio-luminescence [Ref02]. The response parameter is automatically and continuously recorded. This secondary sensing

RiBaTox – Full Set of Fact Sheets
73
element may be e.g. electrical, electro-magnetic, optical, electro- or opto-chemical. Finally the data is evaluated. In most systems the current input information is compared with information obtained in the past, e.g. one hour before. When the changes in biological response significantly pass a predefined criterion, the sophisticated software in the biological early warning system will detect this and mark it as an alarming condition, and an alarm will be initiated.
In the early 1970s the first BEWS systems used fish as sensing organism (drinking water research). Other organisms have been introduced, now spanning a wide range of classes: bacteria, algae, crustacea, bivalve molluscs and fish, leading to a range of systems to be proposed [Ref01], [Ref05]. As not all organisms are equally sensitive to a given compound (herbicides will affect algae, not so much mussels) it is of interest to deploy different organisms/systems: together they cover a wider range of sensitivities towards different chemicals, and thus be more complementary.
As with many instruments and techniques that work well in the laboratory environment not all proved robust enough to perform in the natural environment. As a result in practice today many European users prefer a combination of minimum two BEWS, often operating with green algae, Daphnia or mussels. Systems using fish as primary sensor, initially the predominant system used, tend to become less effective in European river waters due to the lower sensitivity of fish to many contaminants and the reduction of pollution over the years.
3. Application Typical users of BEWS are:
• Monitoring stations, that check the environmental condition in rivers, notably at transboundary river monitoring stations, e.g. (Rhine: Bimmen/Lobith (DE/NL); Meuse: Eijsden (NL); Danube: Jochenstein (DE));
• Drinking water companies that monitor the intake water for possible contamination; even monitoring of (chlorinated) tap-water for possible adverse (terrorist) action has been successfully demonstrated;
• Other use includes application in fundamental toxicological and/or animal behavioural research, steering of chlorination of cooling water (using bivalves).
Over the period 1969-2007 the Association of River Water Supply Companies of the river Rhine reported on the number of days the abstraction of river Rhine water was stopped as a result of the presence of hazardous substances (Figure 1) (RIWA, 2007; [Ref07]). Samples analysed identified e.g. endosulphan, styrene, chloronitrobenzene in the earlier years, in later years isoproturon was the main agent.

RiBaTox – Full Set of Fact Sheets
74
0
5
10
15
20
25
30
35
40
1965 1970 1975 1980 1985 1990 1995 2000 2005
days
clo
sed
year
Figure 1. Number of days/year that the drinking water company WRK-WCB stopped abstraction of drinking water from the River Rhine at Nieuwegein for the period 1969-2006 (RIWA, 2007, [Ref07])
In 2015 at the river Meuse water intake station of the water company WML (Waterleiding-maatschappij Limburg) at Beegden (NL) two independent BEWS (Mosselmonitor, using zebra mussels (Dreissena polymorpha) and Daphnia Toximeter) both generated an alarm. As a result ‘alarm’ water samples were collected and water abstraction was interrupted at WML and two other drinking water companies downstream for over 3 weeks. Chemical analysis of water samples by HPLC-UV-screening proved that about 100 µg/L pyrazole was causing the biological effects, a compound that was not analysed routinely. In 2017 the Dutch Ministry of Infrastructure and the Environment set the maximum concentration level for pyrazole in source water and in drinking water at 3 µg/L.
References
1. Gonzalez, C., R. Greenwood and Ph. Quevauviller (Eds.), 2009. Rapid chemical and biological techniques for water monitoring. Wiley, Chichester, pp. 419; http://onlinelibrary.wiley.com/book/10.1002/9780470745427
2. Baldwin, I.G. and K.J.M. Kramer, 1994. Biological early warning systems (BEWS). In: Biomonitoring of coastal waters and estuaries, K.J.M. Kramer (Ed.). CRC Press, Boca Raton, pp. 1-28; https://trove.nla.gov.au/version/36454592
3. Gruber, D.S. and J.M. Diamond (Eds), 1988. Automated biomonitoring: living sensors as environmental monitors. Ellis Horwood, Chichester, pp. 208
4. Kramer, K.J.M. and E.M. Foekema, 2001. The "Musselmonitor®" as biological early warning system: The first decade. In: Biomonitors and biomarkers as indicators of environmental change: A handbook; Vol. II; F.M. Butterworth, M.E. Gonsebatt-Bonaparte & A. Gunatilaka (Eds). Kluwer/Plenum, New York, pp. 59-87; https://link.springer.com/chapter/10.1007/978-1-4615-1305-6_4
5. Gerhardt, A. (Ed.), 2000. Biomonitoring of polluted water. Trans Tech Publ., Uetecon-Zürich, Switzerland, pp. 305; http://www.destechpub.com/product/biomonitoring-of-polluted-water/
6. European Communities, 2009. Common implementation strategy for the Water Framework Directive (2000/60/EC). Guidance Document No. 19. Guidance on surface water chemical monitoring under the Water Framework Directive. EC - Technical Report 2009-25, Luxembourg, pp. 222 (http://ec.europa.eu/environment/water/water-

RiBaTox – Full Set of Fact Sheets
75
framework/facts_figures/guidance_docs_en.htm). 7. RIWA, 2007. Annual report 2006, The Rhine. RIWA Association of River Water Supply
Companies, Nieuwegein, Netherlands, pp.180 (in Dutch); https://www.riwa-rijn.org/wp-content/uploads/2015/05/150_JR_2006_ne.pdf
Keywords
Early warning, BEWS, alarm, spill detection, biosensors
Related topics
Strategies for monitoring of chemicals and their effects FS044 Effect-Based Tools (EBT) FS002 in vivo tools FS053 in vitro tools FS054 Benchmarks and trigger values FS055
Contact information
Kees J.M. Kramer ([email protected])
Mermayde, Groet, Netherlands

RiBaTox – Full Set of Fact Sheets
76
1.5 Strategies for toxicant identification
FP7 SOLUTIONS project - Fact Sheet 045
Name SOLUTIONS Tool or Service
FS045 Strategies for the identification of toxicity drivers
Description
1. Objective
You have reached this Fact Sheet because you detected biological effects in water, sediment or biota samples (typically extracts thereof) with in vitro or in vivo bioassays or observed adverse effects probably of chemicals on aquatic organisms, populations or ecosystems. You are interested in the identification of chemicals causing these effects.
The identification of drivers of adverse effects in the environment is often crucial for the selection of efficient and cost-effective abatement options and helps in success control. This factsheet provides you with a brief characterization and criteria to select the most appropriate driver identification approach according to the information you have and the number of samples you deal with. After selecting one of the approaches you arrive at more detailed descriptions of these approaches based on the extensive experience gained in SOLUTIONS.
2. Methodology There are three general approaches for driver identification recommended by RiBaTox [Ref01]. They include:
• mass balances
• virtual effect-directed analysis (multivariate analysis)
• higher tier effect-directed analysis
Be aware that • driver identification can be only successful if actually individual chemicals and
combinations thereof drive a measurable effect. In cases where the complex mixture itself drives the effect, an assessment may be done only by effect-based monitoring FS002 for these toxic endpoints.
• the methods described here are typically based on enrichment in organic extracts. In both chemical analysis and effect-based monitoring FS002 enrichment is required to achieve sufficient detection limits. In effect-based monitoring enrichment is also required to account for chronic effects, uncertainties due to extrapolation of effects in standardized laboratory test systems to in situ conditions.
• methods based on organic extracts exclude metals and other inorganic toxicants. In case that these chemicals are suspicious to cause effects, targeted chemical analysis followed by effect/risk assessment is recommended.
Mass balances FS057 are typically the first step to design a monitoring campaign if you want to understand effects and their sources in individual samples or a set of samples. Mass balances rely on:
• a proper sampling strategy FS047
• quantitative effect-based monitoring FS002 using one or more bioassays

RiBaTox – Full Set of Fact Sheets
77
• quantitative chemical target analysis FS001 of candidate compounds that might be responsible for the detected effects
For the successful application of this approach one needs: • a hypothesis on candidate chemicals addressing the toxicological endpoint of interest • toxicological data for these candidates relevant for your endpoint of interest.
Examples may be:
• Analyzing effects to green algae together with common or region-specific herbicides (with available data on effect concentrations inhibiting algal growth, photosynthesis etc.) in order to find out whether these chemicals explain your effects.
• Analyzing estrogenicity by in vitro analysis of estrogen receptor binding together with known estrogenic chemicals (with known receptor binding potencies).
Virtual effect-directed analysis (vEDA) FS058 is based on multivariate statistical analysis to link effects to chemicals. This approach is an alternative to mass balances if one is lacking a hypothesis on chemicals causing the effect of interest and/or one is lacking effect concentrations of the candidate chemicals. vEDA relies on:
• a proper sampling strategy FS047 • quantitative effect-based monitoring FS002 using one or more bioassays or ecological
assessment FS059
• (semi-)quantitative chemical target FS051, suspect FS052 or non-target analysis FS003 of compounds/chemical signals are detectable
• multivariate statistics FS058 to correlate effects and chemical signals.
For the successful application of this approach one needs
• no hypothesis on candidate chemicals, no toxicity data of individual chemicals • a number of samples (typically more than 10, the more the better) which are screened
for effects and chemicals • samples that contain a similar range of compounds but vary in effect intensity and
chemical concentrations or chemical signal intensities
Examples may be:
• Analysis of a set of water, sediment or biota samples in a river basin or even at a larger scale for effects and contamination in order to find chemical signals correlating with biological effects
• Analysis of a time series of a wastewater effluent for effects and contamination • Observation of an ecological degradation in a river, and assuming toxic stress as a cause
of the effect. vEDA may help to correlate ecological effects to the occurrence of (groups of) chemicals
Higher tier effect-directed analysis (EDA) FS046 is an approach to identify toxicity drivers causing measurable effects in one or few samples. It is applicable to all matrices (water, sediment, biota tissues etc.). It is often applied if mass balances are not feasibly due to a lack of candidate toxicants and effect data, or after applying mass balances if effects could not be explained by candidate toxicants. In contrast to vEDA, EDA is designed to provide cause-effect relationships rather than statistical correlations. EDA relies on:
• a proper sampling strategy FS047
• quantitative effect-based monitoring FS002 using one or more bioassays

RiBaTox – Full Set of Fact Sheets
78
• a sequential approach involving biotesting FS002, fractionation FS046 and chemical analysis FS051 of toxic fractions
For the successful application of this approach you need • no hypothesis on candidate chemicals, no toxicity data of individual chemicals • sufficient amounts of your samples of interest
Many successful applications of EDA have been performed identifying individual chemicals causing effects in a large variety of samples. EDA is often the most conclusive but also the most time-consuming and expensive diagnosis tool to identify toxicants and it should be applied where the other tools fail.
The selection of the right tool is summarized according in the following scheme:
References
1. Brack, W., S. Ait-Aissa, R.M. Burgess, W. Busch, N. Creusot, C. Di Paolo, B.I. Escher, L.M. Hewitt, K. Hilscherova, J. Hollender, H. Hollert, W. Jonker, J. Kool, M. Lamoree, M. Muschket, S., Neumann, P. Rostkowski, C. Ruttkies, J. Schollee, E.L. Schymanski, T. Schulze, T.-B. Seiler, A.J. Tindall, G. de Aragao Umbuzeiro, B. Vrana, M. Krauss (2016). Effect-directed analysis supporting monitoring of aquatic environments – An in depth overview. Sci. Tot. Environ. 544: 1073-1118; https://doi.org/10.1016/j.scitotenv.2015.11.102
Keywords
effect-directed analysis, mass balances, tool selection, criteria
Related topics
Strategies for monitoring of chemicals and their effectsFS044 Effect-based monitoring FS002 Mass balances FS057 Virtual EDA FS058 Higher Tier Effect-Directed Analysis FS046
Contact information
Werner Brack ([email protected])
Helmholtz Centre for Environmental Research – UFZ, Leipzig, Germany

RiBaTox – Full Set of Fact Sheets
79
FP7 SOLUTIONS project - Fact Sheet 057
Name SOLUTIONS Tool or Service
FS057 Ecotoxicological mass balances
Description
1. Objective
You have reached this Fact Sheet because you detected biological effects in some water, sediment or biota samples (typically extracts thereof) with in vitro or in vivo bioassays and want to know the chemicals causing this effect. From chemical monitoring or from literature you identified some candidate drivers of this toxicity and want to know to which degree and with which individual contribution these compounds explain the measured toxicity.
Mass balance approaches are based on mixture toxicity modelling typically according to the concentration addition (CA) model. This model assumes that toxic components of a mixture may be replaced by each other according to the relative potencies of the mixture components. Strictly speaking, this model is only applicable for similarly acting compounds, while mixtures of dissimilarly acting toxicants are correctly modelled according to the independent action (IA) model (Backhaus & Faust, 2012 [Ref01]). CA is the model of choice for predicting specific effects of mixtures (estrogen-receptor binding, photosynthesis inhibition, etc.) but often also provides a good default prediction in atypical assays (immobilization of daphnids, inhibition of cell multiplication of algae, etc.) if no information on modes of action is available. CA is performed on the basis of effect concentrations, which are typically reported data to characterise the toxicity of a compound, while IA needs to be based on rarely available full dose-response-relationships.
Mass balances according to CA are based on the summation of environmental concentrations of the mixture components normalized to their individual effect concentrations compared to the enrichment or dilution of mixture that is required to achieve the effect of concern.
Figure 1. Scheme of mass balances. TU: Toxic Units, EC: Effect concentration for the selected effect level, REP: Relative potency compared to reference compound x, REF: Relative enrichment factor for the selected effect level, BEQ: Biological Equivalents

RiBaTox – Full Set of Fact Sheets
80
2. Methodology
Mass balances follow the scheme above (Figure 1).
Mass balance approaches to estimate the contribution of individual compounds and the mixture thereof to the toxicity of a complex environmental mixture (e.g. the contamination of a water body) involves several steps: • Enrichment of the compounds for bio- and chemical analysis. Since concentrations of
biologically active micropollutants in surface waters are typically low and the sensitivity of bioanalytical and analytical detectors may be limited, enrichment is required. This can be achieved on site with passive sampling FS039 or large-volume solid phase extraction (LVSPE) FS049 or in the laboratory with SPE from grab FS048 or event samples FS050. LVSPE has been demonstrated to be able to achieve sufficient enrichment, exhibit good recovery of effects as well as of a broad range of chemicals and can be on-site.
• Chemical target analysis FS001 of candidate toxicants. The list of chemicals analysed may focus on chemicals that are known or expected at the site of interest and/or on chemicals known to cause responses on the toxicological endpoint of concern. Thus, if, for example estrogen-receptor mediated effects are in the focus in a water body, the list of target analytes should include natural and synthetic steroidal hormones together with other ubiquitous endocrine disruptors such as nonylphenols. Analytical methods should be checked for their ability to detect the candidate compounds at or below the no-effect-level.
• Bioanalytical analysis in vitro FS054 or in vivo FS053. Water extracts are subjected to biotesting, dose-response-relationships are recorded and modelled and effect concentrations are determined. Effect concentrations for a specific effect level (EC50 or EC10) are expressed as relative enrichment factor (REF) comparing the nominal concentration in the test medium with the original water sample.
• Prediction of toxic potency of the mixture and the contribution of individual components from measured concentration (Figure 1). By normalising the concentration of compound i (ci) to its effect concentration (ECi) individual Toxic Units (TUs) are calculated that can be added according to the CA model to give a measure for the expected toxicity of the mixture (∑TUCHEM). For bioassays that involve a reference compound with a known toxic potency individual potency of a mixture component is expressed as Biological Equivalents based on chemical analysis (BEQCHEM) calculated as the product of the relative potency of a compound i (REPi) with its concentration in the mixture (ci). According to the CA model summation leads to ∑BEQCHEM.
• The biologically determined Toxic Units (TUBIO, Figure 1) equal the reciprocal of the REFs. For bioassays with biological activity that is expressed relative to a reference compound x as Biological Equivalents (BEQBIO), toxic potency is equals the quotient of the EC of the reference compound x and the REF of the sample.
• Comparison of TUBIO or BEQBIO with ∑TUCHEM respective ∑BEQCHEM provides a direct measure for the fraction of toxicity explained by analysed compounds. TUCHEM or BEQCHEM of individual components indicate their contribution, non-explained fractions may indicate additional compounds beyond the targeted candidate list, which require identification by higher tier Effect Directed Analysis (EDA) FS046. However, the decision whether toxicity is explained or additional efforts are required to identify more chemicals to fill toxicity gaps may be also the critical point of the method. Chemical analysis, bioanalysis and mixture modelling are prone to errors and uncertainties. These uncertainties need to be considered for this decision.
3. Application
Several successful application examples are available including mass balancing of endocrine

RiBaTox – Full Set of Fact Sheets
81
disruption in river water from the River Danube downstream of the city of Novi Sad (König et al., 2017 [Ref02]) and the assessment of the contribution of candidate compounds to endocrine disruption, photosynthesis inhibition and algal growth inhibition and to oxidative stress (Neale et al., 2017 [Ref03]).
References
1. Backhaus, T. and Faust, M., 2012. Predictive environmental risk assessment of chemical mixtures: a conceptual framework. Environ. Sci. Technol. 46: 2564-2573; https://doi.org/10.1021/es2034125
2. König, M., Escher, B.I., Neale P.A., Krauss, M., Hilscherová, K., Novák J., Teodorović, I., Schulze, T., Seidensticker, S., Hashmi, M.A.K., Ahlheim, J. and Brack, W., 2017. Impact of untreated wastewater on a major European river evaluated with a combination of in vitro bioassays and chemical analysis. Environ. Poll. 220: 1220-1230; https://doi.org/10.1016/j.envpol.2016.11.011
3. Neale, P.A., Munz, N.A., Aït-Aïssa, S., Altenburger, R., Brion, F., Busch, W., Escher, B.I., Hilscherová, K., Lienle, C., Novák. J., Seiler, T.-B., Shao, Y., Stamm, C. and Hollender, J., 2017. Integrating chemical analysis and bioanalysis to evaluate the contribution of wastewater effluent on the micropollutant burden in small streams. Sci. Tot. Environ. 576:785-795; https://doi.org/10.1016/j.scitotenv.2016.10.141
Keywords
concentration addition, candidate chemicals, target analysis, Biological Equivalents, Toxic Units
Related topics
Strategies for the identification of toxicity drivers FS045 Virtual EDA FS058 Higher Tier Effect-Directed Analysis FS046 Strategies for monitoring of chemicals and their effects FS044
Contact information
Werner Brack ([email protected])
Helmholtz Centre for Environmental Research – UFZ, Leipzig, Germany

RiBaTox – Full Set of Fact Sheets
82
FP7 SOLUTIONS project - Fact Sheet 058
Name SOLUTIONS Tool or Service
FS058 Virtual Effect-Directed Analysis
Description
1. Objective
You have reached this Fact Sheet because you detected biological effects in some water, sediment of biota samples (typically extracts thereof) with in vitro or in vivo bioassays and you have additional targeted and/or non-targeted analytical data available (typically full-scan high-resolution mass spectral data). You want to analyse your dataset using multivariate statistics to unravel latent relationships between the effects and the chemicals. The goal of this lower-tier Virtual Effect-Directed Analysis (Virtual EDA) is the extraction of relevant information out of large datasets and to support the formulation of hypotheses for further investigations such as Higher Tier EDA FS046.
Lower-tier Virtual EDA offers a tool to reduce the complexity of an environmental sample by ‘virtual fractionation’ applying multivariate statistical techniques to correlate the targeted or non-targeted chemical signals with observed effects in bioassays [Ref01], [Ref02], [Ref03]. Virtual EDA can be applied to a large number of different samples that were for example collected during a large-scale survey or time series of samples (e.g. of waste water plant effluents). Thus, it can be based on existing chemical and effect monitoring data.
2. Methodology
Lower tier Virtual EDA follows the scheme in figure 1:
Figure 1. Scheme of the Virtual Effect Directed Analysis (EDA)
Acquisition of data for Virtual EDA Virtual EDA applies data from effect-based monitoring and (non-)targeted chemical analyses of the same samples. If feasible, full concentration-effect relationships in vitro FS054 and in vivo FS053 should be obtained and full scan mass spectra with gas- or liquid-chromatography coupled to (high resolution) mass spectrometry FS051 should be acquired in order to achieve a complete analysis of the samples.
Data pre-processing Experimental and empirical chemical and biological analysis is often prone to data gaps for one or

RiBaTox – Full Set of Fact Sheets
83
more variables. The presence of missing values reduces the statistical power and impedes the application of many statistical methods that require a complete data set [Ref05]. Algorithmic problems due to data gaps were demonstrated for different multivariate statistical models (e.g. Principal Component Analysis (PCA) and Partial Least Squares Analysis (PLS)) [Ref06], [Ref07]. Furthermore, those datasets show frequently a variability of the values in the order of magnitudes biasing the results of the statistical evaluation. Hence, missing data imputation and data normalisation should be considered [Ref05], [Ref08], [Ref09].
General presumptions for the applicability of multivariate statistics in Virtual EDA Input data for Virtual EDA may contain hundreds or thousands of chemical signals/compounds and different ecotoxicological endpoints).
In order to select an appropriate multivariate statistical algorithm for the Virtual EDA, the following prerequisites should be considered: • Applicability to high dimensional data sets with predictors (X-values) >> responses (Y-values) • Function approximation and estimation of the best-fit model by for example (integrated)
cross-validation or bootstrapping • Algorithm is not vulnerable to over-fitting • Functions for the stepwise reduction of the data complexity (virtual fractionation) • Straightforward interpretation of the results
Virtual EDA based on PLS Partial Least Squares is a good choice to perform Virtual EDA. It was developed for the analysis of datasets with large numbers of variables exceeding the number of observations [Ref10], i.e. large number of predictors (X-values) and small number of responses (Y-values), and strongly co-varying, co-linear data matrices [Ref11]. The major goal of PLS analysis is discrimination of variables co-varying with the response from those not co-varying. PLS has been demonstrated to provide meaningful correlation of chemical fingerprints of exhaust particle extracts and mutagenicity, but also of biotic indicators of surface water quality and landscape conditions [Ref01], [Ref03], [Ref12].
Complexity reduction and virtual fractionation Virtual EDA reduces the complexity of chemical information to a smaller number of compounds co-varying with the adverse effects as observed in the bioassays by exclusion of variables that are not co-varying in the statistical model. Different statistical algorithms are available for variable selection [Ref13], [Ref14], [Ref15], [Ref16]. A widely used algorithm is ‘variable importance in projection’ (VIP) [Ref17]. The VIP is a threshold value to separate variables having impact on the regression from those having no influence.
Starting with a PLS model including all variables, the complexity of the model is sequentially reduced by eliminating variables with an influence on projection below the VIP threshold. The reduced X matrix is subjected to the next PLS modelling step – the so called virtual fractionation [Ref01], [Ref03]. The goal is the establishment of models with a maximum predictive power [Ref18] and a minimum of variables (peaks) involved [Ref03].
3. Application Virtual EDA is application is promising for: • Specific and reactive toxicity in vitro (e.g., receptor-mediated response) FS054, or in vivo (e.g.
growth inhibition of algae or developmental toxicity in fish embryos) FS053. • A sufficient number of samples with expected overlap of composition and common effects,
however, a certain variance of values (considerably larger than the uncertainty of the chemical and biological effect data). In the ideal case the samples contain the same toxicants

RiBaTox – Full Set of Fact Sheets
84
but in significantly different concentration ratios.
An example for the successful application is the study of Hug et al. [Ref03]. They analysed sequential samples of a wastewater treatment plant effluent by LC-HRMS and the Ames Fluctuation assay. Virtual EDA reduced the peak list for identification by 86% using virtual fractionation with PLS and VIP variable selection. Candidate compounds co-varying with mutagenicity were assessed for the mutagenic potential and some were identified indicative mutagens from industrial sources.
References
1. Eide, I., G. Neverdal, B. Thorvaldsen, B. Grung and O.M. Kvalheim, 2002. Toxicological evaluation of complex mixtures by pattern recognition: correlating chemical fingerprints to mutagenicity. Environ. Health Perspect. 110: 985-988; https://www.ncbi.nlm.nih.gov/pubmed/12634129
2. Eide, I., G. Neverdal, B. Thorvaldsen, R. Arneberg, B. Grung and O.M. Kvalheim, 2004. Toxicological evaluation of complex mixtures: fingerprinting and multivariate analysis. Environ. Toxicol. Pharmacol. 18: 127-133; https://doi.org/10.1016/j.etap.2004.01.011
3. Hug, C., M. Sievers, R. Ottermanns, H. Hollert, W. Brack and M. Krauss, 2015. Linking mutagenic activity to micropollutant concentrations in wastewater samples by partial least square regression and subsequent identification of variables, Chemosphere, 138: 176-182; https://doi.org/10.1016/j.chemosphere.2015.05.072
4. Brack, W., S. Ait-Aissa, R.M. Burgess, W. Busch, N. Creusot, C. Di Paolo, B.I. Escher, L. Mark Hewitt, K. Hilscherova, J. Hollender, H. Hollert, W. Jonker, J. Kool, M. Lamoree, M. Muschket, S. Neumann, P. Rostkowski, C. Ruttkies, J. Schollee, E.L. Schymanski, T. Schulze, T.-B. Seiler, A.J. Tindall, G. De Aragão Umbuzeiro, B. Vrana and M. Krauss, 2016. Effect-directed analysis supporting monitoring of aquatic environments — An in-depth overview. Sci. Total Environ. 544: 1073-1118; https://doi.org/10.1016/j.scitotenv.2015.11.102
5. Liao, S.G., Y. Lin, D.D. Kang, D. Chandra, J. Bon, N. Kaminski, F.C. Sciurba and G.C. Tseng, 2014. Missing value imputation in high-dimensional phenomic data: imputable or not, and how? BMC Bioinformatics, 15: 346; https://doi.org/10.1186/s12859-014-0346-6
6. Nelson, P.R.C., J.F. MacGregor and P.A. Taylor, 2006. The impact of missing measurements on PCA and PLS prediction and monitoring applications. Chemometrics Intellig. Lab. Syst., 80: 1-12; https://doi.org/10.1016/j.chemolab.2005.04.006
7. Nelson, P.R.C., P.A. Taylor and J.F. MacGregor, 1996. Missing data methods in PCA and PLS: Score calculations with incomplete observations, Chemometrics Intellig. Lab. Syst., 35: 45-65; https://doi.org/10.1016/S0169-7439(96)00007-X
8. Hrydziuszko, O. and M. Viant, 2012. Missing values in mass spectrometry based metabolomics: an undervalued step in the data processing pipeline. Metabolomics, 8: 161-174; https://doi.org/10.1007/s11306-011-0366-4
9. Di Guida, R., J. Engel, J.W. Allwood, R.J.M. Weber, M.R. Jones, U. Sommer, M.R. Viant and W.B. Dunn, 2016. Non-targeted UHPLC-MS metabolomic data processing methods: a comparative investigation of normalisation, missing value imputation, transformation and scaling. Metabolomics, 12: 1-14; https://doi.org/10.1007/s11306-016-1030-9
10. Kettaneh-Wold, N., 1992. Analysis of mixture data with partial least squares. Chemometrics Intellig. Lab. Syst., 14: 57-69; https://doi.org/10.1016/0169-7439(92)80092-I
11. Wold, S., C. Albano, W. DUNN III, K. Esbensen, S. Hellberg, E. Johansson, W. Lindberg and M. Sjostrom, 1984. Modelling data tables by principal components and PLS: class patterns and quantitative predictive relations. Analusis, 12: 477-485;
12. Nash, M.S. and D.J. Chaloud, 2011. Partial least square analyses of landscape and surface

RiBaTox – Full Set of Fact Sheets
85
water biota associations in the Savannah river basin, ISRN Ecology, 2011: 11; https://doi.org/10.5402/2011/571749
13. Kvalheim, O.M., 2010. Interpretation of partial least squares regression models by means of target projection and selectivity ratio plots. J. Chemometrics, 24: 496-504; https://doi.org/10.1002/cem.1289
14. Mehmood, T., K.H. Liland, L. Snipen and S. Sæbø, 2012. A review of variable selection methods in Partial Least Squares Regression. Chemometrics Intellig. Lab. Syst., 118: 62-69; https://doi.org/10.1016/j.chemolab.2012.07.010
15. Rajalahti, T., R. Arneberg, A.C. Kroksveen, M. Berle, K.-M. Myhr and O.M. Kvalheim, 2009. Discriminating variable test and selectivity ratio plot: quantitative tools for interpretation and variable (biomarker) selection in complex spectral or chromatographic profiles. Anal. Chem., 81: 2581-2590; https://doi.org/10.1021/ac802514y
16. Tran, T.N., N.L. Afanador, L.M.C. Buydens and L. Blanchet, 2014. Interpretation of variable importance in partial least squares with significance multivariate correlation (sMC), Chemometrics Intellig. Lab. Syst., 138: 153-160; https://doi.org/10.1016/j.chemolab.2014.08.005
17. Thomas, D.R., E. Hughes and B.D. Zumbo, 1998. On the variable importance in linear regression, Social Indicators Research, 45: 253-278; https://link.springer.com/article/10.1023/A:1006954016433
18. Wold, S., 1978. Cross-validatory estimation of the number of components in factor and principal components models. Technometrics, 20: 397-405; https://doi.org/10.1080/00401706.1978.10489693
Keywords
effect-directed analysis, EDA, virtual EDA, data science, partial least squares, effect-based tools, in vitro, in vivo, non-target analysis, toxicant identification, bioassays
Related topics
Strategies for the identification of toxicity drivers FS045 Ecotoxicological mass balances FS057 Higher Tier Effect-Directed Analysis FS046 Strategies for monitoring of chemicals and their effects FS044
Contact information
Tobias Schulze ([email protected])
Helmholtz Centre for Environmental Research – UFZ, Leipzig, Germany

RiBaTox – Full Set of Fact Sheets
86
FP7 SOLUTIONS project - Fact Sheet 046
Name SOLUTIONS Tool or Service
FS046 Higher Tier Effect-Directed Analysis
Description
1. Objective
You have reached this Fact Sheet because you detected biological effects in some water, sediment or biota samples (typically extracts thereof) with in vitro or in vivo bioassays and want to know the chemicals causing this effect. You are lacking candidate drivers of this toxicity, you performed already a mass balance approach FS057 but could not explain your effect with the chemicals you analysed or you want to confirm the outcome of a virtual EDA study at selected sites.
Higher tier EDA offers a powerful tool to identify chemicals causing effects in water, sediment or biota extract in selected samples and to establish quantitative cause-effect relationships. This might be a crucial input to the abatement of toxic contamination and allows conclusions on probable sources of contamination. Since the methodology might be laborious and time-consuming it should be not the first choice if many samples in a river basin, time series etc. need to be analysed. In this case virtual EDA FS058 is recommended.
EDA is particularly promising in case of specific effects (inhibition of photosynthesis, binding to estrogen, androgen or other nuclear receptor, inhibition of acetylcholine esterase etc.) but it has a lower success rate for non-specific effects such as cytotoxicity, lethality of organisms, oxidative stress etc. In the latter case often many compounds contribute to the measured effects and no individual drivers of toxicity can be identified.
2. Methodology
Higher tier EDA follows the scheme below:
Figure 1. Scheme of HT EDA
Higher tier EDA procedures start with distinct environmental (sometimes also reconstituted) samples that are extracted. Extracts are subjected to individual biotests or batteries thereof. If toxicity is detectable the complexity of the mixture is sequentially reduced by fractionating the

RiBaTox – Full Set of Fact Sheets
87
extracts. The fractions are tested in the biotest that exhibited effects with the parent extract and the further procedure is focused on those fractions showing effects. Fractionation and testing can be sequentially performed with several different fractionation procedures until the remaining fractions are analysed with target, suspect and/or non-target analysis, in order to quantify the components in the toxic fractions. Finally, the compounds identified need to be confirmed as the cause of the measured effects (Brack et al., 2008) [Ref03]. In the following, key steps in the EDA are explained in more detail. Detailed information and guidance as well as selected examples of application are available in the references cited below.
Extraction
HT EDA is often performed on organic extracts of environmental samples but is, in case of solid samples, also applicable to aqueous elutriates.
The most frequently used procedure for water samples involves solid phase extraction. Since concentration of relatively large volumes of water might be needed, in situ large volume solid phase extraction (LVSPE) FS049 is a very good option to collect sufficient amounts with limited logistic challenges. Alternatively, very cost-efficient passive sampling FS039 techniques may be used. With both approaches time-integrated sampling is possible. Both approaches are sampling only compounds within their domain. This typically excludes inorganic compounds such as metals but also very hydrophilic compounds (albeit passive samplers for trace elements exist). While within its (rather broad) domain, LVSPE collects mixtures that resemble the composition that has been present in the water. Sampling rates in passive sampling are compound specific and thus the mixture sampled significantly deviates from the mixture in the water. Thus, passive sampling is a promising approach in qualitative EDA for discovery of new toxicants with low logistic efforts and costs. For quantitative EDA, LVSPE or another SPE-based approach is required in order to collect an unbiased sample and conclude on relative and absolute contribution of an identified toxicant to the measured effect.
For EDA, sediments are typically extracted with organic solvents using Soxhlet, pressurized liquid extraction or any other extraction procedure also used for chemical analysis (see sampling FS048 and extraction of biota and sediments). Ethylacetate/actone is a solvent with a relatively broad domain extracting non-polar to medium polar compounds. However, in order to extract the whole range of organic sediment contaminants a sequential extraction with solvents of increasing polarity is required. One shall be aware that organic extraction does not consider bioavailability and thus might bias compound prioritization. Alternative extraction tools considering bioavailability are discussed by Brack et al., (2009) [Ref02]. EDA of biota samples may be extracted following similar procedures as discussed for sediments. Quick, easy, cheap, effective, rugged and safe (QuEChERS) extraction of biota using liquid-liquid partitioning into an acetonitrile phase supported by adding salt is increasingly and successfully applied in food and biota analysis and might be also a valuable tool in EDA, although it has not been rigorously tested for this purpose yet.
Biotesting
In vitro bioassays FS054 as well as in vivo bioassays FS053 can be used to test for adverse effects and to direct the EDA procedure. In general, the whole battery of tests can be used in EDA. In practice, important requirements are low test volumes, high throughput, reproducible and quantitative detection of effect concentrations and endpoints that are specific enough to be caused by individual chemicals and limited mixtures thereof (examples are given above).
Different dosing techniques for bioassays are available and one should be aware (in combination with extraction) that they may strongly impact on toxicant prioritization. Dosing in low volumes of non-toxic solvents (DMSO, methanol etc.) or directly in water is recommended for toxic mixtures sampled from water, for example with SPE. In the case of organic extracts of sediment

RiBaTox – Full Set of Fact Sheets
88
or biota this approach may strongly bias toxicant prioritization towards more lipophilic chemicals. This problem may be avoided by using passive dosing, i.e. loading extracts and fractions onto silicon devices and achieve realistic relative concentrations by equilibrium partitioning. Options and implications of different dosing techniques are explained in detail by Brack et al. (2016) [Ref01].
Testing realistic fabrication and procedural toxicity blanks considering solvents, SPE sorbents and other materials is crucial to evaluate biotest results for EDA. One shall be aware that unproblematic analytical blanks (low number of small peaks in a chromatogram not interfering with analytes) are not necessarily an indication for low or no toxicity blanks. Fabrication of solvents, sorbents and laboratory ware is often optimized towards non-detectability of analytical peaks but not for avoiding toxicity. SPE sorbents may require substantial cleaning prior to use in order to remove toxic fabrication residues.
Fractionation
Fractionation is a key step in HT EDA for reducing complexity of the mixture prior to biotesting and chemical analysis. Fractionation is typically based on liquid chromatography involving reversed phase (RP, predominant approach for water extracts), normal phase or size exclusion chromatography (both often used for sediment and biota extracts). Highly complex mixtures often request several fractionation steps using orthogonal chromatographic systems in order to sufficiently reduce the number of candidate toxicants. Criteria and guidance how to select fractionation tools are given by Brack et al. (2016) [Ref01].
In RP chromatography mixtures of water and methanol or acetonitrile are typically used as mobile phase. In order to prepare them for biotesting, chemical analysis or the next fractionation step, they typically have to be reduced to dryness and re-dissolved in small volumes of solvent. Gentle evaporation of aqueous mixtures without significant losses of analytes is challenging. Losses can be minimized by diluting aqueous fractions with water, subjecting them to SPE and eluting them with pure solvent that can be easily evaporated.
Quality assurance/quality control should involve the recombination of aliquots of all fractions and a comparison of the effect concentration of the parent extract, the recombined extract and the sum of the effect concentrations of the fractions. This helps to identify losses during fractionation but also the occurrence of synergistic or antagonistic effects.
Chemical analysis
Toxic fractions are subjected to chemical analysis involving target FS001 and suspect analysis FS052 of toxicants that might be present in these fractions and to non-target screening FS003 attempting to identify unknowns that might explain measured biological effects. Depending on volatility and lipophilicity this involves LC-MS or GC-MC techniques (Brack et al., 2016) [Ref01]. For most water borne contaminants LC-MS is the method of choice. Since LC-MS typically provides less characteristic spectra due to the use of soft ionization techniques that provide often only the parent ion high resolution-high mass accuracy MS/MS approaches are required to allow conclusions on candidate empirical formulas for a detected exact mass. Using the ‘seven golden rules’ by Kind and Fiehn (2007) [Ref04] a short list of empirical formulas may be set up and used for database search in large compound databases such as ChemSpider that are freely available on the internet. The procedure is illustrated below.

RiBaTox – Full Set of Fact Sheets
89
Figure 2. Scheme for derivation of candidate compounds from LC-HRMS
For one empirical formula there may be hundreds of possible known compounds in the database; even more (so far) unknowns can be derived by structure generation. For the formula C12H10O2, for example, 279 known unique compounds are listed in ChemSpider. Thus, the challenge is to use available information and prediction tools as a filter to reduce the number of candidates. This includes MS information, chromatographic retention prediction and toxicity prediction using QSARs and structure alerts.
Figure 3. Scheme for tentative identification of toxicants
Confirmation
Confirmation of toxicants in EDA has been described as a three step approach (see scheme below, Brack et al., 2008) [Ref03] starting with analytical confirmation of chemical structures according to the confirmation levels given by Schymanski et al. (2014) [Ref05]. Effect confirmation with in vitro and in vivo bioassays is used to quantitatively estimate how much of the measured effect can be explained by the identified compounds. In a third step effects on a
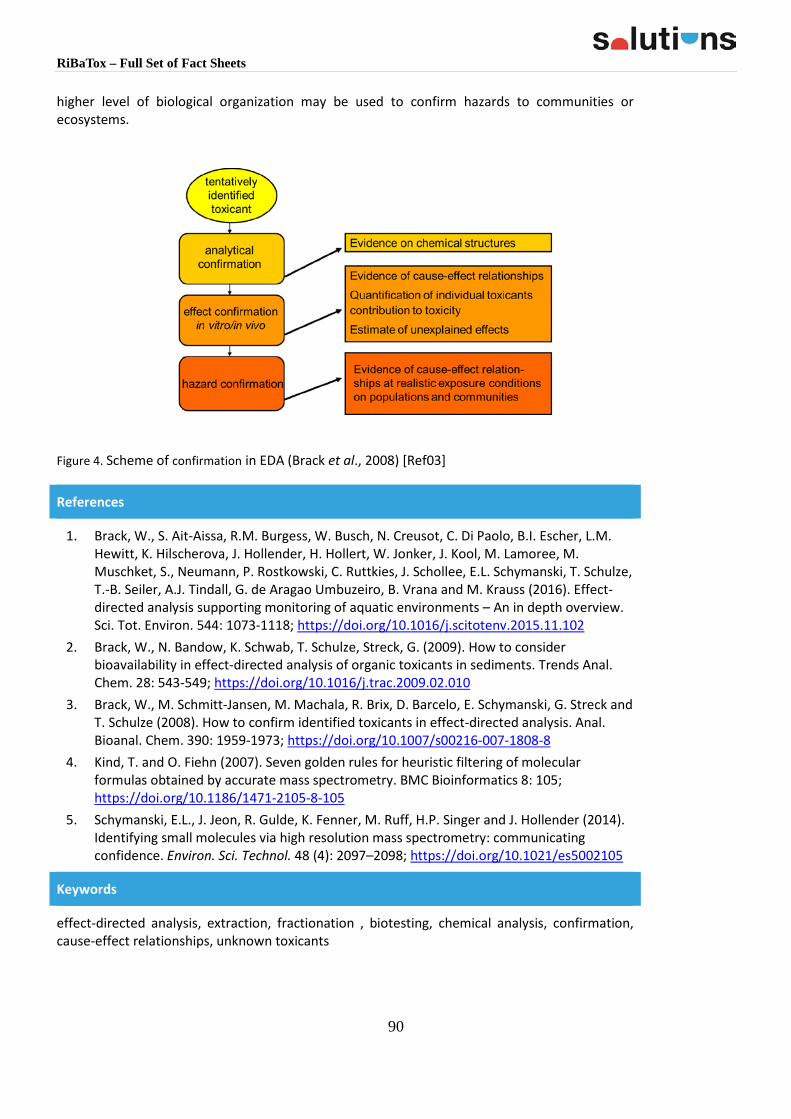
RiBaTox – Full Set of Fact Sheets
90
higher level of biological organization may be used to confirm hazards to communities or ecosystems.
Figure 4. Scheme of confirmation in EDA (Brack et al., 2008) [Ref03]
References
1. Brack, W., S. Ait-Aissa, R.M. Burgess, W. Busch, N. Creusot, C. Di Paolo, B.I. Escher, L.M. Hewitt, K. Hilscherova, J. Hollender, H. Hollert, W. Jonker, J. Kool, M. Lamoree, M. Muschket, S., Neumann, P. Rostkowski, C. Ruttkies, J. Schollee, E.L. Schymanski, T. Schulze, T.-B. Seiler, A.J. Tindall, G. de Aragao Umbuzeiro, B. Vrana and M. Krauss (2016). Effect-directed analysis supporting monitoring of aquatic environments – An in depth overview. Sci. Tot. Environ. 544: 1073-1118; https://doi.org/10.1016/j.scitotenv.2015.11.102
2. Brack, W., N. Bandow, K. Schwab, T. Schulze, Streck, G. (2009). How to consider bioavailability in effect-directed analysis of organic toxicants in sediments. Trends Anal. Chem. 28: 543-549; https://doi.org/10.1016/j.trac.2009.02.010
3. Brack, W., M. Schmitt-Jansen, M. Machala, R. Brix, D. Barcelo, E. Schymanski, G. Streck and T. Schulze (2008). How to confirm identified toxicants in effect-directed analysis. Anal. Bioanal. Chem. 390: 1959-1973; https://doi.org/10.1007/s00216-007-1808-8
4. Kind, T. and O. Fiehn (2007). Seven golden rules for heuristic filtering of molecular formulas obtained by accurate mass spectrometry. BMC Bioinformatics 8: 105; https://doi.org/10.1186/1471-2105-8-105
5. Schymanski, E.L., J. Jeon, R. Gulde, K. Fenner, M. Ruff, H.P. Singer and J. Hollender (2014). Identifying small molecules via high resolution mass spectrometry: communicating confidence. Environ. Sci. Technol. 48 (4): 2097–2098; https://doi.org/10.1021/es5002105
Keywords
effect-directed analysis, extraction, fractionation , biotesting, chemical analysis, confirmation, cause-effect relationships, unknown toxicants

RiBaTox – Full Set of Fact Sheets
91
Related topics
Strategies for the identification of toxicity drivers FS045 Mass balances FS057 virtual EDA FS058
Contact information
Werner Brack ([email protected])
Helmholtz Centre for Environmental Research – UFZ, Leipzig, Germany

RiBaTox – Full Set of Fact Sheets
92
1.6 Strategies for ecological assessment
FP7 SOLUTIONS project - Fact Sheet 059
Name SOLUTIONS Tool or Service
FS059 Strategies for ecological assessment
Description
1. Objective
You have reached this Fact Sheet because you were searching for ‘Strategies for ecological assessment’ as one of the options within the Monitoring concepts FS044.
The aim of this factsheet is to provide an overview of two complementary approaches for the ecological assessment, i.e. a statistical approach for the discrimination of different stressor groups, and the status assessment for a number of sampling sites. After reading this factsheet, it should be clear what objectives can be reached with the different methods, where they can be relevant, and where to find additional information.
2. Methodology When aiming at an assessment of the ecological status at a specific site in the aquatic environment, it is critical to think beforehand about the aim of such an exercise. Possible aims include, amongst others, to • detect chemical impacts on biota, from individual level impairment up to the composition
of communities and to discriminate this from the impact of other stressors such as general water quality, and hydro-morphological parameters,
• evaluate the ecological status of a community of e.g. macro-invertebrates, macrophytes or fish at a specific site in an absolute sense and to answer the question whether chemicals are likely to be the cause for an impaired status.
While these two objectives sound quite similar, they differ basically in terms of their data requirements, the methodology for evaluation and their use.
The detection of chemical impacts on biota and discrimination from other, non-chemical stressors can focus on (sub-)individual or community levels. Individual level assessment can include for example the use of in situ biomarkers in fish. Such an assessment is further elaborated in FS085. The required data consists mainly of the results of biomarker measurements from fish samples. Additionally, information about chemical exposure but also other stressors are relevant.
Community level detection of chemical and other stress for fish and invertebrates needs monitoring data on abundances of species for the assessment of community composition, and all available information about other stressors such as general water quality parameters, chemical exposure, but also hydro-morphology. In case also trait-based evaluations are intended, traits databases are necessary (see e.g. FS025 for an illustration for macroinvertebrates). The identification of chemical effects is done mainly by statistical approaches, further elaborated in FS004. The impact of pollutants on algae communities is topic of FS083. The use of the approaches outlined here is mainly to perform an in-depth analysis of multiple-stressor impacts on individual or community levels and hence to understand the importance of chemical pollution for a certain site or number of sites.
The assessment of the ecological quality for a certain site or a number of sites combines

RiBaTox – Full Set of Fact Sheets
93
multiple lines of evidence in a weight of evidence approach. This approach is combining tests and tools from different levels of biological organisation (from cell tests to community data) with chemical exposure data in a schematic way, further outlined in FS087. The aim is to identify the biological quality of a certain site, in connection to the question whether chemicals have a possible impact.
Keywords
Identification of effects, community level, species traits, multivariate analyses, water quality, hydrology, impact ranking
Related topics
Strategies for monitoring of chemicals and their effects FS044 Statistical approaches to discriminate multiple stressor influences on the community level FS004 Pollution-induced community tolerance for the in situ identification of ecological chemical impacts on microbial communities FS083 Biomarkers for exposure and effects of chemicals in fish FS085 Weight of evidence approaches FS087
Contact information
Andreas Focks ([email protected]) Wageningen Environmental Research, Team Environmental Risk Assessment, Wageningen, Netherlands

RiBaTox – Full Set of Fact Sheets
94
FP7 SOLUTIONS project - Fact Sheet 004
Name SOLUTIONS Tool or Service
FS004 Statistical approaches to discriminate multiple stressor influences on the community level
Description
1. Objective
You have reached this Fact Sheet because you were looking for methods for the detection of chemical impacts on biota and discrimination from other, non-chemical stressors with focus on community levels. The aim of this Fact Sheet is to shortly outline possibilities for the identification of pollutant effects on the composition of species or properties (‘traits’) of freshwater ecosystems. The main outcome consists in the quantification of the variability explained by chemical effects and to discriminate it from the effects explained by other factors. In addition, groups of chemicals (e.g. grouped by use class or mode of action) can be ranked and statistically tested concerning their impact on the composition of species or their properties across a number of sampling sites. The methodology can be used to check whether measured chemicals show a statistically significant influence on existing community composition data.
2. Methodology
Community level detection of chemical and other stress needs monitoring data on the abundances of species for the assessment of community composition. In addition, all available information about other stressors, such as general water quality parameters, chemical exposure, or hydro-morphology, and in case trait-based evaluations are intended, also traits databases are necessary (see e.g. Macroinvertebrate Trait Database – as part of the IDPS FS025). Challenges for this approach are caused by the fact that data on the species composition are multivariate and the composition is strongly influenced by other factors than pollutants, e.g. hydrology or general water quality. Using this tool makes it possible to quantify the degree of variability in the multivariate data caused by different groups of environmental factors, hence the impact of the pollutants in total can be evaluated.
This is reached by using the technique of variance partitioning. The variation partitioning to test the single and combined influence of different parameter groups on the taxonomy-based and trait-based community datasets and the biological indices, can be complemented with a Monte Carlo permutation test of the parameters to identify their isolated explanatory power. In this way, single compounds or combinations of compounds can be tested on their contribution to the overall variability. All multivariate analyses were implemented in the CANOCO 5 software ([Ref01]). Alternative implementations exist, see e.g. [Ref02].
3. Application
Based on information about pollutants, other environmental factors such as water quality or hydrological/morphological information, and community composition for a number of freshwater sampling sites, the method yields the variabilities explained by the different groups of explaining factors and their ranking.
The method was applied for a data set from the 3rd Joint Danube Survey, JDS3 FS042, where for 55 sampling sites spread over the whole Danube community composition of aquatic macro-invertebrates was available. The concentrations of about 300 organic pollutants and data on habitat characteristics, hydro-morphology and general water quality parameters were available as well [Ref03].

RiBaTox – Full Set of Fact Sheets
95
Table 1. Results for the explained variance in the taxonomic and the traits composition by the tested parameter groups.
Figure 1. RDA biplot for chemical groups that significantly influenced the trait variation. Stressor groups were identified by including abiotic parameters that correlated to the significant chemical groups
The variance partitioning method was applied to quantify the influence of chemicals. Result show (table 1), that habitat and general water quality had a strong influence on the traits and taxonomic composition. The impact of pollutants was small but detectable. In general there was a high level of collinearity between the parameters, indicated by the high percentages associated with the shared part. Redundancy Analysis (RDA) for the trait dataset shows positive correlations between some traits and chemical classes, which appear as reasonable in a mechanistic sense. For example, positive miscellaneous chemicals correlated positively with large individual size, several life cycles per year, larval aquatic stages, and some resistance forms (cocoons), whereas organisms with

RiBaTox – Full Set of Fact Sheets
96
smaller size, crawling locomotion type and using gills as main respiration organ correlate with less polluted sites.
References
1. Ter Braak, C. and P. Šmilauer, 2012. Canoco reference manual and user’s guide: Software for ordination (version 5.0). Microcomputer power, Itaca, pp.496; www.canoco.com
2. Oksanen, J., 2017. Partition the Variation of Community Matrix by 2, 3, or 4 Explanatory Matrices https://www.rdocumentation.org/packages/vegan/versions/2.4-2/topics/varpart
3. Rico, A., P.J. Van den Brink, P. Leitner, W. Graf and A. Focks, 2016. Relative influence of chemical and non-chemical stressors on invertebrate communities: a case study in the Danube River, Sci. Total Environ. 571: 1370-1382; https://doi.org/10.1016/j.scitotenv.2016.07.087
Keywords
Identification of effects, community level, species traits, multivariate analyses, water quality, hydrology, impact ranking
Related topics
Strategies for ecological assessment FS059 Statistical approaches to discriminate multiple stressor influences on the community level FS004 Pollution-induced community tolerance for the in situ identification of ecological chemical impacts on microbial communities FS083 Biomarkers for exposure and effects of chemicals in fish FS085 Weight of evidence approaches FS087 Strategies for monitoring of chemicals and their effectsFS044
Contact information
Andreas Focks ([email protected]) Alterra Team Environmental Risk Assessment, Wageningen, Netherlands

RiBaTox – Full Set of Fact Sheets
97
FP7 SOLUTIONS project - Fact Sheet 083
Name SOLUTIONS Tool or Service
FS083 Pollution-induced community tolerance for the in situ identification of ecological chemical impacts on microbial communities
Description
1. Objective
You reached this Fact Sheet because you are interested in a methodology on how to assess the ecological status of a water body and/or how to link an impaired ecological status to chemical pollution. The objective of this Fact Sheet is to give an introduction to the concept of Pollution Induced Community Tolerance (PICT), which is an ecological approach that provides a causal link between (microbial) biodiversity and chemical pollution.
Within the EU project SOLUTIONS, the PICT methodology was applied to confirm the success of upgrading a Sewage Treatment Plant (STP) with a tertiary treatment (activated carbon filtration), in the context of the Rhine case study FS075.
Figure 1. Outline of the Pollution Induced Community Tolerance (PICT) approach.
2. Methodology
PICT (Tlili et al., 2016; [Ref02]) is based on the observation that an ecological community (biocoenosis) under chemical stress differs fundamentally from a community that originates from

RiBaTox – Full Set of Fact Sheets
98
a pristine site. A community from a polluted site is tolerant to the chemicals present. This tolerance development takes place on: • an ecological level (sensitive species will be absent, as they are outcompeted by more
tolerant species),
• a physiological level (by the elevated expression of physiological defence mechanisms such as cytochrome P450s) and
• a genetic level (increased prevalence of resistant genotypes).
The detection of tolerance is causally coupled to the chemicals present at a site. That is, the community will be tolerant only to those pollutants that it has previously experienced, but not to others. By analysing the sensitivity profile of a community that originates from a specific site it is hence possible to determine which pollutants are present at sufficiently high concentrations to exert an ecological effect. PICT hence provides a solid foundation for effect-based monitoring of chemical pollution and for cause-effect analyses
3. Application
PICT was applied in a case study together with an in-depth chemical-analytical profiling at three pairs of sites in wastewater-dominated tributaries to the river Rhine (up- and downstream of sewage treatment plant (STP) discharge points). This part of SOLUTION’s work could show that • the tolerance pattern of microbial communities located upstream of STPs is constant over
several years, which is important to describe a tolerance-baseline,
• the chemical mixtures entering the river via STP effluents lead to a specific tolerance increase that can be traced back to a specific group of chemicals, so-called PSII-inhibiting biocides and herbicides,
• the upgrade of one of the STPs lead to a disappearance of this tolerance signal, indicating a sufficiently lowered pollutant emission; this was finally confirmed
• by chemical-analytical profiling which proved that the concentrations of PSII inhibitors were indeed reduced.
The PICT study showed in particular, that this reduction was sufficient in order to avoid ecological impacts in the receiving river [Ref01].
References
1. Backhaus, T., Segner, H., Hollert, H., Deutschmann, B., Van den Brink, P., Seiler, T., Teodorovic, I. and Focks, A., 2017. Diagnostic toolbox for ecological effects of pollutant mixtures. Solutions Deliverable D13.1.
2. Tlili, A. , Berard, A., Blanck, H., Bouchez, A., Cássio, F., Eriksson, K.M., Morin, S., Montuelle, B., Navarro, E., Pascoal, C., Pesce, S., Schmitt-Jansen, M. and Behra, R., 2016. Pollution-induced community tolerance (PICT): towards an ecologically relevant risk assessment of chemicals in aquatic systems. Freshw. Biol. 61(12): 2141-2151; https://doi.org/10.1111/fwb.12558
Keywords
Ecological effects, in situ experimentation, ecosystem diagnosis, PICT
RiBaTox – Full Set of Fact Sheets
99
Related topics
Strategies for ecological assessment FS059 Statistical approaches to discriminate multiple stressors FS004 Pollution-induced community tolerance for the in situ identification of ecological chemical impacts on microbial communities FS083 Biomarkers for exposure and effects of chemicals in fish FS085 Weight of evidence approaches FS087 Strategies for monitoring of chemicals and their effectsFS044
Contact information
Thomas Backhaus ([email protected])
University of Gothenburg - Dept of Biological & Environmental Sciences, Gothenburg, Sweden
RiBaTox – Full Set of Fact Sheets
100
FP7 SOLUTIONS project - Fact Sheet 085
Name SOLUTIONS Tool or Service
FS085 Fish biomarkers – biomarkers for exposure to and effects of chemicals in fish
Description
1. Objective
You have reached this fact sheet because you are interested in approaches for ecological assessment and the ecological toolbox FS059. Biomarker analysis is a tool to identify exposure to pollutants and/or sublethal effects of chemical exposure.
Fish biomarkers are sub-organismic – molecular, cellular, physiological or behavioural - responses that provide evidence of either exposure to or effects of toxic chemicals (Huggett et al. 1992 [Ref07], van der Oost et al. 2003 [Ref10], Bonnineau et al. 2012 [Ref03]). Biomarkers of exposure indicate that the biological system is exposed to a stressor and they may inform about the identity and intensity of the stressors. The exposure to an environmental stressor may be associated with functional or structural impairment and damage of the fish, and responses indicating such chemical-induced damage are biomarkers of (adverse) effect. Since toxic effects arise from interactions of toxic chemicals with cellular macromolecules, many biomarkers have a sound mechanistic basis and as such may be linked to Adverse Outcome Pathways (AOPs).
Advantages of biomarkers include their • sensitivity, • early detection of exposure or effects, • partial specificity for certain toxicant classes and/or modes of action, • potential linkage to and integration into AOPs.
The main disadvantage of biomarkers is that their ecological relevance is not always clear (Forbes et al. 2006 [Ref06], Segner, 2011 [Ref09]). Thus, fish biomarkers should be used rather as signposts than as traffic lights (Hutchinson et al. 2006 [Ref08]).
2. Methodology
Biomarkers can be measured by any technique that is able to detect responses at the molecular, cellular, physiological and behavioural levels. For instance, transcriptomics and RT-PCR are frequently used for molecular biomarkers, histopathology for cellular responses, or energy metabolism for physiological responses. Examples of biomarkers include (i) the biotransformation enzyme, cytochrome P4501A (CYP1), that can be measured by an enzyme assay (7-ethoxyresorufin-O-deethylase - EROD - activity) and indicates exposure to dioxin-like chemicals (e.g., Behrens and Segner 2005 [Ref02]), (ii) the reproductive protein, vitellogenin, that can be measured at the transcription level by means of RT-PCR or at the protein level by means of Enzyme-Linked-Immunosorbent-Assay, ELISA, and which indicates exposure to oestrogen-active compounds (e.g., Burki et al. 2006 [Ref04]); or (iii) organ histopathology that can be examined by classical histological techniques and indicates adverse impacts of chemical exposure (e.g. Bernet et al. 1999 [Ref01]).
In most cases, the methodology is applicable to field studies, in situ bioassays and laboratory experiments. For instance, RT-PCR can be performed on tissue samples of fish collected in field monitoring studies, or from fish exposed in situ in cages, or from fish exposed to environmental samples under laboratory conditions. Both destructive and non-destructive methodologies exist for the measurement of biomarkers. An example of a non-destructive methodology is the

RiBaTox – Full Set of Fact Sheets
101
sampling of blood from live fish for determination of micronuclei, which are a biomarker of genotoxic effects.
In the SOLUTIONS project, biomarker analysis with a broad range of biological endpoints were performed with fish from different river basins, namely the Danube river, the Holtemme river and with caged fish in the river Danube at a hot spot site in Novi Sad. Data are partly published or under preparation for publication (e.g. Deutschmann et al. 2016 [Ref05]).
3. Application
Biomarkers are used in laboratory effect and mechanistic experiments, in field monitoring and surveillance, as well as in investigative monitoring.
In selecting biomarkers for a study, the following criteria might be considered: • Specificity of the biomarker for specific toxicant classes or modes of action • Sensitivity (relative to more apical parameters), amplitude and time course of the biomarker
response • Technical ease of measurement and sampling; reproducibility • Possible confounders (influence of non-chemical stressors, life stage specificity, etc.)
• Available information on linkages to adverse effects at the individual and population levels.
Additionally, the use of the Index of Causality (IoC) and the Index of Expected Ecological Impact (IoEEI) (see [Ref11]) as an integrated measure of biomarker responses may help for the interpretation of difficult data sets and help to answer the question if organisms are impacted due to chemical exposure at investigated sites. Therefore biomarker responses can be an important link within the chain of adverse effects from chemical exposure to chemical-biological interaction, cellular and physiological responses and eventually the population effect.
References
1. Bernet D, Schmidt H, Meier W, Burkhardt-Holm P, Wahli T (1999). Histopathology in fish: proposal for a protocol to assess aquatic pollution. J. Fish Dis. 22: 25-34; https://doi.org/10.1046/j.1365-2761.1999.00134.x
2. Behrens A, Segner H (2005). Cytochrome P4501A induction in brown trout exposed to small streams of an urbanised area: results of a five-year-study. Environ. Pollut. 136: 231-242; https://doi.org/10.1016/j.envpol.2005.01.010
3. Bonnineau C, Moeller A, Barata C, Bonet B, Proia L, Sans-Piché F, Schmitt-Janssen M, Guasch H, Segner H (2012) Advances in the multibiomarker approach for risk assessment in aquatic eco-systems. In: Guasch H, Ginebreda A, Geiszinger A (eds). Emerging and Priority Pollutants in Rivers. Handbook of Environmental Chemistry Vol. 19, pp. 147-180. Springer, Berlin-Heidelberg; http://www.springer.com/us/book/9783642257216
4. Burki R, Vermeirssen ELM, Körner O, Joris C, Burkhardt-Holm P, Segner H (2006). Assessment of estrogenic exposure in brown trout (Salmo trutta) in a Swiss midland river: integrated analysis of passive samplers, wild and caged fish, and vitellogenin mRNA and protein. Environ. Toxicol. Chem. 25: 2077-2086; https://doi.org/10.1897/05-545R.1
5. Deutschmann B, Kolarevic S, Brack W, Kaisarevic S, Kostic J, Kracun-Kolarevic M, Liska I, Paunovic M, Seiler TB, Shao Y, Sipos S, Slobodnik J, Teodorovic I, Vukovic-Gacic B, Hollert H. (2016). Longitudinal profiles of the genotoxic potential of the River Danube on erythrocytes of wild fish assessed using the comet and micronucleus assay. Sci. Total Environ. 573: 1441-1449; https://doi.org/10.1016/j.scitotenv.2016.07.175
6. Forbes, V.E., Palmqvist A. and Bach, L. (2006). The use and misuse of biomarkers in

RiBaTox – Full Set of Fact Sheets
102
ecotoxicology. Environ. Toxicol. Chem. 25: 272–280; https://doi.org/10.1897/05-257R.1 7. Huggett, R.J., Kimerle, R.A. and Mehrle Jr, P.M. (1992). Biomarkers: biochemical,
physiological and histological makers of anthropogenic stress, In: Proceedings of the 8th Pellston Workshop. Ann Harbor, Keystone, Colorado, July 1989; https://searchworks.stanford.edu/view/2294319
8. Hutchinson T, Ankley GT, Segner H, Tyler CR (2006). Screening and testing for endocrine disruption in fish – biomarkers as „signposts” not „traffic lights“ in risk assessment. Environ Health Persp. 114(suppl. 1): 106-114; https://doi.org/10.1289/ehp.8062
9. Segner H (2011). Moving beyond a descriptive aquatic toxicology: the value of biological process and trait information. Aquat. Toxicol. 105: 50-55; https://doi.org/10.1016/j.aquatox.2011.06.016
10. Van der Oost R, Beyer J, Vermeulen NPE. (2003). Fish bioaccumulation and biomarkers in environmental risk assessment: a review. Environ. Toxicol. Pharmacol. 13: 57-149; https://doi.org/10.1016/S1382-6689(02)00126-6
11. Backhaus, T., Segner, H., Hollert, H., Deutschmann, B., Van den Brink, P., Seiler, T., Teodorovic, I. and Focks, A., 2017. Diagnostic toolbox for ecological effects of pollutant mixtures. Solutions Deliverable D13.1.
Keywords
Ecological status, biomarker, ecological toolbox, in-situ, monitoring, biota, sublethal
Related topics
Strategies for ecological assessment FS059 Statistical approaches to discriminate multiple stressor influences on the community level FS004 Pollution-induced community tolerance for the in situ identification of ecological chemical impacts on microbial communities FS083 Biomarkers for exposure and effects of chemicals in fishFS085 Weight of evidence approachesFS087 Strategies for monitoring of chemicals and their effectsFS044
Contact information
Björn Deutschmann ([email protected]) Institute for Environmental Research, RWTH Aachen University, Germany
Helmut Segner ([email protected]) Centre for Fish and Wildlife Health, University of Bern, Switzerland

RiBaTox – Full Set of Fact Sheets
103
FP7 SOLUTIONS project - Fact Sheet 087
Name SOLUTIONS Tool or Service
FS087 Weight of evidence approaches
Description
1. Objective
You reached this Fact Sheet because you are interested in a weight of evidence approach within strategies for ecological assessment for the detection of the impact of pollutants. The objective of this Fact Sheet is to provide an introduction to the detection of the ecological impact of chemicals that was developed within the EU project Solutions. It uses a statistically supported, transparent and formalized weight of evidence (WOE) approach.
2. Methodology For the toolbox development, an overview about principal approaches for ecological status assessment and analysis of causality identifies four main lines of evidence (Figure 1): • LOE1 predictive mixture modelling • LOE2 effect-directed analysis (EDA) • LOE3 in situ tests • LOE4 field-based monitoring studies.
These four lines of evidence (LOE) are integrated in a systematic and transparent WOE approach, based on a decision matrix. This matrix can be explored as the application Diagnostic Toolbox in RiBaTox. Further information on the approach is given in Backhaus et al. (2017) [Ref01].
Figure 1. Overview of the WOE approach in the developed ecological toolbox
3. Application
The developed toolbox was applied to the Danube case study, to facilitate evaluation of the very comprehensive data set from Joint Danube Survey 3 FS042.
As an application example, data from the different lines of evidence was analysed: • Results from in depth chemical analyses of water samples were analysed by predictive mixture
toxicity modelling (sum of TU, STU);

RiBaTox – Full Set of Fact Sheets
104
• Results from a suite of in vitro bioassays, performed with extracts from high volume and passive sampling, were taken into account (Schulze et al. 2015, [Ref02]; Neale et al. 2015, [Ref03]);
• Results from a battery of relevant in situ biomarkers in sentinel fish (Alburnus alburnus and Neogobius sp.) (Deutschmann et al. 2016, [Ref04]) were analysed and aggregated using the average biomarker response;
• Taxonomy- and traits-based analyses of fish and macroinvertebrate community data were performed to identify possible ecological impacts (Rico et al., 2016, [Ref05]).
The JDS3 data set provides a tremendous richness of data. By application to the Danube data set, practicality, simplicity and stringent definition of the WOE toolbox could be tested. It was possible to transform the high-dimensional data into a comprehensible matrix (Figure 2), which summarises the overall evaluation without losing more precision than necessary.
Figure 2. WOE matrix for selected JDS3 sampling sites, for data on fish and invertebrates. JDSxx: number of JDS3 sampling sites. LOE: Line of Evidence. Values indicate: 2: clear signal, 1: moderate signal, 0: no signal. Empty boxes indicate missing data.
It was possible to subdivide the sampling sites into classes of similar effect patterns, and to associate interpretations from the decision matrix (Figure 2). The results from the JDS3 showed a ‘flat’ profile, meaning that the differences between the sites were not very pronounced. The toolbox application resulted in the identification of a number of sites where all LOE indicate impairment, from predictive toxicity modelling over biomarker responses up to community level indicators. In total, the picture emerged that many of the Danube sampling sites show clear anthropogenic impacts, and in all of them the toxic pressure suggests toxicants as potential cause. However, the biomarker response (LOE3) for many sites indicate that the link from toxic pressure to community effects is not as clear as it might appear from only linking chemical pressure to community effects (e.g. for sites 39, 47, 60). Here, the biomarkers and their aggregation in form of the ABR show their potential to add another aspect to the overall evaluation of the chemical and ecological quality of water bodies.

RiBaTox – Full Set of Fact Sheets
105
References
1. Backhaus T, Segner H, Hollert H, Deutschmann B, Van den Brink P, Seiler T, Teodorovic I, and Focks A., 2017. Diagnostic toolbox for ecological effects of pollutant mixtures, including bio-tests, trait-based database and detection tool and WoE studies at hot-spot sites. SOLUTIONS Deliverable D13.1.
2. Schulze, T., M. Krauss, J. Novak, K. Hilscherova, S. Ait-Aissa, N. Creusot, M. Macova, P. Neale, B.I. Escher, T. Gomes, K.E. Tollefsen, Z. Tarcai, Y. Shao, B. Deutschmann, Th.B. Seiler, H. Hollert, P. Tarabek, Z. Tousova, J. Slobodnik, K.-H. Walz and W. Brack, 2015. Large volume sampling and effect-based screening. In: Liska, I., F. Wagner, M. Sengl, K. Deutsch, and J. Slobodník (Eds.), Joint Danube Survey 3, Final Scientific Report. Inter-national Commission for the Protection of the Danube River, Vienna, Austria. pp. 284-295; https://www.icpdr.org/main/sites/default/files/nodes/documents/jds3_final_scientific_report_2.pdf
3. Neale, P.A., S. Ait-Aissa, W. Brack, N. Creusot, M.S. Denison, B. Deutschmann, K. Hilscherová, H. Hollert, M. Krauss, J. Novák, T. Schulze, Th.-B. Seiler, H. Serra, Y. Shao and B.I. Escher, 2015. Linking in vitro effects and detected organic micropollutants in surface water using mixture-toxicity modeling. Environ. Sci. Technol. 49: 14614−14624; https://doi.org/10.1021/acs.est.5b04083
4. Deutschmann, B., Kolarevic S., Brack W., Kaisarevic S., Kostic J., Kracun-Kolarevic M., Liska I., Paunovic M., Seiler T.B., Shao Y., Sipos S., Slobodnik J., Teodorovic I., Vukovic-Gacic B. and Hollert H., 2016. Longitudinal profiles of the genotoxic potential of the River Danube on erythrocytes of wild fish assessed using the comet and micronucleus assay. Sci. Total Environ. 573: 1441-1449; https://doi.org/10.1016/j.scitotenv.2016.07.175
5. Rico, A., P.J. Van den Brink, P. Leitner, W. Graf and A. Focks, 2016. Relative influence of chemical and non-chemical stressors on invertebrate communities: a case study in the Danube River. Sci. Total Environ. 571: 1370-1382; https://doi.org/10.1016/j.scitotenv.2016.07.087
Keywords
Weight of evidence approach; ecological assessment; pollutant impacts;
Related topics
Strategies for ecological assessment FS059
Statistical approaches to discriminate multiple stressor influences on the community level FS004
Pollution-induced community tolerance for the in situ identification of ecological chemical impacts on microbial communities FS083
Biomarkers for exposure and effects of chemicals in fish FS085
Strategies for monitoring of chemicals and their effects FS044
Contact information
Andreas Focks ([email protected])
Wageningen Environmental Research, Team Environmental Risk Assessment, Wageningen, Netherlands

RiBaTox – Full Set of Fact Sheets
106
2 Modelling strategies
2.1 General
FP7 SOLUTIONS project - Fact Sheet 060
Name SOLUTIONS Tool or Service
FS060 Modelling strategies
Description
1. Objective
You have reached this Fact Sheet because you are interested to know how the SOLUTIONS project applied modelling techniques in support to substances admission and river basin management practices.
The SOLUTIONS projects uses modelling to supplement data about emerging contaminants derived from monitoring. In particular, we want to obtain data and information: • at locations and at times that no monitoring data are available or the field data analyses are
hampered by a lack of accuracy (e.g. limits of detection above the estimated no-effect levels); • for larger amounts of chemicals than addressed in monitoring campaigns, in order to better
approach the ‘real life exposure scenario’, where the aquatic environment is exposed to a cocktail of chemicals consisting of – possibly - many thousands of individual substances;
• for truly ‘emerging’ chemicals before monitoring and lab data are available, or even before the introduction of such chemicals.
This will only work for large groups of substances on a scale of Europe as a whole, if the data demands for substances to be modelled are limited. Therefore, selected modelling strategies were selected that provide the answers to the questions above, without relying on extensive input data or calibration data.
2. Methodology
The SOLUTIONS model train was designed and built (Figure 1, FS016) to carry out the risk assessment of a wide range of chemicals in all European River Basins.
The emission model (FS017) uses limited information about the volume of a chemical used (in Europe or country-by-country) and the type(s) of use of the chemical. It follows the so-called ‘source oriented’ approach (European Water Framework Directive Common Implementation Strategy Guidance Document 28). Socio-economic spatial data are used to distribute the emissions in space. Agricultural practices and hydrology data (http://hypeweb.smhi.se/europehype/) are used to distribute the emissions over time, and to quantify pathways from soils and shallow groundwater to surface water.
The fate and transport model FS018 uses the above emission estimates and hydrology data to obtain a Europe wide spatially and temporally differentiated image of the concentrations of emerging contaminants. Because these substances interact with particulate organic matter (POM), the modelling includes a time and pace dependent representation of the concentrations of POM

RiBaTox – Full Set of Fact Sheets
107
and the retention of particles in aquatic sediments in wetlands and riparian zones
Figure 1 The SOLUTIONS Model train, using external data and consisting of the sub-models (i) Emissions, (ii) Transport & Fate, (iii) Substance properties and (iv) Risk characterisation.
All substance related model parameters are derived from substance properties models FS020, which are based on so-called Quantitative Structure Activity Relationships (QSARs). This means that once the chemical structure of a chemical is available, the Model Train makes the best possible estimate of the relevant substance properties.
Finally, the risk characterization model (FS019) transforms the concentrations of chemicals into a range of metrics of the risk exerted on the aquatic ecosystem or on human health (via the drinking water and fish consumption exposure pathways).
Where the benefits of modelling are obvious, the down side of the modelling strategies used in SOLUTIONS is the loss of accuracy. Simulated concentrations will differ from measured concentrations. By carrying out extensive validation studies in three Case Study Areas (FS040, FS042), SOLUTIONS scientists obtained a clear picture of how accurate especially the predicted environmental concentrations are expected to be.
3. Application The modelling strategies outlined above are applied in a number of ways. • To quantify emissions on the scale of Europe for as many chemicals as possible (FS089, FS021)
• To quantify the subsequent exposure (as a function of space and time) and the mixture risk (as a function of space) on the scale of Europe FS021
• Based on this, candidates for prioritisation (Europe wide or basin-specific) can be identified that may go unnoticed by a data-driven approach FS014
• Projections for the change in toxic pressure as a result of identified socio-economic trends (ageing of population, urbanisation, green chemistry, FS030)
Emissions sub-model (M2)
Risk characterizationsub-model (M5)
Transport & fate sub-model (M3)
Subs
tanc
e pr
oper
ties
sub-
mod
el(s
) (M
4)
Exte
rnal
dat
a
partitioning
toxicitymode of action
Emissions to air, soil, groundwater, surface water
exposure
Use volumes use types
Waste water &Solid waste management
HydrologyMeteorologyWaterbodiesSoilsSocio-economy
Species sensitivitiesSpecies traitsFood webs
partitioning, decay

RiBaTox – Full Set of Fact Sheets
108
Figure 2. Initial version of simulated direct emissions to surface water (example taken from the Danube Case Study, JDS3).
• To support the selection of a strategy for cost-efficient placement of abatement options (FS015)
• To produce a sound quantification of the environmental footprint of the use of chemicals on a European scale (FS070)
• To develop simplified approaches that can be used in legal admission frameworks (FS065).
References
1. van der Heijden, S., T. Sinnige, S. Droge, J. Hermens, M. Jonker, R. Kühne, A. Paschke and G. Schüürmann, 2017. Novel experimentally based LSER models for sorption and bioaccumulation of emerging pollutants. Solutions Deliverable D17.1
2. Greskowiak, J., E. Hamann, V. Burke and G. Massmann, 2017. Evaluation of the basin-wide river catchment and soil-to-groundwater-to-surface water transport model including sensitivity and uncertainty analyses. Solutions Deliverable D16.1.
3. Kutsarova, S., I. Dermen, C. Kuseva, P. Petkov and O. Mekenyan, 2017. Predictions of transformation products, physicochemical properties, fate and toxicity of candidate compounds from chemical screening, EDA and emission modelling. Solutions Deliverable D17.2
4. van Gils, J., R. Schueder, C. Chrzanowski, A. Focks, H. Baveco, L. Posthuma, I. Cousins, C. Lindim, S. Kutsarova, S. Dimitrov, A. Kortenkamp, S. Ermler, G. Massman, J.Greskowiak, G. Schüürmann, R. Kuehne, D. van de Meent and D. de Zwart, 2018. Modelling framework and model-based assessment for substance screening. Solutions Deliverable D14.1.
5. van Gils, J., L. Posthuma, M. Zijp, A. van Wezel, R. Sjerps, D. Bunke, D. de Zwart, Dik van de Meent, I. Cousins, C. Lindim, S. Kutsarova, O. Mekenyan, J. Hollender, J. Slobodnik, R. Kühne and A. Kortenkamp, 2018. Europe wide modelling and simulations of emerging pollutants risk including think tank scenarios. Solutions Deliverable D14.2.
mg/m2/y
Bisphenol A (80-05-7)Emissions to water

RiBaTox – Full Set of Fact Sheets
109
6. van de Meent, D., D. de Zwart, K. Kramer and L. Posthuma, 2018. Screening level estimation of release rates of currently used chemicals to the environment - application to solution-oriented assessment of impacts on aquatic ecosystems. Solutions Deliverable D15.1 ED151
7. (Authors), 2018. Common assessment framework for HRA and ERA higher tier assessments including fish and drinking water and multi-species ERA via SSD, population-level ERA via IBM and food web vulnerability ERA. Solutions Deliverable D18.1 (in preparation)
8. Slobodnik, J., W. Brack, J. van Gils, V. Dulio and I. Liska, 2018. Guidance for identification of RBSPs and list of Danube RBSP including quantification of their ecological impact and modeling-based exposure and risk predictions validated with case-study data. Solutions Deliverable D19.4 ED194
9. Hollender, J. and N. Munz, in cooperation with A. van Wezel, K. Baken, P. Neale, J. Slobodnik, B. Escher, J. Greskowiak and G. Massmann, 2018. Targeted tool-box for the assessment of abatement options, derivation of ELVs and pGLVs for drinking water and assessment of natural attenuation during river bank filtration. Solutions Deliverable D20.1.
10. Ginebreda, A., M. López de Alda, D. Barceló, J. van Gils and J. Slobodnik, in cooperation with D. van de Meent, C. Lindim, I. Cousins and S. Kutsarova, 2018. Guidance for identification of RBSPs in Mediterranean river basins and list of RBSP including quantification of their ecological impact and modeling–based exposure and risk predictions validated. Solutions Deliverable D21.1 ED211
11. Bunke, D. and S. Moritz, 2018. Pollution of tomorrow: Options to act on Future Risks. Recommendations for a successful management of emerging pollutants. Solutions Deliverable D6.1 ED061
Keywords
emerging compounds, modelling, European River basins, emissions, exposure, effects
Related topics
From emissions to effects: Model Train for SOLUTIONS FS016 SOLUTIONS Emissions Model FS017 Spatially and temporally-resolved transport and fate modelling FS018 REACH approach to 'typical' exposure estimation FS065 Risk Characterisation Model FS019 Ecological risk quantification via Species Sensitivity Distributions (SSD) FS035 Ecotoxicological modelling to estimate the total toxic pressure of water bodies FS037 Combination Toxicity Calculator (CTC) FS026 Estimation of toxic pressure from distributions FS086 Identification of new substances posing a high risk FS014 Risk based prioritization (RBP) of emerging contaminants in drinking water. FS027
Contact information
Jos van Gils ([email protected])
Deltares, Delft, Netherlands

RiBaTox – Full Set of Fact Sheets
110
2.2 SOLUTIONS model train
FP7 SOLUTIONS project - Fact Sheet 016
Name SOLUTIONS Tool or Service
FS016 From emissions to effects: Model Train for SOLUTIONS
Description
1. Objective
You have reached this Fact Sheet because your environmental management problem with one or more chemicals requires a systematic exploration of the likelihood of chemicals to pose problems to human health or the environment, utilizing models that operationalize knowledge on emissions, fate and behaviour of chemicals in the environment, and hazardous properties of the chemicals, alone and/or in combination. WFD-Annex II (Assessment of Impacts) suggests the use of models to investigate the likelihood that chemical pollution plays a role in affecting water quality. This Fact Sheet sketches the main tools and services provided by SOLUTIONS-products, in the logical sequential assessment of emissions up till impacts.
The sequence of (mathematical) modelling tools, from Emissions towards Ecological or Human Health effects can be depicted as a ‘model train’. The train shows how a variety of information (data) can be collated and used to eventually estimate the likelihood of net ecological and human health impacts of chemical (mixture) exposures, which can (for an area) be summarized as a chemical footprint FS070.
This train [see Figure 1] is briefly explained. Links lead to more detailed information on the respective subjects, tools, models and databases to run parts of the model train, either separately, or in the full conjunction as applied in the SOLUTIONS project, in order to analyse the likelihood that chemical pollution induces possible impacts of European-wide emissions in the Assessment of Impacts (Annex II).

RiBaTox – Full Set of Fact Sheets
111
Figure 1. Model Train illustrating the various components (data, models) and interactions that are used to estimate the potential ecological impact of chemicals that are produced/used in the European Union. The illustration summarizes the model train for a specific context, i.e. REACH and industrial chemicals. Similar approaches apply to other sub-selections of chemicals.
2. Methodology
SOLUTIONS has access to, or compiled, large data bases with relevant information on e.g. production volumes of chemicals, the use of such chemicals (agriculture, industry, ... ), the physico-chemical properties of these chemicals, information on hydrological characteristics in Europe (volumes of water, flows of rivers), and (eco)toxicological information of chemicals, including information for a large number of (aquatic) organisms. Using this wealth of information, by combining several emission–, fate and behaviour–, compound properties–, hydrological– and (eco) toxicological models as well as mixture models, in the end the human health impacts, and impact on aquatic ecosystems, the toxic pressure, can be estimated. For ecosystems the toxic pressure is the parameter of interest. It expresses the Potentially Affected Fraction of species (PAF), given an ambient exposure to one chemical or to a mixture, which is a quantitative measure of potential ecological impacts (impacts on biodiversity). The quantitative insights that are generated are closely associated with the practical need to assess the likelihood that chemical pollution may be a cause of impacted water quality in the Assessment of Impact-step (Annex II). In this schematic approach a number of ‘carriages’ are distinguished:
Production of chemicals (1)
What is the amount of one or more compounds produced/used (t/y)? Starting option could be e.g. the EU REACH database; SOLUTIONS has extracted info on 12,891 chemicals with EU-tonnage of which 6,379 are identified compounds (mono constituent chemicals); total use volume is estimated 735x106 t/y FS065. Other data sources were collated for other substance groups (pesticides, pharmaceuticals). Parts of such data sets are proprietary by European law. For new, emerging chemicals similar types of data need be collated, when not yet provided by the data storage and retrieval system of SOLUTIONS (Integrated Data Portal for SOLUTIONS, IDPS) FS024.

RiBaTox – Full Set of Fact Sheets
112
Emission of chemicals (2)
Based on known use and losses of identified chemicals total emissions (to air, water, soil) can be estimated for each compound, leading to an estimated total emission of 15x106 t/y for the sub-selection of REACH chemicals. Emission models have been constructed for various compound groups in SOLUTIONS FS017. For new, emerging chemicals similar types of data need be collated, when not yet provided by the data storage and retrieval system of SOLUTIONS (Integrated Data Portal for SOLUTIONS, IDPS) FS014.
Fate and behaviour of chemicals (3)
Using physico-chemical properties of each of the chemicals the fate (% to air, water, soil) as well as their behaviour (e.g. degradation, ...) is modelled FS018. For new, emerging chemicals similar types of data need be collated, when not yet provided by the data storage and retrieval system of SOLUTIONS (Integrated Data Portal for SOLUTIONS, IDPS).
Dilution and exposure (4)
In Europe approx. 32,000 hydrological units have been defined. Hydrological information is used to define transport (rivers, ...) and exposure: the estimated concentration of each compound is estimated (in space and time).
Human health impacts and Ecotoxicity (5)
Human health and environmental risks are quantified on the basis of a tiered assessment protocol, in which exposures are compared to trigger values (concentrations representing a protection level for human health and/or the environment) in a tiered approach FS019. For ecological risk assessment, several hundreds of thousands of ecotoxicological data have been collated (e.g. EC50, NOEC) and curated (e.g., double entries removed), covering more than 12,000 chemicals. These data are used to model the ecotoxicological effects of these compounds in a higher-tier assessment, but also to estimate to total toxic pressure, including chemicals for which less data are available. This higher-tier assessment aims to provide quantitative insight into expected biodiversity impacts.
The toxic pressure of chemicals on human health and aquatic ecosystems can be quantified starting at any step in the aforementioned train. One may start with emissions and predicted modelled concentrations, but also one may use measured concentrations (monitoring data). Whether modelled or measured concentrations are used, the next steps can proceed to obtain final toxic pressure information for samples, sub-catchments, catchments or water bodies FS019.
Input to management strategies
The WFD-Annex II step of Assessment of Impacts suggests the use of model-based insights in the evaluation of the likelihood that chemical pollution affects water quality. Therefore, the eventual model outputs can be used for evaluation this likelihood. In order to make further profitable use of toxic pressure information, the model outputs can also be used to summarize the toxic pressure of a suite of water bodies in the ‘chemical footprint’ (6) FS070, and to assess its changes e.g. as result of technical/non-technical abatement options (8) FS028. In addition, foodweb vulnerability, including human exposure, can be modelled (7) FS026, FS027, FS037.
References
1. van Gils, J., R. Schueder, C. Chrzanowski, A. Focks, H. Baveco, L. Posthuma, I. Cousins, C. Lindim, S. Kutsarova, S. Dimitrov, A. Kortenkamp, S. Ermler, G. Massman, J.Greskowiak, G. Schüürmann, R. Kuehne, D. van de Meent and D. de Zwart, 2018. Modelling framework and model-based assessment for substance screening. Solutions Deliverable D14.1 ED141.

RiBaTox – Full Set of Fact Sheets
113
2. van Gils, J., L. Posthuma, M. Zijp, A. van Wezel, R. Sjerps, D. Bunke, D. de Zwart, Dik van de Meent, I. Cousins, C. Lindim, S. Kutsarova, O. Mekenyan, J. Hollender, J. Slobodnik, R. Kühne and A. Kortenkamp, 2018. Europe wide modelling and simulations of emerging pollutants risk including think tank scenarios. Solutions Deliverable D14.2 ED142.
Keywords
WFD-Annex II: Assessment of Impacts, chemicals production, chemicals use, emissions, fate, ecotoxicity, effects, chemical pressure, aquatic ecosystems, chemical footprint, abatement, foodweb vulnerability
Related topics
Modelling strategies FS060 Sources and Emissions models FS017 Spatially and temporally-resolved transport and fate modelling FS018 REACH approach to 'typical' exposure estimation FS065 Ecotoxicological modelling to estimate the total toxic pressure of water bodies FS037 Risk Characterisation Model FS019 Combination Toxicity Calculator (CTC) FS026 Estimation of toxic pressure from distributions FS086 Identification of new substances posing a high risk FS014 Risk based prioritization (RBP) of emerging contaminants in drinking water FS027 Technical and non-technical abatement options FS028 Footprint reduction FS070
Contact information
Jos van Gils ([email protected]) Deltares, Delft, The Netherlands Leo Posthuma ([email protected]) RIVM - Centre for Sustainability, Environment and Health, Bilthoven, The Netherlands

RiBaTox – Full Set of Fact Sheets
114
FP7 SOLUTIONS project - Fact Sheet 017
Name SOLUTIONS Tool or Service
FS017 SOLUTIONS emissions model
Description
1. Objective
You have reached this Fact Sheet because the models used in SOLUTIONS use emission rates into the environment as starting point. In fact, because the models used in SOLUTIONS calculate steady-state concentrations from mass balance equations in which all processes are assumed to obey first-order kinetics, predicted concentrations in air, water and soil are directly proportional to the assumed emission rates. In order to quantitatively describe and predict effects of the presence of chemicals in the environment, we must have means to estimate rates of emission for all chemical substances that possibly contribute to toxic impacts of chemicals on humans and ecosystems.
The SOLUTIONS emissions model is designed to estimate emissions of chemical substances regulated in Europe under various regulations, i.e. so-called ‘industrial chemicals’ (REACH regulation [Ref01]), active ingredients of crop protection products (pesticides regulation, [Ref04]) and active ingredients of medicinal products (pharmaceuticals regulation, [Ref05]).
2. Methodology
The SOLUTIONS emissions model builds on existing approaches, after adjustment and expansion to include ALL chemical substances currently used in Europe. Flow schemes of the Sources and Emissions Model are depicted in the Figures 1a and b. A scientific publication documenting the SOLUTIONS emissions model has been submitted [Ref06].
Total emission into the environment is modelled as the product of use volume, release fraction and fraction not retained in the process of waste treatment:
,
where Ei,j,k denotes the EU-wide emission rate [M/T] of substance i from use j into environmental medium k, represents the volume of substance i, used in activity category j, RFj,k is the fraction [-] of this use that is released into medium k and Fstpi,k denotes the fraction of substance i released to medium k upon sewage treatment.
The SOLUTIONS emission model accounts for retention of chemicals upon waste treatment. Known, but spatially variable fractions emissions to water are assumed to be treated in (communal or industrial) activated sludge systems. Fractions of sewage treatment influents that are released to the environment eventually (by escape to air, with treatment effluent to surface water, or with sewage sludge to soil) vary greatly from chemical to chemical, and are estimated using the STP model SimpleTreat, as recommended by the European Commission in the REACH regulation [Ref01].
EU-wide emission rates are distributed in space by means of detailed maps of variables correlated to the emission intensity (‘locator maps‘). The substance flows are further processed into emissions to air, water and soil, taking into account regional differences in waste water and solid waste management. In the SOLUTIONS project, maps specifying the presence and intensity of abatement options have been included in the simulation of emission rates with this model (see e.g. Figure 2. Emission estimation is done differently for different categories of chemicals.

RiBaTox – Full Set of Fact Sheets
115
Figure 1a. Flow scheme of the Sources and Emissions Model: from substance use to spatially distributed losses
Figure 1b. Flow scheme of the Sources and Emissions Model: from spatially distributed losses to emissions
REACH substances For REACH substances, the so-called EU tonnage is taken as amount used. Under the EU regulation of chemical substances, such substance-specific tonnages [M/T]
must be submitted to the European Chemicals Agency ECHA, as part of the registration. EU tonnages of chemicals registered under REACH until April 2015 have been made available for analysis in the SOLUTIONS project, with the restriction that such data cannot be published or shared with third parties.
Fractions of REACH substances released into the environment depend greatly on the way chemicals are used. In the REACH Guidance, the European Commission has offered worst-case values for fractions released in the so-called ERC (Environmental Release Category) tables. Chemical industry has added their spERC (specific Environmental Release Category] tables, claiming to present realistic estimates of fractions released into air, water and soil for a large number of uses. The fractions of the total use volume that are entered into spERC categories are not part of the dossiers submitted for registration under REACH. Such fractions are generally not even known.

RiBaTox – Full Set of Fact Sheets
116
The SOLUTIONS emission estimation model distinguishes 12 so-called ProdUse categories: 1. Manufacturing, import, export 2. Distribution, formulation 3. Industrial processing 4. Use in agriculture 5. Use in medicine 6. Wide-dispersive use in 'down-the-drain' household products 7. Other wide-dispersive uses 8. Wide-dispersive 'low-release' uses in 'durable' products 9. Use as fuel 10. Other stage-ii uses 11. Treatment, recycling 12. Solid waste disposal
Fractions of the use volume released to air, water and soil in these production/use categories are derived from the spERC table by taking weighted averages of the spERC categories that are likely to go into these production/use categories. The ProdUse categories have been chosen to optimize the possibility to make the best estimate of fractions released, taking the spERC table as starting point.
EU-wide emissions are ‘delocalized’ by means of relative population densities to yield emissions to the various sub-catchments
Pesticides Emission estimation for active ingredients of crop protection products is done by means of a different estimation procedure. Unlike the REACH substances, market volumes of pesticides, although known to regulators, have not been made available for analysis to the SOLUTIONS project. Instead, the SOLUTIONS project has adopted the results from a study by JRC, which used the so-called harvested area approach to estimating emissions to air, water and soil ([Ref02], [Ref03]).
Sub-catchment specific emission rates have been estimated in the SOLUTIONS project for 436 active ingredients of crop protection products, as input to the ‘SOLUTIONS modelling train’.
Pharmaceuticals Emission estimation for active ingredients of medicines is based on EU-wide per-capita sales or consumption rates of medicines. Although sales/use data of pharmaceuticals are equally hard to get as sales data of pesticides, comprehensive sets of sales data were obtained for a small number of countries; data for larger sets of countries could be obtained only for a much smaller set of substances. Using these sparse data, per-capita consumption rates could be estimated in the SOLUTIONS project for over 1,000 active ingredients of medicines used in Europe.
EU-wide per-capita emissions are ‘delocalized’ by means of relative population densities to yield emissions to the various sub-catchments.
3. Application
Sub-catchment specific emission rates have been estimated in the SOLUTIONS project for over 14,000 REACH substances, representing a total market volume of over 3 billion tons per year. These emission rates have been made available to SOLUTIONS fate modellers FS018 via the Integrated Data Portal for SOLUTIONS (IDPS), as input to further calculations in the ‘SOLUTIONS modelling train’. Since these emission estimations are based on confidential market volume information, they cannot be made public.
Sub-catchment specific emission rates for 436 active ingredients of crop protection products have

RiBaTox – Full Set of Fact Sheets
117
been shared among SOLUTIONS partners via internal reports. Similarly, sub-catchment-specific emission rates for over 1,000 active ingredients of medicines have been shared with SOLUTIONS partners via the Integrated Data Portal for SOLUTIONS (IDPS).
mg/m2/y
Bisphenol A (80-05-7)Emissions to water
Figure 2. Initial version of simulated direct emissions to surface water (example taken from the Danube Case Study).
References
1. EC, 2006. Regulation (EC) No 1907/2006 of the European Parliament and of the Council of 18 December 2006 concerning the Registration, Evaluation, Authorisation and Restriction of Chemicals (REACH). OJ L 396, 30.12.2006, p.1; http://eur-lex.europa.eu/legal-content/EN/TXT/?uri=CELEX:32000L0060
2. Sala S., Benini L., Mancini L., Ponsioen T., Laurent A., Van Zelm R., Stam G., Goralczyk M. and Pant R., 2014. Methodology for building LCA-compliant national inventories of emissions and resource extraction. JRC Science and Policy Reports JRC92036. Luxembourg, Publication Office of the European Union; https://publications.europa.eu/en/publication-detail/-/publication/15fc94df-2613-452f-a537-9611e69db5bd/language-en/format-PDF
3. Sala S., Benini L., Mancini L. and Pant R., 2015. Integrated assessment of environmental impact of Europe in 2010: data sources and extrapolation strategies for calculating normalisation factors. Int. J. Life Cycle Assess. 20:1568-1585; https://doi.org/10.1007/s11367-015-0958-8
4. EC, 2009. Regulation (EC) No. 1107/2009 of the European Parliament and of the Council of 21 October 2009, concerning the placing of plant protection products on the market and repealing Council Directives 79/117/EEC and 91/414/EEC. OJ L 309, 24.11.2009; http://eur-lex.europa.eu/legal-content/EN/TXT/?qid=1519309548078&uri=CELEX:32009R1107
5. EC, 2004. Regulation (EC) No 726/2004 of the European Parliament and of the Council of 11 March 2004, laying down Community procedures for the authorisation and supervision of medicinal products for human and veterinary use and establishing a European Medicines Agency. OJ L 136/1, 30.4.2004; http://eur-lex.europa.eu/legal-content/EN/TXT/?qid=1519309602734&uri=CELEX:32004R0726

RiBaTox – Full Set of Fact Sheets
118
6. Van de Meent D., De Zwart D. and Posthuma L., 2018. Screening level estimation of release rates of currently used chemicals to the environment. Application to solution-oriented assessment of impacts on aquatic ecosystems. Environ. Toxicol. Chem. (submitted)
Keywords
Emissions, emerging compounds, modelling
Related topics
Modelling strategies FS060 From emissions to effects: Model Train for SOLUTIONS FS016 Spatially and temporally-resolved transport and fate modelling FS018 REACH approach to 'typical' exposure estimation FS065 Risk Characterisation Model FS019 Ecological risk quantification via Species Sensitivity Distributions (SSD) FS035 Ecotoxicological modelling to estimate the total toxic pressure of water bodies FS037 Combination Toxicity Calculator (CTC) FS026 Estimation of toxic pressure from distributions FS086 Identification of new substances posing a high risk FS014 Risk based prioritization (RBP) of emerging contaminants in drinking water. FS027
Contact information
Dik van de Meent ([email protected]) Mermayde, Groet, The Netherlands
Jos van Gils ([email protected]) Deltares, Delft, The Netherlands

RiBaTox – Full Set of Fact Sheets
119
FP7 SOLUTIONS project - Fact Sheet 018
Name SOLUTIONS Tool or Service
FS018 Spatially and temporally-resolved transport and fate modelling
Description
1. Objective
You have reached this Fact Sheet because you are interested in modelling concentrations and/or fate of pollutants in river basins, notably by using exposure assessment models.
The objective of the SOLUTIONS Fate & Transport model STREAM-EU is to predict mass and concentrations of organic pollutants in European surface waters as a function of space and time, dependent on information about (a) spatially varying emissions , (b) physico-chemical properties of the pollutants, and (3) time varying hydrological data (Figure 1) [Ref01].
2. Methodology
STREAM-EU is based on the fugacity concept and predicts transient state environmental concentrations in water, sediment, soil and groundwater compartments using sub-catchments as the spatial unit. All relevant processes affecting the fate of emerging contaminants have been incorporated, including partitioning, volatilisation, biodegradation, physical state changes, dissociation and hydrolysis. The model includes novel approaches for ionizing pollutants which do not follow the classical partitioning concepts [Ref03]. STREAM-EU was implemented for SOLUTIONS in the open source water quality framework Delft3D-WAQ (http://oss.deltares.nl/web/delft3d/home). The transport part of model is driven by temporally and spatially distributed basin hydrology data provided by the pan-European model E-HYPE [Ref02].
3. Application
The model calculates mass and concentrations of organic compounds as a function of space and time, in environmental compartments (water, sediment, soil, snow cover, groundwater) and in phases within those environmental compartments (water, particulate and dissolved organic carbon (POC and DOC) phases). Mass fluxes between compartments can also be computed. Various statistic properties can be derived to drive the comparison with environmental quality standards (EQS) or to carry out subsequent assessments of the likelihood that chemical pollutants or mixture pose harm to human health or aquatic life, in the Assessment of Impacts-step (WFD-Annex II).

RiBaTox – Full Set of Fact Sheets
120
Figure 1. STREAM-EU fate & transport model and model inputs and outputs.
Figure 2. STREAM-EU predicted concentrations of PFOS in Danube river waters, compared to Joint Danube Survey (JDS3) observed concentrations (copied from Lindim et al., 2016a [Ref01]).

RiBaTox – Full Set of Fact Sheets
121
Figure 3. Catchment storage and estuarine export predictions of PFOA in the major European catchments (copied from Lindim et al., 2016b [Ref04]).
References
1. Lindim, C., J. van Gils and I.T. Cousins, 2016a. A large-scale model for simulating the fate & transport of organic contaminants in river basins. Chemosphere, 144: 803-810; https://doi.org/10.1016/j.chemosphere.2015.09.051
2. Donnelly, C., Arheimer, B., Capell, R., Dahne, J. and Strömqvist, J., 2013. Regional overview of nutrient load in Europe – challenges when using a large-scale model approach, E-HYPE. Understanding fresh-water quality problems in a changing world. Proceedings of IAHS-IAPSO-IASPEI Assembly, Sweden, July 2013. IAHS Publ. 361: 49-58; https://iahs.info/uploads/dms/15569.361%2049-58.pdf
3. Lindim, C., van Gils, J., Georgieva, D., Mekenyan, O. and Cousins, I.T., 2016c. Evaluation of human pharmaceutical emissions and concentrations in Swedish river basins. Sci. Total Environ., 572: 508-519; https://doi.org/10.1016/j.scitotenv.2016.08.074
4. Lindim, C., Van Gils, J. and Cousins, I.T., 2016b. Europe-wide estuarine export and surface water concentrations of PFOS and PFOA. Water Res., 103: 124-132; https://doi.org/10.1016/j.watres.2016.07.024
Keywords
Fate & transport model, River basins, Europe, Organic contaminants, Exposure
Related topics
Modelling strategies FS060 From emissions to effects: Model Train for SOLUTIONS FS016 SOLUTIONS Emissions Model FS017

RiBaTox – Full Set of Fact Sheets
122
REACH approach to 'typical' exposure estimation FS065 Risk Characterisation Model FS019 Ecological risk quantification via Species Sensitivity Distributions (SSD) FS035 Ecotoxicological modelling to estimate the total toxic pressure of water bodies FS037 Combination Toxicity Calculator (CTC) FS026 Estimation of toxic pressure from distributions FS086 Identification of new substances posing a high risk FS014 Risk based prioritization (RBP) of emerging contaminants in drinking water. FS027
Contact information
STREAM-EU: Claudia Lindim ([email protected]; [email protected]), Ian Cousins ([email protected]) Stockholm University – Department of Analytical Chemistry and Environmental Science (ACES), Stockholm, Sweden Hydrology and Delft3D-WAQ framework: Jos van Gils ([email protected]) Deltares, Delft, The Netherlands

RiBaTox – Full Set of Fact Sheets
123
FP7 SOLUTIONS project - Fact Sheet 065
Name SOLUTIONS Tool or Service
FS065 REACH-compatible approach to 'typical' exposure estimation
Description
1. Objective
You have reached this Fact Sheet because you are interested in risk assessment and management of many chemicals and their mixtures, while requiring alternatives to the substance-by substance assessment of expected toxic impacts of chemical substances on aquatic ecosystems and the associated risk management. Most probably you require this alternative because data on exposure concentrations and/or critical effects concentrations of many chemicals are not available, or can be obtained at unacceptably high cost, which is often the case when dealing with the many substances regulated under the EU REACH regulation [Ref01]. REACH requires that registrants demonstrate the possibility that substances can be used safely in a Chemical Safety Report, before the substance can be registered and thus allowed to be marketed.
The REACH approach to chemical safety assessment is to estimate expected environmental concentrations (probable effects concentration, PEC) in so-called ‘typical’ environments at local, regional and continental spatial scales, and to compare them to predicted no-effect concentrations (PNEC) in (aquatic) ecosystems. The REACH approach adopts multimedia fate modelling of chemical substances in ‘typical environments’. This is based on EU-wide use volumes and best estimates of emission rates into air, water and soil at EU-scale and best estimates of physical and chemical substance properties. The ‘possibility to be used safely’ is believed to be ‘demonstrated’ under REACH, when PNEC does not exceed PEC in any modelled ‘typical’ situation. The REACH Guidance describes how ‘possibility to be used safely’ can be demonstrated for this purpose.
The SOLUTIONS modelling train FS016 has proven to be a suitable, i.e. scientifically tested, yet simple, tool alternative to the very data-demanding REACH procedure. This Factsheet explains how the SOLUTIONS modelling train can be used to deliver ‘REACH-compatible’ exposure estimations and test whether the probability that exposure concentrations exceed critical effect concentrations is low enough to believe that a chemical does not significantly contribute to ambient toxic pressures in ‘typical environments’.
2. Methodology Under REACH, estimation of exposure- and effect concentrations (PEC and PNEC) in ‘typical’ local, regional and continental environments is done in the European Union Substances Evaluation System EUSES [Ref02], which employs the multimedia models SimpleBox [Ref03] and SimpleTreat [Ref04]. The SOLUTIONS modelling train FS016 uses slightly modified (i.e. improved) versions of these models to estimate exposure concentrations of all (5,000+) substances currently registered under REACH in all (3,500+) sub-catchments of EU river systems. Van de Meent et al. [Ref05] have described how the SOLUTIONS exposure modelling system can be used to calculate REACH-compatible concentrations and toxic pressures in aquatic ecosystems, and apply these to obtain useful estimates of • distributions of the concentrations of all currently-used chemicals in ‘typical EU water’, • distributions of critical effect concentrations of all currently-used chemicals, • toxic pressures of individual chemicals and their mixtures in ‘EU water’.

RiBaTox – Full Set of Fact Sheets
124
Van de Meent et al. [Ref05] have shown how this information on chemical substances can be used to serve the purpose of demonstrating safe use of chemicals as meant in REACH.
In short, EU-wide emissions are estimated using the SOLUTIONS emission estimation module described in the SOLUTIONS emissions model FS017. Emission rates for ‘typical’ local, regional and continental scales are derived from EU-wide emission rates by scaling according to population density or land use. Exposure concentrations in ‘EU water’ are then calculated by means of multimedia fate modelling. Parameters of the distributions of critical effect concentrations are derived as described in –the Estimation of toxic pressure from distributions FS086. Finally, toxic pressures in aquatic ecosystems are derived from overlap of the distributions of exposure concentrations and critical effect concentrations, by determining the probability that exposure concentrations exceed critical effect concentrations, using the Van Straalen-Aldenberg convolution integral (Figure 1).
0.0
0.5
1.0
0.00
0.08
0.15
0.23
0.30
-15 -12 -9 -6 -3 0
CUM
ULA
TIVE
PRO
BABI
LITY
of H
a50
prob
abili
ty d
ensi
ty o
f log
aW
log a
Exceedance of critical activities in water by REACH substances
Figure 1: Toxic pressure in ‘regional EU fresh water’, obtained from convolution of the distribution of
chemical activities in water (Gaussian probability density function pdfaW, green, left) with the distribution of critical effect limits (Gaussian cumulative distribution function CDFHa50, red, right). In this example, the probability that the activity in water exceeds the critical effect activity for narcosis of 0.01 in ‘regional EU fresh water’ equals approximately 1%.
3. Application
Application of the SOLUTIONS approach to risk modelling to the entire suite of chemicals currently in use in the EU yields results that can be used directly in Chemical Safety Assessment as meant in the REACH regulation. Applied to REACH risk assessment for ‘typical EU water’, the SOLUTIONS modelling train yields expected steady-state concentrations of chemical substances in ‘EU waters’ and estimated acute HC50 of chemical substances. From which then the probability that ‘exposure’ exceeds ‘effect’ in ‘EU waters’ can be calculated: (i) for each chemical individually and (ii) for all chemicals together. This result can then be used to reason (iii) whether ambient mixture toxic pressures in aquatic systems are need further attention and (iv) whether individual chemicals contribute sufficiently little to overall ambient toxic pressure in water to consider use of the chemical to be registered as ‘safe’.
This application is made available to regulators, scientists, risk assessors and risk managers in an Excel spreadsheet format [Ref05].
RiBaTox – Full Set of Fact Sheets
125
References
1. European Commission, 2006. Regulation (EC) No 1907/2006 of the European Parliament and of the Council of 18 December 2006 on the Registration, Evaluation, Authorisation and Restriction of Chemicals (REACH). Off. J. Eur. Comm. L 396: p.1; http://eur-lex.europa.eu/legal-content/EN/TXT/?uri=CELEX:32006R1907
2. Vermeire TG, Jager DT, Bussian B, Devillers J, den Haan K, Hansen B, Lundberg I, Niessen H, Robertson S, Tyle H, and Van der Zandt PT, 1997. European Union System for the Evaluation of Substances (EUSES). Principles and structure. Chemosphere, 34: 1823-1836; https://doi.org/10.1016/j.chemosphere.2005.01.062
3. Hollander A, Schoorl M and Van de Meent D., 2016. SimpleBox 4.0: Improving the model while keeping it simple. Chemosphere, 148: 99-107; https://doi.org/10.1016/j.chemosphere.2016.01.006
4. Lautz LS, Struijs J, Nolte TM, Breure AM, Van der Grinten E, Van de Meent D and Van Zelm R., 2017. Evaluation of SimpleTreat 4.0: Simulations of pharmaceutical removal in wastewater treatment plant facilities. Chemosphere, 168: 870-876; https://doi.org/10.1016/j.chemosphere.2016.10.123
5. Van de Meent D, De Zwart D and Posthuma L. SimpleBoxTreat4Reach. Application of the SOLUTIONS modelling train to Chemical Safety Assessment under REACH. Chemosphere (to be submitted).
Keywords
REACH, chemical safety assessment, toxicity assessment, solutions model train, PEC, PNEC, mixture toxicity
Related topics
Modelling strategies FS060 From emissions to effects: Model Train for SOLUTIONS FS016 SOLUTIONS Emissions Model FS017 Spatially and temporally-resolved transport and fate modelling FS018 Risk Characterisation Model FS019 Ecological risk quantification via Species Sensitivity Distributions (SSD) FS035 Ecotoxicological modelling to estimate the total toxic pressure of water bodies FS037 Combination Toxicity Calculator (CTC) FS026 Estimation of toxic pressure from distributions FS086 Identification of new substances posing a high risk FS014 Risk based prioritization (RBP) of emerging contaminants in drinking water FS027
Contact information
Dik van de Meent ([email protected]) Dick de Zwart ([email protected]) Mermayde, Groet, Netherlands
Leo Posthuma ([email protected]) RIVM, Bilthoven, Netherlands
Jos van Gils ([email protected]) Deltares, Delft, Netherlands
RiBaTox – Full Set of Fact Sheets
126
FP7 SOLUTIONS project - Fact Sheet 019
Name SOLUTIONS Tool or Service
FS019 Risk Characterisation Model: Advanced tiered mixture risk assessment
Description
1. Objective
You have reached this Fact Sheet because you are interested in the assessment of ecological risks as a result of mixtures of contaminants, in relation to the Assessment of Impacts-step of WFD-Annex II. In addition you like to know about the possibilities to use risk characterisation models for this purpose.
The Risk Characterisation Model carries out human and ecological risk modelling of pollutant mixtures to predict the effects and associated risks of mixtures and chemicals, to assess, identify and prioritise chemicals and mixtures of chemicals which are known to be present in Europe’s river basins.
2. Methodology
The Risk Characterisation Model provides integrated risk estimates for both human health and ecology using hazard indices and mixture toxicity concepts. A flow scheme of the model is presented in Figure 1. It focuses on an area of overlap between human and ecological risk assessment. For human risk assessments the model accounts for two routes of exposure: consumption of fish (“are fish caught in rivers fit for human consumption?”) and drinking water (“is it safe?”). The ecological risk calculation evaluates external water concentrations and internal concentrations in fish, using a variety of endpoints. The model deals with data gaps by harvesting modelled toxicity data and or concepts like thresholds of toxicological relevance (TTC) as surrogates.

RiBaTox – Full Set of Fact Sheets
127
Figure 1. Flow scheme of the Risk Characterisation Model.
The model also includes higher tier approaches for the quantification of ecosystem risks. It does so via calculation of the multi-substance toxic pressure (msPAF or ‘multi-substance Potentially Affected Fraction of species’). In addition, the model assesses selected population responses for species at risk, using Individual Based Models (IBMs) and toxico-kinetic/toxico-dynamic (TK/TD) modules.
During model development and validation, the confidence in the model has been increased by supportive aquatic food web model analyses and alignment with Ecological Status data.
The model output is expressed in quantities like the toxic stress for specific modes of actions, the effect from selected mixtures, the risk to specific ecosystems or biological quality elements, or impacts on specific populations and traits.
3. Application
Experimental mixture studies have shown that the toxicity of the mixture is usually greater than that of the most toxic component [Ref01]. Furthermore, substantial mixture effects can occur even though all components in the mixture are present at levels that individually are without observable effects [Ref02]. These observations have lent urgency to the need of evaluating the risks from multiple pollutants both to humans and wildlife. Here, we present a common decision tree and tiered work flow scheme for performing human and ecological mixture risk assessments (MRA) in the context of assessments of multiple pollutants in European rivers. The decision tree serves the purpose of establishing the likelihood that chemicals or their mixtures pose harm to humans or wildlife, in the Assessment of Impacts-step of WFD Annex II, with refined insights in progressive tiers.

RiBaTox – Full Set of Fact Sheets
128
Building on schemes that have been devised previously to suit different contexts (summarized in [Ref03]) we developed a decision tree and tiered work flow for application to MRAs of the pollutant cocktail found in European surface waters. The scheme is focused on MRAs for humans and single aquatic species or species groups, including algae, daphnia and fish. We tested the utility of the proposed scheme by using data on the levels of more than 200 chemicals that occur together in the river Danube, from the Joint Danube Survey 3 (JDS3) FS042. The proposed scheme starts from measured concentrations of chemicals co-occurring in water and fish. It builds on the principle of a tiered approach, where unnecessary expenditure of resources is avoided by offering the possibility of discontinuing the analysis when cumulative exposures are judged to be acceptable on the basis of crude and simple worst-case assumptions. The analysis is refined when previous tiers reveal clearly unacceptable exposures, with refinements based on best-case assumptions of minimum expectable risks. The suggested workflow is divided into three main tiers in which the distorting influence of different assessment factors present in regulatory values is successively removed, and increasingly sophisticated assumptions about modes of action are introduced:
• Tier 1 MRA, using regulatory values including Environmental Quality Standards (EQS) in conjunction with the so-called Hazard Index method (HI), including conceptual equivalents such as ∑PEC/PNEC ratios,
• Tier 2 MRA, based on the assumption of dose addition (DA) or concentration addition (CA) of all mixture components contributing to a common endpoint (adverse outcome) in the same species or species group (humans and/or fish), regardless of modes of action (MoA),
• Tier 3 MRA, using the so-called mixed model (MM) approach, i.e. assuming DA (or CA) for sub-groups of similarly acting mixture components (contributing to a common endpoint by a common MoA) and independent action (IA) between such groups, including completely similar (DA or CA) and completely dissimilar action (IA) as the two possible extreme cases of the MM approach.
Considering the practical difficulties in fulfilling the data demands (which increase in the order of DA or CA, IA, and MM), the Tier 2 and Tier 3 assessments are each sub-structured into a number of sub-tiers. This sub-tiering is designed to evaluate whether a definite conclusion can be reached without completely fulfilling all data requirements that apply to the respective main tiers. For more than 50% of the >200 chemicals monitored in the JDS3, toxicity data are missing alltogether. It was therefore necessary to bridge these data gaps by making assumptions about their toxicity which was achieved by adopting probabilistic approaches similar to the eco-TTC concept. For each of the 54 sites along the river Danube the chemicals were ranked in terms of their contribution to a (modelled) mixture effect, separately for algae, daphnia and fish. It was found that the overall mixture toxicity was driven by only approximately 10 chemicals, depending on the site. Substances not yet defined as priority substances under the EU Water Framework Directive made a substantial contribution to combined exposures in algae, daphnia and fish. Combined risks to humans were assessed possible by evaluating whether water drawn from the Danube would be fit for human consumption. An analysis based on conservative assumptions revealed the need for refinement, but overall, exposures of concern could not be detected at higher tiers of the assessment. An array of Europe-wide and basin-specific applications of the mixture toxic pressure assessment, and associated chemical footprints, has been made in order to quantify the site/time specific likelihood that pollutant mixtures affect ecological status. These examples are summarized in related Fact Sheets, e.g. FS035, FS037, FS085, FS070.

RiBaTox – Full Set of Fact Sheets
129
References
1. Kortenkamp A, Backhaus T and Faust M, 2009. State of the art report on mixture toxicity. Directorate General for the Environment: Report to the EU Commission. Study Contract No 070307/2007/485103/ETU/D.1; http://ec.europa.eu/environment/chemicals/pdf/report_Mixture toxicity.pdf
2. Kortenkamp, A., Faust, M., Scholze, M. and Backhaus, T., 2007. Low-level exposure to multiple chemicals - reasons for health concerns? Environ. Health Perspect, 115(Suppl 1): 106-114; https://doi.org/10.1289/ehp.9358
3. Price P, Dhein E, Hamer M, Han X, Heneweer M, Junghans M, Kunz P, Magyar C, Penning H and Rodriguez C, 2012. A decision tree for assessing effects from exposures to multiple substances. Environ. Sci. Eur. 24: 26; https://doi.org/10.1186/2190-4715-24-26
Keywords
Risk modelling, Human Risk, Ecological Risk, Mixtures
Related topics
Modelling strategies FS060 From emissions to effects: Model Train for SOLUTIONS FS016 SOLUTIONS Emissions Model FS017 Spatially and temporally-resolved transport and fate modelling FS018 REACH approach to 'typical' exposure estimation FS065 Ecological risk quantification via Species Sensitivity Distributions (SSD) FS035 Ecotoxicological modelling to estimate the total toxic pressure of water bodies FS037 Combination Toxicity Calculator (CTC) FS026 Estimation of toxic pressure from distributions FS086 Identification of new substances posing a high risk FS014 Risk based prioritization (RBP) of emerging contaminants in drinking water FS027
Contact information
Andreas Kortenkamp ([email protected]) Brunel University London - Institute of Environment, Health and Societies, Uxbridge, UK
Leo Posthuma ([email protected]) RIVM - Centre for Sustainability, Environment and Health, Bilthoven, The Netherlands

RiBaTox – Full Set of Fact Sheets
130
FP7 SOLUTIONS project - Fact Sheet 035
Name SOLUTIONS Tool or Service
FS035 Ecological risk quantification via Species Sensitivity Distributions (SSD)
Description
1. Objective
You have reached this Fact Sheet because (a) monitoring data of the water bodies in your management area show that there are measured concentration of one or more chemicals, or (b) that modelling FS018 predicts that some chemicals may have enhanced concentrations in your management area. According to the WFD-Annex II, you want to establish and understand the likelihood that these enhanced concentrations can be a cause of ecological impairment (lowered Ecological Status). The pollution problem may consist of one chemical, e.g. after an accidental spill, or – more commonly – of multiple chemicals (mixtures). Whether there is a short-term release of one chemical or a longer-term presence of mixtures, there are concerns regarding the impacts of the pollution on the ecological status of the water bodies in your management area. Due to highly variable pollution events, it is likely that pollution risks vary in space (across water bodies, in a gradient from a point source emission, etc.) and in time. Species Sensitivity Distribution (SSD) modelling, in combination with mixture impact assessment modelling, offers a powerful tool to provide insight in the likelihood that (mixture) exposures cause impacts in aquatic ecosystems. Use of these models can provide insights for water bodies and for time periods (e.g. related to the use of pesticides) most affected (prioritization in place and time) and the chemicals contributing most to the ecological impact (prioritization to chemicals and chemical groups). The use of the latter information is suggested explicitly in Annex II of the WFD, and is considered a key for taking measures to reduce pollution impacts in the context of (river basin) management planning. Water managers frequently judge water quality and ecological risks of water contamination by comparing measured or predicted concentrations of individual chemicals to ambient water quality criteria (Environmental Quality Standards, listed and applied according to the Water Framework Directive). This informs them whether the concentration is considered sufficiently safe in the context of regulatory principles (the protective standards), but not whether there are no ecological impacts, not what magnitude of impacts can be expected, and not which chemicals pose the highest risk. The presence of mixtures implies the need to consider aggregated risks. The choice between alternative abatement strategies requires a quantitative impact assessment. Commonly, few compounds cause the majority of effects, but their identities vary across water bodies. Confronted with the question on water pollution in the context of a systems-level water quality analysis done to support deriving abatement strategies, the water manager remains uncertain on the likelihood of ecological impacts associated with exceedance of EQSs for selected compounds. In this context, the objectives of ‘Ecological risk quantification via Species Sensitivity Distributions’ (SSD) are:
• To convert concentration data from the concentration domain to the much more informative impact domain, in line with the Paracelsian principle that all chemicals are poisonous, but that ‘dose makes the poison’;
• To quantify the expected ecological effects of the mixtures of chemicals in water bodies, based on measured (monitoring) or predicted (modelling) concentrations of individually measured chemicals;
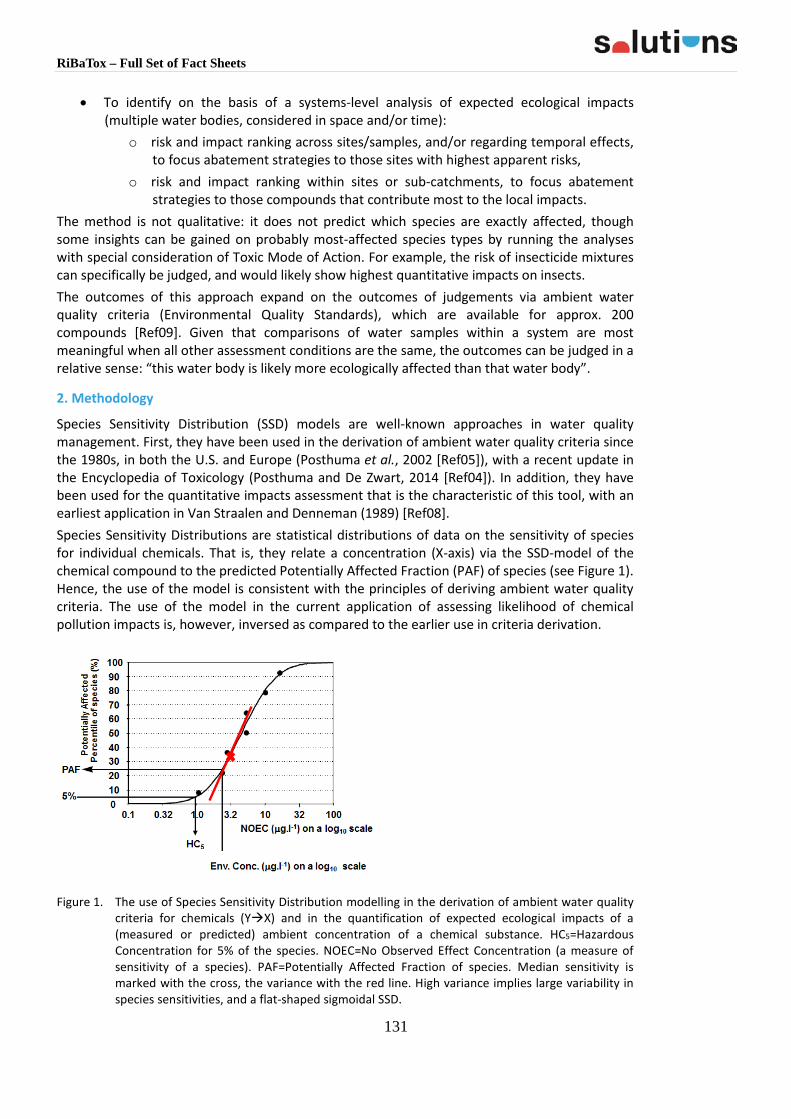
RiBaTox – Full Set of Fact Sheets
131
• To identify on the basis of a systems-level analysis of expected ecological impacts (multiple water bodies, considered in space and/or time):
o risk and impact ranking across sites/samples, and/or regarding temporal effects, to focus abatement strategies to those sites with highest apparent risks,
o risk and impact ranking within sites or sub-catchments, to focus abatement strategies to those compounds that contribute most to the local impacts.
The method is not qualitative: it does not predict which species are exactly affected, though some insights can be gained on probably most-affected species types by running the analyses with special consideration of Toxic Mode of Action. For example, the risk of insecticide mixtures can specifically be judged, and would likely show highest quantitative impacts on insects. The outcomes of this approach expand on the outcomes of judgements via ambient water quality criteria (Environmental Quality Standards), which are available for approx. 200 compounds [Ref09]. Given that comparisons of water samples within a system are most meaningful when all other assessment conditions are the same, the outcomes can be judged in a relative sense: “this water body is likely more ecologically affected than that water body”.
2. Methodology
Species Sensitivity Distribution (SSD) models are well-known approaches in water quality management. First, they have been used in the derivation of ambient water quality criteria since the 1980s, in both the U.S. and Europe (Posthuma et al., 2002 [Ref05]), with a recent update in the Encyclopedia of Toxicology (Posthuma and De Zwart, 2014 [Ref04]). In addition, they have been used for the quantitative impacts assessment that is the characteristic of this tool, with an earliest application in Van Straalen and Denneman (1989) [Ref08]. Species Sensitivity Distributions are statistical distributions of data on the sensitivity of species for individual chemicals. That is, they relate a concentration (X-axis) via the SSD-model of the chemical compound to the predicted Potentially Affected Fraction (PAF) of species (see Figure 1). Hence, the use of the model is consistent with the principles of deriving ambient water quality criteria. The use of the model in the current application of assessing likelihood of chemical pollution impacts is, however, inversed as compared to the earlier use in criteria derivation.
Figure 1. The use of Species Sensitivity Distribution modelling in the derivation of ambient water quality criteria for chemicals (YX) and in the quantification of expected ecological impacts of a (measured or predicted) ambient concentration of a chemical substance. HC5=Hazardous Concentration for 5% of the species. NOEC=No Observed Effect Concentration (a measure of sensitivity of a species). PAF=Potentially Affected Fraction of species. Median sensitivity is marked with the cross, the variance with the red line. High variance implies large variability in species sensitivities, and a flat-shaped sigmoidal SSD.

RiBaTox – Full Set of Fact Sheets
132
The model itself consists of (i) deriving the distribution of sensitivities (the SSD) from available ecotoxicity data for a compound, and (ii) then using it to quantify an expected impact level (Y, expressed as PAF) from a measured or modelled concentration of a compound. The model, therefore, operates in conjunction with another tool, a database on the two parameters of each SSD-curve FS036:
• The median sensitivity of the species for which data are available; • The variance in the sensitivity of the species for which data are available
Quantification of impacts for a surface water sample with measured or predicted concentrations of various compounds, and other water quality parameters, co-influence the final assessment that is needed for a fully-informed water management decision. That is: the information should consider (i) aggregation of predicted impacts as a consequence of the presence of mixtures, and (ii) consideration of the many water sample characteristics that determine the ecotoxicologically active fraction of a compounds’ concentration. Therefore, the separate SSD-tool (which quantifies expected impacts for a concentration of an individual chemical) is distinguished from the integrated approach to Ecological risk quantification via Species Sensitivity Distributions. In the latter case, the aggregation of impacts for mixtures, or for subgroups of compounds with the same Toxic Mode of Action (e.g. insecticides), is performed via a mixture model approach. That approach has been described by De Zwart and Posthuma (2005) [Ref02]. Thereby, bioavailable fractions are derived from total concentrations prior to SSD-modelling, addressing the role of various water parameters in affecting bioavailability, via pertinent empirical formulae (see e.g. De Zwart et al., 2008 [Ref03]; Posthuma et al., 2015 [Ref07]). At the end of SOLUTIONS project, SSD-models have been derived for 12,368 compounds, in two specific formats, related to the ecotoxicity data used: SSDs from chronic-NOEC data, and SSDs from acute-EC50 data [Ref10]. 3. Application
The results of modelling a set of predicted or measured water concentrations are expressed as multi-substance Potentially Affected Fraction (msPAF), with or without accounting for bioavailability differences between samples. The latter can be a relevant exploration, as the analysis reveals the potential maximum of exposures of the chemicals present in water, informing on the scenario that bioavailability can change along a river stretch or water body.

RiBaTox – Full Set of Fact Sheets
133
These results can be spatially mapped (example in Figure 2) to prioritize probably most-affected sites.
Figure 2. Example, for the Netherlands, of mapping modelling outcomes, which ranks sites in terms of probable ecological effects of mixtures (grey bullet: insufficient number of compounds) (from De Snoo et al., 2012 [Ref01])
The results can also be used to rank groups of chemicals within sites or sub-catchments (Figure 3). In this figure we see, for example, in to what extent heavy metals and organic chemicals, respectively, contribute to the total toxic pressure.
The model can also be applied to analyse the aggregated predicted impact of typical emission sources, such as ‘household chemicals’, or ‘industrial emissions’. Evaluation of such results proceeds as in Figure 3 (total msPAF compared to relative contributions of emission-source specific msPAFs), and helps to identify the major emission type which induced the largest fraction of potential impacts.
Figure 3. Example of overview-comparison of approx. 5,000 monitoring samples, each with multiple chemicals, summarized with the expected impacts of all chemicals. The X-axis subgroups represent the various Waterboards of the Netherlands (randomised, made anonymous). The Y-axis represents the msPAF-EC50 values for all chemicals (Total mixture, blue, the subgroup of heavy metals (red), and the subgroup of organic chemicals (purple)), with the bars indicating the average condition in a Waterboard’s set of samples.
0
0.02
0.04
0.06
0.08
0.1
0.12
msPAFraMix
msPAFraMix-HeavyMetal
msPAFraMix-Organic

RiBaTox – Full Set of Fact Sheets
134
All the types of ranking information are relevant for focusing on and designing of (cost) effective abatement strategies.
4. Interpretation
The results of the concentrations-to-quantitative ecological impact modelling can primarily be used in a comparative way, best approach ‘all other things in the comparison being equal apart from concentrations’, ceteris paribus. Higher predicted impacts (msPAF) imply a higher likelihood (and magnitude) of ecological impacts. Furthermore, various studies describe the relationship between predicted and observed impacts. In general, these studies suggest a systematic relationship between predicted and observed ecological impacts. An example is shown in Figure 4. Collaborative work of the EU-projects SOLUTIONS and MARS (www.mars-project.eu) has again corroborated that increased mixture toxic pressure implies an increased probability that Ecological Status will be affected, from High or Good to Moderate or lower [Ref11]. Evidently, the quantitative output is of magnitude, not the kind of impacts, and thus not specifically considering species of interest. There are limitations in the method, as the models are derived from (most often) laboratory-collected ecotoxicity data, each time collated for individual chemicals tested with single species. The model does not account for species-species interactions. The model is not an ecological model – it is a model that predicts an ecological impact magnitude that simply is interpreted as negligible-low-moderate-high-highest regarding the magnitude of potential ecological impacts. Highly-specific impacts, such as endocrine disruption, or behavioural effects, need be addressed by pertinent methods, designed to quantify such effects.
Figure 4. Illustration of a study comparing predicted and observed ecological impacts, with X=prediction (msPAF, potentially affected fraction of species) and Y=observed affected fraction, derived from monitoring data (from Posthuma and De Zwart, 2012 [Ref06]).
References
1. De Snoo, G.R. and M. Vijver (eds), 2012. Bestrijdingsmiddelen en water kwaliteit [Plant protection products and water quality]. Universiteit Leiden - CML, Leiden, the

RiBaTox – Full Set of Fact Sheets
135
Netherlands, pp.176; https://openaccess.leidenuniv.nl/handle/1887/19252 2. De Zwart, D. and L. Posthuma, 2005. Complex mixture toxicity for single and multiple
species: Proposed methodologies. Environ. Toxicol. Chem. 24: 2665-2676; https://doi.org/10.1897/04-639R.1
3. De Zwart, D., A. Warne, V.E. Forbes, L. Posthuma, W. Peijnenburg and D. Van de Meent, 2008. Matrix and media extrapolation. In: K. Solomon, T. Brock, D. De Zwart, S.D. Dyer, L. Posthuma, S. Richards, H. Sanderson, P. Sibley and P.J. Van den Brink (eds). Extrapolation practice for ecotoxicological effect characterization of chemicals. CRC-Press, Boca Raton, USA, pp.33-74;
4. Posthuma, L. and D. De Zwart, 2014. Species Sensitivity Distributions. Encyclopedia of Toxicology (3rd ed.). Elsevier, Academic Press, Amsterdam, pp. 363–368; https://www.elsevier.com/books/encyclopedia-of-toxicology/wexler/978-0-12-386454-3
5. Posthuma, L., G.W. Suter and T.P. Traas (Eds), 2002. Species sensitivity distributions in ecotoxicology. CRC-Press, Boca Raton, USA, pp.616;
6. Posthuma, L. and D. De Zwart, 2012. Predicted mixture toxic pressure relates to observed fraction of benthic macrofauna species impacted by contaminant mixtures. Environ. Toxicol. Chem. 31: 2175–2188; https://doi.org/10.1002/etc.1923
7. Posthuma, L., D. De Zwart, L. Osté, R. Van der Oost and J. Postma, 2015. Handreiking systeemanalyse met behulp van de Ecologische Sleutelfactoren: Toxiciteit (ESF 8). (Guidance on the execution of a systems-level water quality analysis via Ecological Key Factors: Toxicity (EKF8)). STOWA, Amersfoort, the Netherlands, pp.57;
8. Van Straalen, N.M. and C.A.J. Denneman, 1989. Ecotoxicological evaluation of soil quality criteria. Ecotox. Environ. Safe. 18: 241-251; https://doi.org/10.1016/0147-6513(89)90018-3
9. Arle, J., Mohaupt, V. and Kirst, I., 2016. Monitoring of surface waters in Germany under the Water Framework Directive — A Review of Approaches, Methods and Results. Water, 8: 217; https://doi.org/10.3390/w8060217
10. Posthuma, L., Van Gils, J., Zijp, M.C., Van de Meent, D. and De Zwart, D., 2018. Species sensitivity distributions for use in environmental protection, assessment and management of aquatic ecosystems for 12,386 chemicals. Environ. Toxicol. Chem. (submitted).
11. Posthuma, L., Zijp, M.C., De Zwart, D., Van de Meent, D., Birk, S., Globevnik, L., Koprivsek, M., Fochs, A. and Van Gils, J. Chemical mixtures impose limitations to the Ecological Status of European surface water. (in preparation)
Keywords
Species Sensitivity Distribution, SSD, PAF, msPAF, impact quantification, mixture, concentration, chemical, ecotoxicity data base, ecological effects
Related topics
Modelling strategies FS060 From emissions to effects: Model Train for SOLUTIONS FS016 SOLUTIONS Emissions Model FS017 Spatially and temporally-resolved transport and fate modelling FS018 REACH approach to 'typical' exposure estimation FS065 Risk Characterisation Model FS019

RiBaTox – Full Set of Fact Sheets
136
Ecotoxicological modelling to estimate the total toxic pressure of water bodies FS037 Combination Toxicity Calculator (CTC) FS026 Estimation of toxic pressure from distributions FS086 Identification of new substances posing a high risk FS014 Risk based prioritization (RBP) of emerging contaminants in drinking water FS027
Contact information
Leo Posthuma ([email protected]) RIVM - Centre for Sustainability, Environment and Health, Bilthoven, The Netherlands

RiBaTox – Full Set of Fact Sheets
137
FP7 SOLUTIONS project - Fact Sheet 037
Name SOLUTIONS Tool or Service
FS037 Ecotoxicological modelling to estimate the total toxic pressure of water bodies
Description
1. Objective
You have reached this Fact Sheet because you would like to calculate the overall mixture toxic pressure for ecosystems from a set of measured or modelled concentrations for a variety of substances. In the sequence of mathematical modelling, from emissions towards predicted effects of exposure, one aspect relates to the use of (predicted or measured) concentration data to estimate the net ecological impact of chemical (mixture) exposures. For the ecosystem toxic pressure is expressed as the Potentially Affected Fraction of species (PAF) for a single chemical, or for a cocktail of substances the multiple substance PAF (msPAF). 2. Methodology The toxic pressure can be quantified via Species Sensitivity Distributions (SSD), using (predicted or measured) ambient exposure information (chemical concentrations). This information can be obtained from either: • concentrations derived from measurements in the field (monitoring) FS044, • concentrations predicted from modelling approaches, e.g. from a combination of annual
production and use information (such as from REACH), with transport, fate and behaviour modelling, in combination with hydrological modelling FS016, FS017, FS018, FS065.
In addition, SOLUTIONS has compiled a database with information that needs to be used for the modelling exercises FS061. This includes, for example, the physico-chemical characteristics of thousands of compounds FS091. Ecotoxicity data are comprised of several hundreds of thousands of records on the sensitivity of test species FS036. This dataset on acute EC50 and chronic NOEC data allows for the derivation of SSD-models for 12,368 chemicals.
3. Application This model description provides conceptual information on the reasoning used to derive (mixture) toxic pressure estimates. Sequentially a chain of sub-models have to be applied to calculate local toxic pressure:
1) In the first step, it may be necessary to convert the input environmental concentrations for the different substances to a bioavailable concentration. This is generally accomplished by speciation fate modelling, see [Ref01] FS018;
2) The second step involves the conversion of concentrations of individual substances to a measure of effect (single-chemical toxic pressure) as derived from SSD modelling, see [Ref02] FS035;
3) The third and last step involves a mixture risk assessment procedure as described in FS026, to yield the mixture toxic pressure [Ref03].

RiBaTox – Full Set of Fact Sheets
138
Figure 1. Schematic representation of the msPAF model train
A list of concentrations for different substances is essentially meaningless if not accompanied by a similar list of quality criteria (Environmental Quality Standards, EQS); the latter are available for approx. 200 compounds [Ref04], whilst there are >100,000 compounds in commerce. Moreover, as chemical pollution commonly consists of mixtures of chemicals, an assessment of mixture impacts is a requirement for the evaluation of the likelihood that chemical pollution affects water quality (Annex II of the WFD).
The proposed chain of sub-models converts any list of concentrations for different substances into a single, quantitative measure of mixture impact. This impact is easy to interpret in a comparative way (e.g. between sites in a water board’s management area or catchment, or between measurements over time related to the use of plant protection products) and far more meaningful in the overall risk interpretation. The latter relates to the observation that the toxic pressure metric relates to the magnitude of ecological impacts.
The tool needed to perform the proposed chain of sub-models in an automated way is presented in FS026.
References
1. De Zwart, D., Warne, A., Forbes, V. E., Peijnenburg, W. J. G. M., and van de Meent, D. 2008. Matrix and media extrapolation. in Solomon, K. R., Brock, T. C. M., Dyer, S. D., Posthuma, L., Richards, S. M., Sanderson, H., Sibley, P. K., Van den Brink, P. J., and De Zwart, D., editors. Extrapolation practice for ecological effect characterization of chemicals (EXPECT). SETAC Press, Pensacola, FL; pp.33-74; https://searchworks.stanford.edu/view/7625063
2. Posthuma, L., G.W. Suter and T.P. Traas (Eds), 2002. Species sensitivity distributions in ecotoxicology. Lewis, Boca Raton, pp. 616;
3. De Zwart, D. and L. Posthuma, 2006. Complex mixture toxicity for single and multiple species: proposed methodologies. Environ. Toxicol. Chem. 24: 2665-2672; https://doi.org/10.1897/04-639R.1

RiBaTox – Full Set of Fact Sheets
139
4. Arle, J., Mohaupt, V. and Kirst, I., 2016. Monitoring of Surface Waters in Germany under the Water Framework Directive — A Review of Approaches, Methods and Results. Water, 8: 217; https://doi.org/10.3390/w8060217
Keywords
ecotoxicity, toxicological effects, chemical pressure, aquatic ecosystems, PAF, msPAF
Related topics
Modelling strategies FS060 From emissions to effects: Model Train for SOLUTIONS FS016 SOLUTIONS Emissions Model FS017 Spatially and temporally-resolved transport and fate modelling FS018 REACH approach to 'typical' exposure estimation FS065 Risk Characterisation Model FS019 Ecological risk quantification via Species Sensitivity Distributions (SSD) FS035 Combination Toxicity Calculator (CTC) FS026 Estimation of toxic pressure from distributions FS086 Identification of new substances posing a high risk FS014 Risk based prioritization (RBP) of emerging contaminants in drinking water. FS027
Contact information
Leo Posthuma ([email protected]) RIVM - Centre for Sustainability, Environment and Health, Bilthoven, The Netherlands

RiBaTox – Full Set of Fact Sheets
140
FP7 SOLUTIONS project - Fact Sheet 026
Name SOLUTIONS Tool or Service
FS026 Combination Toxicity Calculator (CTC)
Description
1. Objective
You have reached this Fact Sheet because you would like to calculate the overall mixture toxic pressure from a set of measured or modelled concentrations for a variety of substances.
The Combination Toxicity Calculator - CTC - calculates the combination toxic pressure of the local mixture of potential toxicants at a particular site from measured or modelled concentration data on potential toxicants. The CTC is based on a set of queries written in MS Access. Next to concentration data, CTC requires and provides physico-chemical as well as toxicological properties for a wide variety of potential toxicants. Data in the CTC is available on 1,991 different substances obtained from publicly available sources and data on 7,213 different substances including the substances contained in the REACH database. The overall toxic pressure is expressed as the multi substance Potentially Affected Fraction of species (msPAF) based on acute EC50 exceedance. This measure can reliably be interpreted as the reduction of biodiversity or the fractional loss of species from the exposed ecosystem as a consequence of exposure to toxicants.
2. Methodology CTC consists of a train of models to deal with different aspects of environmental toxicity: 1) Bioavailability 2) Species sensitivity and 3) Mixture toxicity.
1) Bioavailability or bioeffectivity of any toxicant is strongly depending on interactions between the toxicant and environmental conditions (De Zwart et al., 2008, [Ref02]). The interactions are mainly governed by the physico-chemical properties of the toxicant in combination with the physico-chemical properties of the environment. Available data is used to estimate the bioeffective fraction of the toxicants. In some cases default values are used to quantify environmental conditions.
2) Species exposed to toxicants may show differences in their susceptibility. These differences are taken into account by using Species Sensitivity Distributions (SSD) that are derived from toxicity experiments conducted in laboratory studies. SSD-data are provided for a wide variety of different chemicals. The outcome of the SSD analysis is the fraction of species that is likely exposed over their respective acute EC50 value (Posthuma et al. 2002 [Ref03]).
3) The impact of exposure to an environmental cocktail of potential toxicants is evaluated according to the so called ’mixed model’, where substances with the same mode of action are considered to act concentration additively, while substances with a different mode of action are considered to act response additively (De Zwart and Posthuma 2006 [Ref01]).
3. Application
The CTC converts available data on many concentrations of potential toxicants in a local mixture to a single estimate of toxic pressure (msPAF). Additional information is generated to reveal the top-5 of toxicants, and to link toxic pressure to the type of chemicals involved, as well as to a chemical use classification.
The CTC is an MS-Access database application requiring the input of concentrations via an MS Excel datasheet with a prescribed data format. The MS Access program is equipped with a series

RiBaTox – Full Set of Fact Sheets
141
of queries designed to fully automatically perform all required calculations. The condensed output is again presented in the form of an MS Excel workbook. Both the input and output MS Excel sheets as well as the MS Access application contain several layers of help functionality.
The database application, provided to JRC is a pilot to set up the CTC model for calculating the toxic pressure in the Swiss Rhine area. Since then several adaptations have been made. Also a generic version of the tool fit for bulk processing of concentration data is available. This tool was made as a joint venture between SOLUTIONS and the STOWA project ESF8 (STOWA is the research branch of the joint water quality authorities in The Netherlands; ESF8 stands for Ecological Key Factor number 8, being toxicity). For the ESF8 project detailed reports on the CTC tool and on the validation of the tool were prepared (so far in Dutch only).
The CTC tool strongly relates to the info provided in Ecological risk quantification via Species Sensitivity Distributions (SSD) FS035 and also strongly relates to the info provided in the Ecotoxicity database for Species Sensitivity Distributions impact modelling FS036. Since the derivation of the CTC, continuous additions of ecotoxicity data have resulted in an expansion to assess the risks associated to 12,368 chemicals and their mixtures at the end of the SOLUTIONS project. The CTC is a tool operating on data collected until 2017.
References
1. De Zwart, D. and L. Posthuma, 2006. Complex mixture toxicity for single and multiple species: proposed methodologies. Environ. Toxicol. Chem. 24: 2665-2672; https://doi.org/10.1897/04-639R.1
2. De Zwart, D., Warne, A., Forbes, V. E., Peijnenburg, W. J. G. M., and van de Meent, D. 2008. Matrix and media extrapolation. in Solomon, K. R., Brock, T. C. M., Dyer, S. D., Posthuma, L., Richards, S. M., Sanderson, H., Sibley, P. K., Van den Brink, P. J., and De Zwart, D., editors. Extrapolation practice for ecological effect characterization of chemicals (EXPECT). SETAC Press, Pensacola, FL: pp.33-74.
3. Posthuma, L., G.W. Suter and T.P. Traas (Eds), 2002. Species sensitivity distributions in ecotoxicology. Lewis, Boca Raton, pp. 616.
Keywords
Toxicant concentration, Bioavailability, Species Sensitivity, Mixture toxicity, Toxic pressure, Reduction of biodiversity, Loss of species
Related topics
Modelling strategies FS060 From emissions to effects: Model Train for SOLUTIONS FS016 SOLUTIONS Emissions Model FS017 Spatially and temporally-resolved transport and fate modelling FS018 REACH approach to 'typical' exposure estimation FS065 Risk Characterisation Model FS019 Ecological risk quantification via Species Sensitivity Distributions (SSD) FS035 Ecotoxicological modelling to estimate the total toxic pressure of water bodies FS037 Estimation of toxic pressure from distributions FS086 Identification of new substances posing a high risk FS014 Risk based prioritization (RBP) of emerging contaminants in drinking water FS027

RiBaTox – Full Set of Fact Sheets
142
Contact information
Dick de Zwart ([email protected]) Mermayde, Groet, The Netherlands

RiBaTox – Full Set of Fact Sheets
143
FP7 SOLUTIONS project - Fact Sheet 086
Name SOLUTIONS Tool or Service
FS086 Estimation of toxic pressure from distributions
Description
1. Objective
You have reached this Fact Sheet because you are interested risk assessment and management of many chemicals and their mixtures, while requiring alternatives to the substance-by substance assessment of expected toxic impacts of chemical substances on aquatic ecosystems and the associated risk management. Most probably you require this alternative because data on exposure concentrations and/or critical effects concentrations of many chemicals are not available, or can be obtained at unacceptably high cost, which is often the case when dealing with the many substances regulated under the EU REACH regulation.
Toxic pressure calculation is used to quantify the ecological consequence of the presence of chemical substances in (aquatic) ecosystems. Toxic pressure calculation is applied in regulatory risk assessment of chemicals to set Environmental Quality Standards (EQS), and also to determine whether a concentration of a specific chemical substance in a specific (water) system is unacceptably high; toxic pressure calculation is used in REACH to determine whether a chemical can be used safely.
Studies in the SOLUTIONS project have indeed shown that precise exposure and/or effects information on these so-called REACH chemicals is often hard to obtain. These studies have demonstrated also that toxic pressures of ambient mixtures of REACH substances can often be assessed with sufficient precision without firstly collecting information on the thousands of chemicals currently used.
This factsheet explains how • the combined toxic pressures of mixtures of chemical substances can be assessed from the overlap of
the distributions of (a) exposure concentrations and (b) critical effect concentrations of mixtures of chemical substances in natural waters, and
• contributions of individual chemical substances to the combined toxic pressure of ambient mixtures of chemical substances in natural waters can be estimated.
A scientific publication, documenting this application of toxic pressure calculation [Ref09] is in preparation. 2. Methodology
The toxic pressure of a chemical on an ecosystem is the pressure that organisms in the system will likely ‘experience’ as a result of the presence of the (toxic) substance in the system. A higher toxic pressure is interpreted as a higher probability that (mixtures of) chemicals directly affect populations of species. They affect differently across species due to sensitivity differences. This is exhibited finally as a limited biodiversity when toxic pressures rise. The concept of toxic pressure calculation was introduced in the late 1990s by environmental scientists in Europe to measure the ecological risk of a chemical substance in an (aquatic) system as the probability that exposure concentrations of organisms exceed concentration levels that are considered to be too high or ‘riskful’. In the ‘SSD book’ [Ref01], Van Straalen [Ref02], Aldenberg et al. [Ref03] and Traas et al. [Ref04], among others, used species sensitivity distributions to quantify the ‘Potentially Affected Fraction of species (PAF)’, ‘ecological risk’ or ‘toxic pressure’ as a measure of seriousness of the presence of toxic chemicals in the environment.
Being a probability, toxic pressure is a dimensionless number between zero and one. The probability of one entity (e.g. exposure concentration) to be greater than another entity (e.g. EC50) is generally made by simple comparison. In the case of two numbers, the former can be smaller than, equal to, or greater than the other, so that the probability that one exceeds the other is undisputable and can be determined easily. Determining the probability that one entity exceeds the other becomes conceptually more difficult when

RiBaTox – Full Set of Fact Sheets
144
comparing the concentrations of one or more chemicals at one or more places and/or at one or more times in a water system with acceptable concentration levels for one or more biological species present. . The numbers have now changed into a set of exposure concentrations and a set of species, with each their species-specific sensitivity for the chemical. Van Straalen [Ref02] and Aldenberg et al. [Ref03] have demonstrated how this problem can be tackled: the distributions of concentrations in water cW and critical effect levels EC50 (for a species) or HC50 (for a species assemblage) can be compared by integrating the convolution of their distribution functions over the entire range over possible concentrations. For a species assemblage, exposed to multiple chemicals, the Van Straalen-Aldenberg convolution integral of the probability density function of concentrations in water , and the cumulative distribution function of critical effect concentrations of all chemicals involved in the assay yields the probability that cw exceed HC50 in a given water system:
.
Hamers et al. [Ref05] have used this approach to assess the combined toxic pressures from narcosis by chemicals in surface water (Figure 1).
0.0
0.5
1.0
0.00
0.08
0.15
0.23
0.30
-15 -12 -9 -6 -3 0
CUM
ULA
TIVE
PRO
BABI
LITY
of H
a50
prob
abili
ty d
ensi
ty o
f log
aW
log a
Exceedance of critical activities in water by REACH substances
Figure 1: Narcotic toxic pressure in ‘regional EU fresh water’, obtained from convolution of the distribution of
chemical activities in water (Gaussian probability density function pdfaW, green, left) with the distribution of critical effect limits (Gaussian cumulative distribution function CDFHa50, red, right). In this example, the probability that the activity in water exceeds the critical effect activity for narcosis of 0.01 in ‘regional EU fresh water’ equals approximately 1%.
Following its definition as convolution integral, toxic pressure calculation can be applied to one or more values of concentrations of single chemicals, or to (mixtures of) more chemicals, and to systems in which one or more biological species with one or more critical effect concentrations reside. Van Straalen [Ref02] applied toxic pressure calculations to the distribution of the soil concentrations of a single chemical measured in a field. Aldenberg [Ref03] applied toxic pressure calculations to the distribution of concentrations of different chemicals (at different places and times) in a water system. In ecological risk assessment, critical effect concentrations refer (by definition) to assemblages of species, for which species sensitivity distributions ( ) are expressed. For mathematical reasons, the convolution integral can be used to calculate mixture toxic pressure only for chemicals with equal interspecies variance of (‘parallel’ CDFHC50), to which toxicological concentration addition applies. Mixture toxic pressure across toxic modes of action, i.e. across groups of chemicals with unequal variance of (‘non-parallel’ CDFHC50), must be calculated using toxicological response addition:
where denotes the mixture toxic pressure of substances i with equal interspecies variance of EC50.
Toxic pressure calculation has traditionally been based on numerical solution of the convolution integral

RiBaTox – Full Set of Fact Sheets
145
([Ref02] to [Ref05]), i.e. by determining concentrations and critical effect concentrations of all individual members of ambient mixtures first, followed by summation of the products thereof for all substances i
As pointed out by Van de Meent et al. [Ref06], the convolution integral can be solved equally well – better, even – by analytical means, using parameterized distribution functions of and , which are presumed to be lognormal, as shown in Figure 1. A great advantage of this analytical approach is that combined toxic pressure of mixtures can be known without assessing the exposure concentrations and critical effect concentrations of the individual members of the mixture. As the analytical solution requires only means and standard deviations of the distributions, it suffices to have knowledge of these parameters. Sufficiently precise knowledge of the parameters of distributions can often be obtained from model-based estimations, avoiding costly measurements.
A further scientifically interesting and regulatory useful advantage of using the analytical approach is that this method intrinsically accommodates uncertainty evaluation. As can be seen from Figure 1, exceedance probability arises mainly from the overlap of the right sided tail of the distribution of exposure concentrations with the left sided tail of the distribution of critical effect concentrations . When assessed correctly, the parameters of the distributions of and include evaluated uncertainties due to lack of precision of measurement or estimation. As a consequence, the resulting probability that exceeds in a water system directly reflects the uncertainties in and : greater uncertainties in measurement or estimation translate immediately into greater exceedance probabilities.
Perhaps the most useful property of the distribution-based analytical toxic pressure calculation is the possibility to rank chemicals according to their (expected) contribution to combined toxic pressure of ambient mixtures of chemicals in the (aquatic) environment. Toxic pressures from estimated concentrations of individual chemicals can be assessed quickly, accounting for the perhaps great uncertainties, and compared to the result of an equally quick assessment of the combined toxic pressure of all chemical present in the environment already. Ranking chemicals according to their contribution to ambient toxic pressure can be carried out quickly at low cost, and with sufficient precision to assess the regulatory acceptability of such contributions, at least for the purpose of so-called high throughput screening.
3. Application
Since the development of the concept of in the late 1990s, application of toxic pressure calculation using species sensitivity distributions has spread widely in the regulatory risk assessment of chemicals. Derivation of environmental quality standards (EQS) in the EU Water Framework Directive [Ref07] is based on it. So is the EU guidance for demonstrating the possibility to use chemicals safely (REACH Regulation, [Ref08]). Stakeholders and regulators are confronted with its technical and financial consequences. These consequences are great, because
• assessments are to be made for many individual chemicals – the list of WFD priority substances is continuously growing (but still limited); the list of registered REACH chemicals has grown to > 104 already, and because
• assessment of toxic pressures of many individual chemicals is (too) costly.
Application of distribution-based analytical calculation of toxic pressures assessment has the potential to solve in a conceptually consistent way both liaising a priori assessment of chemicals before they enter the European market and a posteriori assessments of water quality of European water systems. It allows for a vast expansion in the number of chemicals that can be evaluated as compared to the single-chemical approaches.
References
1. Posthuma L., Suter G.W. and Traas T.P. (Eds), 2002. Use of Species Sensitivity Distributions in Ecotoxicology. Lewis Publishers; https://www.crcpress.com/Species-Sensitivity-Distributions-in-

RiBaTox – Full Set of Fact Sheets
146
Ecotoxicology/Posthuma-II-Traas/p/book/9781566705783 2. Van Straalen, N.M., 2002. Theory of ecological risk assessment based on Species Sensitivity
Distributions. In: Use of Species Sensitivity Distributions in Ecotoxicology, L. Posthuma, G.W. Suter and T.P. Traas (Eds), Lewis Publishers, Boca Raton, pp. 37-48.
3. Aldenberg T., Jaworska J.S., Traas T.P. et al., 2002. Normal Species Sensitivity Distributions and probabilistic ecological risk assessment. In: Use of Species Sensitivity Distributions in Ecotoxicology, L. Posthuma, G.W. Suter and T.P. Traas (Eds), Lewis Publishers, Boca Raton, pp. 49-102.
4. Traas T.P., Van de Meent D., Posthuma L., Hamers T., Kater B.J., De Zwart D. and Aldenberg T., 2002. The Potentially Affected Fraction as a measure of ecological risk. In: Use of Species Sensitivity Distributions in Ecotoxicology, L. Posthuma, G.W. Suter and T.P. Traas (Eds), Lewis Publishers, Boca Raton, pp. 315 344.
5. Hamers T., Legradi J., Zwart N., Smedes F., De Weert J., Van den Brandhof E.J., Van de Meent D. and De Zwart D., 2018. Time-Integrative Passive sampling combined with Toxicity Profiling (TIPTOP): an effect-based strategy for cost-effective chemical water quality assessment. Integr. Environ. Assess. Manag. (accepted).
6. Van de Meent D., Struijs J., Hendriks A.J., De Zwart D. and Posthuma L., 2018. Power of average – how mixture toxic pressures can be assessed from distributions of exposure concentrations and critical effect concentrations under uncertainty. Environ. Sci. Technol. (submitted).
7. European Commission, 2000. Directive 2000/60/EC of the European Parliament and of the Council of 23 October 2000 establishing a framework for Community action in the field of water policy. Off. J. Eur. Comm. L 327: 1-72; http://eur-lex.europa.eu/legal-content/EN/TXT/?uri=CELEX:32000L0060
8. European Commission, 2006. Regulation (EC) No 1907/2006 of the European Parliament and of the Council of 18 December 2006 on the Registration, Evaluation, Authorisation and Restriction of Chemicals (REACH). Off. J. Eur. Comm. L 396: p.1; http://eur-lex.europa.eu/search.html?qid=1516119423490&text=1907/2006&scope=EURLEX&type=quick&lang=en
9. Van de Meent D., De Zwart D. and Posthuma L. SimpleBoxTreat4Reach. Application of the SOLUTIONS modelling train to Chemical Safety Assessment under REACH. Chemosphere (to be submitted).
Keywords
Toxic pressure, distributions, ecotoxicology, species sensitivity distribution
Related topics
Modelling strategies FS060 From emissions to effects: Model Train for SOLUTIONS FS016 SOLUTIONS Emissions Model FS017 Spatially and temporally-resolved transport and fate modelling FS018 REACH approach to 'typical' exposure estimation FS065 Risk Characterisation Model FS019 Ecological risk quantification via Species Sensitivity Distributions (SSD) FS035 Ecotoxicological modelling to estimate the total toxic pressure of water bodies FS037 Combination Toxicity Calculator (CTC) FS026 Identification of new substances posing a high risk FS014

RiBaTox – Full Set of Fact Sheets
147
Risk based prioritization (RBP) of emerging contaminants in drinking water FS027
Contact information
Dik van de Meent ([email protected]) Mermayde, Groet, Netherlands
Leo Posthuma ([email protected]) RIVM, Bilthoven, Netherlands

RiBaTox – Full Set of Fact Sheets
148
FP7 SOLUTIONS project - Fact Sheet 014
Name SOLUTIONS Tool or Service
FS014 Identification of new substances potentially posing a high risk to river basins
Description
1. Objective
You have reached this Fact Sheet because you are interested to use modelling techniques to identify substances potentially posing a high risk in the frame of river basin management practices. The use of mathematical models is explicitly suggested in WFD-Annex II as a complementary method to the analysis if Pressures (human activities causing emissions of chemicals) and the analysis of monitoring and (ecological and chemical Classification) data, and makes it possible to carry out a risk assessment which includes emerging substances for which field data or lab tests are not yet available. Thus, models allow the assessment of individual chemicals or groups of chemicals which cannot be included in classical data driven risk assessments. This approach can for example be used to screen a large list of substances or mixtures and to prioritise them in terms of their potential risk. The result can be used for example to drive:
• the selection of substances to be included in future monitoring, or • the initial stages of development of future programmes of measures.
2. Methodology
We have used the SOLUTIONS model train (Figure 1) to carry out the risk assessment of a wide range of chemicals in all European River Basins.
Figure 1. The SOLUTIONS Model train, using external data and consisting of the sub-models (i) Emissions, (ii) Transport & Fate, (iii) Substance properties and (iv) Risk characterisation.
Emissions sub-model (M2)
Risk characterizationsub-model (M5)
Transport & fate sub-model (M3)
Subs
tanc
e pr
oper
ties
sub-
mod
el(s
) (M
4)
Exte
rnal
dat
a
partitioning
toxicitymode of action
Emissions to air, soil, groundwater, surface water
exposure
Use volumes use types
Waste water &Solid waste management
HydrologyMeteorologyWaterbodiesSoilsSocio-economy
Species sensitivitiesSpecies traitsFood webs
partitioning, decay

RiBaTox – Full Set of Fact Sheets
149
The analysis uses present (≈2010) data to calculate the emissions of emerging chemicals, the concentrations of these chemicals in the surface waters, top soils and selected biota, as well as the effects that these chemicals are exercising in surface waters, specified in terms of specific endpoints, in the perspective of the implementation of the Water Framework Directive.
3. Application
The results generated by the SOLUTIONS Model Train EU Wide application are available in the form of maps, plus underlying data, covering the whole of Europe with a spatial resolution of 10-15 km on average and (where applicable) a temporal resolution of 1 day FS021. These results can be used to determine which substances contribute most to the risk to aquatic ecosystems and human health. The analysis can be made on the scale of Europe as a whole, but can also be differentiated to specific river basins (e.g. Danube, Rhine) or sub-basins (Sava, Neckar).
The results for individual substances can be used as such, but is also possible to look at groups of substances. What is the risk by pharmaceuticals versus the risk by pesticides? Different endpoints can also be considered: for which Biological Quality Elements (phytoplankton, macro-invertebrates, fish) is the risk highest, and where?
The obvious advantages of using model based results are • information for more chemicals, • with complete coverage in space and time, and • unaffected by analysis accuracy limitations (limits of detection and quantification).
The price we pay for that is a reduced accuracy of the data: especially the predicted concentrations are expected to deviate to some degree from the ‘real’ concentrations. The SOLUTIONS reports referenced below provide insight on the accuracy that can be expected.
The Tools and Services described here are also input to applications in the Danube Case Study FS043, the Rhine Case Studies FS075, FS027 and the Iberian Case Study (FS040), as well as the Advanced methodological framework for the identification and prioritization of contaminants and contaminant mixtures FS041. The application of these Tools and Services provide additional information for water quality assessors, when they execute the Assessment of Impacts-step (WFD Annex II) in order to assess the likelihood that specific pollutants or mixtures are a causal factor that affects water quality.
References
3. van Gils, J., R. Schueder, C. Chrzanowski, A. Focks, H. Baveco, L. Posthuma, I. Cousins, C. Lindim, S. Kutsarova, S. Dimitrov, A. Kortenkamp, S. Ermler, G. Massman, J.Greskowiak, G. Schüürmann, R. Kuehne, D. van de Meent and D. de Zwart, 2018. Modelling framework and model-based assessment for substance screening. Solutions Deliverable D14.1 ED141.
4. van Gils, J., L. Posthuma, M. Zijp, A. van Wezel, R. Sjerps, D. Bunke, D. de Zwart, Dik van de Meent, I. Cousins, C. Lindim, S. Kutsarova, O. Mekenyan, J. Hollender, J. Slobodnik, R. Kühne and A. Kortenkamp, 2018. Europe wide modelling and simulations of emerging pollutants risk including think tank scenarios. Solutions Deliverable D14.2 ED142.
Keywords
River Basin, Europe, emerging compounds, modelling, risk assessment, prioritisation
Related topics
Prioritization strategies FS069

RiBaTox – Full Set of Fact Sheets
150
Modelling strategies FS060 Risk based prioritization (RBP) of emerging contaminants in drinking water FS027
Contact information
Jos van Gils ([email protected]) Deltares, Delft, The Netherlands
Jaroslav Slobodnik ([email protected]) Environmental Institute, Kos, Slovak Republic

RiBaTox – Full Set of Fact Sheets
151
FP7 SOLUTIONS project - Fact Sheet 027
Name SOLUTIONS Tool or Service
FS027 Risk based prioritization (RBP) of emerging contaminants in drinking water
Description
1. Objective
You have reached this Fact Sheet because application of analytical strategies FS051 and/or strategies for toxicant identification FS045 have indicated the presence of chemical contaminants in drinking water or in its resources. In addition, the presence of chemical contaminants may have resulted from an Analysis of Pressures, following WFD-Annex II, where an assessor inspects whether human activities result in specific pressures (i.e. specific chemicals emitted to the water system). This requires the application of Risk characterisation models FS019 and an Advanced methodological framework for the identification and prioritization of contaminants and contaminant mixtures FS041. The objective of Risk based prioritization (RBP) of emerging contaminants in drinking water is to derive provisional drinking water guidelines to which detected (drinking) water concentrations can be compared. Benchmark quotient values that serve as human health risk indices are then calculated by dividing the concentration levels in drinking water by the respective provisional guideline value. This tool complements Identification of new substances posing a high risk FS014.
2. Methodology
The product is based on the methodology as presented by Schriks et al. [Ref01] and Baken et al. [Ref02]. Triggered by the RBP process, an inventory of emerging contaminants in (sources of) drinking water was performed. First, chemical contaminants detected during the last decade in drinking water, raw drinking water (collected water that had not yet undergone treatment), and direct drinking water sources in the downstream parts of the Rhine (i.e. Rhine river basin FS027 case study) and Meuse river basins were collected. The primary data sources were the REWAB database, in which drinking water monitoring results of the Dutch drinking water companies are collected, and the database of RIWA association of river waterworks that includes compounds monitored in Dutch surface waters. Only organic compounds were included, and sum-parameters were excluded. In addition, monitoring results of the Dutch drinking water laboratories and Rijkswaterstaat (Netherlands Department of Public Works and Water Management) were consulted.
Subsequently, a number of criteria were used to select drinking water relevant compounds. Substances present in raw drinking water were selected when their concentrations were above the Threshold of Toxicological Concern (TTC) levels reported by Mons et al. [Ref03] of 0.01 µg/L for substances not labelled as carcinogenic, mutagenic, or toxic to reproduction (CMR) and 0.1 µg/L for non-CMR substances. Chemicals present in direct drinking water sources were considered relevant for drinking water when they were hydrophilic (octanol/water partition coefficient log Kow <4), not volatile (Henry’s Law constant KiH(w) <0.02), and detected at a concentration above the TTC thresholds. Log Kow and KiH(w) information may be retrieved from Substances Properties and Use Data FS020.
Next, the toxicological relevance of the selected compounds was assessed. A drinking water guideline value represents the concentration of a constituent that does not exceed tolerable risk to the health of a consumer at lifetime exposure. As a first step, existing statutory drinking water guideline values were obtained from e.g. the WHO and the US EPA. If not available, the second step was to obtain an established Tolerable Daily Intake (TDI), Acceptable Daily Intake (ADI) or
RiBaTox – Full Set of Fact Sheets
152
Reference Dose (RfD) or exposure levels corresponding to a specified extra life time cancer risk. When those were lacking as well, in a third step toxicity data collection focused primarily on established lowest/no observed (adverse) effect levels (LO/NO(A)ELs), from which a TDI was calculated. Finally, in a fourth step, miscellaneous toxicological information (such as the therapeutic dose) was collected and a TDI was calculated accordingly. TDIs, ADIs, RfDs and/or toxicity data were sourced from documents supporting regulatory drinking water guidelines or target levels or risk assessment reports published by acknowledged international institutes; toxicological databases such as the US EPA IRIS database, TERA (Toxicology Excellence for Risk Assessment) International Toxicity Estimates for Risk (ITER), and the Organisation for Economic Co-operation and Development (OECD) eChemPortal; and from other sources such as grey literature. In case of insufficient human relevant toxicological data, the compound of interest was not further evaluated.
To calculate provisional health based guideline values, first the Tolerable Daily Intake was determined (if not already available). The Point Of Departure (POD) for calculating the TDI was mostly a chronic LO(A)EL, NO(A)EL, benchmark dose level or equivalent. An appropriate safety factor to extrapolate to chronic exposure and to incorporate intra- and interspecies differences was utilized as part of the routine TDI calculation. A drinking water equivalent level (DWEL) was subsequently calculated by multiplying the TDI, ADI or RfD, or the 10-6 extra life time cancer risk level in case of a genotoxic substance, by a typical average adult body weight of 70 kg and dividing this intake level by a daily drinking water consumption of 2 L. Finally, for non-genotoxic substances the DWEL was multiplied by an allocation factor (between 20%-80%) to account for exposure via other sources than drinking water as well, to derive a provisional drinking water guideline value. To indicate the strength of the substantiation of the drinking water guideline values, substances were grouped in the following categories: (A) representing compounds with a statutory drinking water guideline value, (B) representing compounds with an established TDI, ADI or RFD, (C) representing compounds for which the TDI was calculated with an established LO(A)EL or NO(A)EL and (D) representing compounds for which the TDI was calculated based on miscellaneous toxicological information.
Finally, a Benchmark Quotient (BQ) was calculated as the ratio between the mean or maximum reported drinking water concentration and the (provisional) health-based drinking water guideline value. A BQ value of 1 represents a (drinking) water concentration equal to the (provisional) guideline value. A BQ value of ≥1 in drinking water may thus be of potential human health concern if the water were to be consumed over a lifetime period. Compounds with a BQ value ≥0.1 in drinking water may warrant further investigation. For compounds detected in raw drinking water, surface water and groundwater, drinking water treatment may provide additional safety. For these substances it was presumed that a BQ of ≤0.2 presents absence of appreciable concern for a risk to human health.
3. Application
This RBP tool allows selection of emerging substances with the highest drinking water relevance and prioritization of those substances based on toxicological information and detected concentrations. Human health risk associated with consumption of drinking water in which substances are present for which toxicity data are absent, cannot be assessed using this tool. In such cases, the TTC approach [Ref02], [Ref03], Effect-Based Tools (EBT) FS002, and Models for predicting human health endpoints FS068 may be applied to evaluate or predict the biological activity of the contaminants. For toxicological evaluation of mixtures of substances, the Combination Toxicity Calculator (CTC) FS026 can be consulted.

RiBaTox – Full Set of Fact Sheets
153
References
1. Schriks, M., Heringa M.B., van der Kooi M.M., de Voogt P. and van Wezel A.P., 2010. Toxicological relevance of emerging contaminants for drinking water quality. Water Res. 44: 461-476; https://doi.org/10.1016/j.watres.2009.08.023
2. Baken, K.A., R.M.A. Sjerps, M. Schriks and A.P. van Wezel, 2018. Toxicological relevance and Threshold of Toxicological Concern (TTC) for drinking water relevant contaminants of emerging concern. Environ. Int. 118: 293-303; https://doi.org/10.1016/j.envint.2018.05.006
3. Mons, M.N., Heringa, M.B., van Genderen, J., Puijker, L.M., Brand, W., van Leeuwen, C.J., Stoks, P., van der Hoek, J.P., van der Kooij, D., 2013. Use of the Threshold of Toxicological Concern (TTC) approach for deriving target values for drinking water contaminants. Water Res. 47(4): 1666-1678; https://doi.org/10.1016/j.watres.2012.12.025
Keywords
Risk based prioritization (RBP), drinking water, health risk assessment, provisional drinking water guideline value, threshold of toxicological concern
Related topics
Advanced methodological framework for the identification and prioritization of contaminants and contaminant mixtures FS041 Identification of new substances posing a high risk FS014 Modelling strategies FS060
Contact information
Kirsten Baken ([email protected]) KWR Watercycle Research Institute, Nieuwegein, The Netherlands

RiBaTox – Full Set of Fact Sheets
154
2.3 Substance property estimation
FP7 SOLUTIONS project - Fact Sheet 020
Name SOLUTIONS Tool or Service
FS020 Substances Properties and Use Data
Description
1. Objective
You already identified one or more chemicals of concern and now you need to obtain specific compound properties for your further steps. Even though it is desired to primarily employ experimental data, this is not always possible because of data gaps.
The use of mathematical models makes it possible to develop quantitative information about the expected use, emissions, exposure and effects of emerging chemicals for which field data or laboratory tests are not yet available. Such information can be used to carry out a risk assessment of individual chemicals or of groups of chemicals. To allow such assessments, substance specific data is required. The objective of SOLUTIONS is to collate such data for a wide range of chemicals.
2. Methodology The data referred to are:
• physico-chemical substance properties that can be used to assess the fate and transport of chemicals in the environment;
• toxicological substance characteristics that can be used to assess the effects of chemicals in the environment (organisms, man).
The use data have been collected within the SOLUTIONS project by mining existing data sources. Information is extracted from existing chemical registration data systems. For industrial chemicals data are derived from the REACH registration. Use and release data of chemicals not registered under REACH (pesticides, pharmaceuticals, food additives), are accessed through the specific regulatory agencies, and/or by using publicly available sources. It shall be realised that only data which are not subject to confidentiality agreements can be made available to third parties.
The physico-chemical and toxicological substance properties stem from an integrated approach of structure-based prediction of compound properties and effects as well as metabolites, transformation products and properties thereof. This has been achieved by using a selection of existing state-of-the-art models supplemented by newly developed models to predict properties and effects of emerging compound classes such as very polar, ionic and fluorinated organic compounds that are not covered by existing models. Examples of such models are ChemProp 6.5 [Ref01], ACD/Labs [Ref02] and OASIS-LMC [Ref03]. The results of these models have been tested and validated in case studies. The level of confidence of model predictions has been assessed and where feasible increased.
3. Application The database contains data for an increasing number, compounds (presently 12,478 chemicals, albeit not all endpoints/properties were predicted for all chemicals), and includes the following

RiBaTox – Full Set of Fact Sheets
155
substance properties: Molar weight (Da) Boiling point (K) Melting point (C) Vapour pressure (Pa) Water solubility (log of mol/L) Logarithmic acid dissociation constant (1st and 2nd step, if applicable) Logarithmic base dissociation constant (1st and 2nd step, if applicable) Half-life of acid hydrolysis [h] at pH 7 Half-life of basic hydrolysis [h] at pH 7 Half-life of neutral hydrolysis [h] Degradation class in sediment Degradation class in soil Degradation class in water Half-life class in water Logarithmic octanol/water partition coefficient Kow Logarithmic air/water partition coefficient Kaw Logarithmic octanol/air partition coefficient Koa
Hydrolysis (neutral) FS006 % biodegradation (BOD,CO2) FS007 Bioconcentration (LogBCF) FS007 Aquatic toxicity-Pimephales promelas, LC50, 96h FS007 Bacterial Reverse Mutagenicity (Ames test) FS009 Skin Sensitisation FS013 Photo-induced toxicity FS011 Eye Irritation/Corrosion FS008 Skin Irritation/Corrosion FS012 In vitro Chromosomal abberations FS009 In vivo Liver genotoxicity FS010 In vivo Liver clastogenicity FS010 In vivo Micronucleus bone marrow FS010 In vitro Aromatase inhibition [in progress] In vitro Aryl hydrocarbon receptor binding affinity [in progress] In vitro Estrogen binding affinity [in progress] In vitro Androgen binding affinity [in progress]
References
1. UFZ Department of Ecological Chemistry 2016. ChemProp 6.5 http://www.ufz.de/ecochem/chemprop
2. ACD/Labs 2016. http://www.acdlabs.com/products/percepta 3. http://oasis-lmc.org/products/models.aspx
Keywords
Chemicals, emerging, toxicity, physic-chemical, use of chemicals, database
Related topics
Modelled substance property data FS062

RiBaTox – Full Set of Fact Sheets
156
Models for predicting environmental fate endpoint - Neutral hydrolysis FS006 Models for predicting environmental fate and ecotoxicity endpoints – Biodegradation, Bioaccumulation, Acute aquatic toxicity FS007
Contact information
Ovanes Mekenyan ([email protected]) Asen Zlatarov University- LMC, Bourgas, Bulgaria
Ralph Kühne ([email protected]) Helmholtz Centre for Environmental Research GmbH – UFZ, Leipzig, Germany

RiBaTox – Full Set of Fact Sheets
157
FP7 SOLUTIONS project - Fact Sheet 062
Name SOLUTIONS Tool or Service
FS062 Modelled Substance Property Data
Description
1. Objective
You have reached this Fact Sheet because you need to know specific compound properties for your environmental fate modelling in order to predict the expected use, emissions, exposure and effects of emerging chemicals. These types of models require the input of specific physico-chemical properties for your compounds of interest.
However, respective experimental data often are not or at least not completely available. To fill the gaps, QSARs may be applied in many cases.
2. Methodology
In silico models from several software packages can be employed. The following list of suggested pieces of software is not complete but confines to software actually used for SOLUTIONS purposes.
ChemProp is being developed at UFZ and comprises a large collection of in silico models based on the chemical structure in terms of connectivity, i.e. structural formulas [Ref01]. Thus, compound structure input can be achieved e.g. from simple and widely available line codes, such as SMILES (Simplified molecular-input line-entry system). Additionally, an internal database of ca. 20,000 compounds provides structures via identifiers as e.g. the molecular formula or registry numbers. No 3D geometry is required to run the models. The offered methods mainly cover physico-chemical properties, degradation, environmental fate, ecotoxicology and toxicology. ChemProp is publically available for free, based on a bilateral license from UFZ.
The CATALOGIC software suite, developed by LMC, is a platform for models and databases related to the environment fate of chemicals such as abiotic and biotic degradation, bioaccumulation and acute aquatic toxicity [Ref02]. The biodegradation of chemicals is predicted based on simulated pathways of degradation; BOD or CO2-production, primary and ultimate half-lives, quantities of parent chemicals and transformation products are evaluated. The BCF base-line model predicts bioconcentration factor - BCF, l/kg wet, in fish; the model accounts for a number of mitigating factors, i.e. molecular size, metabolism of parent chemical, water solubility and ionization. The models for evaluating acute aquatic toxicity predict short-term adverse effects, namely LC50 or EC50, to a number of aquatic species.
Tissue Metabolism Simulator (TIMES) is a software platform which takes into account both toxic kinetics and toxic dynamics of substances in order to provide toxicological predictions for parent substances and their metabolites [Ref02]. The system includes functionalities for endpoint data management, single and batch run of models, a search engine and interactive help. Models implemented in TIMES meet most of the requirements (mechanistic interpretation, defined endpoint, scientific validity, applicability domain, documentation, etc.) necessary to be used instead of animal testing for the purposes of identifying the absence or presence of certain toxicological properties.
QSAR Toolbox is freeware developed by LMC with the scientific and financial assistance of OECD and the European Union [Ref03]. The software tool facilitates the application of the category approach for identifying and filling fate and (eco)toxicity data gaps for chemical hazard assessment. It is a platform that contains other tools such as EPI Suite programs, giving the

RiBaTox – Full Set of Fact Sheets
158
possibility chemicals to be run in a batch mode thus speeding up the prediction process.
ACD/Labs [Ref04] is a commercial package exploiting models based on structural formulas without the need of 3D geometry. This software has been applied in SOLUTIONS to estimate properties not yet available in the pieces of software of the SOLUTIONS partners (particularly, acid and base dissociation constants), and to augment predictions from UFZ or LMC software by additional models.
A particular remark has to be given to the reliability of the estimations. The SOLUTIONS approach comprises three major aspects to assess the confidence of in silico models. Firstly, the applicability domain of models with regard to the compound of interest needs to be considered. Here, the SOLUTIONS research provides new developments with the focus on the mechanistic domain and on the chemical domain in terms of structures and substructures. Secondly, calculated compound specific scores may assist in selecting the most suitable models from a set of different methods for the same property. Thirdly, if several models are available, consensus strategies should be employed. Consensus outcomes can accordingly increase the levels of confidence, while conflicting outcomes are indicating lower reliabilities. The SOLUTIONS tools provide means to address these three pillars in silico.
3. Application
For the full list of properties actually modelled for SOLUTIONS, please cf. to the Fact Sheet Substances Properties and Use Data FS020. A detailed description of all provided properties and data is given in the SOLUTIONS Deliverable D17.2 [Ref04].
References
1. UFZ Department of Ecological Chemistry 2017. ChemProp 6.6 http://www.ufz.de/ecochem/chemprop
2. http://oasis-lmc.org/products/models.aspx 3. QSAR Toolbox. http://toolbox.oasis-lmc.org/?section=overview 4. ACD/Labs 2016. http://www.acdlabs.com/products/percepta 5. Kutsarova, S., I. Dermen, C. Kuseva, P. Petkov and O. Mekenyan, 2017. Predictions of
transformation products, physicochemical properties, fate and toxicity of candidate compounds from chemical screening, EDA and emission modelling. Solutions Deliverable D17.2.
Keywords
QSAR, physico-chemical, partitioning, degradation, human health
Related topics
Substances Properties and Use Data FS020 List of substances that can be modelled FS089 Substance Property Data FS091
Contact information
Ralph Kühne ([email protected]) Helmholtz Centre for Environmental Research GmbH – UFZ, Leipzig, Germany Ovanes Mekenyan ([email protected]) Laboratory of Mathematical Chemistry, Bourgas "Prof. As. Zlatarov" University, Bourgas, Bulgaria

RiBaTox – Full Set of Fact Sheets
159
FP7 SOLUTIONS project - Fact Sheet 006
Name SOLUTIONS Tool or Service
FS006 Models for predicting environmental fate endpoint - Neutral hydrolysis
Description
1. Objective
You have reached this factsheet because you are interested in prediction of neutral hydrolysis rate constants. This endpoint is very important for hydrolytically stable chemicals in neutral media. The Neutral hydrolysis rate constant model predicts hydrolysis products of discrete organic chemicals under the following experimental conditions: neutral pH (6.5-7.4), temperature 20-35°C and atmospheric pressure.
2. Methodology
The Neutral hydrolysis rate constant model is based on two sub-models. The first one simulates the hydrolysis pathways of organic chemicals and the second component uses for predicting the rate of hydrolysis at neutral pH (6.5-7.4). First order kinetics is used to determine the kinetic constant and ultimate half-life on the basis of predicted neutral hydrolysis rate constant (Kn).
The development of the model consists of: (i) generation of metabolic maps for the training set chemicals using the abiotic simulator; (ii) estimation of probabilities of occurrence of the simulator transformations.
The probabilities were estimated assuming a first order kinetics:
)exp(1 tkP ii −−= where ki is a surrogate of the first order kinetic constant of the ith transformation.
The mathematical formulation of the model is:
( )( )∑=
−=N
n
Calcn
Obsn QQRSS
1
2min PP
where QObs and QCalc are observed and predicted quantities, respectively, and P is a vector of estimated probabilities of transformations.
The neural hydrolysis rate constant model predicts neutral hydrolysis rate constants. Simulated metabolism maps are part of the model results as well. The model includes a sub-domain level of general parametric requirements. It includes ranges of variation of relevant parameters, e.g. log KOW, MW and WS. A chemical compound is considered In Domain if its log KOW, MW and WS, etc. are within the specified ranges. The second level is the structural domain based on atom-centered fragments (ACFs). The structural domain is able to evaluate whether the ACFs of a target chemical are present in the training chemicals used to derive the model. A specific third level of the domain is developed for each model type. The model includes a mechanistic domain – based on functional (reactive) groups. The information implemented in the applicability domain is extracted from the correctly predicted training chemicals used to build the model and as such the applicability domain determines the interpolation space of the model.
3. Application
This model was successfully used by flavor and fragrance industries with interest in environmental fate of the chemicals. Hydrolysis of organic chemicals is the predominant

RiBaTox – Full Set of Fact Sheets
160
pathway for transformation in an aquatic medium. In this respect, the Neutral hydrolysis model is important, because it explains the hydrolysis products of the chemicals and their hydrolytic stability.
References
-
Keywords
Hydrolysis, neutral hydrolysis rate constant (Kn), hydrolysis half life
Related topics
Spatially and temporally-resolved transport and fate modelling FS018 Models for predicting environmental fate and ecotoxicity endpoints – Biodegradation, Bioaccumulation, Acute aquatic toxicity FS007 Substances Properties and Use Data FS020
Contact information
Ovanes Mekenyan ([email protected]) Laboratory of Mathematical Chemistry, Bourgas "Prof. As. Zlatarov" University, Bourgas, Bulgaria

RiBaTox – Full Set of Fact Sheets
161
FP7 SOLUTIONS project - Fact Sheet 007
Name SOLUTIONS Tool or Service
FS007 Models for predicting environmental fate and ecotoxicity endpoints – Biodegradation, Bioaccumulation, Acute aquatic toxicity
Description
1. Objective You have reached this factsheet because you are interested in biodegradation, bioaccumulation and/or acute aquatic toxicity endpoints. These endpoints are covered by the following OECD Test Guidelines:
• OECD TG 301C, 301B and 301F for biodegradation, • OECD TG 305 for bioaccumulation, • OECD TG 201, 202 and 203 for acute aquatic toxicity.
Modelling approaches have been developed in view of regulatory requirements for quantitative assessment of biodegradation (persistence), bioaccumulation potential and ecotoxicity of chemicals. The CATALOGIC models predict biodegradation of chemicals based on simulated pathways of degradation; biological oxygen demand (BOD) or CO2-production, primary and ultimate half-lives, quantities of parent chemicals and transformation products are evaluated.
The BCF base-line model predicts a bio-concentration factor - BCF, l/kg wet, in fish; the model accounts for a number of mitigating factors, i.e. molecular size, metabolism of parent chemical, water solubility and ionization.
The models for evaluating acute aquatic toxicity predict short-term adverse effects, namely LC50 or EC50, to a number of aquatic species.
2. Methodology
The CATALOGIC models [Ref01, Ref02] consist of a metabolism simulator and an endpoint model. The microbial metabolism is simulated by a rule-based approach. The core parts of the simulator are a set of hierarchically organized transformations and a system of rules that control the application of these transformations. Recursive application of the transformations allows simulation of metabolism and generation of biodegradation pathways. Calculation of the modelled endpoint BOD or CO2-production is based on the simulated catabolic tree and the material balance of transformations used to build the tree. The development of the models consists of: (i) generation of metabolic maps for the training set chemicals using the microbial metabolism simulator; (ii) estimation of probabilities of occurrence of the simulator transformations. Non-linear least square fitting is used to parameterize the model:
( )( )∑=
−=N
n
Calcn
Obsn BODBODRSS
1
2min PP
,
where RSS is the residual sum of squares, BODObs and BODCalc are observed and predicted BOD data of training chemicals and P is a vector of estimated probabilities of transformations.
The BCF base-line model [Ref03, Ref04] consists of two major components: a model for predicting the maximum potential for bioaccumulation (log BCFMAX) based solely on chemicals’ lipophilicity and a set of mitigating factors that account for the reduction of the bioaccumulation potential of chemicals based on chemical (molecular size, ionization and water solubility) and organism (metabolism) dependent factors. The mathematical formulation of the model is:

RiBaTox – Full Set of Fact Sheets
162
( )
+
+= ∏ WSWn2
OW
nOW
ii F.F
1aKKFlogBCFlog
where KOW is the octanol-water partition coefficient, Fi stands for the set of mitigating factors: metabolism, molecular size, ionization, FWS is water solubility factor, Fw is the organism water content.
The models for evaluating acute aquatic toxicity [Ref05] predict short-term adverse effects (LC50, EC50) to various aquatic species, e.g. Pimephales promelas, Daphnia magna, Selenastrum capricornutum. The models are based on the consideration that an organism response to the presence of toxicant in the environment is a consequence of the combined influence of two different processes: uptake of the chemical into the biophase and interaction with the site of action. Uptake is modelled by the maximum potential of a toxicant to bioconcentrate; the interaction of chemicals is explained by descriptors assessing the electrophilic character of the molecule, e.g. energy of the lowest unoccupied molecular orbital, electronegativity, average or maximum super-delocalizability, maximum charge at non-hydrogen atom, etc. Predictions are preceded by profiling aiming to evaluate modes of actions of the target chemicals. A separate model is derived for each mode of action, for example the model for narcotic toxicants of the Pimephales promelas LC50 96h model is:
log1/LC50 = 1.66(±0.07) + 1.09(±0.03)logBCFMAX – 0.18(±0.02)ELUMO
A stepwise approach is used to define the applicability domain of each model [Ref06]. All models include a sub-domain level of general parametric requirements. It includes ranges of variation of relevant parameters, e.g. log KOW, MW. A chemical is considered In Domain if its log KOW, MW, etc. are within the specified ranges. The second level is the structural domain based on atom-centred fragments (ACFs). The structural domain is able to evaluate whether the ACFs of a target chemical are present in the training chemicals used to derive the model. A specific third level of the domain is developed for each model type. The CATALOGIC models include a domain level which determines the reliability of the simulated metabolism, the BCF base-line model – one that identifies the mode of bioaccumulation of chemicals, and the acute aquatic toxicity models – one that determines the probability that the descriptors of a random chemical of the training set are the same as that of the target chemical. The information implemented in the applicability domain is extracted from the correctly predicted training chemicals used to build the model and as such the applicability domain determines the interpolation space of the model.
3. Application
The developed QSAR models for environmental fate and ecotoxicity endpoints provide predictions for biodegradation, bioconcentration and acute aquatic toxicity of organic substances only. CATALOGIC models are used successfully by cosmetic, chemical and fragrance industries and regulatory agencies. In this respect, CATALOGIC models are considered as decision supporting rather that decision making systems, because they allow users to take the ultimate decision based on provided mechanistic support.
Within the SOLUTIONS project, the predictions of all models described here were used by partners from the WP on Chemical Analytical tools and the Rhine Case study FS075.
Also half-live predictions of CATALOGIC C, B, and F have been successfully used by SOLUTIONS’ partners in their predictions on Emission modelling FS017 and Fate and Transport modelling FS018 respectively. These activities are part of the integrated modelling approach, which is manifested by the so-called SOLUTIONS modelling train. The final goal being an assessment of ecological and human health risks posed by different pesticides, pharmaceuticals and other REACH regulated substances.

RiBaTox – Full Set of Fact Sheets
163
References
1. Dimitrov, S., T. Pavlov, G. Veith, O. Mekenyan, 2011. Simulation of Chemical Metabolism for Fate and Hazard Assessment. I. Approach for Simulating Metabolism. SAR and QSAR Environ. Res. 22: 699-718.; https://doi.org/10.1080/1062936X.2011.623323
2. Dimitrov, S., T. Pavlov, N. Dimitrova, D. Georgieva, D. Nedelcheva, A. Kesova, R. Vasilev, O. Mekenyan, 2011. Simulation of Chemical Metabolism for Fate and Hazard Assessment. II. CATALOGIC Simulation of Abiotic and Microbial Degradation. SAR and QSAR Environ. Res. 22: 719-755; https://doi.org/10.1080/1062936X.2011.623322
3. Dimitrov, S., N. Dimitrova, T. Parkerton, M. Comber, M. Bonnell, O. Mekenyan, 2005. Base-line model for identifying the bioaccumulation potential of chemicals. SAR QSAR Environ. Res. 6: 531-554.; https://doi.org/10.1080/10659360500474623
4. Dimitrov, S., N. Dimitrova, D. Georgieva, K. Vasilev, T. Hatfield, J. Straka, O. Mekenyan, 2011. Simulation of chemical metabolism for fate and hazard assessment. III. New developments of the Bioconcentration factor base-line model. SAR QSAR Environ. Res. 23: 17-36; https://doi.org/10.1080/1062936X.2011.623321
5. Dimitrov, S., O. Mekenyan, G. Sinks, T. Schultz, 2003. Global modeling of narcotic chemicals: ciliate and fish toxicity. J. Mol. Struct. Theochem. 622: 63-70; https://doi.org/10.1016/S0166-1280(02)00618-8
6. Dimitrov, S., G. Dimitrova, T. Pavlov, D. Dimitrova, G. Patlevisz, J. Niemela, O.Mekenyan, 2005. A stepwise approach for defining the applicability domain of SAR and QSAR models. J. Chem. Inf. Model, 45: 839-849; https://doi.org/10.1021/ci0500381
Keywords
Biodegradation, BOD, bioconcentration, log BCF, ecotoxicity, LC50, EC50
Related topics
Spatially and temporally-resolved transport and fate modelling FS018 Models for predicting environmental fate endpoint - Neutral hydrolysis FS006 REACH approach to 'typical' exposure estimation FS065
Contact information
Ovanes Mekenyan ([email protected]) Laboratory of Mathematical Chemistry, Bourgas "Prof. As. Zlatarov" University, Bourgas, Bulgaria

RiBaTox – Full Set of Fact Sheets
164
2.4 Models for predicting human health endpoints
FP7 SOLUTIONS project - Fact Sheet 068
Name SOLUTIONS Tool or Service
FS068 Models for predicting human health endpoints
Description
1. Objective
You reached this factsheet because you are interested in predicting human health endpoints for the assessment of potentially hazardous compounds. Typical such endpoints include skin sensitization, in vitro and in vivo genotoxicity, eye and skin irritation and photo-induced toxicity for one or more organic chemicals.
2. Methodology
TIMES (tissue metabolism simulator) is a heuristic algorithm (mathematical model) used to generate plausible metabolic maps from a comprehensive library of bio-transformations and abiotic reactions. It allows prioritization of chemicals according to the toxicity of their metabolites. The list of transformations is prioritized on the basis of estimated system-specific probabilities of occurrence of these transformations. Additionally, the reliability of generated pathways, metabolites and maps was assessed according to the extent they had been supported by observed metabolism data.
Hence, besides metabolites, one could also prioritize competing metabolic pathways according to their probability of occurrence and reliability. The reliability estimates could facilitate the strategic selection of chemicals for testing in order to expand the domain of the simulator most effectively. The ability of TIMES to predict in the same interface the metabolism of chemicals and toxicity resulting from their metabolic activation is considered an important advantage of the method.
A stepwise approach is used to define the applicability domain of each TIMES model [Ref11]. It consists of the following sub-domain levels: • General parametric requirements – includes ranges of variation log KOW (the octanol-
water partitioning coefficient) and molecular weight (MW), • Structural domain – based on atom-centred fragments (ACFs), • Interpolation space (applicable to Skin sensitization model) - estimates the population
density of the parametric space defined by the explanatory variables of the QSAR (quantitative structure–activity relationship) models by making use the training set chemicals.
A chemical is considered In Domain if it is classified to fall in all sub-domain levels. The information implemented in the applicability domain is extracted from the correctly predicted training chemicals used to build the model and in this respect the applicability domain determines practically the interpolation space of the model.
The models provide prediction results for the chemicals as parent structures and also predictions for all generated metabolites. The generated metabolic tree can be visually analysed and in case of positive prediction supporting information of the interaction mechanism is provided.
A number of different (Q)SAR human health models, used for human health endpoint prediction,

RiBaTox – Full Set of Fact Sheets
165
were developed by the Laboratory of mathematical chemistry (LMC), each focussing on a specific mode of action. The following can be found at OASIS TIMES platform (http://oasis-lmc.org/):
The In vitro Ames mutagenicity S9 activated model FS009 identifies chemicals, which are able to elicit mutagenicity as a result of interactions with DNA. Detected are point mutations including substitution, addition or deletion of one or a few DNA base pairs in Salmonella typhimurium [Ref01]. The model is based on the alerting group approach [Ref02]. The reactivity component is combined with a metabolic simulator, which is trained to reproduce documented maps for mammalian liver metabolism for 261 chemicals.
The in vitro Chromosomal Aberration S9 activated model (CA) FS009 identifies chemicals that cause structural chromosome aberrations in cultured mammalian cells [Ref03]. Structural aberrations could be of two types: chromosomal or chromatid. The majority of chemical mutagens induce aberrations of the chromatid type, but chromosome-type aberrations also occur. The reactivity component of the CA model (–S9) describing interactions of chemicals with DNA and/or proteins is based on an alerting group approach [Ref04]. Only those toxicophores having clear interpretation of the molecular mechanism causing the ultimate effect are included in the model. In the CA model (+S9), the reactivity component is combined with a metabolic simulator trained to reproduce documented maps for mammalian rat liver metabolism for 261 chemicals.
The In vivo Comet genotoxicity model FS010 identifies chemicals that cause DNA and/or protein damage in the liver of rats or mice. The model is also based on the alerting group approach. A comprehensive mechanistic justification backs up the incorporated alerts. Some of the specified alerts interact directly with DNA or nuclear proteins, whereas others are applied in a combination of two-dimensional QSAR models assessing the degree of activation of the alerts from the rest of the molecules. In the in vivo TIMES Comet model the reactivity component is combined with in vivo metabolism simulator to account not only for metabolic activation but also for metabolic detoxification of substances. A battery of in vivo-only detoxification pathways have been defined which mechanistically justify in vivo negative Comet results of substances which are positive in other in vitro mutagenicity systems.
The in vivo liver clastogenicity model FS010 identifies chemicals that cause DNA and/or protein damage in liver of rats or mice, taking into account in vivo detoxification of chemicals. The model also consists of two components – a reactivity component, based on alerts associated with DNA and/or protein interactions and metabolism component accounting for metabolic activation and detoxification of chemicals [Ref05].
The in vivo liver transgenic rodent model (TGR) FS010 is a practical and widely available in vivo test for gene mutations. The TGR assay provides quick and statistically reliable data for mutations in the DNA from any tissue. The TIMES TGR mutagenicity model consists of two sub-models – a model addressing reactivity of a substance and a model associated with simulation of metabolism. The reactivity sub-model is based on in vitro structural alerts for DNA binding and active structural alerts accounting for in vivo generated reactive oxygen species. The metabolism sub-model is accounting for metabolic activation and detoxification of chemicals [Ref05].
The in vivo bone marrow MNT model FS010 (or in vivo micronucleus formation model) detects chemicals capable to induce chromosomal breakage (clastogenicity) and chromosome lagging due to dysfunctioning of the mitotic apparatus (aneugenicity) in bone marrow or peripheral blood of rats and mice. Similarly to the other in vivo TIMES mutagenicity models, the MNT model includes two components – a reactivity component, addressing mutagenicity towards DNA and proteins and a metabolism component, accounting not only for metabolic activation but also for metabolic detoxification of substances [Ref05]. This in vivo model includes the highest number of
RiBaTox – Full Set of Fact Sheets
166
detoxification pathways which are responsible for both detoxification in liver (as a principle organ) and detoxification of substances from liver to the remote bone marrow tissue.
The Skin irritation/corrosion model FS012 predicts the reversible (irritation) and irreversible damage (corrosion) of the skin as a result of the application of a test substance. The Skin irritation/corrosion model uses a category approach for deriving structural alerts based on functionally identical chemicals accounting for their irritating or corrosive effects. The alerts are grouped into 78 irritating and corrosive categories (Inclusion rules) and are hierarchically ordered. The model predicts chemicals as Irritating, Corrosive to the skin or No alert found, but it does not discriminate between skin irritation potencies, i.e. slightly, mildly, moderate or highly irritating chemicals. The Inclusion rules re molecular functionalities, which are assumed to trigger a molecular initiating event (MIE), resulting in the irritation/corrosion effect [Ref06].
The Eye irritation/corrosion model FS008 is the production of changes in the eye (abnormal alteration of the cornea, conjunctiva or iris) following the application of a test substance to the anterior surface of the eye [Ref07]. The TIMES Eye irritation/corrosion model predicts the eye irritation potential of organic chemicals. The model consists of Inclusion rules (Categories) for eye irritation, which are based on empirically derived structural boundaries. The model also adopts the skin irritation/corrosion model alerts FS012, which is based on the assumption that if a chemical causes skin irritation/corrosion it could also damage the eye.
The Skin sensitization model FS013 predicts skin sensitization in a unified categorical scale for rodents [Ref08], [Ref09]. The skin sensitization model integrates a simulator of skin metabolism together with a list of alerts for protein binding. Due to the paucity of reported skin metabolism data, initially the simulator transformations were developed based on empirical and theoretical knowledge. Transformation probabilities (defining the priority of their execution) were parameterized to reproduce skin sensitization data.
Photo-induced toxicity FS011 was considered as an outcome of competing processes between structural (such as stability and light absorbance of chemicals) and environmental (energy quanta with specific wave length) factors. The energy gap (EGAP) between EHOMO - ELUMO was the molecular parameter, which was assumed to be suitable for assessing the stabilization of the toxicant and light absorbance. A phototoxic window was found in the range of EGAP from 6.50 to 8.60 eV [Ref10]. Based on calculated values for EGAP the model predicts chemicals to be ‘phototoxic or photodegradable’, or ‘non-phototoxic and non-photodegradable’.
Aromatase inhibition (AI) model FS081 is a mechanism-based SAR categorization model identifying the most important chemical structural features responsible for inhibition of aromatase activity [4]. Two main interaction mechanisms were discerned: steroidal and non-steroidal. The specific structural boundaries controlling AI for both analyzed mechanisms were defined, and a software tool was developed that allowed a decision tree (profile) to be built discriminating AI by mechanism and potency. An input chemical follows a profiling path and the structure is examined at each step to decide whether it conforms to the structural boundaries implemented in the decision tree node.
Aryl hydrocarbon receptor model FS082 estimates the relative equivalent potency (REP) of chemicals to bind with the aryl hydrocarbon receptor. It is a categorical COmmon REactivity PAttern (COREPA) based SAR model for predicting different binding affinity of structurally diverse chemicals to the aryl hydrocarbon receptor (AhR) [Ref12]. The COREPA analysis suggested two different binding mechanisms called dioxin- and biphenyl-like, respectively. The current model also can predict agonistic/antagonistic properties of chemicals.
Androgen receptor binding affinity model FS080 assesses the in vitro relative binding affinity (RBA) of chemicals to interact with the androgen receptor (AR). Chemicals in the training set were categorized according to their potency and grouped into four activity bins: highly active

RiBaTox – Full Set of Fact Sheets
167
with RBA>10%; moderate with 0.1%<RBA<10%; low with 0.001%<RBA<0.1% and non-active with RBA<0.001%. An integral screening tool for predicting binding affinity to AR was constructed as a battery of models, each associated with different activity bins [Ref13].
Estrogen receptor (ER) binding affinity model FS080 assesses the in vitro relative binding affinity (RBA) of chemicals to interact with the human or trout estrogen receptor (h&t ER).
Five activity ranges with respect to the RBA values are defined, based on the training set data: highly active ER binders (RBA>10%), moderate (10%>RBA>0.1%), weak binders (0.1>RBA>0.001), lowest (0.001>RBA>0.00001) and inactive (non-binders) chemicals (RBA<0.00001%). The model is based on the assumption that distances between electrophilic sites in the receptor determine the requirements for the binding mechanism. The ultimate model is organized as a battery of all models related to the each interaction type in the respective potency bins. The ER model could be applied with a metabolism simulator to predict the potential metabolic activation of chemicals [Ref14].
References
1. Ames, B., J. McCann and E. Yamasaki (1975). Methods for detecting Carcinogens and Mutagens with the Salmonella/Mammalian–Microsome Mutagenicity Test. Mutation Res. 31: 347-364; https://doi.org/10.1016/0165-1161(75)90046-1
2. Serafimova, R., M. Todorov, T. Pavlov, S. Kotov, E. Jacob, A. Aptula and O. Mekenyan (2007). Identification of the structural requirements for mutagenicity by incorporating molecular flexibility and metabolic activation of chemicals. II. General Ames mutagenicity model. Chem. Res. Toxicol. 20: 662−676; https://doi.org/10.1021/tx6003369
3. Evans, H.J. (1976). Cytological methods for detecting chemical mutagens. In: Chemical Mutagens, Principles and Methods for their Detection, Vol. 4. A. Hollaender (Ed.). Plenum Press, New York and London, pp. 1-29; http://www.springer.com/us/book/9781468408942
4. Mekenyan, O., M. Todorov, R. Serafimova, S. Stoeva, A. Aptula, R. Finking and E. Jacob (2007). Identifying the structural requirements for chromosomal aberration by incorporating molecular flexibility and metabolic activation of chemicals. Chem. Res. Toxicol. 20: 1927−1941; https://doi.org/10.1021/tx700249q
5. Mekenyan, O., P. Petkov, S. Kotov, S. Stoeva, V. Kamenska, S. Dimitrov, M. Honma, M. Hayashi, R. Benigni, M. Donner and G. Patlewicz (2012). Investigating the relationship between in vitro–in vivo genotoxicity: Derivation of mechanistic QSAR models for in vivo liver genotoxicity and in vivo bone marrow micronucleus formation which encompass metabolism. Chem. Res. Toxicol. 25: 277- 296; https://doi.org/10.1021/tx200547s
6. Hulzebos, E., J.D. Walker, I. Gerner and K. Schlegel (2005). Use of structural alerts to develop rules for identifying chemical substances with skin irritation or skin corrosion potential. QSAR Comb. Sci. 24(3): 332-342; https://doi.org/10.1002/qsar.200430905
7. Draize, J.H., G. Woodard and H.O. Calvery (1944). Methods for the study of irritation and toxicity of substances applied topically to the skin and mucous membranes. J. Pharmacol. Exp. Therapeutics, 82: 377–390; http://jpet.aspetjournals.org/content/82/3/377
8. Dimitrov, S., L. Low, G. Patlewicz, P. Kern, G. Dimitrova, M. Comber, R. Philips, J. Niemela, P. Bailey and O. Mekenyan (2005). Skin sensitization: modeling based on skin metabolism simulation and formation of protein conjugates. Intern. J. Toxicol. 24: 189-204; https://doi.org/10.1080/10915810591000631
9. Patlewicz, G., S. Dimitrov, L. Low, P. Kern, G. Dimitrova, M. Comber, A. Aptula, R. Phillips, J. Niemela, C. Madsen, E. Wedebye, D. Roberts, P. Bailey and O. Mekenyan (2007). TIMES-SS - A promising tool for the assessment of skin sensitization hazard. A characterization with

RiBaTox – Full Set of Fact Sheets
168
respect to the OECD validation principles for (Q)SARs and an external evaluation for predictivity. Regul. Toxicol. Pharmacol. 48: 225-239; https://doi.org/10.1016/j.yrtph.2007.03.003
10. Ringeissen, S., L. Marrot, R. Notea, A. Labarussiat, S. Imbert, M. Todorov, O. Mekenyan and J.R. Meunier (2011). Development of a mechanistic SAR model for the detection of phototoxic chemicals and use in an integrated testing strategy. Toxicol. in Vitro, 25(1): 324-334; https://doi.org/10.1016/j.tiv.2010.09.017
11. Dimitrov, S., G. Dimitrova, T. Pavlov, N. Dimitrova, G. Patlevisz, J. Niemela and O. Mekenyan (2005). A Stepwise Approach for Defining the Applicability Domain of SAR and QSAR Models. J. Chem. Inf. Model. 45: 839-849; https://doi.org/10.1021/ci0500381
12. Petkov, P., J. Rowlands, R. Budinsky, B. Zhao, M.S. Denison and O. Mekenyan (2010). Mechanism-based common reactivity pattern (COREPA) modelling of aryl hydrocarbon receptor binding affinity, SAR QSAR Environ Res. 21: 187-214; https://doi.org/10.1080/10629360903570933
13. Todorov M., E. Mombelli, S. Ait-Aissa and O. Mekenyan (2011). Androgen Receptor Binding Affinity: A QSAR Evaluation. SAR QSAR Environ Res. 22(3-4): 265-291; https://doi.org/10.1080/1062936X.2011.569508
14. Mekenyan, O. and R. Serafimova (2009). Mechanism-Based Modeling of Estrogen Receptor Binding Affinity. A common reactivity pattern (COREPA) Implementation. In: Endocrine Disruption Modeling, J. Devillers (Ed.). CRC Press, Boca Raton, pp. 259-293; https://www.crcpress.com/Endocrine-Disruption-Modeling/Devillers/p/book/9781138111912
Keywords
Human health, in vitro, in vivo, skin sensitisation, photo-induced toxicity, genotoxicity, Ames, chromosomal aberration, Comet, skin irritation/corrosion, eye irritation/corrosion, TGR
Related topics
Models for predicting human health endpoints – Eye irritation FS008 Models for predicting human health endpoints – Skin irritation/corrosion FS012 Models for predicting human health endpoints - Skin sensitization FS013 Model for predicting Photo-induced toxicity FS011 Models for predicting in vitro genotoxicity endpoints FS009 Models for predicting in vivo genotoxicity endpoints FS010 Models for predicting receptor mediated effects FS080 Model for predicting in vitro Aromatase inhibition FS081 Model for predicting in vitro Aryl hydrocarbon receptor binding affinity FS082
Contact information
Ovanes Mekenyan ([email protected]) Laboratory of Mathematical Chemistry, ‘Prof. As. Zlatarov’ University, Bourgas, Bulgaria

RiBaTox – Full Set of Fact Sheets
169
FP7 SOLUTIONS project - Fact Sheet 008
Name SOLUTIONS Tool or Service
FS008 Models for predicting human health endpoints – Eye irritation
Description
1. Objective
You have reached this factsheet because you are interested in eye irritation/corrosion of organic chemicals. Eye irritation is the production of changes in the eye (abnormal alteration of the cornea, conjunctiva or iris) following the application of test substance to the anterior surface of the eye [REF01].
The TIMES Eye irritation/corrosion model is based on in vivo data from the Draize eye irritation test in accordance with OECD TG 405, which continues to be the primary method accepted by regulatory agencies. Furthermore since for two decades no single in vitro assay has been developed and validated as a full replacement for the Draize Eye Irritation test.
2. Methodology
The training set of the model consists of 119 organic chemicals experimentally documented having modified maximum average score (MMAS). These experimental data [REF02] were provided by ECETOC (Belgium) and they are publicly available in the Toolbox databases. The model predicts the eye irritation potential of organic chemicals. The model is based on chemical categories, the so called Inclusion rules for eye irritation, which are empirically derived structural alerts.
An extrapolation step looking for skin irritation alerts is applied and this is due to the assumption that chemical causing Skin irritation /corrosion could also damage the eye.
The model performance is evaluated by the percent of correctly predicted irritants (sensitivity) – 81%. The training set of chemicals is not well balanced: from 119 chemicals 103 are positive and only 16 are experimentally observed negatives. In this respect, specificity of the model is not defined, given insufficiency of negatives in training set. In progress is work aiming to expand the training set and to improve the balance between active and non-active training chemicals.
The model domain was determined by splitting training chemicals into correctly and incorrectly predicted chemicals. The applicability domain consists of three layers: general parametric requirements – includes ranges of variation of log Kow, MW and Water solubility; structural domain – based on atom-centred fragments (ACFs); reliability of the inclusion rules – ratio between the number of correctly classified chemicals and the total number of chemicals including in the local training set of each chemical categories. The predictions of Eye irritation model could be reported in tab delimited file collecting the following information for the chemicals: chemical identity (CAS number, Name, SMILES) for predicted chemicals and found analogues, the observed data and prediction results for eye irritation, applicability domain details.
The model adopts the structural alerts of the Skin irritation/corrosion model FS012 which increases its capability to provide prediction for eye irritating potency of chemicals.
3. Application
The model is used successfully for evaluation the eye irritation potency of organic chemicals. It provides comprehensive information about the model applicability domain assessment which is the main indicator of the reliability of the prediction. The Eye irritation/corrosion model is used

RiBaTox – Full Set of Fact Sheets
170
by pharmaceutical, cosmetics, chemical industries and regulatory agencies. It could be applied alone or together with other TIMES Human Health models FS013 to obtain partial or complete hazard classification of chemicals.
References
1. Draize J.H., Woodard G., Calvery H.O. (1944). Methods for the study of irritation and toxicity of substances applied topically to the skin and mucous membranes. J. Pharm. Exp. Ther. 82: 377-390; http://jpet.aspetjournals.org/content/82/3/377
2. Kay J.H., Calandra J.C. (1962). Interpretation of eye irritation tests. J. Soc. Cosmet. Chem. 13: 281-289.
Keywords
Eye irritation, modified maximum average score (MMAS), skin irritation/corrosion, Toolbox databases, inclusion rules
Related topics
Models for predicting human health endpoints FS068 Models for predicting human health endpoints – Skin irritation/corrosion FS012 Models for predicting human health endpoints - Skin sensitization FS013 Model for predicting Photo-induced toxicity FS011 Models for predicting in vitro genotoxicity endpoints FS009 Models for predicting in vivo genotoxicity endpoints FS010
Contact information
Ovanes Mekenyan ([email protected]) Laboratory of Mathematical Chemistry, Bourgas "Prof. As. Zlatarov" University, Bourgas, Bulgaria
RiBaTox – Full Set of Fact Sheets
171
FP7 SOLUTIONS project - Fact Sheet 012
Name SOLUTIONS Tool or Service
FS012 Models for predicting human health endpoints – Skin irritation/corrosion
Description
1. Objective
You have reached this factsheet because you are interested in skin irritation or skin corrosion of organic chemicals. TIMES Skin irritation/corrosion is used in the assessment of the irritating potency of chemicals. It is based on the in vivo Draize rabbit test in accordance with OECD TG 404, which was developed over 60 years ago. This test continues to be a world standard considering the fact that for two decades no alternative in vitro test methods have been evaluated to fully replace the traditional animal protocols.
The model predicts the reversible (irritation) and irreversible (corrosion) damage of the skin following the application of a test substance.
2. Methodology
The training set of the model includes 3,175 organic chemicals, of which: skin irritants - 2,275, skin corrosives - 773 and negatives – 127. The data were collected according to the requirements of different systems, namely EU Classification and Labelling system (EU DSD classification), UN GHS Classification and Labelling and EU-GHS/CLP European System (EU CLP Classification). The activity of the chemicals has been evaluated by risk phrases (R34, R35 or R38 as well as H314, H315 or H316) and categories (Category 1, Category 2, Category 3), depending on the classification system. The Primary Irritation Indices (PII) were also used. Part of the experimental data was provided by the National Institute for Public Health and the Environment (RIVM) from The Netherlands; they are publicly available in the Toolbox databases [Ref01].
The skin irritation/corrosion model is based on the category approach for deriving structural alerts. Each of the categories includes functionally identical chemicals taking into account their irritating and corrosive effects. The alerts were grouped into 78 irritating and corrosive categories, the so-called Inclusion rules. They were hierarchically ordered and the chemicals were classified as Irritating, Corrosive to the skin or No alert found. The chemical categories are molecular functionalities which are assumed to trigger molecular initiating event (MIE) resulting to irritation/corrosion effect [Ref02, Ref03, Ref04, Ref05].
The model performance is 89%, evaluated by the percent of correctly predicted irritants and corrosives (sensitivity). The training set of chemicals is not well balanced: from 3,175 chemicals 3,048 are positive and only 127 are experimentally observed negative (Not irritating/corrosive) chemicals. In this respect, specificity of the model – 73% is based on insufficiency of negatives in the training set. Work is in progress aiming to expand the training set of chemicals and to improve the balance between active and non-active compounds.
The model domain was determined by splitting training chemicals into correctly and incorrectly predicted chemicals [Ref06]. The applicability domain consists of three layers: (i) general parametric requirements – which include ranges of variation of log Kow, MW and Water solubility; (ii) structural domain – based on atom-centred fragments (ACFs); (iii) reliability of the inclusion rules – ratio between the number of correctly classified chemicals and the total number of chemicals including in the local training set of each chemical categories.
The predictions of skin irritation/corrosion model could be reported in a tab delimited file including the following information for the chemicals: chemical identity (CAS number, Name,

RiBaTox – Full Set of Fact Sheets
172
SMILES) for predicted chemicals or found analogues, observed data and prediction results for skin irritation/corrosion, applicability domain details.
3. Application
Skin irritation/corrosion model is used successfully by pharmaceutical, cosmetics and chemical industry and regulatory agencies. It could be applied alone or in combination with other TIMES Human Health models FS008, FS013 to obtain partial or complete hazard classification of chemicals. The model applicability domain is derived from large number of training set chemicals which increases the reliability of the irritating potency assessment.
Within the SOLUTIONS project, the Skin irritation/corrosion model predictions have been used by partners involved in Chemical Analytical tools.
References
1. Kodithala K, Hopfinger AJ, Thompson ED, Robinson MK (2002). Prediction of skin irritation from organic chemicals using membrane-interaction QSAR analysis. Toxicol. Sci. 66: 336-346; https://doi.org/10.1093/toxsci/66.2.336
2. Hulzebos, E., J.D. Walker, I. Gerner, K. Schlegel (2005). Use of structural alerts to develop rules for identifying chemical substances with skin irritation or skin corrosion potential. QSAR Comb. Sci. 24(3): 332-342; https://doi.org/10.1002/qsar.200430905
3. Gerner, I., M.D. Barratt, S. Zinke, K. Schlegel, E. Schlede (2004). Development and prevalidation of a list of structure-activity relationship rules to be used in expert systems for prediction of the skin-sensitizing properties of chemicals. Altern. Lab. Anim. 32(5): 487-509; https://www.ncbi.nlm.nih.gov/pubmed/15656773
4. Saliner, A.G., I. Tsakovska, M. Pavan, G. Patlewicz, A.P. Worth (2007). Evaluation of SARs for the prediction of skin irritation/corrosion potential: structural inclusion rules in the BfR decision support system. SAR QSAR Environ. Res. 18(3-4): 331-342; https://doi.org/10.1080/10629360701304014
5. Basketter, D.A., D. Kan-King-Yu, P. Dierkes, I.R. Jowsey (2007). Does irritation potency contribute to the skin sensitization potency of contact allergens? Cutan. Ocul. Toxicol. 26(4): 279-286; https://doi.org/10.1080/15569520701555359
6. Dimitrov, S., G. Dimitrova, T. Pavlov, N. Dimitrova, G. Patlevisz, J. Niemela and O. Mekenyan (2005). J. Chem. Inf. Model. 45: 839-849; https://doi.org/10.1021/ci0500381
Keywords
Skin irritation/corrosion, EU DSD classification, UN GHS Classification, EU CLP Classification, Primary Irritation Indices, Toolbox databases, Inclusion rules, molecular initiating event (MIE)
Related topics
Models for predicting human health endpoints FS068 Models for predicting human health endpoints – Eye irritation FS008 Models for predicting human health endpoints - Skin sensitization FS013 Model for predicting Photo-induced toxicity FS011 Models for predicting in vitro genotoxicity endpoints FS009 Models for predicting in vivo genotoxicity endpoints FS010

RiBaTox – Full Set of Fact Sheets
173
Contact information
Ovanes Mekenyan ([email protected]) Laboratory of Mathematical Chemistry, Bourgas "Prof. As. Zlatarov" University, Bourgas, Bulgaria

RiBaTox – Full Set of Fact Sheets
174
FP7 SOLUTIONS project - Fact Sheet 013
Name SOLUTIONS Tool or Service
FS013 Models for predicting human health endpoints - Skin sensitization
Description
1. Objective
You have reached this factsheet because you are interested in the skin sensitization effect. Skin sensitization is a complex toxicological process involving a number of biochemical and physiological events. Metabolism is frequently acknowledged to significantly affect sensitization. The complexity of describing it could explain why traditional QSAR approaches for modelling skin sensitization have shown limited success. This document provides a brief description of TIMES Skin sensitization model that predicts the skin sensitisation effect by taking into account metabolic activation of chemicals.
Skin sensitization is a toxicological endpoint that is affected by the ban on animal testing for cosmetic ingredients according to EU regulations. It is also an endpoint where there is a reasonable understanding about the factors involved in skin sensitization induction that allows the use of alternative hazard testing methods and in silico methods. In this aspect the TIssue MEtabolism Simulator for predicting Skin Sensitization (TIMES-SS) has been developed [Ref01].
2. Methodology
The TIMES-SS model integrates a simulator of skin metabolism together with a list of alerts for protein binding based on a training set of 988 chemicals. The reliability of the alerts in the TIMES-SS model has been also evaluated to provide transparent mechanistic reasoning for predicted sensitization potential. Because of the paucity of reported skin metabolism data, initially the simulator transformations were developed based on empirical and theoretical knowledge. The transformation probabilities (defining the priority of their execution) were parameterized to reproduce skin sensitization data. Currently, the simulator has been upgraded and adjusted to simulate the documented in vitro metabolism of 151 chemicals. The simulator comprises of about 450 transformations, which can be divided into four main types: abiotic transformations, covalent interaction with proteins, Phase I and Phase II reactions. Autoxidation (AU) of chemicals is also accounted for.
The skin sensitization model predicts skin sensitization effect in three classes: strong, weak and non-sensitizers. For the 988 training set chemicals, the model was able to predict correctly 86% of the strong sensitizers, 56% of the weak sensitizers and 80% of the non-sensitizers, i.e. an overall performance of 78%.
Model predictions are accompanied by information on the chemical’s status in respect to the applicability domain of the model, using the stepwise approach developed by Dimitrov et al. [Ref02]. Two levels of the domain were implemented: general parametric requirements and structural domain. The first level specifies in the domain only those chemicals that fall in the range of variation of the physicochemical properties of the chemicals in the training set, e.g. log KOW and MW. The second stage defines the structural similarity between chemicals that are correctly predicted by the model. The structural neighbourhood of atom-centred fragments is used to determine this similarity.
3. Application
The TIMES-SS model is applicable for assessing the skin sensitization effect of organic substances

RiBaTox – Full Set of Fact Sheets
175
only. The model is used by different cosmetic and chemical companies. The simulation of skin metabolism and the assessment of simulated metabolites is performed on the same platform. All predictions are supported by mechanistic justification. The model could be considered as a decision supporting rather than decision making system, allowing the user to take the ultimate decision based on provided mechanistic support.
Within the SOLUTIONS project, the Skin Sensitization model predictions have been used by partners involved in the Chemical Analytical tools.
References
1. Dimitrov, S., L. Low, G. Patlewicz, P. Kern, G. Dimitrova, M. Comber, R. Philips, J. Niemela, P. Bailey, O. Mekenyan (2005). Skin sensitization: modeling based on skin metabolism simulation and formation of protein conjugates. Intern. J. Toxicol. 24: 189-204; https://doi.org/10.1080/10915810591000631
2. Dimitrov, S., G. Dimitrova, T. Pavlov, D. Dimitrova, G. Patlevisz, J. Niemela, O. Mekenyan (2005). A stepwise approach for defining the applicability domain of SAR and QSAR models. J. Chem. Inf. Model. 45: 839-849; https://doi.org/10.1021/ci0500381
Keywords
Skin sensitization, TIMES-SS, metabolic activation, skin metabolism
Related topics
Models for predicting human health endpoints FS068 Models for predicting human health endpoints – Eye irritation FS008 Models for predicting human health endpoints – Skin irritation/corrosion FS012 Models for predicting human health endpoints - Skin sensitization FS013 Model for predicting Photo-induced toxicity FS011 Models for predicting in vitro genotoxicity endpoints FS009 Models for predicting in vivo genotoxicity endpoints FS010
Contact information
Ovanes Mekenyan ([email protected])
Laboratory of Mathematical Chemistry, Bourgas "Prof. As. Zlatarov" University, Bourgas, Bulgaria

RiBaTox – Full Set of Fact Sheets
176
FP7 SOLUTIONS project - Fact Sheet 011
Name SOLUTIONS Tool or Service
FS011 Model for predicting Photo-induced toxicity
Description
1. Objective
This factsheet provides you with a brief information concerning the applicability of a SAR model for identification of organic chemicals that are able to produce phototoxic effects. Photo-induced toxicity is of increasing concern since modern lifestyle is often associated with exposure to sunlight. Therefore characterizing the phototoxic potential, especially for compounds likely to undergo sunlight exposure in skin, is an important activity in the field of computational toxicology.
Photo-induced toxicity is an acute toxic response elicited after the first exposure of skin to certain chemicals and subsequent exposure to light/UV radiation, or that is similarly induced by skin irradiation after the systemic administration of a chemical. Photo-induced toxicity is an acute toxic response elicited after the first exposure of skin to certain chemicals and subsequent exposure to light/UV radiation, or that is similarly induced by skin irradiation after the systemic administration of a chemical.
The phototoxic response associated to a certain chemical is considered as an outcome of competing processes between structural (such as stability and light absorbance) and environmental (energy quanta with a specific wave length) factors. The molecular descriptor Energy gap (EGAP) between highest occupied and lowest unoccupied molecular orbitals (EHOMO – ELUMO) which accounts both processes was successfully used for modelling the effect of photo-induced toxicity [Ref01].
2. Methodology
A training set of structural diverse chemicals was compiled from public sources [Ref02]. This set covers a broad range of structural classes, including non-steroidal anti-inflammatory drugs (NSAIDs), anti-bacterial agents, drugs to treat skin diseases, synthetic fragrances, sunscreens and dyes. The experimental phototoxicity data was obtained by 3T3 Neutral Red Uptake Phototoxicity test [Ref03] for all training set chemicals.
A general rule which requires cyclic moiety in the molecules was used as pre-screen for all chemicals in this study. Its importance is confirmed by the fact that molecules that can undergo photochemical activation are those with extended conjugation of double bonds or aromatic rings [Ref04]. The electronic parameters such as EGAP in a flexible molecule are strongly affected by its conformational flexibility. For this purpose a method based on genetic algorithm for coverage of the conformational space by a limited number of conformers [Ref05] was applied to all training set chemicals. Further selection of the most stable conformers (i.e., those with minimum heat of formation) was found to best distinguish the phototoxic and non-phototoxic chemicals in the bell-shaped relationship established for calculated EGAP values. As a result a ‘phototoxic window’ was defined in the range of EGAP from 6.50 to 8.60 eV [Ref02]. Based on calculated values of EGAP the model could be applied for predictions of large chemical inventories of practical concern.
The performance of the model was assessed in terms of sensitivity and specificity by screening the training data set. The model sensitivity (correctly predicted phototoxic chemicals) was found to be 86%. On the other hand, the specificity (correctly predicted non-phototoxic chemicals) is
RiBaTox – Full Set of Fact Sheets
177
64%. Due to the low specificity, additional analyses were done for the chemicals predicted as false positives (non-phototoxic predicted as phototoxic).
The false positive predictions can be explained by the fact that such chemical could absorb light, however, they still could be non-phototoxic because the absorbed light could cause their photo-degradation. A literature support for photo-degradation was found for three non-phototoxic chemicals in 3T3 NRU Test - Moxifloxacin [Ref06] Octyl methoxycinnamate [Ref07] and Piroxicam [Ref08] presently predicted to be phototoxic by the model. If this fact is taken into account the ultimate specificity of the model will increase up to 86%.
In short, the positive predictions by our model will be an indicator for phototoxicity only if the chemicals are not photodegradable. In this respect further improvement of the model may be focused on addition of the photo-degradation spectrum of the investigated chemicals which could be recorded to demonstrate whether the compound is stable or not under UV.
A stepwise approach is used to define the applicability domain of each model [Ref09]. All models include a sub-domain level of general parametric requirements. It includes ranges of variation of relevant parameters, e.g. log KOW, MW. A chemical is considered In Domain if its log KOW, MW, etc. are within the specified ranges. The second level is the structural domain based on atom-centred fragments (ACFs). The structural domain is able to evaluate whether the ACFs of a target chemical are present in the training chemicals used to derive the model. The information implemented in the applicability domain is extracted from the correctly predicted training chemicals used to build the model and as such the applicability domain determines the interpolation space of the model.
3. Application
Considering the broad range of chemicals to which humans are exposed, there is a need for fast and reliable approach for detecting phototoxicants. In this respect the use of in silico model for evaluation the phototoxic effect of structural diverse organic molecules will help in toxicological screening programs. The model is used by companies to assess the phototoxic effect of ingredients in cosmetic products.
Within the SOLUTIONS project, photo-induced toxicity model predictions have been used by partners involved in Chemical Analytical tools.
References
1. Mekenyan, O., G. Ankley, G. Veith, D. Call, 1994. QSARs for photoinduced toxicity: I acute lethality of polyaromatic hydrocarbons to Daphnia magna. Chemosphere, 28(3): 567–582; https://doi.org/10.1016/0045-6535(94)90299-2
2. Ringeissen, S., L. Marrot, R. Note, A. Labarussiat, S. Imbert, M. Todorov, O. Mekenyan and Jean-Roch Meunier, 2011. Development of a mechanistic SAR model for the detection of phototoxic chemicals and use in an integrated testing strategy. Toxicol. In Vitro, 25(1): 324-334; https://doi.org/10.1016/j.tiv.2010.09.017
3. DB-ALM Protocol 78 - 3T3 Neutral Red Uptake (NTU) Phototoxicity Assay. https://eurl-ecvam.jrc.ec.europa.eu/validation-regulatory-acceptance/doc-phototox/INVITTOX-DB-ALM-78.pdf
4. Kleinman, M.H., M.D. Smith, E. Kurali, S. Kleinpeter, K. Jiang, Y. Zhang, S.A. Kennedy-Gabb, A.M. Lynch, C.D. Geddes, 2010. An evaluation of chemical photoreactivity and the relationship to phototoxicity Regul. Toxicol. Pharmacol. 58(2): 224-232; https://doi.org/10.1016/j.yrtph.2010.06.013
5. Pavlov, T., Todorov, M., Stoyanova, G., Schmieder, P., Aladjov, H., Serafimova, R., Mekenyan, O., 2007. Conformational coverage by a genetic algorithm: saturation of

RiBaTox – Full Set of Fact Sheets
178
conformational space. J. Chem. Inf. Model. 47: 851–863; https://doi.org/10.1021/ci700014h
6. Agrawal, N, Ray RS, Farooq M, Pant AB, Hans RK, 2007. Photosensitizing potential of ciprofloxacin at ambient level of UV radiation. Photochem. Photobiol. 83(5): 1226-1236; https://doi.org/10.1562/2006-10-12-RA-1059
7. Butt, S.T. and Christensen T., 2000. Toxicity and phototoxicity of chemical sun filters. Radiat. Prot. Dosim. 91: 283-286; https://doi.org/10.1093/oxfordjournals.rpd.a033219
8. Western, A, Van Camp JR, Bensasson R, Land EJ, Kochevar IE, 1987. Involvement of singlet oxygen in the phototoxicity mechanism for a metabolite of piroxycam. Photochem. Photobiol. 46(4): 469-475; https://doi.org/10.1111/j.1751-1097.1987.tb04797.x
9. Dimitrov, S., G. Dimitrova, T. Pavlov, D. Dimitrova, G. Patlevisz, J. Niemela, O. Mekenyan, 2005. A stepwise approach for defining the applicability domain of SAR and QSAR models. J. Chem. Inf. Model. 45: 839-849; https://doi.org/10.1021/ci0500381
Keywords
Photo-induced toxicity, QSAR, 3T3 Neutral Red Uptake Phototoxicity test
Related topics
Models for predicting human health endpoints FS068 Models for predicting human health endpoints – Eye irritation FS008 Models for predicting human health endpoints – Skin irritation/corrosion FS012 Models for predicting human health endpoints - Skin sensitization FS013 Models for predicting in vitro genotoxicity endpoints FS009 Models for predicting in vivo genotoxicity endpoints FS010
Contact information
Ovanes Mekenyan ([email protected])
Laboratory of Mathematical Chemistry, Bourgas "Prof. As. Zlatarov" University, Bourgas, Bulgaria

RiBaTox – Full Set of Fact Sheets
179
FP7 SOLUTIONS project - Fact Sheet 009
Name SOLUTIONS Tool or Service
FS009 Models for predicting in vitro genotoxicity endpoints
Description
1. Objective
You have reached this factsheet because you are interested in in vitro genetic toxicity endpoints such as the bacterial reverse mutation assay (Ames test) and/or the mammalian chromosomal aberrations (CA test). OECD has recommended evaluation of substances to be performed by these two in vitro tests prior to in vivo evaluation. One should not expect that both tests will always provide simultaneously positive or negative results due to their different tests capacity and different nature of used cells (bacteria vs. mammalian).
The in vitro TIMES genotoxicity models were derived to predict potential of structurally diverse chemicals to elicit bacterial (Ames) or mammalian chromosomal (CA) damages. A common feature of both in vitro TIMES mutagenicity models is that they combine a simulator of metabolism and a model assessing the reactivity of chemicals and their metabolites. The TIMES software allows prediction of mutagenicity with and without application of the simulator of S9 metabolism. This functionality of the system enables predictions of Ames and CA mutagenicity in both tests conditions: with and without S9 metabolic activation.
2. Methodology
The reactivity component of the models describes endpoint-specific interactions of chemicals using an alerting group approach [Ref01, Ref02]. Toxicophores were extracted only from parent structures included in the training sets. Alerts having a clear interpretation of the molecular mechanism causing the ultimate effect were included in the models.
When the mutagenicity model is applied with S9, the reactivity component was combined with a metabolic simulator, which was trained to reproduce documented maps for mammalian (mainly rat) liver metabolism for 332 xenobiotic chemicals of a wide structural diversity [Ref03]. The organic compounds belong to different classes of industrial chemicals, including single and fused-ring arenes, phenols, halo-alkanes and halo-arenes, aromatic and aliphatic amines, nitro-arenes, alkanes and cycloalkanes, alkenes, ethers, carboxylic acids and their derivatives, alcohols, epoxides, N-nitroso-amines, etc.
When a new chemical is submitted for prediction, first all plausible in vitro metabolites are generated. The parent chemical and each of the generated metabolites are submitted to a battery of models (alerting groups) to screen for a mutagenicity effect. The substances are predicted to be mutagenic as parents only, parents and metabolites, or metabolites only.
Both in vitro genotoxicity models possess different training sets, different number of alerts and different applicability domains. In this respect:
• The reactivity component of the in vitro Ames model consists of 92 structural alerts, associated with mechanistic justification for the possible interaction with DNA [Ref03]. The training set of the Ames model (-S9) includes 4,104 structurally diverse chemicals. For these chemicals, the Ames model (-S9) was able to predict correctly 84% of the Ames positive and 95% of the Ames negative chemicals. When metabolic activation is taken into account, the Ames model (+S9) consisting of 3,107 training set chemicals, predicts 78% of the Ames positive and 82% of the Ames negative chemicals.
• The in vitro CA reactivity consists of two models: a model for bacterial Ames

RiBaTox – Full Set of Fact Sheets
180
mutagenicity, already presented above, and a model accounting for the inhibition of topoisomerases and/or interaction of chemicals with histone proteins [Ref02]. Currently, the total number of alerting groups included in the CA model is 123: 92 for DNA binding and 31 for protein binding groups. For the total number of 1,040 training set chemicals, the CA model (-S9) was able to predict correctly 77% of the CA positive and 89% of the CA negative chemicals. When metabolic activation is taken into account, the CA model (+S9) consisting of 369 training set chemicals, predicts 71% of the CA positive and 73% of the CA negative chemicals.
A stepwise approach is used to define the applicability domain of each model [Ref04]. Both models include a sub-domain level of general parametric requirements. It includes ranges of variation of relevant parameters, e.g. log KOW, MW. A chemical is considered In Domain if its log KOW, MW, etc are within the specified ranges. The second level is the structural domain based on atom-centered fragments (ACFs). The structural domain is able to evaluate whether the ACFs of a target chemical are present in the training chemicals used to derive the model. A specific third level of the domain is developed for the different TIMES models. The in vitro TIMES genotoxicity models include a domain level which determines reliability of the alerts. Depending of the number of chemicals in the local training sets, performance of the alert and availability of mechanistic justification each alert is assigned to have:
• high performance – at least 10 chemicals and performance higher than 60%, • low performance – at least 10 chemicals and performance less than 60%, • undetermined – less than 10 chemicals, no matter the performance, • undetermined theoretical – only mechanistic justification is available.
In this respect, the in vitro Ames models includes: 50 high performance alerts, 30 undetermined alerts and 11 undetermined theoretical alerts. On the other hand, the in vitro CA model includes: 27 high performance alerts, 46 undetermined and 47 undetermined theoretical alerts.
3. Application
These two in vitro models are applicable for assessing genotoxicity of organic substances only. The models have been found valuable by government institutions and industries evaluating some azo-dyes, ingredients in cosmetic products, genetic impurities, etc. Industrial and environmental chemicals eliciting their toxicity as a result of direct interaction with macromolecules are often screened by OASIS TIMES Ames and CA models since each prediction is supported by mechanistic justification of the effect. In this respect, in vitro TIMES genotoxicity models are considered as decision supporting rather than decision making systems, allowing users to take ultimate decision based on provided mechanistic rationale.
Within the SOLUTIONS project, in vitro genotoxicity predictions have been used by partners involved in Chemical Analytical tools. Ames mutagenicity predictions have been also used to identify candidate mutagens in EDA of water samples from the River Rhine FS075.
References
1. Serafimova, R., Todorov, M., Pavlov, T., Kotov, S., Jacob, E., Aptula, A., Mekenyan, O. (2007). Identification of the structural requirements for mutagencitiy by incorporating molecular flexibility and metabolic activation of chemicals. II. General Ames mutagenicity model. Chem. Res. Toxicol. 20: 662-676; https://doi.org/10.1021/tx6003369
2. Mekenyan O, Todorov M, Serafimova R, Stoeva S, Aptula A, Finking R, Jacob. E. (2007). Identifying the structural requirements for chromosomal aberration by incorporating molecular flexibility and metabolic activation of chemicals. Chem. Res. Toxicol. 20: 1927-1941; https://doi.org/10.1021/tx700249q

RiBaTox – Full Set of Fact Sheets
181
3. Mekenyan O, Dimitrov S, Pavlov T, Dimitrova G, Todorov M, Petkov P, Kotov S. (2012). Simulation of chemical metabolism for fate and hazard assessment. V. Mammalian hazard assessment, SAR QSAR Environ. Res. 23(5-6): 553-606; https://doi.org/10.1080/1062936X.2012.679689
4. Dimitrov S, Dimitrova G, Pavlov T, Dimitrova N, Patlewicz G, Niemela J, Mekenyan O. 2005. A stepwise approach for defining the applicability domain of SAR and QSAR models. J. Chem. Inf. Model. 45: 839-849; https://doi.org/10.1021/ci0500381
Keywords
Mutagenicity, Ames, Chromosomal aberrations, TIMES in vitro genotoxicity models
Related topics
Models for predicting human health endpoints FS068 Models for predicting human health endpoints – Eye irritation FS008 Models for predicting human health endpoints – Skin irritation/corrosion FS012 Models for predicting human health endpoints - Skin sensitization FS013 Model for predicting Photo-induced toxicity FS011 Models for predicting in vivo genotoxicity endpoints FS010
Contact information
Ovanes Mekenyan ([email protected]) Laboratory of Mathematical Chemistry, Bourgas "Prof. As. Zlatarov" University, Bourgas, Bulgaria

RiBaTox – Full Set of Fact Sheets
182
FP7 SOLUTIONS project - Fact Sheet 010
Name SOLUTIONS Tool or Service
FS010 Models for predicting in vivo genotoxicity endpoints
Description
1. Objective
You have reached this factsheet because you are interested in in vivo genetic toxicity endpoints. In vivo endpoints are important part of the standard battery of mutagenicity tests proposed by the OECD since in addition to metabolic activation these systems account for detoxification of substances. Therefore, chemicals which are positive in in vitro genotoxicity tests are often negative in the in vivo tests.
The in vivo TIMES genotoxicity models are derived for identification of organic substances eliciting genotoxicity/mutagenicity effects in living animals, particularly in rodents (rats and mice). The models are designed accounting for the fact that enzymes are aggregated in multi-enzyme complexes and the cells could be protected from reactive metabolites via shuttling intermediates between consecutive enzymes [Ref01].
2. Methodology
The in vivo genotoxicity models were built based on three components: a reactivity component, a simulator of metabolism, and detoxification logics. The reactivity component describes endpoint-specific interactions of substances using an alerting group approach. Only alerts having a clear interpretation of the molecular mechanism causing the ultimate effect are included in the models.
The reactivity model is combined with an in vivo metabolism simulator reproducing the multi-pathway xenobiotic metabolism in living rats on the basis of metabolic pathways of xenobiotic chemicals. The current version of the in vivo metabolism simulator which is the same in all in vivo genotoxicity models consists of 506 structurally generalized molecular transformations [Ref02].
Aiming to simulate in vivo availability of parents and their metabolites in the principle organs of this investigation, a number of detoxification and bio-activation metabolic pathways were defined [Ref03].
When a new chemical is submitted for prediction, the system applies the in vivo rat liver metabolism simulator to generate all plausible metabolites of the parent substance. Then, the parent and its metabolites are screened by the alerts included in the model. If no alert is found, the substance is assumed to be in vivo non-mutagenic. However, presence of an alert does not necessarily mean that the substance is in vivo mutagenic. The substances containing alerts are screened by a number of detoxification pathways. If detoxification pathways have been found to ‘extinguish’ reactivity of the alerts, mutagenicity will not be elicited in the target organ. If detoxification pathways have not been found, the substance is assumed to be in vivo mutagenic.
Currently, there are four in vivo genotoxicity models included in the TIMES platform: • In vivo liver genotoxicity (comet assay) model identifies chemicals that cause long-length
DNA damages in the liver of rats or mice. The total number of the alerting groups included in this model is 105. The reactivity of parent chemicals and generated metabolites is controlled by 44 in vivo detoxification pathways associated with

RiBaTox – Full Set of Fact Sheets
183
mechanistic justification. For the total number of 152 training set chemicals, the in vivo liver genotoxicity (comet) model was able to predict correctly 88% of the comet positive and 77% of the comet negative chemicals.
• In vivo liver clastogenicity model is based on micronucleus (MNT) or chromosomal aberrations (CA) liver data. The model identifies chemicals that elicit DNA and/or protein damages in liver of rats or mice. Currently, the model comprises of 124 alerting groups: 92 associated with DNA binding and 32 for protein binding. 48 in vivo detoxification pathways have been implemented into the in vivo liver clastogenicity model to provide some insight on liver detoxification. For the total number of 116 training set chemicals, the model was able to predict correctly 82% of the in vivo liver MNT or CA positive and 68% of the negative chemicals.
• The in vivo liver transgenic rodent (TGR) model identifies chemicals that cause in vivo gene mutations (mainly point mutations and small deletions and insertions) in transgenic rats and mice. The model consists of 97 structural alerts and 77 in vivo detoxification pathways associated with mechanistic justification. Out of the 137 training set chemicals, the model was able to predict correctly 80% of the positive and 83% of the negative chemicals.
• The in vivo model for predicting bone marrow MNT results is based on the assessment of the potential of chemicals to interact with DNA and proteins [Ref03]. Thus, reactivity of the in vivo MNT model is essentially that of the in vitro CA model and includes 124 alerts: 92 for DNA binding and 32 for protein binding. Included are 123 endpoint-specific detoxification pathways associated with supporting mechanistic information. For the total number of 475 training set chemicals, the in vivo bone marrow MNT model was able to predict correctly 78% of the MNT positive and 79% of the MNT negative chemicals.
A stepwise approach is used to define the applicability domain of each model [Ref04]. All in vivo TIMES genotoxicity models include a sub-domain level of general parametric requirements. It includes ranges of variation of relevant parameters, e.g. log KOW, MW. A chemical is considered In Domain if its log KOW, MW, etc. are within the specified ranges. The second level is the structural domain based on atom-centred fragments (ACFs). The structural domain is able to evaluate whether the ACFs of a target chemical are present in the training chemicals used to derive the model. A specific third level of the domain is developed for the different TIMES models. The in vivo TIMES genotoxicity models include a domain level which determines reliability of the alerts. Alerts of the in vivo genotoxicity models are directly borrowed from the in vitro genotoxicity models FS009. However, the number of chemicals supporting the in vivo alerts appears to be smaller than the number of chemicals supporting the in vitro alert. This imposes the fact that reliability estimates of the in vivo alerts to be lower than the reliability of the in vitro alerts.
3. Application
OASIS TIMES in vivo genotoxicity models are applicable for assessing toxicity of organic substances only. The models have been found valuable by government institutions and industries evaluating some azo-dyes, ingredients in cosmetic products, genetic impurities, etc. Predictions by the TIMES models are supported by mechanistic justification not only for the positive effect but also when metabolic detoxification leads to a negative effect. In this respect, in vivo TIMES genotoxicity models are considered as decision supporting rather than decision making systems, because they allow users to take the ultimate decision based on provided mechanistic support.
Within the SOLUTIONS project, the in vivo genotoxicity models' predictions were used by

RiBaTox – Full Set of Fact Sheets
184
partners involved in Chemical Analytical tools.
References
1. Patlewicz G, Mekenyan O, Dimitrova G, Kuseva C, Todorov M, Kotov S, Stoeva S, Donner EM. (2010). Can mutagenicity information be useful in an Integrated Testing Strategy (ITS) for skin sensitization? SAR QSAR Environ. Res. 21: 619-656; https://doi.org/10.1080/1062936X.2010.528447
2. Mekenyan O, Dimitrov S, Pavlov T, Dimitrova G, Todorov M, Petkov P, Kotov S. (2012). Simulation of chemical metabolism for fate and hazard assessment. V. Mammalian hazard assessment. SAR QSAR Environ. Res. 23(5-6): 553-606; https://doi.org/10.1080/1062936X.2012.679689
3. Mekenyan O, Petkov PI, Kotov SV, Stoeva S, Kamenska VB, Dimitrov SD, Honma M, Hayashi M, Benigni R, Donner EM, Patlewicz G. (2012). Investigating the relationship between in vitro/in vivo genotoxicity: derivation of mechanistic QSAR models for in vivo liver genotoxicity and in vivo bone marrow micronucleus formation which encompass metabolism. Chem. Res. Toxicol. 25: 277–296; https://doi.org/10.1021/tx200547s
4. Dimitrov S, Dimitrova G, Pavlov T, Dimitrova N, Patlewicz G, Niemela J, Mekenyan O. (2005). A stepwise approach for defining the applicability domain of SAR and QSAR models. J. Chem. Inf. Model. 45: 839-849; https://doi.org/10.1021/ci0500381
Keywords
Comet, transgenic rodent mutations, micronucleus, TIMES, in vivo genotoxicity models
Related topics
Models for predicting human health endpoints FS068 Models for predicting human health endpoints – Eye irritation FS008 Models for predicting human health endpoints – Skin irritation/corrosion FS012 Models for predicting human health endpoints - Skin sensitization FS013 Model for predicting Photo-induced toxicity FS011 Models for predicting in vitro genotoxicity endpoints FS009
Contact information
Ovanes Mekenyan ([email protected]) Laboratory of Mathematical Chemistry, Bourgas "Prof. As. Zlatarov" University, Bourgas, Bulgaria

RiBaTox – Full Set of Fact Sheets
185
FP7 SOLUTIONS project - Fact Sheet 080
Name SOLUTIONS Tool or Service
FS080 Models for predicting receptor mediated effects (estrogen/androgen binding)
Description
1. Objective
You reached this factsheet because you are interested in predicting receptor -mediated effects of organic chemicals. This factsheet provides you with a brief information concerning applicability of models for identification of organic chemicals able to bind the estrogen/androgen receptor. Endocrine disruption could be provoked by direct binding of xenobiotics to the respective receptor and its further activation. The models for the estrogen/androgen receptor binding model assess the in vitro relative binding affinity of chemicals towards estrogen/androgen receptors.
The presence of the so-called endocrine disruptors in the environment has become a worldwide environmental concern. It has been concluded that such compounds can act in a same way as endogenous hormones eliciting a variety of adverse effects in both humans and wildlife.
The concern associated with xenobiotics that may bind to the androgen or estrogen receptors has created a need for development of models to predict their possible effect.
2. Methodology The TIMES estrogen receptor binding model is based on the assumption that distances between electrophilic sites in the receptor determine the requirements for the binding mechanism [Ref01]. Analysis of common reactivity patterns [Ref02] of the most active estrogen binders based on the distance between electrophilic sites, resulted in identification of distinct interaction types, summarized as:
• Steroid-like A-B type, modulated by steric and electronic interactions; • A-C type, where the local hydrophobic interactions were found to be significant; • Mixed A-B-C type, modulated by stereo-electronic parameters; • A-type mechanism specified for phenolic chemicals with lowest estrogenic affinity.
For the aims of the modelling process, the training set was split into five activity ranges with respect to the relative binding affinity (RBA) values. Strong ER binders (RBA>10%), moderate (10%>RBA>0.1%), weak binders (0.1>RBA>0.001), low (0.001>RBA>0.00001) and inactive (non-binders) chemicals (RBA less than 0.001%). The model is based on categories defined by distances between electrophilic sites and additional molecular descriptors. The ultimate model is organized as a battery of all categories related to the each interaction type in the respective binding affinity range [Ref02], [Ref03].
When a chemical is submitted for prediction, the requirements for strong ER binding are first applied. If the chemical does not fulfil all of them, then the requirements for the lower activity bins are applied sequentially. If the chemical passes through the activity bins without meeting a binding requirement, then the ultimate prediction is a not ER binder.
According to the performance of the model when applied on the training set chemicals (570 binders and 1317 non binders), correct predictions are provided for:
• 431 out of 554 chemicals ER binders as parents (Sensitivity = 78 %) • 1203 out of 1313 chemicals non binders as parents (Specificity = 92%)

RiBaTox – Full Set of Fact Sheets
186
The TIMES androgen receptor-binding model assesses the in vitro relative binding affinity (RBA) of chemicals to interact with the androgen receptor.
Chemicals in the training set were categorized according to their potency and grouped into four activity bins: highly active with RBA>10%; moderate with 0.1%<RBA<10%; low with 0.001%<RBA<0.1% and non-active with RBA<0.001%. For each potency bin, the ability of the chemicals to bind the receptor was related to the distances between nucleophilic sites and structural features describing electronic and hydrophobic interactions between the receptor and ligands. Categorical models were derived for each binding affinity range in terms of specific distances, local (maximal donor delocalizability associated with the oxygen atom), global nucleophilicity (partial positive surface areas and energy of the highest occupied molecular orbital) and hydrophobicity (log Kow) of the molecules. An integral screening tool for predicting binding affinity to AR was constructed as a battery of models each associated with different activity bins [Ref04].
The performance of the model, based on its application on the training set chemicals (140 binders and 62 non-binders), is as follows:
• Sensitivity 78% (101 out of 132 chemicals are predicted correctly as ER binders); • Specificity 92% (54 out of 59 chemicals are predicted correctly as non-binders).
A stepwise approach is used to define the applicability domain of each model [Ref05]. All models include a sub-domain level of general parametric requirements. It includes ranges of variation of relevant parameters, e.g. log KOW, MW. A chemical is considered In domain if its log KOW, MW, etc. are within the specified ranges. The second level is the structural domain based on atom-centred fragments (ACFs). The structural domain is able to evaluate whether the ACFs of a target chemical are present in the training chemicals used to derive the model. The information implemented in the applicability domain is extracted from the correctly predicted training chemicals used to build the model and as such the applicability domain determines the interpolation space of the model.
3. Application
Considering the broad range of chemicals to which humans are exposed, there is a need for a fast and reliable approach for detecting endocrine disrupting chemicals. In this respect the use of in silico models for identification of potential binders for androgen and estrogenic receptors will help in toxicological screening programs.
The model is used by companies to assess the effect of ingredients in different products. Recently the performances of both models have been externally validated by a screening exercise performed by the Dow Chemical Company [Ref06]. In this study a set of more than 1,800 ToxCast™ Phase II compounds were used for evaluation of the sensitivity and specificity of the model. The sensitivity (correct predictions for binders) was found to be greater than 90% and specificity (correct predictions for non-binders) 80% for predictions in the model domain. The authors recommend the use of the models as reliable tools for identification of compounds able to bind the estrogen/androgen receptor.
Within SOLUTIONS project, both receptor mediated model predictions have been used by partners involved in Chemical Analytical tools.
References
1. Katzenellenbogen, J. (2002). Effectiveness of QSAR for prescreening of endocrine disruptor hazard. SCOPE/IUPAC International Symposium on Endocrine Active Substances, Yokohama, Japan; https://doi.org/10.1210/endo.143.5.9999
2. Serafimova, S.R., M. Todorov, D. Nedelcheva, T. Pavlov, Y. Akahori, M. Nakai and O.

RiBaTox – Full Set of Fact Sheets
187
Mekenyan (2007). QSAR and mechanistic interpretation of estrogen receptor binding. SAR QSAR Environ. Res. 18: 1-33; https://doi.org/10.1080/10629360601053992
3. Mekenyan, O. and R. Serafimova (2009). Mechanism-Based Modeling of Estrogen Receptor Binding Affinity A COREPA Implementation. CRC Press, (2009), pp. 259-293; https://www.taylorfrancis.com/books/9781420076363/chapters/10.1201%2F9781420076363-10
4. Todorov M., E. Mombelli, S. Ait-Aissa and O. Mekenyan (2011). Androgen Receptor Binding Affinity: A QSAR Evaluation. SAR QSAR Environ. Res. 22(3-4): 265-291; https://doi.org/10.1080/1062936X.2011.569508
5. Dimitrov, S., G. Dimitrova, T. Pavlov, N. Dimitrova, G. Patlevisz, J. Niemela and O. Mekenyan (2005). A Stepwise Approach for Defining the Applicability Domain of SAR and QSAR Models. J. Chem. Inf. Model. 45: 839-849; https://doi.org/10.1021/ci0500381
6. Bhhatarai, B., D.M. Wilson, P.S. Price, S. Marty, A.K. Parks and E. Carney (2016). Evaluation of OASIS QSAR Models Using ToxCast™ in Vitro Estrogen and Androgen Receptor Binding Data and Application in an Integrated Endocrine Screening Approach. Environ. Health Perspect. 124(9): 1453-1461; https://doi.org/10.1289/EHP184
Keywords
Receptor mediated effects, QSAR, computational toxicology, androgen binding, estrogen binding
Related topics
Models for predicting human health endpoints FS068 Models for predicting human health endpoints – Eye irritation FS008 Models for predicting human health endpoints – Skin irritation/corrosion FS012 Models for predicting human health endpoints - Skin sensitization FS013 Model for predicting Photo-induced toxicity FS011 Models for predicting in vitro genotoxicity endpoints FS009 Models for predicting in vivo genotoxicity endpoints FS010 Model for predicting in vitro Aromatase inhibition FS081 Model for predicting in vitro Aryl hydrocarbon receptor binding affinity FS082
Contact information
Ovanes Mekenyan ([email protected]) Laboratory of Mathematical Chemistry, ‘Prof. As. Zlatarov’ University, Bourgas, Bulgaria

RiBaTox – Full Set of Fact Sheets
188
FP7 SOLUTIONS project - Fact Sheet 081
Name SOLUTIONS Tool or Service
FS081 TIMES model for predicting aromatase inhibition potency
Description
1. Objective
You have reached this factsheet because you are interested in investigation of enzyme-mediated effects and particularly inhibition of the enzyme Aromatase. Aromatase is CYP19A1 enzyme which is a member of the cytochrome P450 superfamily. This enzyme is responsible for conversion of androgens into estrogens [Ref01]. There are two reasons for the interest in substances which are able to inhibit the enzyme aromatase. First, because of their use as pharmaceuticals in the treatment of estrogen-sensitive breast cancers. Second, a number of environmental contaminants can act as aromatase inhibitors, thereby disrupting endocrine function in humans and wildlife through suppression of circulating estrogen levels.
The training set of the model consists of 222 chemicals with aromatase inhibition data, collected from different literature sources. Data are expressed as log(1/IC50), where IC50 is the test chemical concentration resulting in 50% inhibition of activity. Some aromatase inhibitors in the training set are structural analogues of man’s hormones testosterone and androstenedione. Others contain heteroatoms in the azole ring, fluorenes, flavones and brominated flame retardants [Ref02]. Hence, the model is derived based on steroidal and non-steroidal aromatase inhibitors.
2. Methodology
A mechanism-based categorization model for predicting potency of steroidal and non-steroidal inhibitors of the enzyme aromatase has been developed [Ref03]. There are two distinct mechanisms involved in the aromatase inhibition: steroidal and non-steroidal. The most potent steroidal inhibitors are very similar to androstenedione and testosterone (natural substrates). When bound to the catalytic site of CYP19, those inhibitors are metabolized to intermediates which attach irreversibly to the active site, thereby blocking subsequent activity of the enzyme [Ref04]. Chemicals acting by non-steroidal mechanisms possess a heteroatom able to coordinate the heme-iron of the cytochrome P450, and thus interfere with steroid hydroxylation.
Specific structural boundaries controlling inhibition of aromatase were defined and a software tool was developed that allowed a decision tree (profile) to be built discriminating aromatase inhibitors by mechanism and potency. The structure of the model is presented in Figure 1.
An input chemical follows a profiling path and the structure is examined at each step to decide whether the structural boundaries implemented in the decision tree node are met.
Performance
The sensitivity of the aromatase inhibition model is 87%. Since, the training set of the model is based on substances which are inhibitors of the aromatase and there are no non-inhibitors, specificity of the model cannot be estimated.
Domain
The applicability domain of the aromatase inhibition model consists of two sub-domain layers: general parametric requirements and structural features [Ref05]. Two chemical subsets are used for deriving the model domains. The first subset includes the training set chemicals which are correctly predicted by the models, whereas the second subset comprises training set chemicals

RiBaTox – Full Set of Fact Sheets
189
which are incorrectly predicted by the models.
The correct chemical subset is used for defining the general parametric requirements. Extracted are specific ranges of the molecular weight (MW) and the 1-octanol/water partition coefficient (log KOW):
• Molecular weight MW (in Da) ϵ [183; 959],
• log KOW ϵ [1; 12].
The atom-centred fragments extracted from the correct subset of chemicals are used to define the structural domain. Briefly, the structural domain is assessed based on atom-centred fragments, extracted from correctly and incorrectly predicted (i.e. false positives and false negatives) substances from the model training sets by accounting for the atom type, hybridization and attached H-atoms of the central atom and its first neighbours. If the neighbour is a heteroatom then the diameter of the fragment is increased up to three consecutive heteroatoms or to the first carbon atoms in sp3 hybridization. In order to assess if a new chemical belongs to the structural domain, the system partitions the chemical to atom-centred fragments, which are then matched to the fragments extracted from the correct and incorrect chemical subsets. The new chemical is estimated to belong to the structural domain only when its atom-centred fragments are found in the list of correct fragments.
Figure 1. Structure of the aromatase inhibition model
3. Application
The TIMES Aromatase inhibition model is applicable for assessing enzyme-mediated effects of organic substances. The model has been found valuable by government institutions and industries. Annually, many synthetic chemicals are released in the environmental and part of them have shown a specific mode of action related to interaction with specific enzymes, such as aromatase. Identification of such substances is critically important, since inhibition of the enzyme aromatase prevents for breast cancer.
Within SOLUTIONS project, AhR binding predictions have been used by partners involved in Chemical Analytical tools.
References
1. Thompson, E.A., Siiteri, P.K. 1974. The involvement of human placental microsomal

RiBaTox – Full Set of Fact Sheets
190
cytochrome 515 P-450 in aromatization, J. Biol. Chem. 249: 5373–5378; http://www.jbc.org/content/249/17/5373
2. Furet, P., Batzl, C., Bhathagar, A., Francotte, E., Rihs, G., Lang, M. 1993. Aromatase inhibitors, Synthesis, biological activity, and binding mode of azole-type compounds, J. Med. Chem. 36: 1393–1400; https://doi.org/10.1021/jm00062a012
3. Petkov, P., Temelkov, S., Villeneuve, D., Ankley, G., Mekenyan, O. 2009. Mechanism-based categorization of aromatase inhibitors: a potential discovery and screening tool, SAR and QSAR in Environmental Research, 20, pp. 657-678; https://doi.org/10.1080/10629360903438347
4. Johannessen, D.C., Engan, T., Disealle, E., Zurlo, M.G., Paolini, J., Ornati, G., Piscitelli, G., Kvinnsland, S., Lonning, P.E. 1997. Endocrine and clinical effects of exemestane (PNU 155071) a novel steroidal aromatase inhibitor in postmenopausal breast cancer patients, Clin. Cancer Res. 3: 1101-1108; https://www.ncbi.nlm.nih.gov/pubmed/9815789
5. Dimitrov, S., Dimitrova, G., Pavlov, T., Dimitrova, N., Patlewicz, G., Niemela J., Mekenyan, O. 2005. A Stepwise Approach for Defining the Applicability Domain of SAR and QSAR Models. J. Chem. Inf. Model., 45: 839-849; https://doi.org/10.1021/ci0500381
Keywords
Enzyme-mediated effects, Aromatase inhibition potency, TIMES Aromatase inhibition model.
Related topics
Models for predicting human health endpoints FS068 Models for predicting human health endpoints – Eye irritation FS008 Models for predicting human health endpoints – Skin irritation/corrosion FS012 Models for predicting human health endpoints - Skin sensitization FS013 Model for predicting Photo-induced toxicity FS011 Models for predicting in vitro genotoxicity endpoints FS009 Models for predicting in vivo genotoxicity endpoints FS010 Models for predicting receptor mediated effects (estrogen/androgen binding) FS080 Model for predicting in vitro Aryl hydrocarbon receptor binding affinity FS082
Contact information
Ovanes Mekenyan ([email protected]) Laboratory of Mathematical Chemistry, ‘Prof. As. Zlatarov’ University, Bourgas, Bulgaria

RiBaTox – Full Set of Fact Sheets
191
FP7 SOLUTIONS project - Fact Sheet 082
Name SOLUTIONS Tool or Service
FS082 TIMES model for predicting aryl hydrocarbon receptor (AHR) binding potency
Description
1. Objective
You have reached this factsheet because you are interested in investigation of receptor mediated endpoints. The aryl hydrocarbon receptor (AhR) modulates the biochemical and toxic effects of a wide variety of environmental compounds and plays an important role in the adaptation of organisms to environmental stress.
The training set of the AhR model consists of 142 organic compounds collected from different literature sources. Covered are four typical chemical classes of AhR ligands: polychlorinated biphenyls, polychlorinated dibenzofurans, polychlorinated dibenzodioxins, ellipticines and flavones. Relative equivalent potencies (REP) of these substances towards AhR have been estimated:
where EC50 is the half maximal effective concentration. Reference chemical is the most potent AhR agonist 2,3,7,8-tetrachlorodibenzo-p-dioxin.
Another training set consisting of 51 chemicals with gene expression (GE) data have also been collected. From them, 23 chemicals have data for both AhR binding and GE. These chemicals were used to establish a relation between binding and GE.
The TIMES AhR model has been developed for predicting AhR binding, agonistic/antagonistic properties and gene expression.
2. Methodology
A battery of structure-activity relationship (SAR) models for predicting AhR binding based on two distinct mechanisms has been developed [Ref01]. One of these mechanisms is based on electron charge transfer from ligands to the Ah receptor. This mechanism is associated with dioxin-like compounds, where a favourable interaction with a receptor nucleophilic site in the central part of the ligand and with electrophilic sites at both sides of the principal molecular axis is required. The same mechanism is also associated with polycyclic aromatic hydrocarbons (PAHs), where a stacking-type of interaction with the AhR is required. The second AhR binding mechanism is associated with biphenyl-like compounds which unlike the above chemical classes are found to accommodate electron density from the receptor.
These two mechanisms are studied across three activity ranges: strong binders with REP≥0.1 (30 chemicals), weak binders with 0<REP<0.1 (52 chemicals), and non-binders with REP=0 (60 chemicals). The structure of the AhR binding model is presented in Figure 1.
Individual SAR models have been developed for dioxin-like compounds, biphenyls and PAHs in each activity bin. SARs consist of structural and parametric boundaries. First, minimum structural requirements for interacting with AhR are developed. Second, additional parametric boundaries have been added for completing definition of the model. While minimum structural requirements could convey binding and non-binding effects, the additional parametric boundaries provide sufficient conditions for the binding affinity only.

RiBaTox – Full Set of Fact Sheets
192
First, when a new chemical is submitted for prediction, its AhR binding affinity is estimated by application of the individual SARs in the high activity bin. If the complete set of boundaries are met, the substance is assigned to be a strong AhR binder. If the high activity bin gives a negative response, the substance is then submitted to the SAR models associated with low activity bin. Meeting the criteria for activity in this range classifies the substance to be a weak AhR binder.
Figure 1. Structure of the AhR receptor binding model
Agonism/antagonism
The model is also trained to identify agonists and antagonists. While agonistic properties are related to the ability of substances to elicit gene expression when bound to a receptor, antagonism is obtained when substances fail to trigger gene expression. In case of antagonism, chemicals bind to the receptor surface through the electron-donating properties of electron-rich groups which retain the receptor in the cytosol and does not allow AhR-dependent signal transduction [Ref02]. Hence, a SAR model accounting for antagonism has been derived and incorporated in the model, as illustrated in Figure 2:
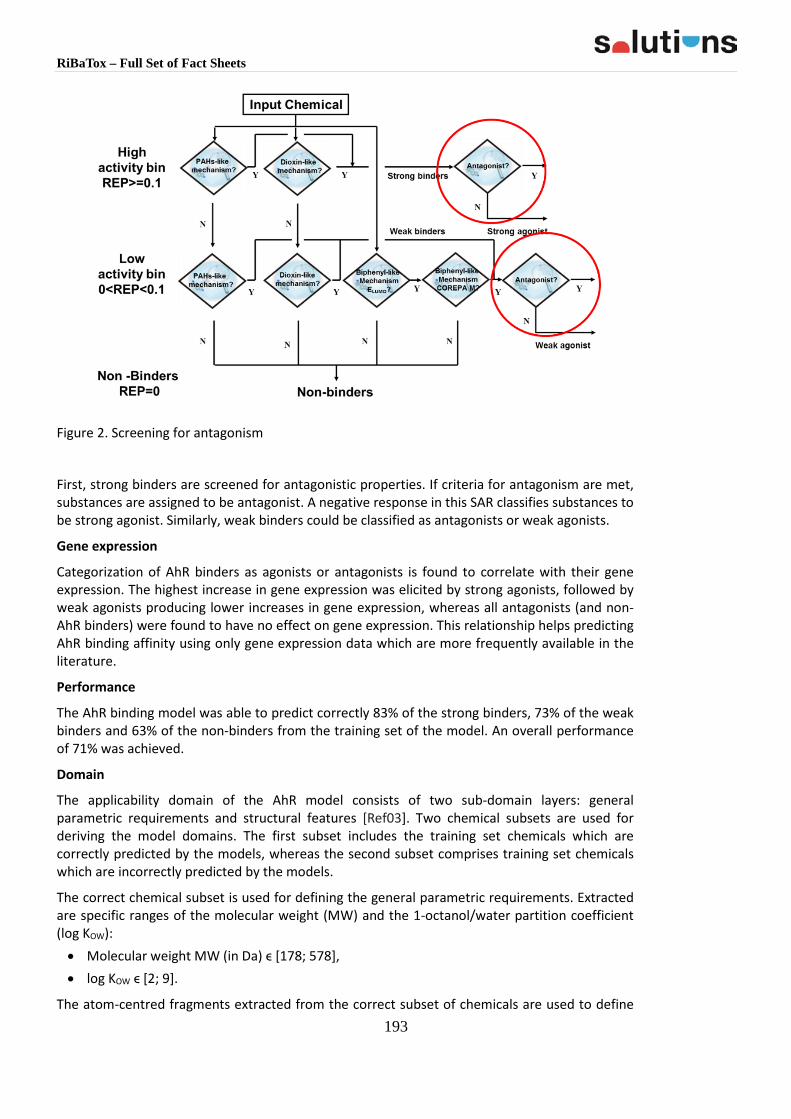
RiBaTox – Full Set of Fact Sheets
193
Figure 2. Screening for antagonism
First, strong binders are screened for antagonistic properties. If criteria for antagonism are met, substances are assigned to be antagonist. A negative response in this SAR classifies substances to be strong agonist. Similarly, weak binders could be classified as antagonists or weak agonists.
Gene expression
Categorization of AhR binders as agonists or antagonists is found to correlate with their gene expression. The highest increase in gene expression was elicited by strong agonists, followed by weak agonists producing lower increases in gene expression, whereas all antagonists (and non-AhR binders) were found to have no effect on gene expression. This relationship helps predicting AhR binding affinity using only gene expression data which are more frequently available in the literature.
Performance
The AhR binding model was able to predict correctly 83% of the strong binders, 73% of the weak binders and 63% of the non-binders from the training set of the model. An overall performance of 71% was achieved.
Domain
The applicability domain of the AhR model consists of two sub-domain layers: general parametric requirements and structural features [Ref03]. Two chemical subsets are used for deriving the model domains. The first subset includes the training set chemicals which are correctly predicted by the models, whereas the second subset comprises training set chemicals which are incorrectly predicted by the models.
The correct chemical subset is used for defining the general parametric requirements. Extracted are specific ranges of the molecular weight (MW) and the 1-octanol/water partition coefficient (log KOW): • Molecular weight MW (in Da) ϵ [178; 578], • log KOW ϵ [2; 9].
The atom-centred fragments extracted from the correct subset of chemicals are used to define

RiBaTox – Full Set of Fact Sheets
194
the structural domain. Briefly, the structural domain is assessed based on atom-centred fragments, extracted from correctly and incorrectly predicted (i.e. false positives and false negatives) substances from the model training sets by accounting for the atom type, hybridization and attached H-atoms of the central atom and its first neighbours. If the neighbour is a heteroatom then the diameter of the fragment is increased up to three consecutive heteroatoms or to the first carbon atoms in sp3 hybridization. In order to assess if a new chemical belongs to the structural domain, the system partitions the chemical to atom-centred fragments, which are then matched to the fragments extracted from the correct and incorrect chemical subsets. The new chemical is estimated to belong to the structural domain only when its atom-centred fragments are found in the list of correct fragments.
3. Application
The TIMES AhR model is applicable for assessing receptor mediated effects of organic substances. The model has been found valuable by government institutions and industries. Annually, many synthetic chemicals are released in the environmental and part of them have shown a specific mode of action related to interaction with cellular receptors, such as the AhR. Identification of such substances is critically important, since many receptor-mediated affect are directly related to carcinogenicity.
Within SOLUTIONS project, AhR binding predictions have been used by partners involved in Chemical Analytical tools.
References
1. Petkov, P.I., J.C. Rowlands, R. Budinsky, B. Zhao, M.S. Denison and O. Mekenyan (2010). Mechanism-based common reactivity pattern (COREPA) modelling of aryl hydrocarbon receptor binding affinity. SAR QSAR Environ. Res. 21: 187-214; https://doi.org/10.1080/10629360903570933
2. Henry, E.C., A.S. Kende, G. Rucci and M.J. Totleben (1999). Flavone antagonists bind competitively with 2,3,7,8-tetrachlorodibenzo-p-dioxin to the aryl hydrocarbon receptor but inhibit nuclear uptake and transformation. Mol. Pharmacol. 55: 716-725; http://molpharm.aspetjournals.org/content/55/4/716
3. Dimitrov, S., G. Dimitrova, T. Pavlov, N. Dimitrova, G. Patlewicz, J. Niemela and O. Mekenyan (2005). A stepwise approach for defining the applicability domain of SAR and QSAR models. J. Chem. Inf. Model. 45: 839-849; https://doi.org/10.1021/ci0500381
Keywords
Receptor mediated effect, Aryl Hydrocarbon Receptor binding, TIMES AHR model.
Related topics
Models for predicting human health endpoints FS068 Models for predicting human health endpoints – Eye irritation FS008 Models for predicting human health endpoints – Skin irritation/corrosion FS012 Models for predicting human health endpoints - Skin sensitization FS013 Model for predicting Photo-induced toxicity FS011 Models for predicting in vitro genotoxicity endpoints FS009 Models for predicting in vivo genotoxicity endpoints FS010 Models for predicting receptor mediated effects (estrogen/androgen binding) FS080

RiBaTox – Full Set of Fact Sheets
195
Model for predicting in vitro Aromatase inhibition FS081
Contact information
Ovanes Mekenyan ([email protected]) Laboratory of Mathematical Chemistry, ‘Prof. As. Zlatarov’ University, Bourgas, Bulgaria

RiBaTox – Full Set of Fact Sheets
196
3 Data
3.1 General
FP7 SOLUTIONS project - Fact Sheet 061
Name SOLUTIONS Tool or Service
FS061 Databases needed for integrated risk evaluation of chemicals
Description
1. Objective
You have reached this Fact Sheet because you are interested to know about the variety of databases that are used by the project Solutions to assess the integrated risk of chemicals in river basins or – in a wider perspective - the aquatic environment.
The evaluation of toxic risk in European river systems is a multidisciplinary exercise requiring the availability of well-organized and very diverse set of data on emissions, chemical concentrations, physico-chemical environmental properties, physico-chemical properties of pollutants, human and ecological toxicological properties of pollutants and ecological properties of the waterbodies to be studied.
In this Fact Sheet the nature of these database requirements is further detailed.
2. Methodology The data and database requirements were identified by an inventory among all SOLUTIONS partners. In a meeting dedicated towards data requirements and data availability the representatives already identified that it is impossible to conceptualize one single SOLUTIONS database. A set of 12 distinct interlinked data categories were therefore suggested:
1. Substance or fragment identity data 2. Physico-chemical property data 3. Toxicological property data 4. Chemical use classification data 5. Chemical emission data 6. Physico-chemical monitoring data 7. Biological monitoring data 8. Hydrological condition data 9. Ecological property data 10. Taxonomical data 11. Species trait data 12. Data determining trend and scenario development
Due to conceptual differences in the recognized types of data, it was considered hardly worthwhile to construct a single database that can host the data of such different origin. However, since the diversity of data is needed to be able to deduct data dependencies and relationships, it was considered indispensable to be able to link the data in the way that is depicted in Figure 1.

RiBaTox – Full Set of Fact Sheets
197
Figure 2. SOLUTIONS Data model for integrated risk evaluation of chemicals.
The underlying databases are verbally addressed in Table 1, including an indication of responsible SOLUTIONS partners and linking information to additional RiBaTox Fact Sheets.
Table 1 The new data model in tabular form.
Number Main data category
Description Addressed from
Links to Responsible party
Linked factsheet
1 SID Substance ID Primary entry for search on chemical contaminants
EQC, MASS, PCP. TPT, USE, EMI, PCM
Deltares NA
2 EQC Environmental legislation & EQC
SID - Brunel NA
3 MASS Mass spectra SID - UFZ / NORMAN Massbank / Environmental Institute
NA
4 PCP Physico-chemical properties
SID SID UFZ / LMC NA
5 TPT Toxicological properties / Toxicity
SID, TAX, ECO SID, TAX, ECO Ecotoxicity: RIVM / Mermayde
Human toxicity: Brunel
FS036
NA
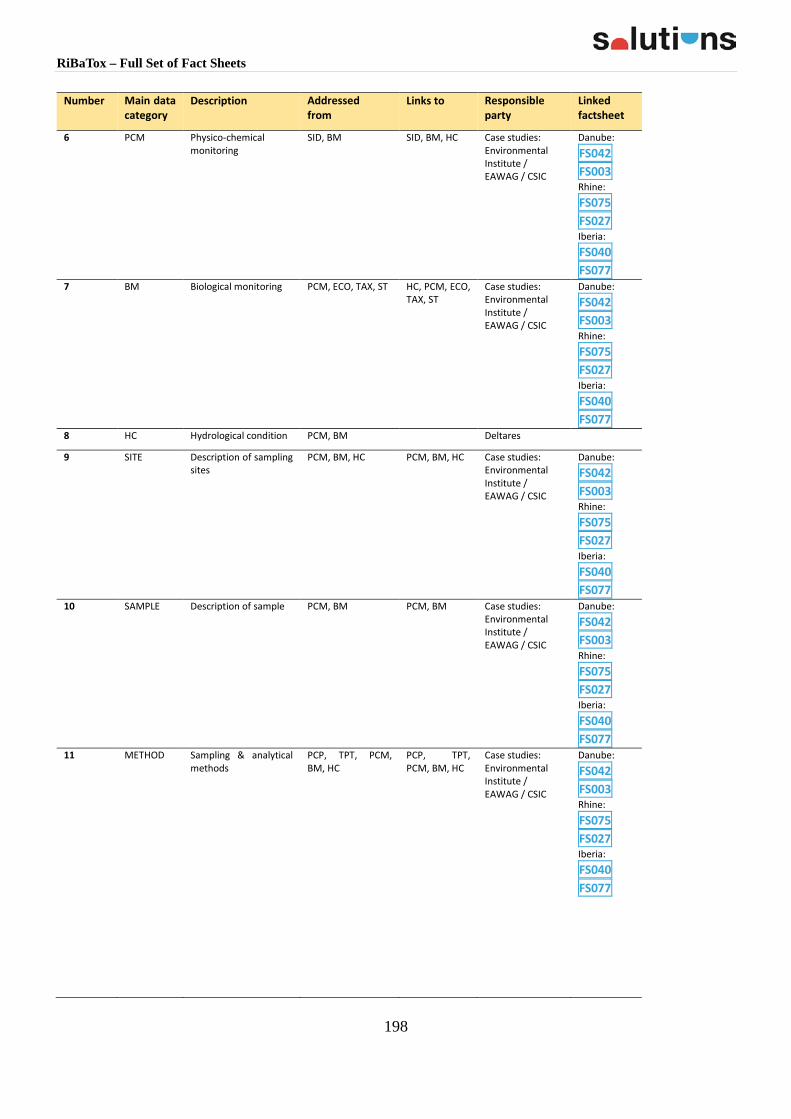
RiBaTox – Full Set of Fact Sheets
198
Number Main data category
Description Addressed from
Links to Responsible party
Linked factsheet
6 PCM Physico-chemical monitoring
SID, BM SID, BM, HC Case studies: Environmental Institute / EAWAG / CSIC
Danube: FS042 FS003 Rhine: FS075
FS027 Iberia: FS040 FS077
7 BM Biological monitoring PCM, ECO, TAX, ST HC, PCM, ECO, TAX, ST
Case studies: Environmental Institute / EAWAG / CSIC
Danube: FS042 FS003 Rhine: FS075 FS027 Iberia: FS040 FS077
8 HC Hydrological condition PCM, BM Deltares
9 SITE Description of sampling sites
PCM, BM, HC PCM, BM, HC Case studies: Environmental Institute / EAWAG / CSIC
Danube: FS042 FS003 Rhine: FS075 FS027 Iberia: FS040 FS077
10 SAMPLE Description of sample PCM, BM PCM, BM Case studies: Environmental Institute / EAWAG / CSIC
Danube: FS042
FS003 Rhine: FS075
FS027 Iberia: FS040
FS077 11 METHOD Sampling & analytical
methods PCP, TPT, PCM, BM, HC
PCP, TPT, PCM, BM, HC
Case studies: Environmental Institute / EAWAG / CSIC
Danube: FS042
FS003 Rhine: FS075
FS027 Iberia: FS040
FS077

RiBaTox – Full Set of Fact Sheets
199
Number Main data category
Description Addressed from
Links to Responsible party
Linked factsheet
12 MATRIX Spatial data on Matrix, Media or Compartment
PCP, TPT, PCM, BM, EQC, EMI
- Deltares / Case studies: Environmental Institute / EAWAG / CSIC
FS021
13 UNIT Units of properties or measurements
PCP, TPT, PCM, BM, EQC, EMI
- Accessory based on common sense
NA
14 ECO Ecology TPT, TAX, BM TPT, TAX, BM Alterra FS025
15 TAX Taxonomy ECO, ST, TPT, BM ECO, ST, TPT, BM
Alterra FS025
16 ST Species traits TAX, BM TAX, BM Alterra FS025
17 EMI Emissions SID, USE SID, USE RIVM / Mermayde
FS017
18 UC Use classification SID, EMI SID, EMI RIVM / Mermayde / KEMI
FS020
19 DTS Developments, trends and scenarios
Many, but indirect OEKO FS030
FS031
FS032
FS033
FS034
20 GIS GIS layers or geo referenced landscape or demographic properties
Many, but indirect Deltares NA
21 SEI Socio-economic indicators.
Maybe implemented as demographic GIS layers
Many, but indirect Deltares NA
22 ABO Abatement option description. Maybe implemented as GIS layer. It is not properly specified what type of information is meant to be collected in this category of data.
Many, but indirect KWR FS015
FS028
FS029
FS070
3. Application
After the structure had been established, data were interlinked using the Integrated Data Portal for SOLUTIONS FS024, a dedicated tool developed for the project.
References
1. de Zwart, D. and All SOLUTIONS partners, 2014. Defined set of user requirements and QA/QC requirements for various data. SOLUTIONS Internal Deliverable ID S5.1 ID051
Keywords
Linked data, Database, Chemical risk evaluation

RiBaTox – Full Set of Fact Sheets
200
Related topics
Integrated Data Portal for SOLUTIONS FS024 Spatial Data in Support to Risk Assessments for Emerging Compounds on a European Scale FS021 SOLUTION Monitoring database of physico-chemical, chemical and ecotoxicological monitoring data FS043 List of substances that can be modelled FS089 Database of substance-specific emissions per sub-catchment FS090 Database on physical and chemical substance properties for modelling FS091 Ecotoxicity database for Species Sensitivity Distributions impact modelling FS036 Macroinvertebrate Trait Database – as part of the IDPS FS025
Contact information
Dick de Zwart ([email protected])
Mermayde, Groet, Netherlands

RiBaTox – Full Set of Fact Sheets
201
3.2 Data bases
FP7 SOLUTIONS project - Fact Sheet 024
Name SOLUTIONS Tool or Service
FS024 Integrated Data Portal for SOLUTIONS
Description
1. Objective
You have reached this Fact Sheet because you want to discover and access information on environmental chemicals in relation to humans and the environment. The chemical-related information available on the Integrated Data Portal for SOLUTIONS (IDPS) is grouped in five modules, listed below.
The IDPS acts as an interlinked portal for the knowledge-base of the entire consortium, ensuring the linkage between different sectorial aspects and multiple data sources.
This centralised infrastructure is used for discovering and accessing information on priority and emerging pollutants in land and water resources management. The information includes compound and structure-specific properties and toxicity information, geo-referenced monitoring data and receptor-specific data on traits that may be affected.
Moreover, the platform aims to support a coordinated approach for collection, storing, accessing and assessing data related to present and future emerging pollutants.
2. Methodology
Platform development
IDPS development has to cope with a great heterogeneity of data, metadata, data providers, different conditions for access and use for both data and metadata and the resulting set of user requirements. To address these challenges, IDPS is designed to allow for the stepwise introduction of new user requirements and based on re-usable and extensible components allowing for three different levels of data accessibility, briefly described below.
Level 1: metadata level This level represents the ‘loosely coupled’ databases and allows to plug in any kind of new database, in particular those with restrictions in data access. Data and metadata are hosted by data providers and neither data structure modification is foreseen, nor changes in data access policy. This level ensures to discover databases, programmes and initiatives on the identified IDPS clusters, exposing only the general information stored into the metadata (e.g. the responsible institution, the conditions and restrictions in data accessibility, the spatial and temporal coverage, etc.).
Level 2: DB remote access level The second level represents the databases that allow for remote access. These data are provided as metadata following a common scheme, which includes statements on Quality Control and Quality Assurance. No data structure modification is foreseen; specific filters are based on specific database structure and agreed with data providers.

RiBaTox – Full Set of Fact Sheets
202
Level 3: Core IDPS level Databases at the third level of IDPS are accessible in both native schemes and common template. The common template will allow to easily find information available in different DBs through a simple and advance research.
Architecture
IDPS Architecture goals can be summarised as: • ability to connect to various data sources, hosted by single data providers or systems,
published in various data formats; • offer data hosting services; • possibility to search all data sources using the same criteria (e.g. chemical substance name,
CAS Registration Number, IUPAC International Chemical Identifier InChIKey); • display data from all sources in a coherent way, ensuring a minimum set of common and
harmonised information (e.g. format and order of: concentration values, date of the sampling, unit of measure, geographical location names) to allow data comparison, when possible;
• display information based on a common ontology in alignment with the requirements stemming from the INSPIRE Directive;
• possibility to download query results in a standardised format (e.g. comma separated values);
• possibility to save the queried data; • ensure the linkage and interaction to the RiBaTox tool, Case Studies and SOLUTIONS
modelling tools.
Five cluster of information, which identify the IDPS modules, have been identified: • Monitoring data; • Eco-toxicological data; • Use, Emission and abatement data; • Structure and properties data; • Legislation.
3. Application IDPS provides access to all SOLUTIONS project partners ([Ref01, Ref02, Ref04]) respecting existing access and use conditions: • SOLUTIONS partners: can access all IDPS services; • Non SOLUTIONS users: restricted access to the metadata level only.
IDPS is a platform providing a single access point to emerging substances specific information and to SOLUTIONS partners’ databases (data and meta data) in Europe.
The main goals of IDPS are to exchange compound- and structure associated data within the consortium, host and link to additional survey data, provided also by external databases and providers, and present SOLUTIONS products to stakeholders. Moreover, IDPS will help identify links between exposure and epidemiological data, to explore potential biological effects and to lead to improved health outcomes.
The main operations which any SOLUTIONS user could perform are: • Search and Discover substances: by name, CAS number, EC number or InCHIkey to find

RiBaTox – Full Set of Fact Sheets
203
information available in different modules/databases; • Save search results: both general information of databases and specific values; • Download data; • Link to IPCheM, RiBaTox and SOLUTIONS modelling tools; • Host and Upload data: allow for manual and automatic uploading of data (not properly
stored)
References
1. WIKI page with mock-up presentation: https://webgate.ec.europa.eu/CITnet/confluence/display/solutions
2. SVN, link for the data repository: https://webgate.ec.europa.eu/CITnet/svn/SOLUTIONS 3. SOLUTIONS Knowledge Base: http://www.normandata.eu/solutions/ 4. Databases: http://www.normandata.eu/solutions/norman.php 5. Environmental Monitoring – Physico-chemical and chemical database
http://www.normandata.eu/solutions/chemicalSearch.php
6. Comero, S. and B.M. Gawlik, 2018. Integrated Data Portal for SOLUTIONS (IDPS) and web-based knowledge base integrated with IPCheM and RiBaTox. Solutions Deliverable D5.1 ED051
Keywords
Database knowledge, chemicals, data harmonisation
Related topics
Databases required for the integrated risk evaluation of chemicals FS061
Spatial Data in Support to Risk Assessments for Emerging Compounds on a European Scale FS021
SOLUTION Monitoring database of physico-chemical, chemical and ecotoxicological monitoring data FS043
List of substances that can be modelled FS089
Database of substance-specific emissions per sub-catchment FS090
Database on physical and chemical substance properties for modelling FS091
Ecotoxicity database for Species Sensitivity Distributions impact modelling FS036 Macroinvertebrate Trait Database – as part of the IDPS FS025
Contact information
Sara Comero ([email protected]) Bernd Gawlik ([email protected]) EC - JRC, Institute for Environment and Sustainability, Ispra, Italy

RiBaTox – Full Set of Fact Sheets
204
FP7 SOLUTIONS project - Fact Sheet 021
Name SOLUTIONS Tool or Service
FS021 Spatial Data in Support to Risk Assessments for Emerging Compounds on a European Scale
Description
1. Objective
You have reached this Fact Sheet because you indicated that you want to make use of SOLUTIONS generated data on the scale of Europe as a whole in support to risk assessment for larger groups of chemicals.
The use of mathematical models makes it possible to develop quantitative risk assessments of individual chemicals or groups of chemicals. Such information comprises simulated emissions, exposure and ecological effects of emerging chemicals for which field data are not yet available. The present SOLUTIONS product provides such data for a wide range of chemicals. It does so taking into account the spatial variability on a European scale as well as the temporal variability.
2. Methodology
The data bases discussed here have been compiled using the SOLUTIONS ‘model-train’ FS016.
The present data product is intended for assessments using the (intermediate) results from the SOLUTIONS model train. The available data include: • the present (≈2010) emissions of chemicals to surface waters, air and soils; • the present (≈2010) concentrations of chemicals in surface waters and selected biota; • the present (≈2010) effects that chemicals are exercising in surface waters:
o of individual chemicals and of specific mixtures; o diversified for specific endpoints; o diversified for specific ecosystems or biological quality elements (as distinguished under
the Water Framework Directive).
All data are available in the form of time dependent maps covering Europe (Figure 1). The spatial resolution is 10-15 km on average. The temporal resolution is 1 day.
3. Application
The database contains data for between 5,000 and 6,000 compounds.
Emissions are quantified as a function of time and space, and subdivided over different pathways towards the surface water: • effluents from waste water treatment plants (WWTPs); • direct emissions (pesticides, wastewater from areas without sewage treatment); • storm runoff from separated sewer systems; • emissions from top soils via runoff, drainage and erosion.
Such information can be used as a basis for developing Programmes of Measures.

RiBaTox – Full Set of Fact Sheets
205
Figure 1. Extent and schematisation of the model domain.
The concentrations in surface water and fish are also quantified as a function of time and space. These could be used as a starting point for a risk assessment of chemicals based on Predicted Environmental Concentrations. This allows a much more holistic and homogeneous assessment than the common risk assessment based on Measured Environmental Concentrations, and can complement the latter with candidates that would go unnoticed otherwise, see also FS014.
Finally, the database contains effect metrics per substance for a long list of ecosystems and human health related endpoints (see FS019). This information can be used to diversify the risk assessment for specific mixtures, endpoints and ecosystems/biota. For instance, in Natura 2000 protected areas, emphasis can be placed on protection of all Water Framework Directive Biological Quality Elements. In drinking water abstraction areas, emphasis could be placed on effects on human health.
References
1. van Gils, J., L. Posthuma, M. Zijp, A. van Wezel, R. Sjerps, D. Bunke, D. de Zwart, Dik van de Meent, I. Cousins, C. Lindim, S. Kutsarova, O. Mekenyan, J. Hollender, J. Slobodnik, R. Kühne and A. Kortenkamp, 2018. Europe wide modelling and simulations of emerging pollutants risk including think tank scenarios. Solutions Deliverable D14.2.
Keywords
River basins, emissions, exposure, effects, emerging compounds, modelling
Related topics
Databases required for the integrated risk evaluation of chemicals FS061 Integrated Data Portal for SOLUTIONS FS024 SOLUTION Monitoring database of physico-chemical, chemical and ecotoxicological monitoring data FS043

RiBaTox – Full Set of Fact Sheets
206
List of substances that can be modelled FS089 Database of substance-specific emissions per sub-catchment FS090 Database on physical and chemical substance properties for modelling FS091 Ecotoxicity database for Species Sensitivity Distributions impact modelling FS036 Macroinvertebrate Trait Database – as part of the IDPS FS025
Contact information
Jos van Gils ([email protected]) Deltares, Delft, The Netherlands

RiBaTox – Full Set of Fact Sheets
207
FP7 SOLUTIONS project - Fact Sheet 043
Name SOLUTIONS Tool or Service
FS043 SOLUTIONS Database of physico-chemical, chemical and ecotoxicological monitoring data
Description
1. Objective
You have reached this Fact Sheet because you would like to access European environmental monitoring data for the aquatic environment of reliable quality.
In order to obtain answers to urgent questions of assessment, prioritisation and abatement, a toxicant knowledge base, compiling the required information on all emerging pollutants, together with spatial and ecological status related information, is required.
In support of the Integrated Platform for Chemical Monitoring data (IPCheM) as suggested by the EC for the generation, collection, storage and use of data on environmental chemicals in relation to humans and the environment, the Integrated Data Portal for SOLUTIONS (IDPS) FS024 has been implemented to help e.g. identify links between exposure and epidemiological data, to explore potential biological effects, to assess potential risks of chemicals to the (aquatic) environment and man.
The IDPS portal is designed as information system, interacting with the single data modules of SOLUTIONS (e.g. monitoring case studies, scenario data, chemicals use and emissions data) in alignment with the requirements stemming from IPCheM and in compliance with the framework of the INSPIRE Directive.
The SOLUTIONS Monitoring Database, as part of the IDPS portal, collects all the physico-chemical, chemical and ecotoxicological monitoring data available from the case studies of the SOLUTIONS project, and additional monitoring data from (other) case study regions.
2. Methodology
The data compiled in the SOLUTIONS Monitoring Database is accompanied by an appropriate statement on data quality for each entry. It follows the integrated data collection – management - assessment approach supported by adequate and comprehensive metadata that assure data reliability and traceability. The approach was developed within the frame of the EC funded NORMAN project, and has since been in function in an internationally appreciated way in the NORMAN EMPODAT database of environmental monitoring data on emerging substances.
The application of this approach provides a common data quality assessment framework to the SOLUTIONS Monitoring Database which takes into consideration the various application of the same information, as required by the IDPS structure.
3. Application
The database contains all the chemical monitoring data collected within the frame of the Joint Danube Survey 3 FS042, one of the case studies of the SOLUTIONS project.
Additional chemical monitoring data from Danube region are entered: results of the previous Danube surveys - Joint Danube Survey 1 (JDS1) and Joint Danube Survey 2 (JDS2), data from the EC-funded SCARCE project and further monitoring data on emerging substances from the

RiBaTox – Full Set of Fact Sheets
208
NORMAN EMPODAT database [Ref01]. Ecotoxicological monitoring data, such as the results of the EDA-EMERGE project will be collated as well.
The Database can be accessed via http://www.normandata.eu/solutions/
With its significant data content, this database will be a unique source of monitoring data to provide an overview of the presence and concentration levels of a long list of substances of emerging concern, and serve modellers with data for e.g. advanced exposure and risk modelling.
References
1. www.normandata.eu 2. SOLUTIONS Knowledge Base: http://www.normandata.eu/solutions/ 3. Databases: http://www.normandata.eu/solutions/norman.php 4. Environmental Monitoring – Physico-chemical and chemical database:
http://www.normandata.eu/solutions/chemicalSearch.php
Keywords
Monitoring data, chemical data, ecotoxicology, metadata, data quality, quality assessment framework
Related topics
Integrated Data Portal for SOLUTIONS FS024
Joint Danube Survey 3 FS042
Monitoring WWTPs FS092
Contact information
Jaroslav Slobodnik ([email protected]) Environmental Institute, Kos, Slovak Republic
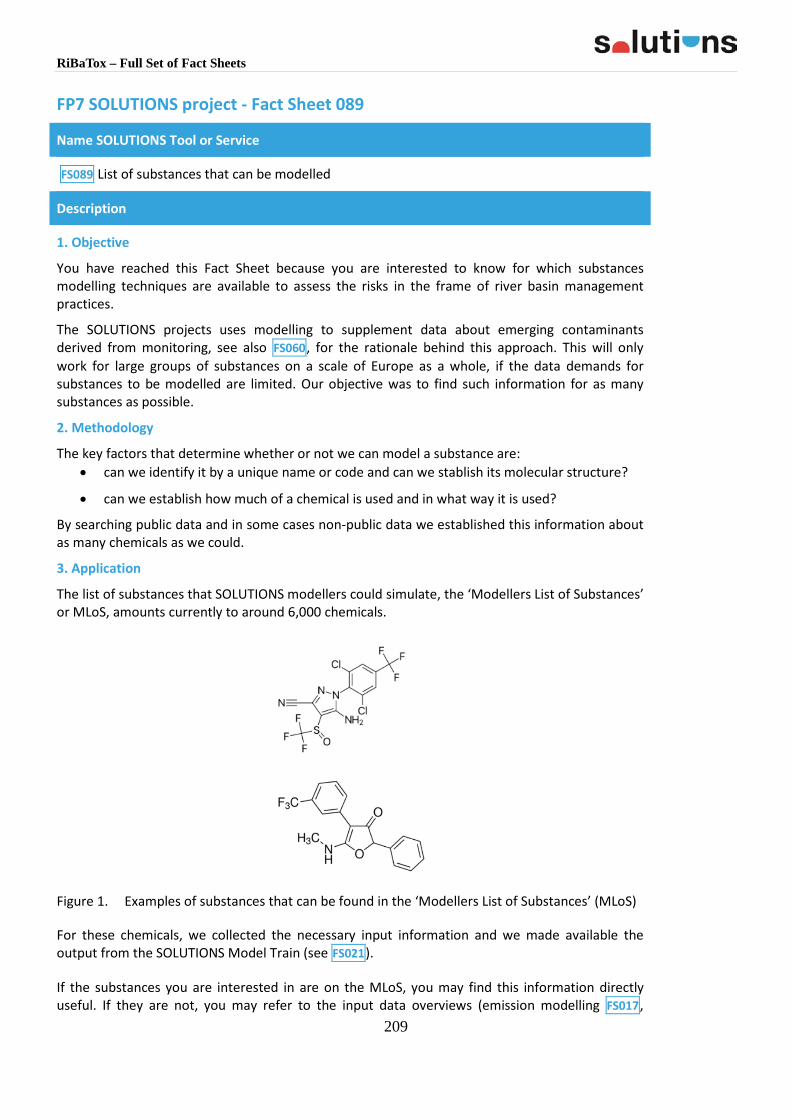
RiBaTox – Full Set of Fact Sheets
209
FP7 SOLUTIONS project - Fact Sheet 089
Name SOLUTIONS Tool or Service
FS089 List of substances that can be modelled
Description
1. Objective
You have reached this Fact Sheet because you are interested to know for which substances modelling techniques are available to assess the risks in the frame of river basin management practices.
The SOLUTIONS projects uses modelling to supplement data about emerging contaminants derived from monitoring, see also FS060, for the rationale behind this approach. This will only work for large groups of substances on a scale of Europe as a whole, if the data demands for substances to be modelled are limited. Our objective was to find such information for as many substances as possible.
2. Methodology
The key factors that determine whether or not we can model a substance are: • can we identify it by a unique name or code and can we stablish its molecular structure?
• can we establish how much of a chemical is used and in what way it is used?
By searching public data and in some cases non-public data we established this information about as many chemicals as we could.
3. Application
The list of substances that SOLUTIONS modellers could simulate, the ‘Modellers List of Substances’ or MLoS, amounts currently to around 6,000 chemicals.
Figure 1. Examples of substances that can be found in the ‘Modellers List of Substances’ (MLoS)
For these chemicals, we collected the necessary input information and we made available the output from the SOLUTIONS Model Train (see FS021).
If the substances you are interested in are on the MLoS, you may find this information directly useful. If they are not, you may refer to the input data overviews (emission modelling FS017,

RiBaTox – Full Set of Fact Sheets
210
substances properties and use data FS020, substance properties FS062, FS006, FS007) to determine which data you need to collect to use the SOLUTIONS Model Train for these new substances (FS016).
References
1. van de Meent, D., D. de Zwart, K. Kramer and L. Posthuma, 2018. Screening level estimation of release rates of currently used chemicals to the environment - application to solution-oriented assessment of impacts on aquatic ecosystems. Solutions Deliverable D15.1 ED151
2. Kutsarova, S., I. Dermen, C. Kuseva, P. Petkov and O. Mekenyan, 2017. Predictions of transformation products, physicochemical properties, fate and toxicity of candidate compounds from chemical screening, EDA and emission modelling. Solutions Deliverable D17.2.
3. van Gils, J., R. Schueder, C. Chrzanowski, A. Focks, H. Baveco, L. Posthuma, I. Cousins, C. Lindim, S. Kutsarova, S. Dimitrov, A. Kortenkamp, S. Ermler, G. Massman, J.Greskowiak, G. Schüürmann, R. Kuehne, D. van de Meent and D. de Zwart, 2018. Modelling framework and model-based assessment for substance screening. Solutions Deliverable D14.1.
Keywords
Emerging contaminants, modelling, emissions, exposure, risk
Related topics
Databases required for the integrated risk evaluation of chemicals FS061
Integrated Data Portal for SOLUTIONS FS024
Spatial Data in Support to Risk Assessments for Emerging Compounds on a European Scale FS021
SOLUTION Monitoring database of physico-chemical, chemical and ecotoxicological monitoring data FS043
Database of substance-specific emissions per sub-catchment FS090
Database on physical and chemical substance properties for modelling FS091
Ecotoxicity database for Species Sensitivity Distributions impact modelling FS036
Macroinvertebrate Trait Database – as part of the IDPS FS025
Contact information
Jos van Gils ([email protected])
Deltares, Delft, Netherlands

RiBaTox – Full Set of Fact Sheets
211
FP7 SOLUTIONS project - Fact Sheet 090
Name SOLUTIONS Tool or Service
FS090 Database of substance-specific emissions per sub-catchment
Description
1. Objective
You have reached this Fact Sheet because you are interested to learn more about emissions of chemicals into the (aquatic) environment. The models used in environmental exposure assessment of chemical substances generally use emission rates into the environment as starting point. In fact, because such models calculate steady-state concentrations from mass balance equations in which all processes are assumed to obey first-order kinetics, predicted concentrations in air, water and soil are directly proportional to the assumed emission rates. In order to quantitatively describe and predict effects of the presence of chemicals in the environment, we must have means to estimate rates of emission for all chemical substances that possibly contribute to toxic impacts of chemicals on humans and ecosystems.
As a starting point for the SOLUTIONS modelling train FS016, a methodology has been developed to derive emission rates of currently used chemical substances to surface waters in 3,500 sub-catchments of European river systems [Ref01]. Emissions derived by this method have been tested and validated as starting point for solution-oriented environmental risk assessment in the SOLUTIONS project [Ref02]. It has been shown that these emissions also serve the purpose of generic chemical safety assessment and substance prioritization under REACH [Ref03] and the Water Framework Directive [Ref04].
2. Methodology
The emission estimation method has been described in the Fact Sheet SOLUTIONS emissions model FS017. All data used as input to calculations with the SOLUTIONS modelling train FS016 have been collected for future use in a database [http://www.normandata.eu/solutions/norman.php]. In addition to amounts of chemicals produced and used and estimated emission rates, the database contains all other input data to drive the modelling train, viz physical and chemical substance properties and substance-specific critical effect parameters. One of the integrating instruments is the (SOLUTIONS) Integrated Data Portal for SOLUTIONS FS024.
3. Application
Emission rates and other properties of 5,000+ chemical substances in 3,500+ European sub-catchments have been derived and compiled into a substance properties database for modelling EU-wide chemical water quality. The database has been used successfully in the SOLUTIONS project and will be made available to regulators, scientists, risk assessors and risk managers for solution-oriented environmental risk assessment in the future. It is foreseen, however, that restrictions will have to be made with respect to use volumes, because such data have been submitted to EU authorities for registration purposes only.
References
1. Van de Meent D., De Zwart D. and Posthuma L., 2018. Screening level estimation of release rates of currently used chemicals to the environment. Application to solution-oriented assessment of impacts on aquatic ecosystems. Environ. Toxicol. Chem. (to be submitted)
2. van Gils, J., R. Schueder, C. Chrzanowski, A. Focks, H. Baveco, L. Posthuma, I. Cousins, C.

RiBaTox – Full Set of Fact Sheets
212
Lindim, S. Kutsarova, S. Dimitrov, A. Kortenkamp, S. Ermler, G. Massman, J.Greskowiak, G. Schüürmann, R. Kuehne, D. van de Meent and D. de Zwart, 2018. Modelling framework and model-based assessment for substance screening. Solutions Deliverable D14.1 ED141.
3. European Commission, 2006. Regulation (EC) No 1907/2006 of the European Parliament and of the Council of 18 December 2006 on the Registration, Evaluation, Authorisation and Restriction of Chemicals (REACH). Off. J. Eur. Comm. L 396: p.1; http://eur-lex.europa.eu/legal-content/EN/TXT/?uri=CELEX:32006R1907
4. European Commission, 2000. Directive 2000/60/EC of the European Parliament and of the Council of 23 October 2000 establishing a framework for Community action in the field of water policy. Off. J. Eur. Comm. L 327: 1-72; http://eur-lex.europa.eu/legal-content/EN/TXT/?qid=1518620114264&uri=CELEX:32000L0060
Keywords
Chemicals, REACH, Water Framework Directive, emission rates, catchments, chemical safety assessment, database
Related topics
From emissions to effects: Model Train for SOLUTIONS FS016
Databases required for the integrated risk evaluation of chemicals FS061
Integrated Data Portal for SOLUTIONS FS024
Spatial Data in Support to Risk Assessments for Emerging Compounds on a European Scale FS021
SOLUTION Monitoring database of physico-chemical, chemical and ecotoxicological monitoring data FS043
List of substances that can be modelled FS089
Database on physical and chemical substance properties for modelling FS091
Ecotoxicity database for Species Sensitivity Distributions impact modelling FS036
Macroinvertebrate Trait Database – as part of the IDPS FS025
Contact information
Dik van de Meent ([email protected]) Mermayde, Groet, Netherlands
Jos van Gils ([email protected]) Deltares, Delft, Netherlands

RiBaTox – Full Set of Fact Sheets
213
FP7 SOLUTIONS project - Fact Sheet 091
Name SOLUTIONS Tool or Service
FS091 Substance Property Data
Description
1. Objective You have reached this Fact Sheet because you are interested in compound properties collected in SOLUTIONS databases. These properties are used as input data in order to predict the expected use, emissions, exposure and effects of emerging chemicals. Normally, experimental data are preferred if available. However, SOLUTIONS focuses on predicted data for several reasons: • For huge datasets and a rather large list of properties, the effort required to look for
experimental data is far beyond the possibilities of the involved researchers; • There are large data gaps in available experimental data, in particular for emerging
chemicals; • One of the major goals is to show the full workflow of the SOLUTIONS model train FS016,
and this means to start from chemical structure solely. Even if experimental data are there, the feasibility to obtain reasonable results without them should be demonstrated.
Nevertheless, there are particular cases when available experimental values have been used for modelling. But the data base compiled for SOLUTIONS concerns the calculated values. Tools used for these calculations include Chemprop [Ref01], CATALOGIC [Ref02], TIMES [Ref02], QSAR Toolbox [Ref03] and ACD/Labs [Ref04].
2. Methodology
The approaches and software used are described in the Fact Sheet Modelled Substance Property Data FS062. For the full list of properties actually modelled for SOLUTIONS, please cf. to FS020 (Substances Properties and Use Data). A detailed description of all provided properties and data is given in the SOLUTIONS Deliverable D17.2 [Ref05].
3. Application
The most comprehensive compound list, called Modellers’ list of substances (MLoS), is described in FS089 (List of substances that can be modelled). With the exception of some computational demanding degradation models, properties were calculated for the full set of 6,463 compounds with known unique chemical structures. In some cases, specific properties for other sets, including substances not part of the MLoS set, are provided. All data sets together with the calculated values are publicly available and can be downloaded. For access information, please contact LMC (see below).
References
1. UFZ Department of Ecological Chemistry 2017. ChemProp 6.6 http://www.ufz.de/ecochem/chemprop
2. http://oasis-lmc.org/products/models.aspx 3. QSAR Toolbox. http://toolbox.oasis-lmc.org/?section=overview 4. ACD/Labs 2016. http://www.acdlabs.com/products/percepta 5. Kutsarova, S., I. Dermen, C. Kuseva, P. Petkov and O. Mekenyan, 2018. Predictions of

RiBaTox – Full Set of Fact Sheets
214
transformation products, physico-chemical properties, fate and toxicity of candidate compounds from chemical screening, EDA and emission modelling. SOLUTIONS Deliverable D17.2.
Keywords
QSAR, physico-chemical, partitioning, degradation
Related topics
Substances Properties and Use Data FS020 Modelled Substance Property Data FS062 List of substances that can be modelled FS089 From emissions to effects: Model Train for SOLUTIONS FS016
Contact information
Ralph Kühne ([email protected]) Helmholtz Centre for Environmental Research GmbH – UFZ, Leipzig, Germany
Ovanes Mekenyan ([email protected]) Laboratory of Mathematical Chemistry, Bourgas "Prof. As. Zlatarov" University, Bourgas, Bulgaria

RiBaTox – Full Set of Fact Sheets
215
FP7 SOLUTIONS project - Fact Sheet 036
Name SOLUTIONS Tool or Service
FS036 Ecotoxicity database for Species Sensitivity Distributions impact modelling
Description
1. Objective
You have reached this Fact Sheet because you have observed that water quality may be affected by enhanced concentrations of one or more chemicals, which you want to interpret in terms of the probability and magnitude that those concentrations cause ecological impacts.
Water managers frequently judge water quality and ecological risks of water contamination by comparing measured or predicted concentrations of individual chemicals to ambient water quality criteria (Environmental Quality Standards in the Water Framework Directive context). These standards have, in turn, been derived from ecotoxicity data. This approach comparing concentration to standards informs the water managers whether the (observed or predicted) concentration is considered sufficiently safe in the context of regulatory principles, but not whether there are no ecological impacts, not what magnitude of impacts can be expected, and not which chemicals pose the highest risk. The presence of mixtures implies the need to consider aggregated risks. The choice between alternative abatement strategies requires a quantitative impact assessment. Commonly, few compounds cause the majority of effects, but their identities vary across water bodies. Confronted with the question on water pollution in the context of a systems-level water quality analysis done to support deriving abatement strategies, the water manager remains uncertain on ecological impacts.
Water managers can inform themselves on risks of pollution by: • comparing concentrations to ecotoxicity data themselves, which is uncommon for
regulated compounds, but feasible when the ecotoxicity data are available; • comparing concentrations to available environmental quality standards (EQS), that in view
of the Water Framework Directive (WFD) are derived for only a limited set of priority pollutants;
• using Species Sensitivity Distribution modelling to derive preliminary quality criteria and/or derive a quantitative proxy for ecotoxicological impact magnitude for non-regulated chemicals.
The latter approach is described in ‘Ecological risk quantification via Species Sensitivity Distributions’ in the (related) Factsheet FS035. All three assessment approaches are eventually based on ecotoxicity data. This fact sheet describes the data set needed for the various assessment options. Note that the most common approach, obligatory under the WFD, is judgement of the ecological status of water bodies via the Environmental Quality Standards approach. The other approaches expand on the latter, by considering more compounds and their mixtures, with the refined aim of gaining insight in various prioritizations [see FS035].
2. Methodology
Over the past 20 years a very comprehensive data set has been generated to comprise the results of laboratory ecotoxicity tests for as many as possible substances. This dataset is originating from a large variety of publicly available data sources and is extensively scrutinized for data quality and plausibility as described in [Ref01]. The dataset now contains more than 300,000 individual test results for more than 7,000 substances, comprising several thousands of
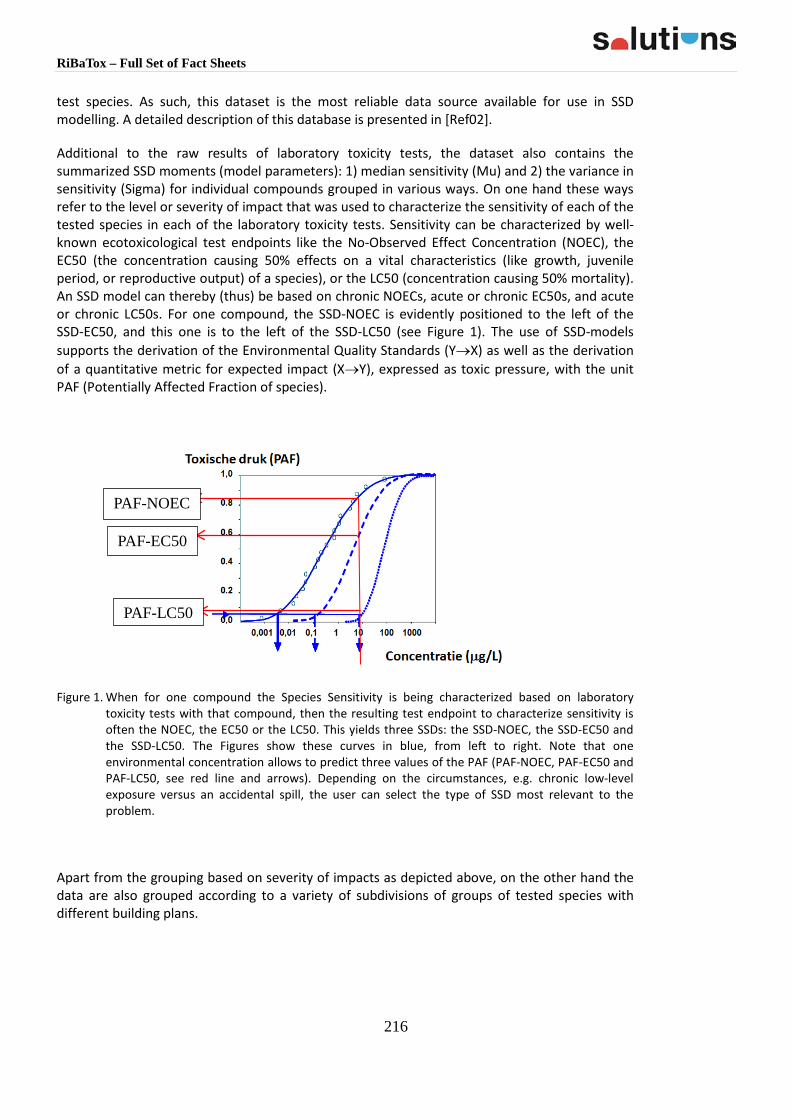
RiBaTox – Full Set of Fact Sheets
216
test species. As such, this dataset is the most reliable data source available for use in SSD modelling. A detailed description of this database is presented in [Ref02].
Additional to the raw results of laboratory toxicity tests, the dataset also contains the summarized SSD moments (model parameters): 1) median sensitivity (Mu) and 2) the variance in sensitivity (Sigma) for individual compounds grouped in various ways. On one hand these ways refer to the level or severity of impact that was used to characterize the sensitivity of each of the tested species in each of the laboratory toxicity tests. Sensitivity can be characterized by well-known ecotoxicological test endpoints like the No-Observed Effect Concentration (NOEC), the EC50 (the concentration causing 50% effects on a vital characteristics (like growth, juvenile period, or reproductive output) of a species), or the LC50 (concentration causing 50% mortality). An SSD model can thereby (thus) be based on chronic NOECs, acute or chronic EC50s, and acute or chronic LC50s. For one compound, the SSD-NOEC is evidently positioned to the left of the SSD-EC50, and this one is to the left of the SSD-LC50 (see Figure 1). The use of SSD-models supports the derivation of the Environmental Quality Standards (Y→X) as well as the derivation of a quantitative metric for expected impact (X→Y), expressed as toxic pressure, with the unit PAF (Potentially Affected Fraction of species).
Figure 1. When for one compound the Species Sensitivity is being characterized based on laboratory toxicity tests with that compound, then the resulting test endpoint to characterize sensitivity is often the NOEC, the EC50 or the LC50. This yields three SSDs: the SSD-NOEC, the SSD-EC50 and the SSD-LC50. The Figures show these curves in blue, from left to right. Note that one environmental concentration allows to predict three values of the PAF (PAF-NOEC, PAF-EC50 and PAF-LC50, see red line and arrows). Depending on the circumstances, e.g. chronic low-level exposure versus an accidental spill, the user can select the type of SSD most relevant to the problem.
Apart from the grouping based on severity of impacts as depicted above, on the other hand the data are also grouped according to a variety of subdivisions of groups of tested species with different building plans.
PAF-LC50
PAF-EC50
PAF-NOEC

RiBaTox – Full Set of Fact Sheets
217
Table 1: Taxa grouping subdivision.
Taxa grouping All taxa measured All Algae All Daphnids All Fish All photosynthetic organisms All types of invertebrates All other vertebrates than fish All remaining taxa
For all summary variables, the quality of the SSD data in terms of species diversity is evaluated.
Both grouping actions resulted in a total of 67 different risk endpoints as summarized by the two SSD-moments for each of the endpoints, or in case of insufficient data only the median toxicity. Eight different taxa groupings are recognized as presented in Table 1, while Table 2 gives the recognized subdivision in the type of toxicity data included.
Table 2: Data type subdivision.
Data type FullSSD: Mu & Sigma Median only: Mu Extrapolated acute EC50 & LC50 √
Measured acute EC50 & LC50 √ Extrapolated chronic NOEC √ Measured chronic NOEC √ Minimum acute EC50 & LC50
√
Minimum chronic NOEC
√ Extrapolated HC5 based on acute EC50 & LC50
√
Extrapolated HC5 based on chronic NOEC
√ Measured HC5 based on acute EC50 & LC50
√
Measured HC5 based on chronic NOEC
√ WFD Annual Average EQS
√
WFD Maximum allowable EQS
√ WFD EQS for specific groups of species
√
3. Applications The database (aims to) collate various chemical-specific items, for various SSD-types (NOEC, EC50, LC50, etc.): • Chemical identity • SSD median parameter (at level of NOEC, EC50, LC50) • SSD variance parameter (at level of NOEC, EC50 and LC50) • SSD quality
as far as the data allow for that.
Regarding the SSD-quality, the SSD can depend on few or many ecotoxicity test data. Lower number of data entries implies lower confidence in the quantification of the Potentially Affected

RiBaTox – Full Set of Fact Sheets
218
Fraction (PAF). The database notes the SSD quality, so that the quality aspect can be used in the interpretation of the use of the data in the (associated) SSD model.
References
1. De Zwart D. 2002. Observed regularities in species sensitivity distributions for aquatic species. In: Posthuma L, Suter GW, Traas TP, editors. Species sensitivity distributions in ecotoxicology. Boca Raton, FL, USA: Lewis Publishers. p. 133-154;
2. Posthuma et al., 2018. Solutions Mu & Sigma publication (in preparation)
Keywords
Database, ecotoxicity, NOEC, EC50, LC50, Species Sensitivity Distribution model, SSD
Related topics
Ecological risk quantification via Species Sensitivity Distributions (SSD) FS035
From emissions to effects: Model Train for SOLUTIONS FS016
Contact information
Leo Posthuma ([email protected]) RIVM - Centre for Sustainability, Environment and Health, Bilthoven, The Netherlands

RiBaTox – Full Set of Fact Sheets
219
FP7 SOLUTIONS project - Fact Sheet 025
Name SOLUTIONS Tool or Service
FS025 Macro-invertebrate Trait Database – as part of the IDPS
Description
1. Objective
You have reached this Fact Sheet because you are interested in trait-based evaluation of (biological) community data. As part of the IDPS (Integrated Data Portal for SOLUTIONS FS024) a Macro-invertebrate Trait Database has been developed. This data base can be used as a tool to transform taxonomic data into traits-based data sets. It contains biological trait characteristics of the macroinvertebrate taxa monitored in the river Danube as part of the Joint Danube Survey 3 (JDS3) FS042 campaign [Ref01].
2. Methodology
The macroinvertebrate taxa monitored in the JDS3 with the MHS (Multi-Habitat-Sampling), DWS (Deep Water Sampling) and K&S (Kick and Sweep Sampling) methods, have been matched with taxonomic classification. The result are shown in the sheet Taxonomy of JDS3 [Ref01]. Additional information was obtained from the Integrated Taxonomic Information System (www.itis.gov) or the Fauna Europaea Database (http://www.faunaeur.org/). Next, the taxa entries have been matched to the traits contained in the Tachet database (Usseglio-Polatera et al., 1999, [Ref02]). The results are shown in the TachetMatchFinal spreadsheet. More details are presented in [Ref03].
A new code has been given to each taxonomic entry in the Taxonomy JDS3 spreadsheet, the so-called WUR code. The code can be used to make quick matches to the trait database. The trait dataset is associated to a Background database (TachetBackground) that provides information on the level of taxonomic aggregation used for the trait matching and a legend spreadsheet (TachetLegend) that explains each of the trait states and categories included in the trait database.
Figure 1. Scheme of taxonomy-to-traits transformation.
3. Application
Based on the traits database, macroinvertebrate community abundance information can be transformed into traits information (Figure 1). In this way, analyses can be performed independent from the taxonomic information, which shows variations especially for datasets comprising a large spatial area such as for the Danube river basin. Mechanistically meaningless species names are transformed into information about physiological or life-cycle characteristics, hence supporting more mechanistic data analyses.

RiBaTox – Full Set of Fact Sheets
220
References
1. Liška, I., Wagner, F., Sengl, M., Deutsch, K., Slobodník, J., 2015. Joint Danube Survey 3 – A comprehensive analysis of Danube water quality. Final Scientific Report. International Commission for the Protection of the Danube River, Vienna, Austria, pp.369; https://www.icpdr.org/main/sites/default/files/nodes/documents/jds3_final_scientific_report_2.pdf
2. Usseglio-Polatera, P., Thomas, S., Beisel, J.N., Moreteau, J.C., 1999. Biological trait structure of macroinvertebrate benthic communities. Ann. Limnol. 35: 71-80; https://doi.org/10.1051/limn/1999014
3. Rico, A., P.J. Van den Brink, P. Leitner, W. Graf and A. Focks, 2016. Relative influence of chemical and non-chemical stressors on invertebrate communities: a case study in the Danube River. Sci. Total Environ. 571: 1370-1382; https://doi.org/10.1016/j.scitotenv.2016.07.087
Keywords
Water quality monitoring, species traits, traits based assessment, multivariate analyses
Related topics
Databases required for the integrated risk evaluation of chemicals FS061
Integrated Data Portal for SOLUTIONS FS024
Spatial Data in Support to Risk Assessments for Emerging Compounds on a European Scale FS021
SOLUTION Monitoring database of physico-chemical, chemical and ecotoxicological monitoring data FS043
List of substances that can be modelled FS089
Database of substance-specific emissions per sub-catchment FS090
Database on physical and chemical substance properties for modelling FS091
Ecotoxicity database for Species Sensitivity Distributions impact modelling FS036
Contact information
Andreas Focks ([email protected]) Alterra Team Environmental Risk Assessment, Wageningen, The Netherlands

RiBaTox – Full Set of Fact Sheets
221
4 Prioritization strategies
4.1 General
FP7 SOLUTIONS project - Fact Sheet 069
Name SOLUTIONS Tool or Service
FS069 Prioritization strategies
Description
1. Objective
You have reached this Fact Sheet because you are interested in the efficient reduction of significant risks from the chemical pollution of waters under the provisions of the EU Water Framework Directive (WFD) and related pieces of EU legislation, such as the Drinking Water Directive (DWD). Basic information about this legal framework is provided on the European Commission’s website on water policies [Ref01].
As a ‘strategy against pollution’, Article 16 of the WFD requires the identification of ‘priority substances’. The idea is to make risk reduction efforts most efficient by focussing them on those water pollutants that present the highest risks. The aim is to reduce pollution levels below so-called environmental quality standards (EQS), i.e. concentrations “in water, sediment or biota which should not be exceeded in order to protect human health and the environment” (WFD, Article 2(35)). Currently, EQS values are defined for 45 EU-wide priority substances. In addition, EU Member States are required to identify river-basin specific pollutants (RBSP) and to set corresponding quality standards on a national or a transboundary river-basin-wide level.
Current regulatory procedures for prioritising chemicals under the WFD suffer from a number of shortcomings:
(i) Attention is focused on well-known and intensively studied contaminants. For most aquatic pollutants the high data demands for a conclusive risk assessment, for risk ranking and for EQS setting, cannot be met. As a consequence, significant risks from so-called emerging pollutants may be disregarded. These are existing pollutants for which further investigations on exposure and toxicity are required. The WFD does not include an effective mechanism to close such knowledge gaps.
(ii) Individual pollutants are assessed as if they would occur in isolation, largely ignoring the fact that they are part of complex multi-constituent mixtures. Mixtures are usually more toxic than the individual components alone. As a consequence, EQS for single pollutants may not be sufficiently protective against toxic mixture effects. This has been demonstrated in a study led by the European Commission’s Joint Research Centre (Carvalho et al. 2014) [Ref02]. Regulatory approaches for effectively tackling the problem are missing.
(iii) Water pollution is considered as a rather static problem. The focus is on curative action. The list of priority substances is reviewed every six years, but remains confined to substances that are already posing a significant problem. There is no effective mechanism to anticipate future pollution, to monitor trends in water pollution and to take preventive action before acceptable levels actually start to be exceeded.
The EU project SOLUTIONS developed tools, concepts, and approaches for tackling these problems. SOLUTIONS work built on previous achievements of the NORMAN network on emerging

RiBaTox – Full Set of Fact Sheets
222
substances [Ref03] and on existing Commission approaches to WFD enforcement as detailed below.
2. Methodology
Commission approaches to the identification of priority substances
The WFD came into force in 2000. The first list of priority pollutants (Annex X to the WFD) was established in 2001 (Decision No 2455/2001/EC) [Ref04] and corresponding EQS have been laid down in 2008 (Dir 2008/105/EC) [Ref05]. In 2013, the list was amended and the EQS were revised (Dir 2013/39/EU) [Ref06]. For the forthcoming second review, Commission services have performed preparatory work (Carvalho et al. 2016) [Ref07].
For the first prioritisation exercise, the Commission used a “combined monitoring-based and modelling-based priority setting scheme” (COMMPS), which was developed in collaboration with the Fraunhofer Institute (Klein et al. 1999) [Ref08]. The COMMPS procedure was “designed as a dynamic instrument (…) open to continuous improvement and development” (Decision No 2455/2001/EC, Recital 17) [Ref04]. Refinements made for the first review are described in James et al. (2009) [Ref09] and Daginnus et al. 2010 [Ref10]. For the ongoing second review, the principle of the combined approach shall be maintained, but the monitoring-based part is suggested to include a novel approach to risk ranking, the so-called “spatial, temporal and extent of PNEC exceedances approach” (STE) (Carvalho et al. 2016) [Ref07], which has been developed by Von der Ohe et al. (2011) [Ref11]. For EQS setting, a detailed Technical Guidance Document has been developed (EC 2012) [Ref12].
Applicability of the Commission approaches is limited to a small fraction of aquatic pollutants. For most pollutants, the available hazard or exposure data do not satisfy the Article 16 requirements for a risk-based ranking. In 2013, the prioritisation approach was complemented by a so-called watch list mechanism. Substances on the watch list are subject to temporary EU-wide monitoring “for the purpose of supporting future prioritisation exercises” (Dir 2008/105/EC, Article 8b as amended by Dir 2013/39/EU) [Ref06]. The watch list is limited to a possible maximum of 14 substances or groups of substances. Currently the list includes eight pollutants, three of which are actually groups. These groups are two estrogens, three macrolide antibiotics and five neonicotionoids (Commission Implementing Decision (EU) 2018/840) [Ref16].
The NORMAN approach
The NORMAN approach seeks to remove the huge knowledge gaps about emerging substances. Pollutants which do not meet the data requirements for risk assessment and EQS setting under the WFD are no longer ignored. They are
• assigned to a number of action categories and • prioritised for action within these categories.
Possible actions include toxicity testing, chemical monitoring, and improvement of analytical methods. A brief overview of the methodology is given in Dulio and Slobodnik (2015) [Ref13]. A detailed description is provided in Dulio and Von der Ohe (2013) [Ref14].
In SOLUTIONS, the NORMAN approach has been applied to the identification of RBSPs in the Danube river [Ref15]. The approach is confined to single substance assessments based on chemical monitoring data. Under NORMAN, modelling approaches to exposure assessment, mixture risk assessment, and the use of effect-based tools are not included.
Advanced framework for prioritisation
SOLUTIONS proposes an ‘Advanced methodological framework for the identification and prioritization of contaminants and contaminant mixtures in the aquatic environment’ FS041. The

RiBaTox – Full Set of Fact Sheets
223
advanced framework does not replace existing approaches, but integrates existing procedures with novel methodologies into a multiple-lines of evidence approach. The novel elements of the prioritisation framework include state-of-the-art exposure modelling, component-based mixture risk assessment, effect-based tools, and evidence from ecological monitoring.
Fact Sheet FS041 provides an overview of the proposed framework and a guidance to dedicated information about special elements of the framework, including the use of mixture risk modelling FS019 and other parts of the SOLUTIONS model train FS016 for the identification of priority substances and mixtures FS014, the use of effect-based monitoring FS002 and subsequent toxicant identification FS045 for prioritisation purposes, as well as the application of weight of evidence approaches FS087 for deriving information about significant chemical risks from ecological assessment strategies FS059.
Emerging drinking water contaminants
Drinking water is a major route of human exposure to contaminants in aquatic systems, in addition to fish food consumption. Hence, the prioritisation of pollutants under the WFD and the prioritisation of contaminants in drinking water are strongly interrelated and may partly use common tools and approaches. Given these interdependencies, SOLUTIONS developed a tool for the ‘risk-based prioritisation (RBP) of emerging contaminants in drinking water’. The tool includes the derivation of provisional drinking water guideline values. A description of the methodology and a guidance to further reading is provided in Fact Sheet FS027.
Pollutants of tomorrow
By means of a think tank approach, SOLUTIONS examined existing scenarios for the medium- and long-term development of European and global societies, driven by multiple factors, such as demographic change, climate change, technological change, etc. The aim was to identify the implications for future use and emissions of chemicals and potentially resulting water pollution, including the identification of options for proactive avoidance of such pollution.
Fact Sheet FS030, entitled ‘Developments in society and the pollutants of tomorrow’, provides an overview of scenarios examined and results obtained. It guides you to detailed supplemental information, including the methodology for prediction FS031, the expectable future pollutants FS032, options for avoiding future pollution FS033, and criteria for the sustainable use of chemicals FS034.
References
1. Website off the European Commission on water policies: http://ec.europa.eu/environment/water/index_en.htm
2. Carvalho RN, Arukwe A, Ait-Aissa S, Bado-Nilles A, Balzamo S, Baun A, Belkin S, Blaha L, Brion F, Conti D, Creusot N, Essig Y, Ferrero VE, Flander-Putrle V, Fürhacker M, Grillari-Voglauer R, Hogstrand C, Jonáš A, Kharlyngdoh JB, Loos R, Lundebye AK, Modig C, Olsson PE, Pillai S, Polak N, Potalivo M, Sanchez W, Schifferli A, Schirmer K, Sforzini S, Stürzenbaum SR, Søfteland L, Turk V, Viarengo A, Werner I, Yagur-Kroll S, Zounková R and Lettieri T, 2014. Mixtures of chemical pollutants at European legislation safety concentrations: how safe are they? Toxicol. Sci. 141: 218-233, https://doi.org/10.1093/toxsci/kfu118
3. Website of the NIORMAN network: http://www.norman-network.net/ 4. Decision No 2455/2001/EC. Available at http://eur-lex.europa.eu/legal-
content/EN/TXT/PDF/?uri=CELEX:32001D2455 5. Directive 2008/105/EC. Available at http://eur-lex.europa.eu/legal-
content/EN/TXT/PDF/?uri=CELEX:32008L0105

RiBaTox – Full Set of Fact Sheets
224
6. Directive 2013/39/EU. Available at http://eur-lex.europa.eu/legal-content/EN/TXT/PDF/?uri=CELEX:32013L0039
7. Carvalho RN, Marinov D, Loos R, Napierska D, Chirico N and Lettieri T, 2016. Monitoring-based exercise: Second review of the priority substances list under the Water Framework Directive. JRC Science for Policy Report (Draft). https://circabc.europa.eu/sd/a/7fe29322-946a-4ead-b3b9-e3b156d0c318/Monitoring-based%20Exercise%20Report_FINAL%20DRAFT_25nov2016.pdf
8. Klein W, Denzer S, Herrchen M, Lepper P, Müller M, Sehrt R, Storm A and Volmer J, 1999. Revised proposal for a list of priority substances in the context of the Water Framework Directive (COMMPS procedure). Declaration ref.: 98/788/3040/DEB/E1. Fraunhofer-Institut Umweltchemie und Ökotoxikologie, Schmallenberg; http://ec.europa.eu/environment/water/water-dangersub/pdf/commps_report.pdf
9. James A, Bonnomet V, Morin A and Fribourg-Blanc B, 2009. Implementation of requirements on priority substances within the context of the Water Framework Directive. prioritisation process: Monitoring-based ranking. Contract N°07010401/2008/508122/-ADA/D2, INERIS; https://circabc.europa.eu/sd/a/5269a7d3-87fc-4d54-9b79-7d84b791485e/Final-Monitoring-based_Prioritisation_September%202009.pdf
10. Daginnus K, Gottardo S, Mostrag-Szlichtyng A, Wilkinson H, Whitehouse P, Paya-Perez A and Zaldivar JM, 2010. A modelling approach for the prioritisation of chemicals under the Water Framework Directive. JRC Scientific and Technical Reports. https://circabc.europa.eu/sd/a/70cf66bf-0183-49bf-b9fb-b660ced0117a/JRC%20Final%20report%20on%20modelling-based%20prioritisation.pdf
11. Von der Ohe PC, Dulio V, Slobodnik J, De Deckere E, Kühne R, Ebert RU, Ginebreda A, De Cooman W, Schüürmann G and Brack W, 2011. A new risk assessment approach for the prioritisation of 500 classical and emerging organic micro contaminants as potential river basin specific pollutants under the European Water Framework Directive. Sci. Total Environ. 409: 2064-2077; https://doi.org/10.1016/j.scitotenv.2011.01.054
12. EC (European Communities) (2011) Technical Guidance for Deriving Environmental Quality Standards. Common Implementation Strategy for the Water Framework Directive (2000/60/EC), Guidance Document No. 27; https://circabc.europa.eu/sd/a/0cc3581b-5f65-4b6f-91c6-433a1e947838/TGD-EQS%20CIS-WFD%2027%20EC%202011.pdf.
13. Dulio V and Slobodnik J, 2015. In Response: The NORMAN perspectives on prioritization of emerging pollutants. Environ. Toxicol. Chem. 34: 2183–2185; http://onlinelibrary.wiley.com/doi/10.1002/etc.3047/pdf
14. Dulio V and Von der Ohe PC (eds), 2013. NORMAN prioritisation framework for emerging substances. NORMAN Association Network of reference laboratories and related organisations for monitoring and bio-monitoring of emerging environmental substances. Working Group on Prioritisation of Emerging Substances NORMAN Association, Verneuil en Halatte, 70 pp.
15. Slobodnik, J., W. Brack, J. van Gils, V. Dulio and I. Liska, 2018. Guidance for identification of RBSPs and list of Danube RBSP including quantification of their ecological impact and modeling-based exposure and risk predictions validated with case-study data. Solutions Deliverable D19.4 ED194
16. Commission Implementing Decision (EU) 2018/840. Available at https://eur-lex.europa.eu/legal-content/EN/TXT/PDF/?uri=CELEX:32018D0840&from=EN
Keywords
Water Framework Directive (WFD), Priority Substances, Environmental Quality Standards (EQS),

RiBaTox – Full Set of Fact Sheets
225
Emerging Pollutants, Effect-Based Tools, Mixture Toxicity, Mixture Risk, Drinking Water Guideline Values
Related topics
Advanced methodological framework for the identification and prioritization of contaminants and contaminant mixtures FS041
Developments in society and the pollutants of tomorrow FS030
Contact information
Michael Faust ([email protected]) Faust & Backhaus, Bremen, Germany
Valeria Dulio ([email protected]) INERIS, Paris, France

RiBaTox – Full Set of Fact Sheets
226
4.2 Prioritization
FP7 SOLUTIONS project - Fact Sheet 041
Name SOLUTIONS Tool or Service
FS041 Advanced methodological framework for the identification and prioritization of contaminants and contaminant mixtures
Description
1. Objective
You have reached this Fact Sheet because you are looking for concepts and methods that aim to remove shortcomings of existing procedures for the prioritisation of pollutants for risk reduction measures under the European Water Framework Directive (WFD) [Ref01]. Such shortcomings have been summarized from different perspectives by Heiss and Küster (2015) [Ref02], Dulio and Slobodnik (2015) [Ref03], Faust and Backhaus (2015) [Ref04], and Brack et al. (2017) [Ref05]).
You may already be aware of the ‘NORMAN prioritisation framework for emerging substances’, (overview in FS069) which ranks substances of concern in terms of necessary action for closing critical knowledge gaps about exposure or toxicity (Dulio and Von der Ohe, 2013) [Ref06]. The NORMAN prioritisation approach is focussed on single substance assessments and the procedure builds on evidence from chemical monitoring.
As a step further, the project SOLUTIONS explored options for taking mixture toxicity into account and for including other lines of evidence, such as results from exposure modelling and effect-based monitoring. SOLUTIONS considered all options that emerge from the scientific state-of-the art, not a priori limited to approaches that may be readily applicable under the existing legal framework, but also including methodologies that may require a revision of the WFD in adaptation to scientific progress, as outlined in Brack et al. (2017) [Ref05]. As a result, SOLUTIONS proposes an advanced methodological framework that integrates multiple lines of evidence for identifying significant risks from pollutant mixtures, as detailed below.
Prioritisation is a cross-cutting issue. Elements of the advanced framework have been developed in different branches of the SOLUTIONS project, including models for (co-)exposure and mixture risk assessment, tools for chemical, effect-based, and ecological monitoring, and case studies for exploring the feasibility of concepts and methods. Cross links provided in this Fact Sheet guide you to the relevant tools and services.
This Fact Sheet is focused on the advancement of prioritisation procedures under the scope of the WFD. If you are specifically interested in prioritisation procedures under the European Drinking Water Directive, you are referred to the SOLUTIONS tool for the “risk-based prioritisation (RBP) of emerging contaminants in drinking water” FS027. This Fact Sheet is further confined to the prioritisation of existing pollutants and pollutant groups. If you are particularly interested in the anticipation of future pollution and potentially resulting risks to or via the aquatic environment, you are referred to the Fact Sheet about “Developments in society and the pollutants of tomorrow” FS030, which will guide you to further information on the issue.
2. Methodology
The SOLUTIONS proposal for an “advanced methodological framework for the identification and

RiBaTox – Full Set of Fact Sheets
227
prioritisation of contaminants and contaminant mixtures in the aquatic environment” is detailed in SOLUTIONS deliverable D2.1 [Ref07]. The document provides support for the advancement of the WFD Common Implementation Strategy (CIS) [Ref08] and for the review and the possible future revision of the WFD.
The SOLUTIONS proposal draws on the collective transdisciplinary expertise of scientists and regulators, both inside and outside the SOLUTIONS consortium. The exchange of opinions and ideas with external partners was facilitated by the SOLUTIONS stakeholder board and in particular by dedicated workshops with invited external experts: • The first SOLUTIONS workshop on prioritisation methodologies was held in Paris in 2014,
organised jointly with the NORMAN network. The workshop examined the state-of-the-art and derived recommendations for improvement. All presentations are publicly available via the NORMAN website [Ref09]. As an outflow, three opinion pieces were published [Ref02], [Ref03], [Ref04].
• The second SOLUTIONS prioritisation workshop explored options for integrating mixture risk assessments into prioritization procedures under the WFD. It was held in Gothenburg in 2017, jointly organised with the FRAM Center for Future Chemical Risk Assessment and Management Strategies at Gothenburg University. Discussions at the workshop were focussed on three main questions: (i) How to identify priority mixtures? (ii) How to identify drivers of mixture risks, i.e. mixture components that explain most of
the overall risk? (iii) How to set Environmental Quality Standards (EQS) for priority mixtures? All presentations are publicly available via the FRAM website [Ref10]. As an outflow, three opinion papers have been published on the three discussion topics (Brack et al., 2018 [Ref11], Backhaus et al., 2018 [Ref12], Altenburger et al., 2018 [Ref13]).
The SOLUTIONS proposal for an advanced methodological framework is based on the following principles:
• The efficient characterisation of the co-exposure of organisms to multiple pollutants requires the complementary use of modelling approaches and chemical monitoring. The principal of such a combined approach is already inherent to the existent Commission approaches for single substance prioritisation (see FS069) but is now extended to mixtures. Guidance to state-of-the-art modelling techniques for predicting the exposure situation at a given site in water, sediments or biota is provided in the Fact Sheet on Modelling strategies FS060 and the description of the SOLUTIONS model train FS016. Application of the model train for a case study in the Danube river basin is described in Fact Sheet FS014. Guidance to state-of-the-art chemical monitoring techniques for measuring the co-occurrence of pollutants is provided in the overview on monitoring strategies FS044, and more specifically in the Facts sheets on sampling strategies FS047 and analytical strategies FS051.
• The identification of significant risks from pollutant mixtures requires the complementary use of so-called component based approaches (CBA) and whole mixture testing approaches (WMA). No single approach is able to solve all problems of mixture risk assessment and ranking. CBA means the prediction of mixture toxicity and the predictive assessment of mixture risks on the basis of single substance toxicity data by means of models for the joint action of toxicants, such as ‘concentration addition’ (CA) or ‘independent action’ (IA). Guidance to such modelling techniques is provided in Fact Sheets FS019, FS026 and FS037. WMA in the context of the WFD means the biological testing of whole samples or extracts from water, sediment or biota, followed by effect-directed analyses (EDA) or other approaches for toxicant identification. Guidance to corresponding

RiBaTox – Full Set of Fact Sheets
228
techniques is provided in the Fact Sheets on ‘strategies for effect-based monitoring’ FS002 and for the ‘identification of toxicity drivers’ FS045.
• To reduce the possibility of overlooking significant risks from single substances and mixtures, all possible lines of evidence should by explored for the detection of such risks and for the identification of the causative agents or mixtures. This multiple-lines-of-evidence (LOE) approach FS087 includes prioritisation procedures starting from: (i) ecological monitoring (field observations on so-called biological quality elements (BQE))
FS059, (ii) effect-based monitoring (in vitro or in vivo testing in the lab or in situ) FS002, (iii) chemical monitoring FS047 and FS051, and (iv) exposure modelling FS016.
Where BQE indicate a bad status (LOE i), the question whether this may (partly) be caused by chemicals needs to be clarified. To this end, SOLUTIONS deliverable D13.1 [Ref14] has outlined an approach that combines all four lines of evidence. Where effect-based tools (EBT) indicate adverse effects (LOE ii), the causative agents must be identified for focussed risk reduction efforts. To this end, SOLUTIONS deliverable D9.1 [Ref15] suggests an appropriate test battery and provides guidance for the use of such tools for river-basin specific pollutants (RBSP) identification. The approach is also applicable on a European-wide level. Where chemical monitoring (LOE iii) or exposure modelling (LOE iv) provide co-exposure scenarios, CBA are required to assess the significance of expectable mixture risks and to identify possible drivers of mixture toxicity. To this end, SOLUTIONS deliverable D18.1 [Ref16] provides a tiered approach for both human and environmental mixture risk assessments. The ‘Weight of Evidence approach’ can be explored in the Diagnostic Toolbox of RiBaTox.
• Where one or more lines of evidence identify groups of pollutants presenting a significant risk, these should be subject to prioritisation for risk reduction measures. There are several options for defining such groups of priority pollutants and for setting EQS that safeguard against adverse effects from such groups, as discussed in Brack et al. (2018) [Ref11] and Altenburger et al. (2018) [Ref13], respectively. The most known example of such approaches is the so-called toxic equivalency factor approach (TEF). Under the WFD it is currently applied to dioxin-like compounds only, but it may be used for other groups too, as suggested in the Technical Guidance for Deriving Environmental Quality Standards (EC, 2011) [Ref17]. Where appropriate, groups may be reduced to few substances (or even one single substance) which can be demonstrated to explain most of the overall risk, so-called drivers of mixture risks. Options to identify such drivers are discussed in Backhaus et al., 2018 [Ref12]. • Wherever conclusive evidence cannot be reached because a line of evidence is
somewhere blocked by significant data or knowledge gaps on exposure or toxicity, substances or mixtures of potential concern are not left unnoticed but they are prioritised for further research and testing. This principle is adopted from the NORMAN approach and expanded to the needs of mixture risk assessment, where knowledge gaps about relevant mixture constituents are particularly critical, especially for component based approaches. This results from the fact that CBAs require comparable and reliable data sets for all relevant mixture components. Techniques for bridging data gaps, such as QSAR, read-across, TTC etc., can be used for first tier worst-case assessments of the overall mixture risk, but they may be inappropriate for risk ranking and driver identification as detailed in SOLUTIONS deliverable D18.1 [Ref16].

RiBaTox – Full Set of Fact Sheets
229
Some elements of the advanced methodological framework may be readily applicable under the existing WFD, such as the establishment of some further groups of priority pollutants, similar to the TEF approach for dioxins. Full implementation, however, requires changes in the legal text, as detailed in SOLUTIONS deliverable D2.1 [Ref07]. One example is the need for a broader definition of priority pollutants which should include all substances that make a significant contribution to an unacceptable overall risk, irrespective of the fact whether they exceed individually acceptable levels or not. Another example is the need for a clear legal mandate for the establishment of an effect-based monitoring system, which may be performed in parallel to chemical monitoring or as a trigger for chemical monitoring.
References
1. EC, 2000. Directive 2000/60/EC as last amended by Commission Directive 2014/101/EU. Latest consolidated version available at http://eur-lex.europa.eu/legal-content/EN/TXT/PDF/?uri=CELEX:02000L0060-20141120&qid=1512984590326&from=EN
2. Heiss C and Küster A, 2015. In Response: A regulatory perspective on prioritization of emerging pollutants in the context of the Water Framework Directive. Environ. Toxicol. Chem. 34: 2181-2183; http://onlinelibrary.wiley.com/doi/10.1002/etc.3047/pdf
3. Dulio V and Slobodnik J, 2015. In Response: The NORMAN perspectives on prioritization of emerging pollutants. Environ. Toxicol. Chem. 34: 2183–2185; http://onlinelibrary.wiley.com/doi/10.1002/etc.3047/pdf
4. Faust M and Backhaus T, 2015. Prioritization and standard setting for pollutant mixtures in the aquatic environment: A business consultant’s perspective. Environ. Toxicol. Chem. 34: 2185-2187; http://onlinelibrary.wiley.com/doi/10.1002/etc.3047/pdf
5. Brack W, Dulio V, Ågerstrand M, Allan I, Altenburger R, Brinkmann M, Bunke D, Burgess RM, Cousins I, Escher BI, Hernández FJ, Hewitt LM, Hilscherová K, Hollender J, Hollert H, Kase R, Klauer B, Lindim C, Herráez DL, Miège C, Munthe J, O'Toole S, Posthuma L, Rüdel H, Schäfer RB, Sengl M, Smedes F, van de Meent D, van den Brink PJ, van Gils J, van Wezel AP, Vethaak AD, Vermeirssen E, von der Ohe PC and Vrana B, 2017. Towards the review of the European Union Water Framework Directive: Recommendations for more efficient assessment and management of chemical contamination in European surface water resources. Sci. Total Environ. 576: 720-737; https://doi.org/10.1016/j.scitotenv.2016.10.104
6. Dulio V and Von der Ohe PC (eds), 2013. NORMAN prioritisation framework for emerging substances. NORMAN Association Network of reference laboratories and related organisations for monitoring and bio-monitoring of emerging environmental substances. Working Group on Prioritisation of Emerging Substances NORMAN Association, Verneuil en Halatte, 70 pp.
7. Faust, M., R. Altenburger, T. Backhaus, W. Brack, V. Dulio, A. Ginebreda, A. Kortenkamp, J. Munthe, J. Slobodnik, K.E. Tollefsen and A. van Wezel, 2018. Advanced methodological framework for the identification and prioritisation of contaminants and contaminant mixtures in the aquatic environment. SOLUTIONS deliverable D2.1.
8. Background information about Common Implementation Strategy (CIS) and guidance to publicly available CIS documents is available at Commission’s website on the CIS work programme: http://ec.europa.eu/environment/water/water-framework/objectives/implementation_en.htm
9. Presentations at the 1st SOLUTIONS workshop on prioritisation methodologies available at http://www.norman-network.net/?q=node/156
10. Presentations at the 2nd SOLUTIONS workshop on prioritisation methodologies available at

RiBaTox – Full Set of Fact Sheets
230
http://fram.gu.se/Outreach/joint-workshop-fram---solutions-2017- 11. Brack, W. et al, 2018. How to identify priority mixtures? (in preparation) 12. Backhaus, T. et al, 2018. How to identify drivers of mixture risks? (in preparation) 13. Altenburger, R. et al, 2018. How to set Environmental Quality Standards (EQS) for priority
mixtures? (in preparation) 14. Backhaus T, Segner H, Hollert H, Deutschmann B, Van den Brink P, Seiler T, Teodorovic I,
and Focks A., 2017. Diagnostic toolbox for ecological effects of pollutant mixtures, including bio-tests, trait-based database and detection tool and WoE studies at hot-spot sites. SOLUTIONS Deliverable D13.1.
15. Altenburger, R., W. Busch, M. López de Alda, M Kraus, B. Escher, A. Focks and W. Brack, 2018. Guidance document and decision tree for use of chemical, bioanalytical and ecological tools in RBSP identification, impact assessment and establishment of cause-effect relationships. SOLUTIONS deliverable D9.1 ED091
16. Kortenkamp, A. et al, 2018. Common assessment framework for HRA and ERA higher tier assessments including fish and drinking water and multi-species ERA via SSD, population-level ERA via IBM and food web vulnerability ERA. SOLUTIONS deliverable D18.1 (in Prep).
17. EC (European Communities), 2011. Technical guidance for deriving environmental quality standards, Chapter 7. Common Implementation Strategy for the Water Framework Directive (2000/60/EC), Guidance Document No. 27; https://circabc.europa.eu/sd/a/0cc3581b-5f65-4b6f-91c6-433a1e947838/TGD-EQS%20CIS-WFD%2027%20EC%202011.pdf
Keywords
Water Framework Directive (WFD), Priority Substances, Environmental Quality Standards (EQS), Emerging Pollutants, Effect-Based Tools, Mixture Toxicity, Mixture Risk
Related topics
Prioritization strategies FS069
Risk based prioritization (RBP) of emerging contaminants in drinking water FS027
Identification of new substances posing a high risk FS014
Contact information
Michael Faust ([email protected]) Faust & Backhaus Environmental Consulting GbR, Bremen, Germany

RiBaTox – Full Set of Fact Sheets
231
FP7 SOLUTIONS project - Fact Sheet 027
Name SOLUTIONS Tool or Service
FS027 Risk based prioritization (RBP) of emerging contaminants in drinking water
Description
1. Objective
You have reached this Fact Sheet because application of analytical strategies FS051 and/or strategies for toxicant identification FS045 have indicated the presence of chemical contaminants in drinking water or in its resources. This requires the application of Risk characterisation models FS019 and an Advanced methodological framework for the identification and prioritization of contaminants and contaminant mixtures FS041. The objective of Risk based prioritization (RBP) of emerging contaminants in drinking water is to derive provisional drinking water guidelines to which detected (drinking) water concentrations can be compared. Benchmark quotient values that serve as human health risk indices are then calculated by dividing the concentration levels in drinking water by the respective provisional guideline value. This tool complements Identification of new substances posing a high risk FS014.
2. Methodology
The product is based on the methodology as presented by Schriks et al. [Ref01] and Baken et al. [Ref02]. Triggered by the RBP process, an inventory of emerging contaminants in (sources of) drinking water was performed. First, chemical contaminants detected during the last decade in drinking water, raw drinking water (collected water that had not yet undergone treatment), and direct drinking water sources in the downstream parts of the Rhine (i.e. Rhine river basin FS027 case study) and Meuse river basins were collected. The primary data sources were the REWAB database, in which drinking water monitoring results of the Dutch drinking water companies are collected, and the database of RIWA association of river waterworks that includes compounds monitored in Dutch surface waters. Only organic compounds were included, and sum-parameters were excluded. In addition, monitoring results of the Dutch drinking water laboratories and Rijkswaterstaat (Netherlands Department of Public Works and Water Management) were consulted.
Subsequently, a number of criteria were used to select drinking water relevant compounds. Substances present in raw drinking water were selected when their concentrations were above the Threshold of Toxicological Concern (TTC) levels reported by Mons et al. [Ref03] of 0.01 µg/L for substances not labelled as carcinogenic, mutagenic, or toxic to reproduction (CMR) and 0.1 µg/L for non-CMR substances. Chemicals present in direct drinking water sources were considered relevant for drinking water when they were hydrophilic (octanol/water partition coefficient log Kow <4), not volatile (Henry’s Law constant KiH(w) <0.02), and detected at a concentration above the TTC thresholds. Log Kow and KiH(w) information may be retrieved from Substances Properties and Use Data FS020.
Next, the toxicological relevance of the selected compounds was assessed. A drinking water guideline value represents the concentration of a constituent that does not exceed tolerable risk to the health of a consumer at lifetime exposure. As a first step, existing statutory drinking water guideline values were obtained from e.g. the WHO and the US EPA. If not available, the second step was to obtain an established Tolerable Daily Intake (TDI), Acceptable Daily Intake (ADI) or Reference Dose (RfD) or exposure levels corresponding to a specified extra life time cancer risk.

RiBaTox – Full Set of Fact Sheets
232
When those were lacking as well, in a third step toxicity data collection focused primarily on established lowest/no observed (adverse) effect levels (LO/NO(A)ELs), from which a TDI was calculated. Finally, in a fourth step, miscellaneous toxicological information (such as the therapeutic dose) was collected and a TDI was calculated accordingly. TDIs, ADIs, RfDs and/or toxicity data were sourced from documents supporting regulatory drinking water guidelines or target levels or risk assessment reports published by acknowledged international institutes; toxicological databases such as the US EPA IRIS database, TERA (Toxicology Excellence for Risk Assessment) International Toxicity Estimates for Risk (ITER), and the Organisation for Economic Co-operation and Development (OECD) eChemPortal; and from other sources such as grey literature. In case of insufficient human relevant toxicological data, the compound of interest was not further evaluated.
To calculate provisional health based guideline values, first the Tolerable Daily Intake was determined (if not already available). The Point Of Departure (POD) for calculating the TDI was mostly a chronic LO(A)EL, NO(A)EL, benchmark dose level or equivalent. An appropriate safety factor to extrapolate to chronic exposure and to incorporate intra- and interspecies differences was utilized as part of the routine TDI calculation. A drinking water equivalent level (DWEL) was subsequently calculated by multiplying the TDI, ADI or RfD, or the 10-6 extra life time cancer risk level in case of a genotoxic substance, by a typical average adult body weight of 70 kg and dividing this intake level by a daily drinking water consumption of 2 L. Finally, for non-genotoxic substances the DWEL was multiplied by an allocation factor (between 20%-80%) to account for exposure via other sources than drinking water as well, to derive a provisional drinking water guideline value. To indicate the strength of the substantiation of the drinking water guideline values, substances were grouped in the following categories: (A) representing compounds with a statutory drinking water guideline value, (B) representing compounds with an established TDI, ADI or RFD, (C) representing compounds for which the TDI was calculated with an established LO(A)EL or NO(A)EL and (D) representing compounds for which the TDI was calculated based on miscellaneous toxicological information.
Finally, a Benchmark Quotient (BQ) was calculated as the ratio between the mean or maximum reported drinking water concentration and the (provisional) health-based drinking water guideline value. A BQ value of 1 represents a (drinking) water concentration equal to the (provisional) guideline value. A BQ value of ≥1 in drinking water may thus be of potential human health concern if the water were to be consumed over a lifetime period. Compounds with a BQ value ≥0.1 in drinking water may warrant further investigation. For compounds detected in raw drinking water, surface water and groundwater, drinking water treatment may provide additional safety. For these substances it was presumed that a BQ of ≤0.2 presents absence of appreciable concern for a risk to human health.
3. Application
This RBP tool allows selection of emerging substances with the highest drinking water relevance and prioritization of those substances based on toxicological information and detected concentrations. Human health risk associated with consumption of drinking water in which substances are present for which toxicity data are absent, cannot be assessed using this tool. In such cases, the TTC approach [Ref02], [Ref03], Effect-Based Tools (EBT) FS002, and Models for predicting human health endpoints FS068 may be applied to evaluate or predict the biological activity of the contaminants. For toxicological evaluation of mixtures of substances, the Combination Toxicity Calculator (CTC) FS026 can be consulted.
RiBaTox – Full Set of Fact Sheets
233
References
1. Schriks, M., Heringa M.B., van der Kooi M.M., de Voogt P. and van Wezel A.P., 2010. Toxicological relevance of emerging contaminants for drinking water quality. Water Res. 44: 461-476; https://doi.org/10.1016/j.watres.2009.08.023
2. Baken, K.A., R.M.A. Sjerps, M. Schriks and A.P. van Wezel, 2018. Toxicological relevance and Threshold of Toxicological Concern (TTC) for drinking water relevant contaminants of emerging concern. Environ. Int. 118: 293-303; https://doi.org/10.1016/j.envint.2018.05.006
3. Mons, M.N., Heringa, M.B., van Genderen, J., Puijker, L.M., Brand, W., van Leeuwen, C.J., Stoks, P., van der Hoek, J.P., van der Kooij, D., 2013. Use of the Threshold of Toxicological Concern (TTC) approach for deriving target values for drinking water contaminants. Water Res. 47(4): 1666-1678; https://doi.org/10.1016/j.watres.2012.12.025
Keywords
Risk based prioritization (RBP), drinking water, health risk assessment, provisional drinking water guideline value, threshold of toxicological concern
Related topics
Advanced methodological framework for the identification and prioritization of contaminants and contaminant mixtures FS041 Identification of new substances posing a high risk FS014 Modelling strategies FS060
Contact information
Kirsten Baken ([email protected]) KWR Watercycle Research Institute, Nieuwegein, The Netherlands

RiBaTox – Full Set of Fact Sheets
234
FP7 SOLUTIONS project - Fact Sheet 014
Name SOLUTIONS Tool or Service
FS014 Identification of new substances potentially posing a high risk to river basins
Description
1. Objective
You have reached this Fact Sheet because you are interested to use modelling techniques to identify substances potentially posing a high risk in the frame of river basin management practices.
The use of mathematical models makes it possible to carry out a risk assessment which includes emerging substances for which field data or lab tests are not yet available. Thus, models allow the assessment of individual chemicals or groups of chemicals which cannot be included in classical data driven risk assessments. This approach can for example be used to screen a large list of substances or mixtures and to prioritise them in terms of their potential risk. The result can be used for example to drive: • the selection of substances to be included in future monitoring, or • the initial stages of development of future programmes of measures.
2. Methodology
We have used the SOLUTIONS model train (Figure 1) to carry out the risk assessment of a wide range of chemicals in all European River Basins.
Figure 1. The SOLUTIONS Model train, using external data and consisting of the sub-models (i) Emissions, (ii) Transport & Fate, (iii) Substance properties and (iv) Risk characterisation.
Emissions sub-model (M2)
Risk characterizationsub-model (M5)
Transport & fate sub-model (M3)
Subs
tanc
e pr
oper
ties
sub-
mod
el(s
) (M
4)
Exte
rnal
dat
a
partitioning
toxicitymode of action
Emissions to air, soil, groundwater, surface water
exposure
Use volumes use types
Waste water &Solid waste management
HydrologyMeteorologyWaterbodiesSoilsSocio-economy
Species sensitivitiesSpecies traitsFood webs
partitioning, decay

RiBaTox – Full Set of Fact Sheets
235
The analysis uses present (≈2010) data to calculate the emissions of emerging chemicals, the concentrations of these chemicals in the surface waters, top soils and selected biota, as well as the effects that these chemicals are exercising in surface waters, specified in terms of specific endpoints, in the perspective of the implementation of the Water Framework Directive.
3. Application
The results generated by the SOLUTIONS Model Train EU Wide application are available in the form of maps, plus underlying data, covering the whole of Europe with a spatial resolution of 10-15 km on average and (where applicable) a temporal resolution of 1 day FS021. These results can be used to determine which substances contribute most to the risk to aquatic ecosystems and human health. The analysis can be made on the scale of Europe as a whole, but can also be differentiated to specific river basins (e.g. Danube, Rhine) or sub-basins (Sava, Neckar).
The results for individual substances can be used as such, but is also possible to look at groups of substances. What is the risk by pharmaceuticals versus the risk by pesticides? Different endpoints can also be considered: for which Biological Quality Elements (phytoplankton, macro-invertebrates, fish) is the risk highest, and where?
The obvious advantages of using model based results are • information for more chemicals, • with complete coverage in space and time, and • unaffected by analysis accuracy limitations (limits of detection and quantification).
The price we pay for that is a reduced accuracy of the data: especially the predicted concentrations are expected to deviate to some degree from the ‘real’ concentrations. The SOLUTIONS reports referenced below provide insight on the accuracy that can be expected.
The Tools and Services described here are also input to applications in the Danube Case Study FS043, the Rhine Case Studies FS075, FS027 and the Iberian Case Study (FS040), as well as the Advanced methodological framework for the identification and prioritization of contaminants and contaminant mixtures FS041.
References
1. van Gils, J., R. Schueder, C. Chrzanowski, A. Focks, H. Baveco, L. Posthuma, I. Cousins, C. Lindim, S. Kutsarova, S. Dimitrov, A. Kortenkamp, S. Ermler, G. Massman, J.Greskowiak, G. Schüürmann, R. Kuehne, D. van de Meent and D. de Zwart, 2018. Modelling framework and model-based assessment for substance screening. Solutions Deliverable D14.1.
2. van Gils, J., L. Posthuma, M. Zijp, A. van Wezel, R. Sjerps, D. Bunke, D. de Zwart, Dik van de Meent, I. Cousins, C. Lindim, S. Kutsarova, O. Mekenyan, J. Hollender, J. Slobodnik, R. Kühne and A. Kortenkamp, 2018. Europe wide modelling and simulations of emerging pollutants risk including think tank scenarios. Solutions Deliverable D14.2.
Keywords
River Basin, Europe, emerging compounds, modelling, risk assessment, prioritisation
Related topics
Prioritization strategies FS069 Modelling strategies FS060 Risk based prioritization (RBP) of emerging contaminants in drinking water FS027

RiBaTox – Full Set of Fact Sheets
236
Contact information
Jos van Gils ([email protected]) Deltares, Delft, The Netherlands
Jaroslav Slobodnik ([email protected]) Environmental Institute, Kos, Slovak Republic
RiBaTox – Full Set of Fact Sheets
237
4.3 Future pollutants
FP7 SOLUTIONS project - Fact Sheet 030
Name SOLUTIONS Tool or Service
FS030 Developments in society and the pollutants of tomorrow
Description
1. Objective
You have reached this Fact Sheet because you have realized that patterns of pollution in river basins change with time. Therefore you would like to know how your management can address such developments. In the following we give you an overview which kind of developments in society can be expected and how this can determine the pattern of pollutants of tomorrow.
This overview is complemented by four other tools which you can find in RiBaTox. All together they will help you to better face the changes of pollutants which we can expect. These more detailed supplemental tools start with a description how we can – to a certain extend – predict future pollutants FS031. There are indications that specific groups of chemicals can be expected to change in the future FS032. It will be shown that there are several strategies how to avoid future pollutants FS033. In order to avoid problems from the beginning, criteria can help to select more sustainable chemicals FS034. Knowledge on future pollutants can also help to develop prioritization strategies which address adequately future developments in water quality FS069.
Emerging pollutants are monitored in surface waters since the nineties. With progress in analytical chemistry it is possible to analyse these substances that are present at low concentrations. Which pollutants can be expected if future developments in society are taken into account?
Developments in society are described in a broad range of scenarios. Until now, implications of such developments for future pollutants had not been systematically discussed. Therefore, how one can predict future emerging pollutants was analysed published in detail – based on scenarios for developments in society [Ref01]. This work also aims to show options to act to avoid adverse effects on river basins.
2. Methodology
In figure 1 it is explained how future emerging pollutants were identified.

RiBaTox – Full Set of Fact Sheets
238
Figure 1. The link between developments in society and future use and emissions of chemicals.
Scenarios which describe future developments in society (left box) are analysed regarding implications of these developments for the emission of chemicals. Examples for groups of chemicals are shown in the right box.
Within the SOLUTIONS project, three steps have been made to identify future changes in pollution patterns due to developments in society. First, more than 30 different reports on future scenarios (see below) were analysed and key findings published [Ref01]. Second, a group of experts worked together in the Think Tank ‘Pollution of tomorrow and options to act’. The work in that Think Tank aimed to analyse implications of societal scenarios for future use and emissions of chemicals. In a third step, four workshops have been held together with external experts to discuss important trends in the fields of health care, food production, urbanization and new technologies. The discussions were used to identify implications of these trends on future pollution of the environment, especially of surface waters. In addition, options to mitigate new or changed impacts have been discussed for each sector. More details on how to predict future pollutants can be found in the factsheet related to this question FS031.
Scenarios
Scenarios on developments in society address a broad range of aspects. They can be grouped – with underlying studies - as follows: • Scenarios for middle- and long-term developments in society, caused by multiple drivers
(e.g. the UNEP GEO 5 – Global Environmental Outlook; the UN Millennium Ecosystem Assessment (MA); the European Environment – State and Outlook 2010; the Planetary Boundary Approach);
• Predictions for water use and water cycle (e.g. The World Water Vision of Earthscan; Water in a changing world (The United Nations World Water Development Report); Water resources across Europe (European Environmental Agency);
• Predictions for industrial chemicals and hazardous waste (e.g. Costs on Inaction on the sound management of chemicals (UNEP); Trace Contaminants in Water Cycles (Acatech));
• Developments due to climate change (e.g. the IPPC Special Report Emission Scenarios from UNEP; the SCARCE project, predictions for changes in disease patterns [Ref02]);
• Developments due to demographic change (e.g. OECD Environmental Outlook to 2050); • Developments due to technological and/or economic changes (e.g. THOUGHTS
Megatrends);

RiBaTox – Full Set of Fact Sheets
239
• Predictions for food production and nutrients (e.g. World Social Science Report from UNEP).
In addition, a number of related aspects have been included in the analysis, e.g. a retrospective analysis of technological changes (EEA, Late lessons from early warnings) and the EU Environmental Policy Targets for 2010–2050).
In most of the existing scenarios, impacts on (aquatic) ecosystems are not directly addressed. However, scenarios often describe trends which can be linked to the use of chemicals. Therefore, they can be the starting point to analyse implications on future use and emissions of chemicals and consider how to anticipate in terms of risk prevention.
Climate change, demographic change and similar developments have many and often complex implications on the nature and expected concentrations of future pollutants. Existing scenarios can be used to predict upcoming pollutants.
Predictions on demographic change can be included in modelling. Compared to Europe 2020 targets, EU 2050 Visions will be more difficult to be predicted. Finally it has been found that many sector-specific options exist to reduce emissions. If you would like to know more about which groups of chemicals are expected to change, go to our tool that addresses this question FS032. If you are interested to know how to avoid future pollutants, you find more information in the tool related to abatement options for future pollutants FS033. Future problems with new chemicals can be avoided if these chemicals are more sustainable than the conventional ones [Ref03]. Specific criteria can help to make such an assessment – see our tool FS034.
References
1. Moritz, S. Bunke, D., Brack, W.; Herráez, D.L., Posthuma, L. 2014. Developments in society and implications for emerging pollutants in the aquatic environment of tomorrow. Öko-Institut, Freiburg, Working paper 1/2017; https://www.oeko.de/fileadmin/oekodoc/WP-Emerging-Pollutants.pdf
2. Redshaw, C.H., Stahl-Timmins, W.M., Fleming, L.E., Davidson, I., Michael H. and Depledge, M.H., 2013. Potential changes in disease patterns and pharmaceutical use in response to climate change. J. Toxicol. Env. Heal. B, 16: 285; https://doi.org/10.1080/10937404.2013.802265
3. Geiser, K., 2015. Chemicals without harm. Policies for a Sustainable World. MIT Press, Cambridge (MA), pp.456; https://mitpress.mit.edu/books/chemicals-without-harm
Keywords
Emerging pollutants, scenarios, developments, prediction, abatement, sustainable chemicals, emission reduction
Related topics
Future pollutants: How to predict? FS031 Future pollutants: Which pollutions can we expect? FS032 Future pollutants: How to avoid? FS033 Avoid problems from the beginning: Criteria for sustainable chemicals FS034
Prioritization strategies FS069.

RiBaTox – Full Set of Fact Sheets
240
Contact information
Dirk Bunke ([email protected]) Öko-Institut, Freiburg, Germany

RiBaTox – Full Set of Fact Sheets
241
FP7 SOLUTIONS project - Fact Sheet 031
Name SOLUTIONS Tool or Service
FS031 Future pollutants: How to predict?
Description
1. Objective
You have reached this Fact Sheet because you are aware of the fact that patterns of pollution change with time. You got an overview on developments in society and the pollutants of tomorrow in our related tool FS030. Now you would like to know how one can predict future pollutants in specific river basins. An analysis of the future development of a region can give indications on future pollutants.
In this context, the objective of the advice ‘Future pollutants: how to predict‘ is to support decision makers in considering important future trends. It takes into account local and regional developments as well as developments in society which are of global importance. (Additional information regarding future pollutants you can find in our tools ‘Which pollutants can we expect?’ FS032, ‘How to avoid future pollutants?’ FS033, and ‘Avoid problems from the beginning: Criteria for sustainable chemicals’ FS034). Knowledge on future pollutants can also help to develop prioritization strategies which address adequately future developments in water quality FS069.
2. Methodology
The proposed methodology is based on the experience from the analysis of a large range of future scenarios. An overview on future developments is given in [Ref01]. Figure 1 shows important areas of future developments. They can have severe implications for future pollutants.
Figure 1. Important areas of future developments which should be taken into account to predict future pollutants in river basins
Each of these areas has been discussed in detail with experts. Examples for such developments are described in [Ref02], [Ref03] and [Ref04]. This allowed to identify important trends and to discuss influence on patterns of pollutants. The experience from this exchange has been the base to develop recommendations for equivalent predictions on a local scale.

RiBaTox – Full Set of Fact Sheets
242
3. Application Which pollutants can be expected in a specific river basin or a specific region? The following steps are recommended to predict future pollutants and to develop mitigation options:
• Analysis of existing scenarios on future developments. Such scenarios exist for a broad range of developments. They should be combined with regional predictions on the future development of sectors and branches.
• Set up a Think Tank. According to our experience, it is quite helpful to set up of a group of people to analyse implications of developments for future use and emissions of pollutants (the ‘Think Tank Approach’).
• Exchange with external experts on (regional and large scale) developments. Workshops with internal and external experts are recommended for high priority fields of development.
• Lessons learnt. Take time to reflect lessons from the workshop and translate them into management options for the future development of the region.
Examples for this approach and for management options are documented [Ref05]. This reference documents the content and the results of the four Think Tank workshops from the SOLUTIONS project. It may help you to get a clear picture how to predict future changes.
References
1. Moritz, S. Bunke, D., Brack, W.; Herráez, D.L. and Posthuma, L., 2017. Developments in society and implications for emerging pollutants in the aquatic environment of tomorrow. Öko-Institut, Freiburg, Working paper 1/2017; https://www.oeko.de/fileadmin/oekodoc/WP-Emerging-Pollutants.pdf
2. Breuer, K., Mayer, F., Scherer, C., Schwerd, R. and Sedlbauer, K., 2012. Wirkstoffauswaschung aus hydrophoben Fassadenbeschichtungen. Bauphysik, 34(1): 19-23; https://doi.org/10.1002/bapi.201200002
3. Brorström-Lunden, E., 2016. Emerging pollutants in urban environments: Overview. Presentation at the Workshop ‘Cities 2030: trends and consequences’, Frankfurt, 8 September 2015. In: Bunke, D.; Moritz, S.: Documentation of the Think Tank workshops. Öko-Institute, Freiburg.
4. Redshaw, C.H., Stahl-Timmins, W.M., Fleming, L.E., Davidson, I., Michael H. and Depledge, M.H., 2013. Potential changes in disease patterns and pharmaceutical use in response to climate change. J. Toxicol. Env. Heal. B, 16: 285–320; https://doi.org/10.1080/10937404.2013.802265
5. Bunke, D., Moritz, S. and Think Tank ‘Pollutions of Tomorrow’, 2018. Pollution of tomorrow: Options to act on future risks. Recommendations for a successful management of emerging pollutants. Solutions deliverable D6.1 ED061
Keywords
Emerging pollutants, scenarios, developments, prediction, abatement, sustainable chemicals, emission reduction
Related topics
Developments in society and the pollutants of tomorrow FS030 Future pollutants: Which pollutions can we expect? FS032

RiBaTox – Full Set of Fact Sheets
243
Future pollutants: How to avoid? FS033 Avoid problems from the beginning: Criteria for sustainable chemicals FS034
Prioritization strategies FS069.
Contact information
Dirk Bunke ([email protected]) Öko-Institut, Freiburg, Germany

RiBaTox – Full Set of Fact Sheets
244
FP7 SOLUTIONS project - Fact Sheet 032
Name SOLUTIONS Tool or Service
FS032 Future pollutants: Which pollutants can we expect?
Description
1. Objective
You have reached this Fact Sheet because you know that the nature of pollutants in surface water may change with time. You would like to know which pollutants can be expected – and which could decrease.
Which contaminants can be expected in the future in surface waters and river basins? The patterns of pollution change with time. Some of these changes can be linked to future developments in society (such as urbanisation, land use and demographic changes). For an overview about such changes, see [Ref01]. Innovations in technologies play a central role to enhance efficiency of processes and products. New materials are constantly developed – the majority of product innovations are based on them. Printable electronics, metallic matrix composites, technical textiles and switchable shading systems are only some examples. Does this automatically mean that we can expect in parallel release of new (harmful) substances to the environment? (Additional information regarding future pollutants you can find in our tools “Future pollutants: how to predict?” FS031, “How to avoid future pollutants?” FS033, and “Avoid problems from the beginning: Criteria for sustainable chemicals” FS034). Knowledge on future pollutants can also help to develop prioritization strategies which address adequately future developments in water quality FS069.
In this context, one objective of the report ‘Future pollutants: options to act on future risks’ [Ref02] is to show which groups of pollutants may play a major role in the future. It aims to support decision makers in finding appropriate measures to avoid or to reduce future emissions of these chemicals. In addition, it aims to give a better understanding how pollution of the future could look like.
Figure 1. Formula of four substances which can be expected in increasing concentrations in the future. A: Sucralose, B: Triacetin,. C: Terbutyrin, D: Propiconazole.
2. Methodology The methodology presented is based on the experience from the analysis of future trends in the

RiBaTox – Full Set of Fact Sheets
245
following areas (with examples of important aspects): • Climate change: • Demographic change: longevity / increase of drug consumption / healthcare acquired
infections; • Food and Population growth: increase in food production / animal farming / re-use of
waste water / nutrition behaviour, convenience food; • Urbanisation: growing cities, sprawl, social segregation, urban mining, increased
leaching; • New technologies and new materials: biobased materials, energy supply materials,
semiconductors, microplastics.
For each of these areas it has been discussed whether new pollutants can be expected in the future. For this purpose, expert workshops have been performed with comprehensive discussions on future developments and implications for the release of (new) substances into the environment. As an example, figure 1 shows the structural formula of four examples of new emerging pollutants.
3. Application
For each of the areas which have been analysed, specific indications for new emerging pollutants have been found. Some examples are shown in Figure 2:
Figure 2. Groups of substances which are expected to increase in concentrations in surface waters in future.
More details on substance groups and single substances are given in the report [Ref02].
References
1. Moritz, S. Bunke, D., Brack, W.; Herráez, D.L., Posthuma, L., 2014. Developments in society and implications for emerging pollutants in the aquatic environment of tomorrow. Öko-Institut, Freiburg, Working paper 1/2017; https://www.oeko.de/fileadmin/oekodoc/WP-Emerging-Pollutants.pdf
2. Bunke, D., Moritz, S. and Think Tank ‘Pollutions of Tomorrow’, 2018. Pollution of tomorrow: Options to act on future risks. Recommendations for a successful management

RiBaTox – Full Set of Fact Sheets
246
of emerging pollutants. Solutions deliverable D6.1 ED061
Keywords
Emerging pollutants, scenarios, developments, prediction, abatement, sustainable chemicals, emission reduction. Pharmaceuticals, veterinary drugs
Related topics
Developments in society and the pollutants of tomorrow FS030 Future pollutants: How to predict? FS031 Future pollutants: How to avoid? FS033 Avoid problems from the beginning: Criteria for sustainable chemicals FS034 Prioritization strategies FS069.
Contact information
Dirk Bunke ([email protected]) Öko-Institut, Freiburg, Germany

RiBaTox – Full Set of Fact Sheets
247
FP7 SOLUTIONS project - Fact Sheet 033
Name SOLUTIONS Tool or Service
FS033 Future pollutants: How to avoid?
Description
1. Objective
You have reached this Fact Sheet because you know that the nature of pollutants in surface water may change with time. You would like to know how you can avoid future pollutants to ensure a good quality of the waterbodies.
Pollutants in surface water change with time quantitatively and qualitatively. Future developments in society (such as land use and demographic changes) will have many consequences for the quality of surface water bodies (for an overview, see [Ref01]. How can we assure a good quality of our water sources facing new kinds or new patterns of pollutants?
In this context, the objective of the advice ‘Future pollutants: How to avoid’ is to support decision makers as you in finding appropriate measures to avoid or to reduce future emissions of chemicals – or to reduce the impacts of such emissions.
Additional information regarding future pollutants you can find in our tools ‘Future pollutants: how to predict?’ FS031, ‘Future pollutants: which pollutants can we expect?’ FS032, and ‘Avoid problems from the beginning: Criteria for sustainable chemicals’ FS034). Knowledge on future pollutants can also help to develop prioritization strategies which address adequately future developments in water quality FS069.
2. Methodology The methodology presented was developed based on the experience from the analysis of future trends in the following areas (with examples for important aspects):
• Climate change: floods / new pathogens / increase in drug use / land use change / water scarcity;
• Demographic change: longevity / increase of drug consumption / healthcare acquired infections;
• Food and population growth: increase in food production / animal farming / re-use of waste water / nutrition behaviour, convenience food;
• Urbanisation: growing cities, sprawl, social segregation, urban mining, increased leaching, • New technologies and new materials: bio-based materials, energy supply materials,
semiconductors, micro-plastics.
For each of these areas, options to avoid or reduce emissions have been discussed. The options address the whole life cycle of a substance. Figure 1 shows, as an example, options to act in order to reduce emissions of veterinary drugs.
3. Application
For each of the areas which have been analysed, specific options to reduce the impact on water bodies have been found. These measures go beyond technical abatement options. They include options to change the behaviour of the users and consumers.

RiBaTox – Full Set of Fact Sheets
248
For individual groups of substances, e.g. drugs and food additives, management options are documented in a report [Ref02]. In addition, a more general advice is presented how to find and to select more sustainable products and more sustainable ways of application.
Figure 1. Life cycle of a veterinary drug and options to reduce impacts on water systems. Each step in the life cycle offers several possibilities to avoid or reduce the release of these substances.
References
1. Moritz, S., Bunke, D., Brack, W.; Herráez, D.L., Posthuma, L., 2014. Developments in society and implications for emerging pollutants in the aquatic environment of tomorrow. Öko-Institut, Freiburg, Working paper 1/2017; https://www.oeko.de/fileadmin/oekodoc/WP-Emerging-Pollutants.pdf
2. Bunke, D., Moritz, S. and Think Tank ‘Pollutions of Tomorrow’, 2018. Pollution of tomorrow: Options to act on future risks. Recommendations for a successful management of emerging pollutants. Solutions deliverable D6.1 ED061
Keywords
Emerging pollutants, scenarios, developments, prediction, abatement, sustainable chemicals, emission reduction. Pharmaceuticals, veterinary drugs
Related topics
Developments in society and the pollutants of tomorrow FS030 Future pollutants: How to predict? FS031 Future pollutants: Which pollutants can we expect? FS032 Avoid problems from the beginning: Criteria for sustainable chemicals FS034 Prioritization strategies FS069.
Contact information
Dirk Bunke ([email protected]) Öko-Institut, Freiburg, Germany
RiBaTox – Full Set of Fact Sheets
249
FP7 SOLUTIONS project - Fact Sheet 034
Name SOLUTIONS Tool or Service
FS034 Avoid problems from the beginning: Criteria for sustainable chemicals
Description
1. Objective
You have reached this Fact Sheet because you would like to know how to differ between more problematic (hazardous) chemicals and less problematic chemicals. You have realised that future pollutants entering water bodies can be avoided if chemicals are selected which have less problematic characteristics.
The use of readily biodegradable, less hazardous chemicals is a very effective way to avoid problems with chemical pollution. However, what are ‘sustainable’ chemicals? And how to find them?
The objective of the methodology described in this advice is to give criteria for sustainable chemicals. These criteria should allow users of chemicals to find out which chemicals are less problematic. In addition, these criteria can be used as guidance to develop more sustainable chemicals really from the beginning. ‘Chemicals’ in this sense may be pharmaceuticals and veterinary drugs as well as different groups of so-called ‘industrial’ chemicals and chemicals used by the general public.
Additional information regarding future pollutants you can find in our tools ‘Future pollutants: how to predict?’ FS031, ‘Future pollutants: which pollutants can we expect?’ FS032, and ‘Future pollutants: How to avoid? FS033. An overview on developments in society and implications for future pollutants is given in FS030 [Ref01, Ref02]. Knowledge on future pollutants can also help to develop prioritization strategies which address adequately future developments in water quality FS069.
2. Methodology
The criteria derived in this advice are part of the Concept of Sustainable Chemistry published in 2016 [Ref01]. This concept is based on the OECD definition of sustainable chemistry [Ref02]) and the definition of ‘inherent safe chemicals’ developed by the German Environment Agency [Ref03]. Figure 1 shows some characteristics of sustainable and of less sustainable chemicals.

RiBaTox – Full Set of Fact Sheets
250
Figure 1. What distinguishes sustainable from less sustainable chemicals? Properties of problematic chemicals are given in the left part of the figure, properties of sustainable chemicals in the right part.
The criteria have been revised with a focus on pollutants in surface waters. Experience from the monitoring of micropollutants were integrated. Options to use experience from the development of biocides for the development of more sustainable drugs have been discussed.
3. Application
A specific set of principal criteria was developed to assess the sustainability of chemicals. They are described in a guidance document [Ref04], figure 2).
Figure 2. The ‘Guidance on sustainable chemistry’ supports the selection of more sustainable chemicals
[Ref04].

RiBaTox – Full Set of Fact Sheets
251
In addition, an MS-Access-based electronical instrument (called ‘SubSelect’) is available free of charge, which allows the direct application of the criteria described in the guidance [Ref05], figure 3).
Figure 3. The MS-Access-based IT instrument SubSelect allows the assessment of substances and mixtures regarding their sustainability [Ref05].
Besides these general criteria, more specific criteria have been described which refer specifically to pollutants in water bodies [Ref07].
References
1. Blum, C.; Bunke, D.; Hungsberg, M.; Roelofs, E.; Joas, A.; Joas, R.; Blepp, M. and Stolzenberg, H.-C., 2017. The concept of sustainable chemistry: Key drivers for the transition towards sustainable development. Sustain. Chem. Pharm. 5: 94-104; https://doi.org/10.1016/j.scp.2017.01.001
2. OECD, 2014. Definition of sustainable chemistry; http://www.oecd.org/chemicalsafety/risk-management/sustainablechemistry.htm
3. Umweltbundesamt, 2009. Nachhaltige Chemie. Positionen und Kriterien des Umwelt-bundesamtes. Federal Environment Agency, Dessau; https://www.umweltbundesamt.de/sites/default/files/medien/publikation/long/3734.pdf
4. Reihlen, A., Bunke, D., Groß, R., Jepsen, D., Blum, C., 2016. Guide on sustainable chemicals – a decision tool for substance manufacturers, formulators and end users of chemicals. Umweltbundesamt, Federal Environment Agency, Dessau; https://www.umweltbundesamt.de/publikationen/guide-on-sustainable-chemicals
5. Reihlen, A., Gruhlke, A.; Bunke, Blum, C., 2016. Subselect. Electronic version of the Guide on sustainable chemicals. Umweltbundesamt, Federal Environment Agency, Dessau; https://www.umweltbundesamt.de/search/content/subselect?keys=%20subselect
6. Moritz, S., and Bunke, D., 2014. Pollution of tomorrow. Paper, ID S6.1, August 2014, SOLUT Moritz, S., Bunke, D., Brack, W.; Herráez, D.L., Posthuma, L. 2014. Developments in society and implications for emerging pollutants in the aquatic environment of tomorrow. Öko-Institut, Freiburg, Working paper 1/2017; https://www.oeko.de/fileadmin/oekodoc/WP-Emerging-Pollutants.pdf
7. Bunke, D., Moritz, S. and Think Tank ‘Pollutions of Tomorrow’, 2018. Pollution of

RiBaTox – Full Set of Fact Sheets
252
tomorrow: Options to act on future risks. Recommendations for a successful management of emerging pollutants. Solutions deliverable D6.1 ED061
Keywords
Emerging pollutants, scenarios, developments, prediction, abatement, sustainable chemicals, emission reduction. Pharmaceuticals, veterinary drugs, criteria, assessment
Related topics
Developments in society and the pollutants of tomorrow FS030
Future pollutants: How to predict? FS031
Future pollutants: Which pollutants can we expect? FS032
Future pollutants: How to avoid? FS033
Prioritization strategies FS069.
Contact information
Dirk Bunke ([email protected]) Öko-Institut, Freiburg, Germany

RiBaTox – Full Set of Fact Sheets
253
5 Abatement strategies
5.1 General
FP7 SOLUTIONS project - Fact Sheet 015
Name SOLUTIONS Tool or Service
FS015 Strategy for cost-efficient employment of abatement options
Description
1. Objective
You have reached this Fact Sheet because you consider implementing abatement options to remove micropollutants from water. End-of-pipe measures to remove emerging chemicals from waste water streams are costly. A state-of-the-art modelling based approach has been developed to optimise the return on investment by providing information that allows cost-effective placement of these measures. In particular, the possible sites for implementation are ranked for the expected positive impact on selected ecosystem goods and services (benefits arising from the ecological functions of ecosystems).
2. Methodology
By means of the SOLUTIONS model train (an integrated set of models for basin-wide and European scale assessment of emission, fate and effects of chemicals), it is possible to quantify relevant emission pathways of emerging chemicals (pesticides, pharmaceuticals, food additives, industrial chemicals, etc.). This also allows quantifying the effect of localised abatement measures, such as additional end-of-pipe treatment at sewage treatment plants (STPs). (For further detail see e.g. Technical and non-technical abatement options FS028 and the Tool-box for the evaluation of abatement options FS029. The desired effect of such measures can be expressed as an improved quality of downstream surface water and ground water resources as a source for drinking water production, or as a lower pressure on the aquatic environment. In a broader sense, measures are intended to reduce the chemical footprint (the amount of water in region required to dilute chemical concentrations to levels that do not pose a risk to ecosystems nor to human health (see Footprint reduction FS070) and increase the value of downstream ecosystem goods and services. By developing a way to valorise these goods and services, the costs of installing measures can be weighed against the gain in the value of ecosystem goods and services.
By means of applying the full SOLUTIONS model train, the gain in the value of ecosystem goods and services as a result of the installation of measures at one site can be quantified. By repeating this analysis for all potential sites, a full cost-benefit analysis including an optimisation can be carried out.
The method described above has been tentatively applied to emissions of pharmaceuticals from STPs on a nation-wide scale for the Netherlands. Point source emissions included 345 Dutch STPs and nine trans-boundary rivers. The analysis took into account the protection of water resources for drinking water production and the protection of Natura 2000 nature protection areas.
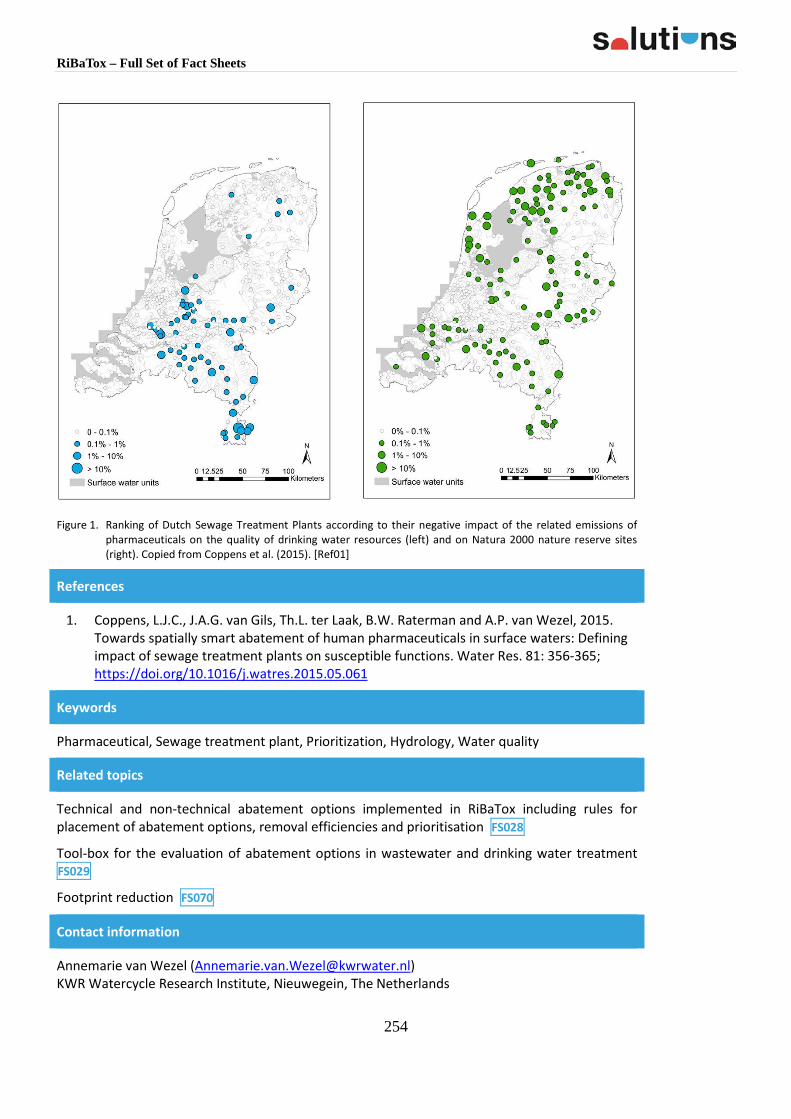
RiBaTox – Full Set of Fact Sheets
254
Figure 1. Ranking of Dutch Sewage Treatment Plants according to their negative impact of the related emissions of pharmaceuticals on the quality of drinking water resources (left) and on Natura 2000 nature reserve sites (right). Copied from Coppens et al. (2015). [Ref01]
References
1. Coppens, L.J.C., J.A.G. van Gils, Th.L. ter Laak, B.W. Raterman and A.P. van Wezel, 2015. Towards spatially smart abatement of human pharmaceuticals in surface waters: Defining impact of sewage treatment plants on susceptible functions. Water Res. 81: 356-365; https://doi.org/10.1016/j.watres.2015.05.061
Keywords
Pharmaceutical, Sewage treatment plant, Prioritization, Hydrology, Water quality
Related topics
Technical and non-technical abatement options implemented in RiBaTox including rules for placement of abatement options, removal efficiencies and prioritisation FS028
Tool-box for the evaluation of abatement options in wastewater and drinking water treatment FS029
Footprint reduction FS070
Contact information
Annemarie van Wezel ([email protected]) KWR Watercycle Research Institute, Nieuwegein, The Netherlands

RiBaTox – Full Set of Fact Sheets
255
Jos van Gils ([email protected]) Deltares, Delft, The Netherlands Juliane Hollender ([email protected]) EAWAG, Dübendorf, Switzerland

RiBaTox – Full Set of Fact Sheets
256
5.2 Abatement strategies
FP7 SOLUTIONS project - Fact Sheet 028
Name SOLUTIONS Tool or Service
FS028 Technical and non-technical abatement options
Description
1. Objective
You have reached this Fact Sheet because you are interested in abatement options to protect the aquatic environment from present and future negative impacts, including rules for placement of abatement options, removal efficiencies and prioritisation.
For the topic of deterioration of water quality by chemicals, lots of research has been performed on problem and risk analysis. However, relatively little attention is paid to mitigation possibilities as compared to other environmental problems such as climate change. Much research and policy attention is currently directed to prioritization of the most problematic chemicals. As in the environment chemicals always occur in mixtures, prioritization of possible (packages of) abatement options might be a better way to trigger innovative approaches by both the scientific community and stakeholders.
Many legislation and abatement plans are developed and implemented per sector. The various sectors involved (agriculture, healthcare, industry, households, water sector) could benefit by cross-sectoral learning, and co-development of a coherent implementation and investment program to improve water quality.
The objective is to provide an overview on technical and non-technical abatement options, including removal efficiencies and physico-chemical properties, general rules for placement of abatement options, to provide estimates of the capacity for environmental improvement and give ingredients for integration of abatement into solutions-oriented risk assessment.
2. Methodology
The tool is based on an ‘intervention database’ (van Wezel et al. 2017) [Ref02], and modelling efforts (Coppens et al., 2015 [Ref01]).
Triggered by a solutions-focused perspective, an overview on possible technological and non-technological abatement options was developed throughout the chemical life cycle to improve water quality. Available abatement options are categorized towards their possibilities within various stages of the chemicals’ life cycle, and their relevance for various stakeholders, sectors and environmental pathways. More technologically oriented abatement options are discerned versus other types of abatement, and the relevance of abatement options discussed on various spatial and temporal scales. The various abatement options are assessed regarding their efficiencies to improve water quality and their potential for implementation. See e.g. the Abatement Module in RiBaTox.
Next, a framework is provided on how to integrate the abatement options into a solutions-focused risk assessment and management framework, in order to generate a comprehensive

RiBaTox – Full Set of Fact Sheets
257
insight in the effects of possible sets of abatement options throughout the chemical’s life cycle, in various sectors and at various places in the water system.
Sewage treatment plants (STPs) are a major point of entry to surface waters. The receiving waters provide vital functions. Modelling the impact of STPs on susceptible functions of the surface water system allows for a spatially smart implementation of abatement options at, or in the service area of, STPs.
3. Application
Early in the chemical life cycle, non-technological abatement options that are relevant on large spatial scales dominate, while later in the life cycle curative technological options relevant at regional scale are the most feasible and effective. While the options early in the cycle are generic, they are more differentiated towards a specific sector and use later in the cycle. An efficient abatement strategy combines options in various stages of the life cycle, and uses both preventive and curative options. A focus on preventive options early in a chemical’s life cycle, may deliver the most long-term and large-scale benefits. In view of the high and growing demand for chemicals by society, it is considered inevitable to use also emission-reduction and curative abatement options later in the chemical’s life cycle, which may create a price stimulus for more preventive options earlier in the chemical life cycle.
Recent developments provide means to valuate effects of alternative packages of abatement options. Improvement of environmental quality by implementing sets of abatement options can be expressed in terms of decreased concentrations, improved ecological quality and chemical footprint or better possibilities to use the water system services. A further operationalization of an ‘intervention database’ which lists and assesses possible interventions per stakeholder, sector and phase in the chemical’s life cycle, and as appropriate the intervention effectiveness, will be needed. By coupling this intervention database geo-specifically to river catchment water quality models, taking into account emissions by households, industry, care sector and agriculture in relation to the systems’ hydrology, alternative sets of abatement strategies can be evaluated.
Various alternative sets of abatement strategies, e.g. where in the chemical life cycle, which sectors, which techniques, where placed in the hydrological system, can be compared with predicted concentrations as background scenario. For the valuation aspects such as costs (including energy, space), timeframe in which effects and costs are expected, support by stakeholders and the general public are of key interest.
A first study was performed on a nation-wide scale for the Netherlands. Point source emissions included were 345 Dutch STPs and nine transboundary rivers. The Dutch surface waters were represented by 2,511 surface water units. Modelling was performed for two extreme discharge conditions. The study revealed that monitoring data of 7 locations along the rivers Rhine and Meuse fall mostly within the range of modelled concentrations. Half of the abstracted volumes of raw water for drinking water production, and a quarter of the Natura 2000 areas are influenced by STPs at low discharge. The vast majority of the total impact of all Dutch STPs during both discharge conditions can be attributed to only 19% of the STPs with regard to the drinking water function, and to 39% of the STPs with regard to the Natura 2000 function. Attributing water treatment technologies to STPs as one of the possible measures to improve water quality and protect susceptible functions can be done in a spatially smart and cost-effective way, using consumption-based detailed hydrological and water quality modelling.

RiBaTox – Full Set of Fact Sheets
258
References
1. Coppens, LJC, van Gils JAG, ter Laak TL, Raterman BW, van Wezel AP, 2015. Towards spatially smart abatement of human pharmaceuticals in surface waters: Defining impact of sewage treatment plants on susceptible functions. Water Res. 81: 356-365; https://doi.org/10.1016/j.watres.2015.05.061
2. Van Wezel AP, Ter Laak TL, Fischer A, Bauerlein PS, Munthe J, Posthuma L., 2017. Mitigation options for chemicals of emerging concern in surface waters; Operationalising solutions-focused risk assessment. Environ. Sci.: Water Res. Technol. 3: 403-414 https://doi.org/10.1039/C7EW00077D
Keywords
technical and non-technical abatement options, removal efficiencies, rules for placement, capacity for environmental improvement, solutions-oriented risk assessment
Related topics
Strategy for cost-efficient placement of abatement options FS015
Tool-box for the evaluation of abatement options in wastewater and drinking water treatment FS029
Footprint reduction FS070
Contact information
Annemarie van Wezel ([email protected]) KWR Watercycle Research Institute, Nieuwegein, The Netherlands

RiBaTox – Full Set of Fact Sheets
259
FP7 SOLUTIONS project - Fact Sheet 029
Name SOLUTIONS Tool or Service
FS029 Tool-box for the evaluation of abatement options in wastewater and drinking water treatment
Description
1. Objective
Technical solutions are needed to address the ecological and human health requirements of the WFD within the water cycle. In many EU member states, treated wastewater represents a major source of emerging compounds in streams and is therefore a major target for mitigation measures. A number of utilities in Switzerland, Germany and the Netherlands, among others, are considering or implementing additional technologies such as advanced oxidation or activated carbon treatment to enhance the removal of emerging compounds in wastewater effluents. In drinking water, such technologies have been implemented since decades, but improved removal of an increasing number of emerging compounds is vital to ensure human health is maintained. While several technologies have been demonstrated as technically successful, it is necessary to evaluate their influence on environmental impacts and on human health risks to justify such enormous investments.
Based on results obtained from pilot wastewater and drinking water treatment plants with different abatement options (e.g. bank filtration, oxidation, reverse osmosis, sorption to activated carbon) a tool-box of targeted (i) chemical and (ii) biological methods for evaluation of abatement options with regard to (a) ecological and (b) human health is proposed.
2. Methodology
The selection of compounds and bioassays for the assessment of abatement options depends very much on the assessment aim which can range from comparison of different treatments regarding elimination efficiency (performance-based assessment) up to a more comprehensive environmental and human health assessment (effect-based assessment); is often a combination. Important boundary conditions are of course also the availability of chemical and biological tools and the involved costs. However, it has to be stated that they are often low in comparison with the costs of mitigation measures such as an upgrade of treatment plants with a novel technology.
An obvious but important prioritization criteria for substance selection in environmental samples is occurrence that depends mostly on the water source (e.g. wastewater or drinking water). To get a comprehensive picture on the elimination efficiencies, a chemical mixture covering a broad range of physical-chemical properties is recommended. In order to observe the performance of certain abatements, specific processes have to be taken into consideration. For sorptive processes such as activated carbon filtration where the breakthrough is critical, polar and ionic compounds should be included. For chemical processes such as ozonation, compounds known as less reactive (e.g. x-ray contrast media or perfluorinated compounds) as well as transformation products and by-products formed with the matrix should be screened. For natural attenuation processes such as elimination during bank filtration, microbial degradation and sorption are crucial. Therefore, compounds with high persistence, polar and anionic compound which do not sorb to organic matter (now often named as PMOCs, Arp et al., 2017 [Ref18]) as well as transformation products should be included. As reference compounds are often not available for transformation products, suspect or non-target screening approaches are important to be included besides the selected compounds (see for methods Deliverable D10.1 [Ref19]).
RiBaTox – Full Set of Fact Sheets
260
A database with empirically determined or modelled abatement efficiencies for a broad range of compounds together with physical properties (e.g. octanol-water partitioning coefficient, dissociation constants, air water partitioning coefficient) and mode of action (MoA, i.e. toxic effects) was implemented, e.g. FS024, FS091.
In connection with an overall evaluation of reduction measures in a certain environment (e.g. diffuse versus point sources in surface water) it can be of interest to learn about the elimination of compounds coming from specific exposure pathways. For this purpose, indicator compounds representing specific exposure pathways can be selected, for example pesticides, which are not used in households, for agricultural run-off, or pharmaceuticals or artificial sweeteners for urban wastewater discharges. Care should be taken as some pesticides are used as biocides and plant protection products at the same time, which can also differ from country to country.
In order to allow an appropriate environmental or human risk assessment, compounds covering different MoA such as photosynthesis inhibition, endocrine activity, genotoxicity have to be selected. For drinking water, compounds representing endpoints with human health concern, such as genotoxicity, mutagenicity, teratogenicity or endocrine disruption are relevant whereas for wastewater and surface water endpoints relevant for environmental health such as photosynthesis inhibition need to be considered.
Finally, to determine compliance with quality standards such as annual average EQS and drinking water standards including provisional drinking water guideline values (pGLVs), compounds for which such quality standards are available and which are expected to occur in the water matrix have to be included. pGLVs have been derived for chemicals in drinking water sources (Baken et al., 2018 [Ref14]).
Analytical methods for the quantitative determination of a broad range of compounds using off-line or on-line solid phase extraction with different sorbent material followed by liquid chromatography coupled to tandem mass spectrometry are available (e.g. Huntscha et al, 2012 [Ref04]; Schymanski et al., 2014 [Ref07]). New methods have been compiled for compounds with low PNECs as well as transformation products in the Deliverable D10.1 of the SOLUTIONSs project [Ref19]. Non-polar compounds can be quantified by gas chromatography coupled to mass spectrometry (e.g. McArdell et al, 2006 [Ref05]; Meinert et al, 2010 [Ref06]). Volatile compounds detectable only by GC-MS are only an issue when oxidative treatment is applied, for example in drinking water production where volatile disinfection by-products such as halogenated aldehydes might be formed and have to be assessed.
Suspect and non-target screening can be very important to characterize the substance pattern along treatment plants including identification of relevant compounds such as transformation products resulting from oxidative processes (Hollender et al., 2017 [Ref16]; Schollée et al., 2018 [Ref15]).
Bioassays for the assessment of environmental and human health were chosen based on the results of an in-depth site assessment within the Solutions project (Altenburger et al., 2014 [Ref01]; Brack et al., 2016 [Ref02] Neale et al., 2017a,b [Ref08], [Ref11]) (Figure 1).
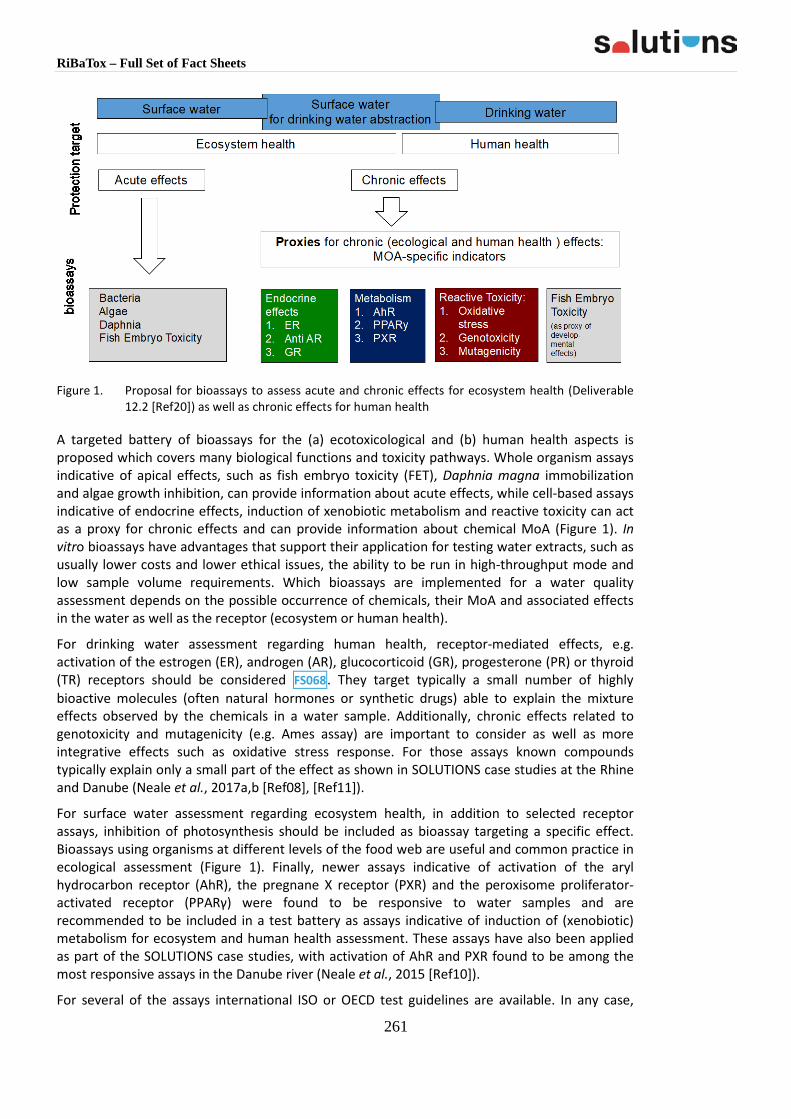
RiBaTox – Full Set of Fact Sheets
261
Figure 1. Proposal for bioassays to assess acute and chronic effects for ecosystem health (Deliverable 12.2 [Ref20]) as well as chronic effects for human health
A targeted battery of bioassays for the (a) ecotoxicological and (b) human health aspects is proposed which covers many biological functions and toxicity pathways. Whole organism assays indicative of apical effects, such as fish embryo toxicity (FET), Daphnia magna immobilization and algae growth inhibition, can provide information about acute effects, while cell-based assays indicative of endocrine effects, induction of xenobiotic metabolism and reactive toxicity can act as a proxy for chronic effects and can provide information about chemical MoA (Figure 1). In vitro bioassays have advantages that support their application for testing water extracts, such as usually lower costs and lower ethical issues, the ability to be run in high-throughput mode and low sample volume requirements. Which bioassays are implemented for a water quality assessment depends on the possible occurrence of chemicals, their MoA and associated effects in the water as well as the receptor (ecosystem or human health).
For drinking water assessment regarding human health, receptor-mediated effects, e.g. activation of the estrogen (ER), androgen (AR), glucocorticoid (GR), progesterone (PR) or thyroid (TR) receptors should be considered FS068. They target typically a small number of highly bioactive molecules (often natural hormones or synthetic drugs) able to explain the mixture effects observed by the chemicals in a water sample. Additionally, chronic effects related to genotoxicity and mutagenicity (e.g. Ames assay) are important to consider as well as more integrative effects such as oxidative stress response. For those assays known compounds typically explain only a small part of the effect as shown in SOLUTIONS case studies at the Rhine and Danube (Neale et al., 2017a,b [Ref08], [Ref11]).
For surface water assessment regarding ecosystem health, in addition to selected receptor assays, inhibition of photosynthesis should be included as bioassay targeting a specific effect. Bioassays using organisms at different levels of the food web are useful and common practice in ecological assessment (Figure 1). Finally, newer assays indicative of activation of the aryl hydrocarbon receptor (AhR), the pregnane X receptor (PXR) and the peroxisome proliferator-activated receptor (PPARγ) were found to be responsive to water samples and are recommended to be included in a test battery as assays indicative of induction of (xenobiotic) metabolism for ecosystem and human health assessment. These assays have also been applied as part of the SOLUTIONS case studies, with activation of AhR and PXR found to be among the most responsive assays in the Danube river (Neale et al., 2015 [Ref10]).
For several of the assays international ISO or OECD test guidelines are available. In any case,

RiBaTox – Full Set of Fact Sheets
262
appropriate enrichment to lay in the sensitivity range of the bioassay (Neale et al., 2018 [Ref17]], appropriate replication, use of positive and negative quality control samples and fixed control criteria, are required to ensure that bioassays yield accurate and consistent results (Escher and Leusch, 2011 [Ref03]).
An additional ecological assessment of abatement options is desirable but challenging as it is difficult to establish a causal relationship between field exposure and observed effects on the impacted ecosystems. Input of chemicals in the environment is usually associated with other stressors such as an increase of temperature or high loads of nutrients and organic matter. These different stressors can interact and thereby limit the power of field studies to investigate specific effects of chemicals. A diagnostic toolbox for ecological effects of pollutant mixtures is compiled in the SOLUTIONS deliverable 13.1 [Ref21]. Within the Rhine case study two approaches were successfully applied, macroinvertebrate biomonitoring as well as pollution-induced community tolerance (PICT) (Munz et al., 2017 [Ref09]; Tlilli et al., 2016 [Ref13]).
3. Application
Experiences on the application of chemical, bioanalytical and ecological tools were gathered in the Rhine case study to assess the micropollutant burden during low flow conditions upstream and downstream of WWTPs discharging into small streams that are tributaries to the Rhine river FS075 (Neale et al., 2017a [Ref08]; Munz et al. 2017 [Ref09]). The toolbox was also applied for the assessment of surface water quality of the river Danube (Neale et al., 2017b [Ref11]).
References
1. Altenburger R., S. Ait-Aissa, P. Antczak, T. Backhaus, D. Barceló, T.-B. Seiler, F. Brion, W. Busch, K. Chipman, M. López de Alda, G. de Aragão Umbuzeiro, B. I. Escher, F. Falciani, M. Faust, A. Focks, K. Hilscherova, J. Hollender, H. Hollert, F. Jäger, A. Jahnke, A. Kortenkamp, M. Krauss, G. F. Lemkine, J. Munthe, S. Neumann, E. L. Schymanski, M. Scrimshaw, H. Segner, J. Slobodnik, F. Smedes, S. Kughathas, I. Teodorovic, A. J. Tindall, K. Erik Tollefsen, K.-H. Walzw, T. D.Williams, P. J. Van den Brink, J. van Gils, B. Vrana, X. Zhang and W. Brack, 2015. Future water quality monitoring — Adapting tools to deal with mixtures of pollutants in water resource management. Sci. Tot. Environ. 512–513: 540–551; https://doi.org/10.1016/j.scitotenv.2014.12.057
2. Brack W., S. Ait-Aissa, R. M. Burgess, N. Creusot, C. Di Paolo, B. I. Escher, L. M. Hewitt, K. Hilscherova, J. Hollender, H. Hollert, W. Jonker, J. Kool, M. Lamoree, M. Musch.ket, S. Neumann, P. Rostkowski, C. Ruttkies, J. Schollee, E. L. Schymanski, T. Schulze, T.-B. Seiler, A. J. Tindall, G. De Aragão Umbuzeiro, B. Vrana and M. Krauss, 2016. Effect-directed analysis supporting monitoring of aquatic environments - An in-depth overview. Sci. Tot. Environ. 544: 1073–1118; https://doi.org/10.1016/j.scitotenv.2015.11.102
3. Escher, B. and F. Leusch. 2011. Bioanalytical tools in water quality assessment. IWA Publishing, London, pp.272; https://www.iwapublishing.com/books/9781843393689/bioanalytical-tools-water-quality-assessment
4. Huntscha, S., H.P. Singer, C. S. McArdell, C. E. Frank and J. Hollender, 2012. Multiresidue analysis of 88 polar organic micropollutants in ground, surface and wastewater using online mixed-bed multilayer solid phase extraction coupled to high performance liquid chromatography-tandem mass spectrometry, J. Chromatogr. A 1268: 74-83; https://doi.org/10.1016/j.chroma.2012.10.032
5. McArdell, C.S., Alder A.C., Göbel A., Löffler D., Suter M.J.-F. and Ternes T.A., 2006. Analytical methods in human pharmaceuticals, hormones and fragrances. In: The

RiBaTox – Full Set of Fact Sheets
263
challenge of micropollutants in urban water management, T.A. Ternes and A. Joss (Eds). IWA Publishing, London, pp. 55-105; https://www.iwapublishing.com/books/9781843390930/human-pharmaceuticals-hormones-and-fragrances
6. Meinert, C., E.L. Schymanski, E. Küster, R. Kühne, G. Schüürmann and W. Brack, 2010. Application of preparative capillary gas chromatography (pcGC), automated structure generation and mutagenicity prediction to improve effect-directed analysis of genotoxicants in a contaminated groundwater. Environ. Sci. Pollut. R. 17(4): 885-897; https://doi.org/10.1007/s11356-009-0286-2
7. Schymanski, E.L., H.P. Singer, P. Longrée., M. Loos, M. Ruff, M.A. Stravs, C. Ripollés Vidal and J. Hollender, 2014. Strategies to characterize polar organic contamination in wastewater: Exploring the capability of high resolution mass spectrometry. Environ. Sci. Technol. 48: 1811–1818; https://doi.org/10.1021/es4044374
8. Neale, P. A., N. A. Munz, S. Ait-Aissa, R. Altenburger, F. Brion, W. Busch, B.I. Escher, K. Hilscherova, C. Kienle, J. Novak, T.B. Seiler, Y. Shao, C. Stamm, J. Hollender, 2017a. Integrating chemical analysis and bioanalysis to evaluate the contribution of wastewater effluent on the micropollutant burden in small streams. Sci. Tot. Environ. 576: 785-795; https://doi.org/10.1016/j.scitotenv.2016.10.141
9. Munz N.A., F.J. Burdon, D. de Zwart, M. Junghans, L. Melo, M. Reyes, U. Schönenberger, H. Singer, B. Spycher, J. Hollender and C. Stamm, 2017. Pesticides drive risk of micro-pollutants in wastewater-impacted streams during low flow conditions. Water Res. 110: 366-377; https://doi.org/10.1016/j.watres.2016.11.001
10. Neale, P.A., Ait-Aissa, S., Brack, W., Creusot, N., Denison, M.S., Deutschmann, B., Hilscherova, K., Hollert, H., Krauss, M., Novak, J., Schulze, T., Seiler, T.B., Serra, H., Shao, Y. and Escher, B.I., 2015. Linking in vitro effects and detected organic micropollutants in surface water using mixture-toxicity modeling. Environ. Sci. Technol: 49(24): 14614-14624; https://doi.org/10.1021/acs.est.5b04083
11. Neale, P.A., Altenburger, R., Aït-Aïssa, S., Brion, F., Busch, W., de Aragão Umbuzeiro, G., Denison, M.S., Du Pasquier, D., Hilscherová, K., Hollert, H., Morales, D.A., Novák, J., Schlichting, R., Seiler, T.-B., Serra, H., Shao, Y., Tindall, A.J., Tollefsen, K.E., Williams, T.D. and Escher, B.I., 2017b. Development of a bioanalytical test battery for water quality monitoring: Fingerprinting identified micropollutants and their contribution to effects in surface water. Water Res.: 123: 734-750; https://doi.org/10.1016/j.watres.2017.07.016
12. Reemtsma, T., Berger, U., Arp, H.P.H., Gallard, H., Knepper, T.P., Neumann, M., Qiuntana, J.B. and de Voogt, P., 2016. Mind the gap: Persistent and mobile organic compounds - water contaminants that slip through. Environ. Sci. Technol. 50: 10308-10315; https://doi.org/10.1021/acs.est.6b03338
13. Tlili, A.; J. Hollender, C. Kienle and R. Behra, 2017. Micropollutant-induced tolerance of in situ periphyton: Establishing causality in wastewater-impacted streams. Water Res. 111: 185-194; https://doi.org/10.1016/j.watres.2017.01.016
14. Baken, K.A., R.M.A. Sjerps, M. Schriks and A.P. van Wezel, 2018. Toxicological relevance and Threshold of Toxicological Concern (TTC) for drinking water relevant contaminants of emerging concern. Environ. Int. 118: 293–303; https://doi.org/10.1016/j.envint.2018.05.006
15. Schollée, J.E., M. Bourgin, U. von Gunten, C.S. McArdell and J. Hollender, 2018. Charac-terizing non-target peaks across a wastewater treatment train including ozonation and post-treatment. Water Res. 142: 267-278; https://doi.org/10.1016/j.watres.2018.05.045
16. Hollender, J., E.L. Schymanski, H. Singer and P.L. Ferguson. 2017. Non-target screening with high resolution mass spectrometry in the environment: Ready to go? Environ. Sci.

RiBaTox – Full Set of Fact Sheets
264
Technol. 51: 11505–11512; https://doi.org/10.1021/acs.est.7b02184 17. Neale P.A., W. Brack, S. Aїt-Aїssa, W. Busch, J. Hollender, M. Krauss, E. Maillot-Maréchal,
N.A. Munz, R. Schlichting, T. Schulze, B. Vogler and B.I. Escher, 2018. Solid-phase extraction as sample preparation of water samples for cell-based and other in vitro bioassays, Environ. Sci.: Processes Impacts 20: 493-504; https://doi.org/10.1039/C7EM00555E
18. Arp, H.P.H., Brown, T.N., Berger, U. and Hale S.E., 2017. Ranking REACH registered neutral, ionizable and ionic organic chemicals based on their aquatic persistency and mobility. Environ. Sci. Process Impacts, 19(7): 939-955; https://doi.org/10.1039/c7em00158d
19. Zonja, B., C. Postigo, J.C. Guillen Asensio, E. López García, S. Monllor Alcaraz and M. López de Alda, 2017. Guidelines for target and non-target analysis of emerging contaminants in water and biota. SOLUTIONS Deliverable D10.1 ED101
20. Escher, B. and P. Neale, 2018. Feasibility assessment of extract-bioassay approaches for environmental monitoring. SOLUTIONS Deliverable D12.2.
21. Backhaus T, Segner H, Hollert H, Deutschmann B, Van den Brink P, Seiler T, Teodorovic I, and Focks A., 2017. Diagnostic toolbox for ecological effects of pollutant mixtures, including bio-tests, trait-based database and detection tool and WoE studies at hot-spot sites. SOLUTIONS Deliverable D13.1.
Keywords
Abatement, water treatment, chemical and biological assessment, bioassay, chemical analysis
Related topics
Strategy for cost-efficient placement of abatement options FS015 Technical and non-technical abatement options implemented in RiBaTox including rules for placement of abatement options, removal efficiencies and prioritisation FS028 Footprint reduction FS070
Contact information
Juliane Hollender ([email protected]) Eawag, Swiss Federal Institute of Aquatic Science and Technology, Dübendorf, Switzerland

RiBaTox – Full Set of Fact Sheets
265
FP7 SOLUTIONS project - Fact Sheet 070
Name SOLUTIONS Tool or Service
FS070 Footprint reduction
Description
1. Objective
You have reached this Fact Sheet because you want to express the results of the risk assessment for an area – representing a suite of water bodies – in a single value (a chemical footprint), by which you can analyse trends. For example temporal trends, whereby the chemical footprint becomes smaller due to effective management, or spatial trends. In the latter case, you can evaluate and rank the upstream (eco)toxicity contributions to a local water body, such as to identify which management effort to prioritized upstream sources would imply the largest footprint reduction. The analysis of chemical footprint trends can help you to:
1. Show and analyse the success of past river basin management efforts geared towards reducing risk (expected: chemical footprint reduction),
2. Explore and predict the effect of expected future emissions and/or future abatement strategies on net chemical risks,
3. Rank upstream contributions to the footprint of a water body, in order to prioritize management actions,
4. Explore downstream ‘export’ of (eco)toxicity to elsewhere, including the marine compartment, as net ‘receptor’ of (eco)toxic loads from rivers.
The use of a single-value metric (the footprint) helps summarizing and communicating complex data. The chemical footprint metric applies to results of ecological risk assessments, when those are expressed as mixture toxic pressures (msPAF) FS037, or to those of results of drinking water quality FS027. The communication of a simple increasing or reducing value (footprint) to stakeholders and regulatory agencies is a powerful means of summarizing complex information in an easy-to-understand metric, as illustrated in the graphical scheme below (Figure 1: left: before emission reduction, right: after emission reduction, with management focusing on all emission types occurring in an area). Mapping of Chemical Footprint results can provide insights in (a) Chemical Footprint magnitude of water bodies (‘likelihood of local impacts’), (b) contributions to the local footprint from upstream sources, and (c) contributions to downstream pollution from a local water body.
Figure 1. Graphical representation of the ‘chemical Footprint’ as a result of (e.g. abatement) actions to reduce pollution entering the (aquatic) environment

RiBaTox – Full Set of Fact Sheets
266
A chemical footprint summarizes the volume of water needed to dilute the emissions made in a selected area to a safe level, distinguishing safety for drinking water and safety for aquatic life. The safe level can be operationalized from generic, protection-oriented regulatory principles or by boundaries derived from knowledge of the vulnerability of natural ecosystems. A chemical footprint ratio can be derived, by calculating the ratio of required over available water volume for a region of interest, such that values exceeding 1 can be interpreted as insufficiently protected according to the regulatory standards used, or as impacted above the impact boundary derived for those systems.
2. Methodology The methodology needed to derive a chemical footprint consists of four elements, for a study area in which various water bodies (rivers, lakes, etc.) are delineated in four elements:
• The first is the quantification of the likelihood that a mixture poses harm, which is expressed e.g. for ecosystems as the mixture toxic pressure via which the expected impact of the chemicals in each of the separate elements of the water system can be quantified..
• The second is the quantification of the volume of water for each of the elements of the water system.
• The third is the selection of a boundary condition, which can be based on regulatory principles operationalized towards assessing mixture impacts, or a boundary condition defined by assessing vulnerability of natural systems.
• The fourth element combines all information, and aggregates the mixture toxic pressure data of all elements in the water system with the volumes of the elements, while judging (non)safety via the boundary condition definition.
The approach is illustrated in Zijp et al. (2014) [Ref02] for two examples regarding the likelihood of effects on ecosystems, both starting from emission data. The use of chemical footprints requires defining a boundary condition. The obvious and operational approach to this end, is to operationalize the regulatory protection endpoint in terms of a boundary for mixture exposures. This is a relatively simple approach, whereby the regulatory goal of ‘protecting the structural and functional integrity of ecosystems’ against the potential for adverse effects of a chemical has been operationalized as – amongst others – a concentration at which less than 5% of the species would be exposed beyond their NOEC (no observed effect concentration). For drinking water the boundary condition is defined per chemical as the regulatory maximum allowable concentration. For ecosystems, this criterion links closely to one of the methods (per chemical) of the model train of SOLUTIONS FS016. In this case, the criterion condition or boundary simply translates into utilizing the same operationalisation of the protection endpoint, but apply it to a mixture. This is fully logical and consistent, as the protection target remains unchanged for single chemicals or mixtures. In practice, the predicted mixture toxic pressure is judged against the protective boundary condition operationalised as msPAFNOEC,max=0.05 (maximum 5% of the species exposed beyond their no-effect level for mixture exposures). A novel approach to define natural boundaries, which accounts for the natural phenomenon that some species assemblages are more vulnerable to stressors than others due to their species composition, was recently proposed. This method is based on statistical- ecological analysis of large monitoring data sets, and was published by Zijp et al. (2017) [Ref03]. This method is not yet operational for the European level application, as the derivation of European boundaries requires additional efforts to derive European Ecosystem Vulnerability Distributions.
3. Application
(Environmental) chemical footprints are utilized when a risk assessment for an area is made, to

RiBaTox – Full Set of Fact Sheets
267
express whether the appointed degree of protection is realized (on average) for the assemblage of elements of the water system in the area, or to express changes therein due to past or planned management investments. The value and the change of the chemical footprint summarizes both whether ‘(eco)toxicity’ is ‘exported’ to situations outside the studied area (the ratio of the required- over the available water volume to remain safe is > 1), and/or whether there are times trends related to changes in the use and emissions of chemicals (see Pollutants of tomorrow) FS030 or following from the implementation of abatement strategies (see Abatement) FS015. An example of the chemical footprint for a large area (Europe) resulting from concurrent rates of emitted chemicals in Europe is reported in Zijp et al. (2014) [Ref02], and concerns industrial chemical production and emissions. Another example case study in this publication showed the change of a chemical footprint in relation to policies aimed at safe and sustainable use of chemicals, and concerns plant protection products use in the Rhine-Meuse-Scheldt sub-catchment. An example of an assessment of efficacy of optional abatement strategies in reducing the chemical footprint of an area is studied in a scenario-based approach by Posthuma et al. (2018) [Ref01]. That study showed, that the reduction of the size of the chemical footprint is not linearly related to the reduction or change of the emissions of chemicals. This then is related to non-linearity of many relationships encompassed in the SOLUTIONS model train (see Model train) FS016. The SOLUTIONS model train has resulted in refined Chemical Footprint assessments, such that they are now available for the likelihood that pollutant mixtures cause harm to ecosystems or to human health (via drinking water). Examples of the various options to apply the Chemical Footprint approach are shown in Figure 2.
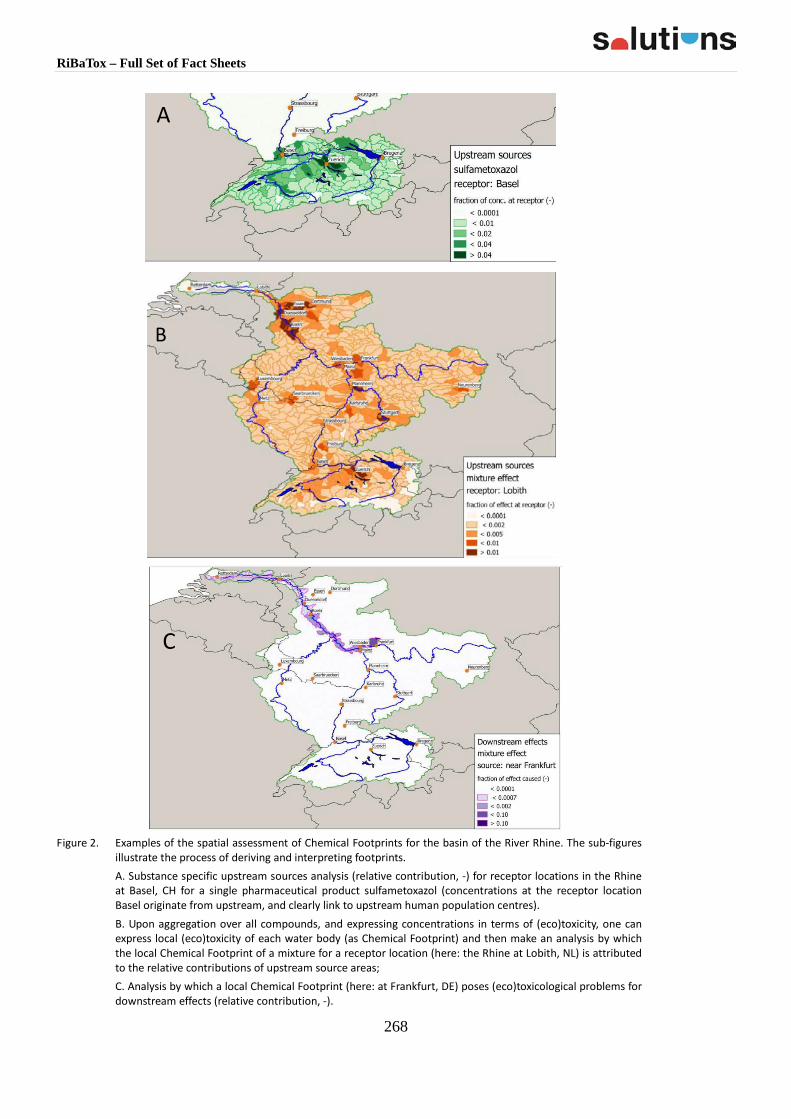
RiBaTox – Full Set of Fact Sheets
268
Figure 2. Examples of the spatial assessment of Chemical Footprints for the basin of the River Rhine. The sub-figures
illustrate the process of deriving and interpreting footprints. A. Substance specific upstream sources analysis (relative contribution, -) for receptor locations in the Rhine
at Basel, CH for a single pharmaceutical product sulfametoxazol (concentrations at the receptor location Basel originate from upstream, and clearly link to upstream human population centres).
B. Upon aggregation over all compounds, and expressing concentrations in terms of (eco)toxicity, one can express local (eco)toxicity of each water body (as Chemical Footprint) and then make an analysis by which the local Chemical Footprint of a mixture for a receptor location (here: the Rhine at Lobith, NL) is attributed to the relative contributions of upstream source areas;
C. Analysis by which a local Chemical Footprint (here: at Frankfurt, DE) poses (eco)toxicological problems for downstream effects (relative contribution, -).
A
B
C

RiBaTox – Full Set of Fact Sheets
269
References
1. Posthuma, L., Brown, C., De Zwart, D., Diamond, J., Dyer, S.D., Holmes, C.M., Marshall, S. and Burton, G.A., 2018. Prospective mixture risk assessment and management prioritizations for river catchments with diverse land uses. Environ. Toxicol. Chem. 37(3): 715-728; https://doi.org/10.1002/etc.3960
2. Zijp, M.C., Posthuma, L. and Van de Meent, D., 2014. Definition and applications of a versatile chemical pollution footprint methodology. Environ. Sci. Technol. 48: 10588−10597; https://doi.org/10.1021/es500629f
3. Zijp, M.C., Huijbregts, M.A.J., Schipper, A.M., Mulder, C. and Posthuma, L., 2017. Identification and ranking of environmental threats with ecosystem vulnerability distributions. Scientific Reports 7: 9298; https://doi.org/10.1038/s41598-017-09573-8
Keywords
Chemical footprint
Related topics
From emissions to effects: Model Train for SOLUTIONS FS016 Strategy for cost-efficient placement of abatement options FS015 Developments in society and the pollutants of tomorrow FS030
Contact information
Leo Posthuma ([email protected]) Michiel Zijp ([email protected]) RIVM - Centre for Sustainability, Environment and Health, Bilthoven, The Netherlands
RiBaTox – Full Set of Fact Sheets
270
6 Policy strategies
6.1 General
FP7 SOLUTIONS project - Fact Sheet 071
Name SOLUTIONS Tool or Service
FS071 Policy strategies for a safe and efficient regulation of chemicals
Description
1. Objective
You have reached this Fact Sheet because you are interested in policy strategies for a safe and efficient regulation in the fields of chemicals of relevance for the implementation of the EU Water Framework Directive (WFD) [Ref01]. In total, 19 regulatory frameworks have been included in this study. The selected set of regulatory frameworks is not exhaustive i.e. other existing regulatory frameworks can contribute to improved future implementation of the WFD.
Over the last decades a number of regulatory frameworks which aim to reduce risks and impacts of chemicals to both human health and the environment, have been developed and implemented. These frameworks have different and sometimes overlapping scopes (chemicals (as such or in mixtures) in articles, emissions or concentration levels in the environment) and geographical scales (local, regional and global). The number of chemicals regulated per framework spans from only a few to thousands of substances. These regulated chemicals constitute an important fraction of the total number of chemicals present in society and in the environment [Ref02].
The procedures to identify which chemicals need to be restricted differ between different legislative frameworks. Common principles include that they are based on utilising knowledge on their potential ecological or human health hazards. That the assessment is performed most often on single substances and that the final step is a combination of expected exposure and effects insights. Political or administrative processes where other priorities (e.g. socio economic or technical issues) may have an influence as well [Ref03].
Providing regulatory support for chemicals management is one of four key topics within the SOLUTIONS conceptual framework. The framework is intended to support development and use of optimised legal and policy instruments in the field of chemicals. The overall aim is primarily to evaluate current regulatory contexts and to provide guidance on existing and possible future policy frameworks to stakeholders [Ref03].
Effective and transparent regulation of chemicals is necessary both to protect human health and the environment, and to achieve the overarching goal of an environmentally sound management and safe use of chemicals. Benefits can be gained from interactions between existing chemicals legislations, especially with regards to adding substances, information on properties of chemicals and requirements for environmental reporting [Ref02].
2. Methodology Information on existing regulatory frameworks (EU Regulations and Directives and Multilateral Environmental Agreements) have been compiled, compared and evaluated. Focus has been on regulatory frameworks that: • cover substances that can cause negative impacts in the aquatic environment,

RiBaTox – Full Set of Fact Sheets
271
• are complementary to the WFD and could lead to improved implementation of the WFD, and • focusing on European or global scale.
The Policy framework database FS022 provides you with search functions for chemicals that are listed in a selection of regulatory frameworks in the fields of chemicals of relevance for the implementation of WFD. Furthermore the database includes brief facts about the selected regulatory frameworks.
The tool Recommendations for future policy possibilities FS072 provides you with an overview of existing regulatory frameworks for chemicals as well as some general recommendations on how regulatory actions can be improved to provide an increased protection of environment and human health from chemicals. These recommendations could constitute the first steps towards a more holistic and efficient legislation of chemicals.
References
1. European Commission, 2000. Directive 2000/60/EC of the European Parliament and of the Council of 23 October 2000 establishing a framework for Community action in the field of water policy. Off. J. Eur. Comm. L 327: 1-72; http://eur-lex.europa.eu/legal-content/EN/TXT/?uri=CELEX:32000L0060
2. Lexén, J., Skårman, T., Rahmberg, M., Brorström-Lundén, E., Westberg, E., Munthe, J., 2017. Policy recommendations for maximum synergies between policy frameworks. Solutions deliverable D7.1 ED071
3. Munthe, J., Brorström-Lundén, E., Rahmberg, M. Posthuma, L., Altenburger, R., Brack, W., Bunke, D., Engelen, G., Gawlik, B.M., van Gils, J., López Herráez, D., Rydberg, T., Slobodnik, J., van Wezel, A., 2017. An expanded conceptual framework for solution-focused management of chemical pollution in European waters. Environ. Sci. Eur. 29: 13. https://doi.org/10.1186/s12302-017-0112-2
Keywords
Chemicals, Regulatory frameworks, Policy, EU Regulations, EU Directives, Multilateral Environmental Agreements, Database, WFD
Related topics
Policy framework database FS022
Recommendations - future policy possibilities FS072
Contact information
John Munthe ([email protected])
IVL Swedish Environmental Research Institute, Stockholm, Sweden

RiBaTox – Full Set of Fact Sheets
272
6.2 Policy strategies
FP7 SOLUTIONS project - Fact Sheet 022
Name SOLUTIONS Tool or Service
FS022 Policy framework database
Description
1. Objective
You have reached this Fact Sheet because you want to learn more about a selected set of regulatory frameworks (EU Regulations, EU Directives and Multilateral Environmental Agreements) in the field of chemicals. In Fact Sheet FS071 Policy strategies for a safe and efficient regulation of chemicals are presented.
The Policy framework database provides you with a search function for chemicals that are listed in a selection of 19 regulatory frameworks in the fields of chemicals of relevance for the implementation of the EU Water Framework Directive (WFD) [Ref01]. Furthermore the database includes brief facts about the selected regulatory frameworks [Ref02].
2. Methodology
The chemicals that are regulated under the different regulatory frameworks were compiled in a SQL database together with brief fact sheets of the corresponding regulatory mechanism.
An overview of the system architecture is shown in
Figure 1: System architecture

RiBaTox – Full Set of Fact Sheets
273
3. Application
The Policy framework database is a tool that provides you with a search function for chemicals that are listed in a selection of regulatory frameworks in the fields of chemicals of relevance for the implementation of the WFD. You can search in the database based on compound name, CAS number or EC number for all chemicals listed in a selected set of regulatory frameworks [Ref02]. For each regulatory framework a brief description of the legislation can be downloaded from the site when viewing the search result.
The database is accessible at http://apps.ivl.se/solutions and via www.solutions-project.eu.
For further information about the regulatory frameworks please see Fact Sheet FS072.
References
1. European Commission, 2000. Directive 2000/60/EC of the European Parliament and of the Council of 23 October 2000 establishing a framework for Community action in the field of water policy. Off. J. Eur. Comm. L 327: 1-72; http://eur-lex.europa.eu/legal-content/EN/TXT/?uri=CELEX:32000L0060
2. Lexén, J., Skårman, T., Rahmberg, M., Brorström-Lundén, E., Westberg, E. and Munthe, J., 2017. Policy recommendations for maximum synergies between policy frameworks. SOLUTIONS Deliverable D7.1 ED071.
Keywords
Database, web application, chemicals, legislation, policies, EU Regulations, EU Directives, Multilateral Environmental Agreements, WFD
Related topics
Policy strategies for a safe and efficient regulation of chemicals FS071 Recommendations - future policy possibilities FS072
Contact information
Magnus Rahmberg ([email protected]) IVL Swedish Environmental Research Institute, Stockholm, Sweden

RiBaTox – Full Set of Fact Sheets
274
FP7 SOLUTIONS project - Fact Sheet 072
Name SOLUTIONS Tool or Service
FS072 Recommendations – future policy possibilities
Description
1. Objective
You have reached this Fact Sheet because you are interested in existing regulatory frameworks for chemicals and how regulatory actions can be improved to provide an increased protection of environment and human health from chemicals. In Fact Sheet FS071 Policy strategies for a safe and efficient regulation of chemicals of relevance for the implementation of the EU Water Framework Directive (WFD) [Ref01] are presented.
The large number and varying scope of regulatory frameworks for chemicals makes the discussion of general proposals for harmonisation and improvements complex. At the same time, the potential for improvement and development of a more coherent and efficient regulatory framework is large. Effective and transparent regulation of chemicals is necessary both to protect human health and the environment, and to achieve the overarching goal of an environmentally sound management and safe use of chemicals. Benefits can be gained from interactions between existing chemicals legislations, especially with regards to adding substances, information on properties of chemicals and requirements for environmental reporting [Ref02].
This tool provides a brief overview of 19 existing regulatory frameworks for chemicals and it gives some general recommendations on how regulatory actions can be improved to provide an increased protection of environment and human health from chemicals. These recommendations could constitute the first steps towards a more holistic and efficient legislation.
2. Methodology
Information on a selected set of 19 existing regulatory frameworks (EU Regulations and Directives and Multilateral Environmental Agreements) in the chemicals field has been compiled. The compilation has been performed as a literature survey and the information has mainly been obtained from the web sites of the issuers and from the legal documents. The overview has been used as a basis for a structured discussion of gaps and identification of some recommendations for actions to improve these regulatory frameworks.
The procedure for selection of regulatory frameworks has been based on the following criteria: 1) cover substances that can cause negative impacts in the aquatic environment, 2) are complementary to the WFD and could lead to improved implementation of the WFD, and 3) focusing on European or global scale.
In a wider perspective, the assessment of these regulatory frameworks can also contribute to the future development of guidelines for a safe sustainable use of chemicals. The selected set of regulatory frameworks is not exhaustive; also other existing regulatory frameworks can contribute to improved future implementation of the WFD.
3. Application
The tool Recommendations for future policy possibilities provides you with an overview of 19 selected regulatory frameworks for chemicals as well as some general recommendations on how regulatory actions can be improved to provide an increased protection of environment and human

RiBaTox – Full Set of Fact Sheets
275
health from chemicals.
The overview of the selected regulatory frameworks includes the following elements: 1. Objectives of the regulatory frameworks 2. Receiving environmental media 3. Life cycle stages 4. Strictly regulated substances 5. Geographical coverage 6. Regulatory mechanisms including:
a. Regulation of substances b. Procedures for inclusion of additional substances c. Exchange of information
Information on the different regulatory frameworks and regulated substances can also be found in the form of a database accessible at http://apps.ivl.se/solutions and via www.solutions-project.eu. For further information on this database please consult Fact Sheet FS022.
References
1. European Commission, 2000. Directive 2000/60/EC of the European Parliament and of the Council of 23 October 2000 establishing a framework for Community action in the field of water policy. Off. J. Eur. Comm. L 327: 1-72; http://eur-lex.europa.eu/legal-content/EN/TXT/?uri=CELEX:32000L0060
2. Lexén, J., Skårman, T., Rahmberg, M., Brorström-Lundén, E., Westberg, E. and Munthe, J., 2017. Policy recommendations for maximum synergies between policy frameworks. Solutions deliverable D7.1 ED071.
Keywords
Chemicals, Regulatory frameworks, policy, EU Regulations, EU Directives, Multilateral Environmental Agreements, WFD
Related topics
Policy strategies for a safe and efficient regulation of chemicals FS071
Policy framework database FS022
Contact information
Tina Skårman ([email protected])
IVL Swedish Environmental Research Institute, Stockholm, Sweden

RiBaTox – Full Set of Fact Sheets
276
7 Cases studies
7.1 Danube river basin
FP7 SOLUTIONS project - Fact Sheet 042
Name SOLUTIONS Tool or Service
FS042 Joint Danube Survey 3 (JDS3)
Description
1. Objective
You have reached this Fact Sheet because you would like to benefit from the experience gathered during the biggest river monitoring expedition of the world, executed in the 2,860 km long Danube river [Ref01]. You may want to use the collected experimental data e.g. for the validation of your models, tools and/or to have information about the overall quality of the Danube river.
The general objective of the Joint Danube Survey 3 (JDS3) was to undertake an international longitudinal survey to produce comparable and reliable information on water quality for the whole of the length of the Danube river, including its major tributaries, within a short period of time [Ref02].
From the long list of JDS3 specific objectives, several focused on the hydro-biological status of the Danube, such as the harmonization of sampling methods for EU water Framework Directive (EC, 2000/60; WFD) [Ref03], improvement of the hydro-morphological assessment with the view of developing a harmonized approach for the Danube. Further, support to future inter-calibration exercises in the Danube River Basin District, interlinking hydro-morphology and biology (habitat quality), as well as chemistry, biology and microbiology. Specific investigations on zooplankton, microbiology, radiology and ecotoxicology (bioassays) were carried out.
In order to assess the overall ecological quality status of the Danube river, studies were conducted on Biological Quality Elements, used within the framework of the WFD to assess the ecological water quality. They consisted of benthic macroinvertebrates in diverse habitats, benthic algae (periphyton and phytobenthos) biomass and populations, macrophytes taxonomy, phytoplankton biomass, the composition, structure and age of fish fauna and the pressure caused by the presence of non-native aquatic species (Invasive Alien Species, IAS).
2. Methodology
The JDS3 monitoring activity focused on providing the necessary basis for the formulation of a harmonized water quality assessment throughout the whole basin via the overview of water quality trends and the loads of substances discharged into the Black Sea. It fostered achieving the compatibility between water quality assessment approaches in the Danube countries.
Specialists from the Danube countries took part in the survey and they worked in close cooperation with a large number of national experts making this way JDS3 a good opportunity for harmonization of monitoring methods throughout the basin as well as for testing new sampling and analytical methods.

RiBaTox – Full Set of Fact Sheets
277
3. Application
The results of the survey on the different parameters are available in distinct datasets, and in the form of descriptive analytical reports as part of the JDS3 Final Report [Ref02], [Ref04].
The valuable complex JDS3 datasets may be used in large-scale complex studies, validation of modelling tools and different analytical exercises e.g. river basin- and/or EU-scale prioritization emerging contaminants.
References
1. Website of the International Commission for the Protection of the Danube River (ICPDR): https://www.icpdr.org/main/
2. Liska, I., F. Wagner, M. Sengl, K. Deutsch, and J. Slobodník (Eds.), 2015. Joint Danube Survey 3 - A comprehensive analysis of Danube Water Quality. ICPDR - International Commission for the Protection of the Danube River, Vienna, pp.369; http://www.danubesurvey.org/results
3. European Commission, 2000. Directive 2000/60/EC of the European Parliament and of the Council of 23 October 2000 establishing a framework for Community action in the field of water policy. Off. J. Eur. Comm. L 327: 1-72; http://eur-lex.europa.eu/legal-content/EN/TXT/?uri=CELEX:32000L0060
4. JDS3 Final Report - https://www.icpdr.org/main/activities-projects/jds3
Keywords
Joint Danube Survey 3, JDS3, WFD, monitoring data, hydrobiology, ecological quality status, Biological Quality Elements
Related topics
SOLUTION Monitoring database of physico-chemical, chemical and ecotoxicological monitoring data FS043
Monitoring WWTPs FS092
Contact information
Jaroslav Slobodnik ([email protected])
Environmental Institute, Kos, Slovak Republic

RiBaTox – Full Set of Fact Sheets
278
FP7 SOLUTIONS project - Fact Sheet 043
Name SOLUTIONS Tool or Service
FS043 SOLUTIONS Database of physico-chemical, chemical and ecotoxicological monitoring data
Description
1. Objective
You have reached this Fact Sheet because you would like to access European environmental monitoring data for the aquatic environment of reliable quality.
In order to obtain answers to urgent questions of assessment, prioritisation and abatement, a toxicant knowledge base, compiling the required information on all emerging pollutants, together with spatial and ecological status related information, is required.
In support of the Integrated Platform for Chemical Monitoring data (IPCheM) as suggested by the EC for the generation, collection, storage and use of data on environmental chemicals in relation to humans and the environment, the Integrated Data Portal for SOLUTIONS (IDPS) FS024 has been implemented to help e.g. identify links between exposure and epidemiological data, to explore potential biological effects, to assess potential risks of chemicals to the (aquatic) environment and man.
The IDPS portal is designed as information system, interacting with the single data modules of SOLUTIONS (e.g. monitoring case studies, scenario data, chemicals use and emissions data) in alignment with the requirements stemming from IPCheM and in compliance with the framework of the INSPIRE Directive.
The SOLUTIONS Monitoring Database, as part of the IDPS portal, collects all the physico-chemical, chemical and ecotoxicological monitoring data available from the case studies of the SOLUTIONS project, and additional monitoring data from (other) case study regions.
2. Methodology
The data compiled in the SOLUTIONS Monitoring Database is accompanied by an appropriate statement on data quality for each entry. It follows the integrated data collection – management - assessment approach supported by adequate and comprehensive metadata that assure data reliability and traceability. The approach was developed within the frame of the EC funded NORMAN project, and has since been in function in an internationally appreciated way in the NORMAN EMPODAT database of environmental monitoring data on emerging substances.
The application of this approach provides a common data quality assessment framework to the SOLUTIONS Monitoring Database which takes into consideration the various application of the same information, as required by the IDPS structure.
3. Application
The database contains all the chemical monitoring data collected within the frame of the Joint Danube Survey 3 FS042, one of the case studies of the SOLUTIONS project.
Additional chemical monitoring data from Danube region are entered: results of the previous Danube surveys - Joint Danube Survey 1 (JDS1) and Joint Danube Survey 2 (JDS2), data from the EC-funded SCARCE project and further monitoring data on emerging substances from the

RiBaTox – Full Set of Fact Sheets
279
NORMAN EMPODAT database [Ref01]. Ecotoxicological monitoring data, such as the results of the EDA-EMERGE project will be collated as well.
The Database can be accessed via http://www.normandata.eu/solutions/
With its significant data content, this database will be a unique source of monitoring data to provide an overview of the presence and concentration levels of a long list of substances of emerging concern, and serve modellers with data for e.g. advanced exposure and risk modelling.
References
1. www.normandata.eu 2. SOLUTIONS Knowledge Base: http://www.normandata.eu/solutions/ 3. Databases: http://www.normandata.eu/solutions/norman.php 4. Environmental Monitoring – Physico-chemical and chemical database:
http://www.normandata.eu/solutions/chemicalSearch.php
Keywords
Monitoring data, chemical data, ecotoxicology, metadata, data quality, quality assessment framework
Related topics
Integrated Data Portal for SOLUTIONS FS024
Joint Danube Survey 3 FS042
Monitoring WWTPs FS092
Contact information
Jaroslav Slobodnik ([email protected]) Environmental Institute, Kos, Slovak Republic

RiBaTox – Full Set of Fact Sheets
280
FP7 SOLUTIONS project - Fact Sheet 092
Name SOLUTIONS Tool or Service
FS092 Sampling concept for WWTPs effluent monitoring
Description
1. Objective
You have reached this Fact Sheet because you would like to benefit from the experience gathered during the waste water treatment plants (WWTPs) sampling campaign organized to supplement the results of the Joint Danube Survey 3 (the world's biggest river research expedition of its kind, executed along the 2,375 km stretch of the Danube river in 2013 [Ref01]) with additional data on a wide range of emerging substances. You may want to use the sampling concept in the future as a basis for the design of similar sampling campaigns.
The International Commission for the Protection of the Danube River (ICPDR; www.icpdr.org) strengthened its efforts for pollution control of hazardous substances and showed high interests to deepen the knowledge on sources and pathways of hazardous substances in the Danube River Basin as a basis for efficient management strategies.
In line with these attempts, the SOLUTIONS project (http://www.solutions-project.eu/) consortium offered the ICPDR a possibility to analyse samples from a limited number of WWTPs in the Danube River Basin for a wide range of organic emerging chemicals in highly advanced laboratories, provided ICDPR could organize the sampling and provide the samples. The main goals were to: • Get representative chemical patterns from WWTP effluents with different treatments and
from different European countries; • Support selection of River Basin Specific Pollutants (RBSPs) for the Danube river basin; • Provide data to modellers for advanced exposure and risk modelling in the Danube river
and for comparison with JDS3 data; • Establish a starting point for the planning and implementation of the next Joint Danube
Survey, JDS4 (2019); • Support the ICPDR and local stakeholders with valuable data for the next Danube River
Basin Management Plan (RBMP); • Store all obtained data in the open access SOLUTIONS/NORMAN/ICPDR databases; to use
them for the goals defined above and to produce common publications.
The ICDPR supported the WWTP sampling initiative of SOLUTIONS to get more source related information on hazardous substances. The ICPDR contributed to this activity by providing SOLUTIONS with samples from WWTP effluents and facilitating sampling activities with help of the ICPDR's Pressures and Measures Expert Group (PM EG). A sampling concept was developed as a baseline document for the sampling part of the WWTP monitoring campaign, from the selection of target WWTPs to the reporting requirements characterising the sampled WWTPs.
2. Methodology
The developed sampling concept is composed of four parts focussing on: a) the selection of WWTPs for sampling, b) the sampling procedure itself, c) the list of parameters to be analysed and d) the required documentation to describe the sampling and characterise the sampling site.

RiBaTox – Full Set of Fact Sheets
281
a) Selection of WWTPs A selection of possible WWTPs to be monitored in the campaign has been made based on 2012 data of the ICPDR Urban Wastewater Inventory. The selection process considered the following criteria: • Only those Danube countries were considered, which expressed their interest to support
the monitoring campaign; • The number of WWTPs to be monitored in each country was determined according to the
expected data availability and to the capacity of the countries to organize WWTP sampling; • The selected WWTPs should represent the countries` predominant technology; • The WWTPs were chosen as large as possible (in terms of population equivalents, PE) to
ensure the best available technical equipment (Table 1).
Table 1: List of WWTPs in the Danube River Basin selected for effluent monitoring.
Country Town PE* Treatment type
Romania Bucharest 1327995 tertiary
Romania Cluj-Napoca 382031 tertiary
Serbia Šabac 84000 tertiary
Croatia Varaždin 97450 secondary
Croatia Zagreb 842425 secondary
Slovenia Ljubljana 462872 secondary
Slovenia Vipap 152487 tertiary
Hungary Budapest 1174643 tertiary
Slovak Republic Žilina 139934 tertiary
Czech Republic Brno-Modřice 397945 tertiary
Austria Amstetten 150000 tertiary
Germany Augsburg 659387 tertiary
* PE as capacity
b) Sampling procedure The effluent sampling followed the WWTP’s established routine as far as possible. Pre-cleaned sampling vessels and high purity acids for analyses of trace metals were distributed to all WWTPs before the actual sampling. Sampling was performed over 7 days, preferably with automatic samplers. The following sub-samples were collected: a) seven daily composite samples for the organic target parameters (stored deep frozen at -18 °C), b) one 7-days composite sample for trace metals and c) one daily composite sample for general parameters analysed at the WWTP (cf. Figure 1). For the extraction of organic pollutants large sample volume of up to 50 litres

RiBaTox – Full Set of Fact Sheets
282
[Ref02], [Ref03] were collected within 4-5 h on the day when the sampling team visited the respective WWTP. During transport samples were stored in the portable fridge/freezer and transported each 3 days for analysis to pre-assigned laboratories (metals – UBA, Vienna (AT); organic substances – EI, Kos (SK)). Loaded cartridges from large volume sampling were sent for further processing to UFZ (Leipzig, DE).
Sampling was performed from 21 August till 3 September 2017 according to the specific arrangements with the sampling team that collected samples directly at the WWTPs.
24 h composite sample using the automatic effluent sampler of the WWTP
Homogenization
Sub-sample for the general parameters
Sub-sample for the target parameters
Sub-sample for the heavy metals
Daily composite samples each day
7-days composite sample stored at -18 °C
7-days composite sample stored at -18 °C
Transport to lab B for analysis (ICPDR)
Transport to lab A for analysis (SOLUTIONS)
Analysis at the WWTP (routine check)
Figure 1: An overview scheme of the sampling procedure and the samples distribution.
For the WWTP monitoring campaigns the application of flow proportional automatic samplers were preferred at the WWTP effluent. Alternatively, time proportional sampling was considered also suitable. In case no automatic device was available, the composite samples were taken manually (minimum requirement). Additionally, a fridge and a freezer for storing the collection vessels were required either at the WWTP or in a suitable laboratory. WWTPs were requested to analyse general parameters in their labs or in another suitable laboratory.
The above sampling methods were chosen to reduce fluctuations in the analysis results, which is of advantage if the number of samples to be analysed is limited. General parameters were analysed to assess whether significantly varying target parameter concentrations can be attributed to specific situations in the WWTP.
c) List of analysed parameters General parameters (WWTPs) • COD and/or TOC, BOD5;
• Ammonia-nitrogen, nitrate-nitrogen;
• Total phosphorous, phosphate-phosphorus;
• pH, conductivity.
If the analysis of all general parameters at the WWTP was not feasible, the minimum requirement was the analysis of BOD5 and ammonia-nitrogen.
Trace metals (UBA Vienna)

RiBaTox – Full Set of Fact Sheets
283
• Cadmium, copper, chromium, lead, nickel, mercury, zinc, arsenic.
Organic substances • Analysis of large number of target organic substances in spot large volume samples (UFZ
Leipzig);
• Suspect and non-target screening of spot large volume samples by LC-HR-MS (UFZ Leipzig);
• Analysis of 2041 target organic substances in the 7-day composite samples with focus on analysis of antibiotics and their transformation products (EI Kos);
• Suspect and non-target screening 7-day composite samples by LC-HR-MS (EI Kos);
• Non-target screening 7-day composite samples by GC-MS (EI Kos).
All data were requested to be collected in the NORMAN Data Collection Templates allowing for their upload into the SOLUTIONS database. Raw mass chromatograms obtained by LC-HR-MS analyses were uploaded into the NORMAN Digital Sample Freezing Platform (DSFP).
d) Sampling protocol (= sampling metadata collection template) ICPDR assembled the following parameters to be documented as metadata in the sampling logbook: • name and address of the WWTP;
• responsible sampling person at the WWTP;
• number of daily samples;
• type of sampling (flow or time proportional automatic sampling, time proportional manual sampling, random sampling);
• period (time) of sampling;
• duration and temperature of freezing;
• documentation of the daily WWTP inflow values (discharge Q in m³/d) during the 7 day sampling campaign;
• documentation of the daily average WWTP effluent temperature and pH values during the 7 day sampling campaign;
• results of the analysis of the general parameters to be done each day during the sampling period (or at least two days of the period);
• results of any additional routine analyses of the WWTP during sampling period if available (influent and effluent concentrations);
• methods/standards for analysing the routine parameters and for analytical quality data assurance;
• estimation of share of infiltration water (groundwater infiltrating into the sewer) during the sampling period;
• indication whether there have been dry or wet weather conditions for each day of the sampling period;
• any special operating conditions at the WWTP during the sampling period;
• general information on the WWTP:
- population and population equivalent connected to the WWTP;
- information on specific sources discharging to the WWTP, like hospitals, industrial

RiBaTox – Full Set of Fact Sheets
284
facilities, etc.;
- type of sewer systems conveying raw waste water to the WWTP (separated or combined);
- type of treatment (mechanical, carbon removal, nitrification, denitrification, biological P-removal, P-removal by precipitation, any other specific technology);
- annual average influent and effluent concentrations of BOD, COD and/or TOC, P and N parameters as far as available from the regular data records;
- annual average daily waste water volume discharged into the recipient;
- average, minimum and maximum flow rates of the recipient;
- any observed performance problems in the WWTP operation.
3. Application
The developed sampling concept was designed to screen for presence of organic contaminants of emerging concern in effluents loading the Danube river. The concept was applied successfully and thus may be used in the future as a basis for the design of similar sampling campaigns.
The results of the analyses of the samples collected, following the here presented sampling concept, will be integrated into the SOLUTIONS Monitoring database of physico-chemical, chemical and ecotoxicological monitoring data FS043.
References
1. Liska, I., F. Wagner, M. Sengl, K. Deutsch and J. Slobodník (Eds.), 2015. Joint Danube Survey 3 - A comprehensive analysis of Danube Water Quality. ICPDR - International Commission for the Protection of the Danube River, Vienna, pp.369; https://www.icpdr.org/flowpaper/viewer/default/files/nodes/documents/jds3_final_scientific_report_2.pdf
2. Schulze T., Ahel M, Ahlheim J, Aït-Aïssa S, Brion F, Di Paolo C, Froment J, Hidasi AO, Hollender J, Hollert H, Hu M, Kloß A, Koprivica S, Krauss M, Muz M, Oswald P, Petre M, Schollée JE, Seiler TB, Shao Y, Slobodnik J, Sonavane M, Suter MJ, Tollefsen KE, Tousova Z, Walz KH and Brack W, 2017. Assessment of a novel device for onsite integrative large-volume solid phase extraction of water samples to enable a comprehensive chemical and effect-based analysis, Sci. Total Environ. 581-582: 350-358; https://doi.org/10.1016/j.scitotenv.2016.12.140
3. Tousova Z., P. Oswald, J. Slobodnik, L. Blaha, M. Muz, M. Hu, W. Brack, M. Krauss, C. Di Paolo, Z. Tarcai, T.-B. Seiler, H. Hollert, S. Koprivica, M. Ahel, J.E. Schollée, J. Hollender, M.J.-F. Suter, A.O. Hidasi, K. Schirmer, M. Sonavane, S. Ait-Aissa, N. Creusot, F. Brion, J. Froment, A.C. Almeida, K. Thomas, K.E. Tollefsen, S. Tufi, X. Ouyang, P. Leonards, M. Lamoree, V. Osorio Torrens, A. Kolkman, M. Schriks, P. Spirhanzlova, A. Tindall and T. Schulze, 2017. European demonstration program on the effect-based and chemical identification and monitoring of organic pollutants in European surface waters. Sci. Total Environ. 601–602: 1849-1868; https://doi.org/10.1016/j.scitotenv.2017.06.032
Keywords
Joint Danube Survey 3, JDS3, WWTP effluent analysis, sampling concept, sampling protocol, monitoring data, emerging substances

RiBaTox – Full Set of Fact Sheets
285
Related topics
SOLUTIONS Monitoring database of physico-chemical, chemical and ecotoxicological monitoring data FS043
Contact information
Jaroslav Slobodnik ([email protected]) Environmental Institute, Kos, Slovak Republic

RiBaTox – Full Set of Fact Sheets
286
7.2 Iberian river basins
FP7 SOLUTIONS project - Fact Sheet 040
Name SOLUTIONS Tool or Service
FS040 Priority pollutants in Iberian Rivers
Description
1. Objective
You have reached this Fact Sheet because you are interested on priority pollutants, prioritization approaches, river basin specific pollutants, Iberian river basins, water scarcity conditions and/or case studies.
Mediterranean rivers are largely different from Northern and Central European rivers in terms of hydrological regime, climate conditions (e.g. ambient temperature, solar irradiation), socio-economics (e.g. land use, tourism, kinds of crops), etc. and all these factors lead to differences also in the relative importance of the environmental stressors and the classes and levels of environmental pollutants found.
In this context, the objective of the ‘Prioritization of pollutants in Iberian Mediterranean basins’ is to identify the most relevant organic compounds in scenarios characterized by frequent water scarcity episodes and heavy human pressure in the various compartments of the aquatic ecosystem (water, sediment and biota). The assessment was made on the basis of monitoring, toxicity and physical-chemical data that were gathered for around 200 compounds and 4 Iberian basins in the frame of the Spanish project SCARCE (www.idaea.csic/scarceconsolider; [Ref02], [Ref03], [Ref04]). The results are prioritized lists of contaminants in water, sediment and biota, relevant to Iberian rivers. The outcome of this work is expected to be useful for water authorities as regards to the forthcoming river basin management plans (RBMP) to select appropriate abatement measures.
2. Methodology
Over 200 organic priority and emerging pollutants were comprehensively monitored in water and sediment samples from four Iberian river basins. They belong to the classes of pesticides (49), pharmaceuticals and hormones (90), perfluorinated compounds (PFCs) (22), alkylphenols and other industrial organic compounds (14), drugs of abuse (8) and personal care products (19) (Kuzmanović et al. 2015 [Ref01]). In biota, 135 emerging contaminants were measured: 19 endocrine disrupting compounds (EDCs), 21 perfluorinated compounds (PFCs), 51 pesticides (21 organophosphorus, 8 pyrethroids, 4 carbamates, 6 triazines, 2 ureas, 3 chloroacetamides, and 7 other compounds), 20 pharmaceuticals, 8 UV filtering compounds, 9 brominated diphenyl ethers (BDEs), 3 emerging brominated flame retardants (BFRs) and 4 halogenated norbornenes.
Grab water and sediment samples were collected at 77 selected locations along the Llobregat (15 sites), Ebro (23 sites), Júcar (15 sites) and Guadalquivir (24 sites) river basins (Figure 1) in two monitoring campaigns (autumn 2010 and 2011). Monitoring sampling sites are marked in the map with red dots. Fish samples (a total of 48) from 14 different species were collected from five selected sampling stations from each of the four Mediterranean rivers investigated during 2010.
The prioritization approach applied in water was based on a ranking index (RI) that considers for

RiBaTox – Full Set of Fact Sheets
287
each monitored compound both its occurrence (including frequency of detection and measured environmental levels) and its ecotoxicological potential (EC50 values for algae, Daphnia sp. and fish) [Ref01], [Ref05]. In the case of sediments, the prioritization approach took into consideration two additional parameters, namely, the organic carbon content of the sediment and the octanol-water partition coefficient of the substances. In biota compounds were prioritized on the basis of their detection frequency and maximum/average concentrations.
3. Application
The majority of the pollutants identified as most relevant in the various environmental compartments considered belonged to the classes of pesticides and industrial chemicals (see Figure 1). Interestingly, five of the top ten chemicals in water are in the list of priority pollutants of the Water Framework Directive (EU Dir, 2013/39), namely, chlorfenvinphos, chlorpyriphos, diuron, nonylphenol, and octylphenol. In fish, two of the substances identified as most relevant, namely, BDEs and PFOS, are subject also to environmental quality standards (EQS) in biota. According to these EQS and depending on the considered lipid content, between 77% and 85% of the samples would exceed the limit set for BDEs while 13% of them would surpass that for PFOS.
These results can help identifying priority compounds in other similar geographical areas/scenarios together with appropriate abatement measures. The monitoring and toxicological databases generated and used in this approach can be subjected to different prioritization methods. Concomitantly, the prioritization method used here can be applied to other databases.
Figure 1. Sampling sites and priority compounds in water, sediment and biota.
References
1. Kuzmanović M., Ginebreda A., Petrović M. and Barceló D., 2015. Risk assessment based prioritization of 200 organic micropollutants in 4 Iberian rivers. Sci. Total Environ. 503–504: 289–299; https://doi.org/10.1016/j.scitotenv.2014.06.056

RiBaTox – Full Set of Fact Sheets
288
2. www.idaea.csic/scarceconsolider 3. Navarro-Ortega A., Sabater S. and Barcelo D., 2012a. Understanding effects of global change
on water quantity and quality in river basins – The SCARCE Project. Environ. Sci. Pollut. R. 19(4): 915-917; https://doi.org/10.1007/s11356-012-0894-0
4. Navarro-Ortega A., Acuna V., Batalla R.J., Blasco J., Conde C., Elorza F., Elosegi A., Frances F., La-Roca F., Munoz I., Petrovic M., Pico Y., Sabater S., Sanchez-Vila X., Schuhmacher M. and Barcelo D., 2012b. Assessing and forecasting the impacts of global change on Mediterranean rivers. The SCARCE Consolider project on Iberian basins. Environ. Sci. Pollut. R. 19(4): 918-933; https://doi.org/10.1007/s11356-011-0566-5
5. von der Ohe P.C., Dulio V., Slobodnik J., De Deckere E., Kühne R., Ebert R.-U., Ginebreda A., De Cooman W., Schüürmann G. and Brack W., 2011. A new risk assessment approach for the prioritization of 500 classical and emerging organic microcontaminants as potential river basin specific pollutants under the European Water Framework Directive. Sci. Total Environ. 409: 2064–2077; https://doi.org/10.1016/j.scitotenv.2011.01.054
Keywords
Priority compounds, Mediterranean basins, water scarcity, monitoring, environmental risk assessment, water, sediment, biota, ecotoxicological data
Related topics
Relationships between chemical pollution and environmental stressors and ecosystem effects in Mediterranean river basins FS077 Strategies for monitoring of chemicals and their effects FS044
Contact information
Miren López de Alda ([email protected]) Antoni Ginebreda ([email protected]) Damià Barceló ([email protected]) Water and Soil Quality Research Unit, IDAEA-CSIC, Barcelona, Spain

RiBaTox – Full Set of Fact Sheets
289
FP7 SOLUTIONS project - Fact Sheet 077
Name SOLUTIONS Tool or Service
FS077 Relationships between chemical pollution and environmental stressors and ecosystem effects in Mediterranean river basins
Description
1. Objective
You have reached this Fact Sheet because you are interested to learn about Case Studies carried out on the Iberian peninsula. This Fact Sheet provides results of the study of some biological descriptors associated with ecosystem functioning and structure, in relation to chemical and hydrological stress characteristic of the Mediterranean river basins.
Land use occupation, physical and chemical stressors, and organic micro-contaminants were investigated for single and conjoint effects on the biological communities (biofilms and invertebrates) in a set of Iberian impaired rivers.
Figure 1. The four Iberian rivers studied (Ebro (E), Llobregat (L), Júcar (J) and Guadalquivir (G))
2. Methodology
The toxic units (TU) approach was used to assess the risk of individual compounds and the concentration addition (CA) model to assess the site-specific risks [Ref01], [Ref02], [Ref03]. The link between chemical pollution and aquatic macroinvertebrate communities in situ was examined by using four biological indexes. SPEAR (‘Species at Risk Index’) was used as the indicator of the decline of sensitive species in relation to general organic (SPEARorganic) and pesticides (SPEARpesticides) pollution (Figure 2). In addition, the Shannon and Margalef biodiversity indexes were applied. The main drivers of the risk were mainly pesticides and metals.
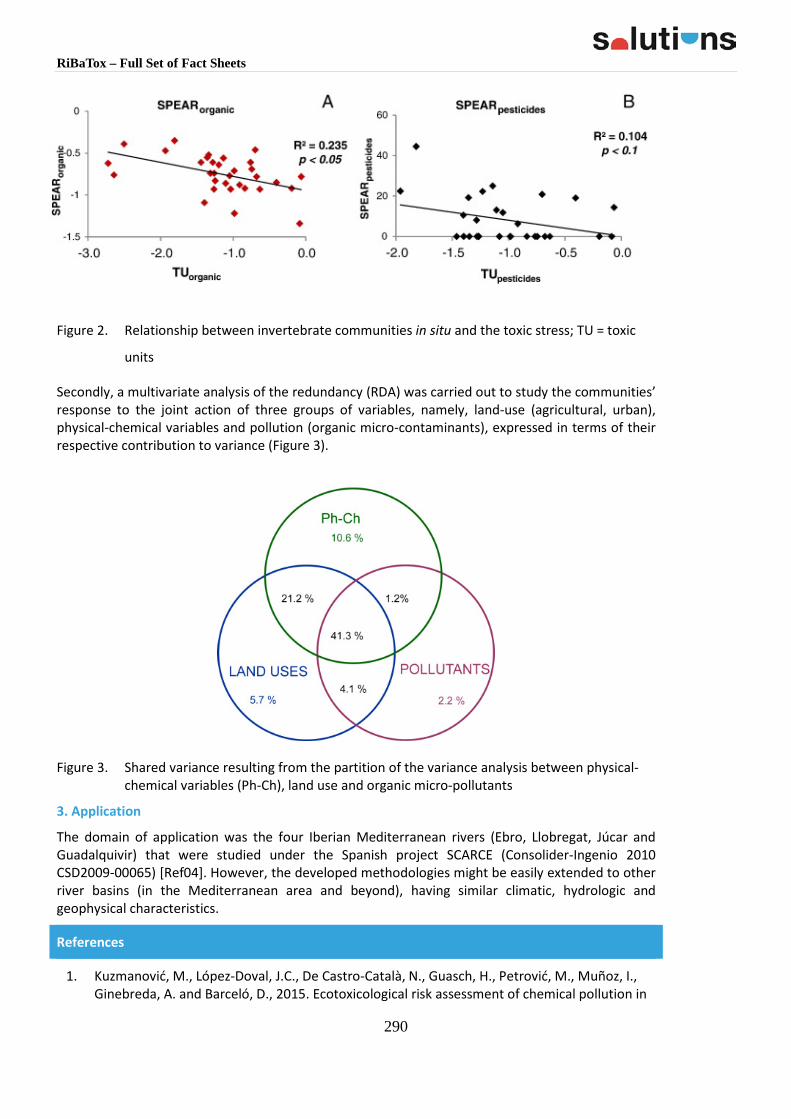
RiBaTox – Full Set of Fact Sheets
290
Figure 2. Relationship between invertebrate communities in situ and the toxic stress; TU = toxic
units
Secondly, a multivariate analysis of the redundancy (RDA) was carried out to study the communities’ response to the joint action of three groups of variables, namely, land-use (agricultural, urban), physical-chemical variables and pollution (organic micro-contaminants), expressed in terms of their respective contribution to variance (Figure 3).
Figure 3. Shared variance resulting from the partition of the variance analysis between physical-chemical variables (Ph-Ch), land use and organic micro-pollutants
3. Application
The domain of application was the four Iberian Mediterranean rivers (Ebro, Llobregat, Júcar and Guadalquivir) that were studied under the Spanish project SCARCE (Consolider-Ingenio 2010 CSD2009-00065) [Ref04]. However, the developed methodologies might be easily extended to other river basins (in the Mediterranean area and beyond), having similar climatic, hydrologic and geophysical characteristics.
References
1. Kuzmanović, M., López-Doval, J.C., De Castro-Català, N., Guasch, H., Petrović, M., Muñoz, I., Ginebreda, A. and Barceló, D., 2015. Ecotoxicological risk assessment of chemical pollution in

RiBaTox – Full Set of Fact Sheets
291
four Iberian river basins and its relationship with the aquatic macroinvertebrate community status. Sci. Total Environ. 540: 324-333; https://doi.org/10.1016/j.scitotenv.2015.06.112
2. Petrovic, M., Ginebreda, A., Acuña, V., Batalla, R. J., Elosegi, A., Guasch, H., de Alda, M. L., Marce, R., Muñoz, I., Navarro-Ortega, A., Navarro, E., Vericat, D., Sabater, S. and Barceló, D., 2011. Combined scenarios of chemical and ecological quality under water scarcity in Mediterranean rivers. 2011. TrAC Trends Anal. Chem. 30: 1269-1278; https://doi.org/10.1016/j.trac.2011.04.012
3. Sabater, S., D. Barceló, N. De Castro-Catalá, A. Ginebreda, M. Kuzmanovic, M. Petrovic, Y. Picó, L. Ponsatí, E. Torné and I. Muñoz, 2016. Shared effects of organic microcontaminants and environmental stressors on biofilms and invertebrates in impaired rivers. Environ. Pollut. 210: 303-314; https://doi.org/10.1016/j.envpol.2016.01.037
4. Navarro-Ortega, A., V. Acuña, R.J. Batalla, J. Blasco, C. Conde, F.J. Elorza, A. Elosegi, F. Francés, F. La-Roca, I. Muñoz, M. Petrovic, Y. Picó, S. Sabater, X. Sanchez-Vila, M. Schuhmacher and D. Barceló, 2012. Assessing and forecasting the impacts of global change on Mediterranean rivers. The SCARCE Consolider project 561 on Iberian basins. Environ. Sci. Pollut. Res. Int. 19: 918-933; https://doi.org/10.1007/s11356-011-0566-5
Keywords
Risk assessment; Organic microcontaminants; Toxic units; Water scarcity; Mediterranean Rivers; Aquatic ecosystems; Biofilm; Invertebrates
Related topics
Priority pollutants in Iberian Rivers FS040
Analytical strategies FS051
Protocols for target analysis of emerging contaminants (including metabolites and transformation products) in water and biota FS001
Contact information
Antoni Ginebreda ([email protected]), Miren López de Alda ([email protected]), Damià Barceló ([email protected])
Water and Soil Quality Research Unit, IDAEA-CSIC, Barcelona, Spain

RiBaTox – Full Set of Fact Sheets
292
7.3 Rhine river basin
FP7 SOLUTIONS project - Fact Sheet 075
Name SOLUTIONS Tool or Service
FS075 Assessment of wastewater-impacted streams
Description
1. Objective
You have reaches this Fact Sheet because you are interested to learn about combining chemical analysis, bioanalysis and risk assessment to evaluate the contribution of wastewater effluent on the micropollutant burden in wastewater-impacted streams and to prioritize risk driving substances. It constitutes a SOLUTIONS case study.
Wastewater treatment plants (WWTP) present a major source of micropollutants to the aquatic environment. Aquatic organisms are therefore constantly exposed to chemical mixtures, which can impose negative impacts on the ecosystem and consequently also human health. In order to identify potential for improvement in environmental quality and human health by improving wastewater treatment efficiency the micropollutant burden during low flow conditions upstream and downstream of wastewater treatment plants in small streams in the Rhine catchment as well as in the effluents was assessed (Figure 1).
Figure 1. Assessment of abatements at WWTPs to improve aquatic ecosystems and drinking water quality
2. Methodology
Grab samples were taken at 24 Swiss WWTPs (effluent, upstream, downstream) during eight time points during low flow conditions of the receiving water and analyzed for almost 400 organic substances using liquid chromatography coupled to mass spectrometry (Munz et al., 2017) [Ref01]. Besides pharmaceuticals and other typical household chemicals, also many pesticides were included, to investigate whether the higher loaded pharmaceuticals or the episodically discharged pesticides during low flow conditions contribute most to the risk towards aquatic organisms. Macroinvertebrate data was collected at the same sites during two time points in
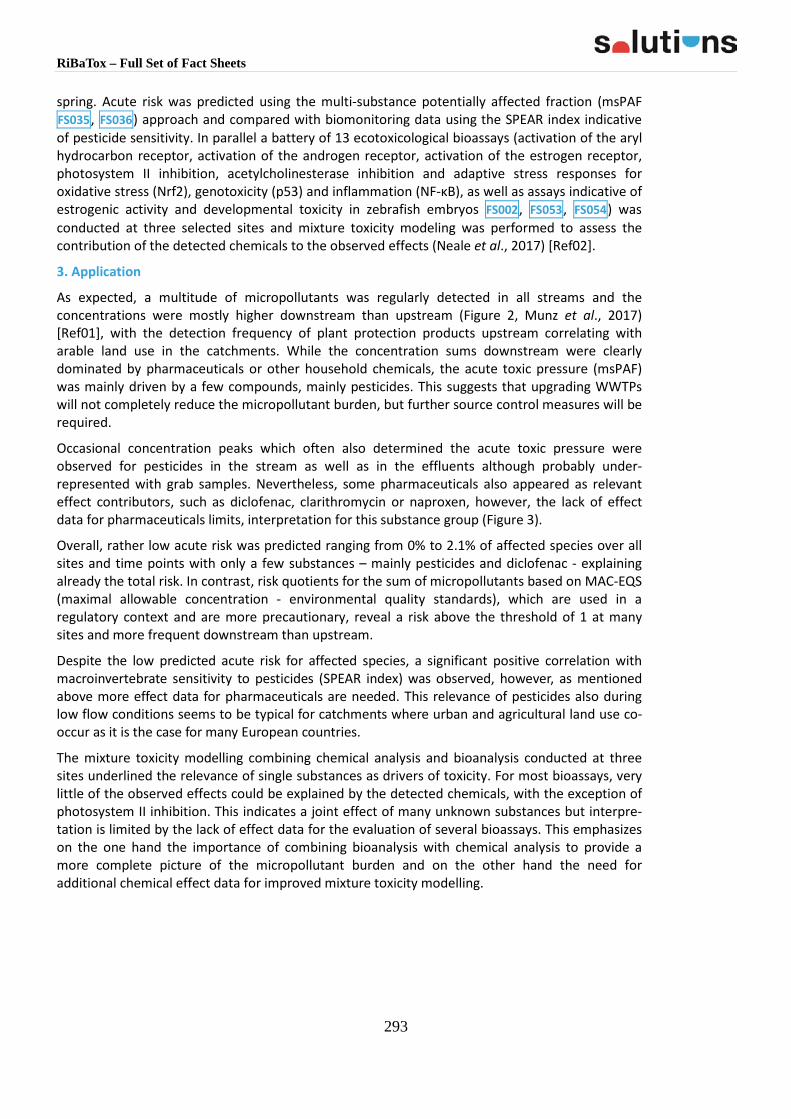
RiBaTox – Full Set of Fact Sheets
293
spring. Acute risk was predicted using the multi-substance potentially affected fraction (msPAF FS035, FS036) approach and compared with biomonitoring data using the SPEAR index indicative of pesticide sensitivity. In parallel a battery of 13 ecotoxicological bioassays (activation of the aryl hydrocarbon receptor, activation of the androgen receptor, activation of the estrogen receptor, photosystem II inhibition, acetylcholinesterase inhibition and adaptive stress responses for oxidative stress (Nrf2), genotoxicity (p53) and inflammation (NF-κB), as well as assays indicative of estrogenic activity and developmental toxicity in zebrafish embryos FS002, FS053, FS054) was conducted at three selected sites and mixture toxicity modeling was performed to assess the contribution of the detected chemicals to the observed effects (Neale et al., 2017) [Ref02].
3. Application
As expected, a multitude of micropollutants was regularly detected in all streams and the concentrations were mostly higher downstream than upstream (Figure 2, Munz et al., 2017) [Ref01], with the detection frequency of plant protection products upstream correlating with arable land use in the catchments. While the concentration sums downstream were clearly dominated by pharmaceuticals or other household chemicals, the acute toxic pressure (msPAF) was mainly driven by a few compounds, mainly pesticides. This suggests that upgrading WWTPs will not completely reduce the micropollutant burden, but further source control measures will be required.
Occasional concentration peaks which often also determined the acute toxic pressure were observed for pesticides in the stream as well as in the effluents although probably under-represented with grab samples. Nevertheless, some pharmaceuticals also appeared as relevant effect contributors, such as diclofenac, clarithromycin or naproxen, however, the lack of effect data for pharmaceuticals limits, interpretation for this substance group (Figure 3).
Overall, rather low acute risk was predicted ranging from 0% to 2.1% of affected species over all sites and time points with only a few substances – mainly pesticides and diclofenac - explaining already the total risk. In contrast, risk quotients for the sum of micropollutants based on MAC-EQS (maximal allowable concentration - environmental quality standards), which are used in a regulatory context and are more precautionary, reveal a risk above the threshold of 1 at many sites and more frequent downstream than upstream.
Despite the low predicted acute risk for affected species, a significant positive correlation with macroinvertebrate sensitivity to pesticides (SPEAR index) was observed, however, as mentioned above more effect data for pharmaceuticals are needed. This relevance of pesticides also during low flow conditions seems to be typical for catchments where urban and agricultural land use co-occur as it is the case for many European countries.
The mixture toxicity modelling combining chemical analysis and bioanalysis conducted at three sites underlined the relevance of single substances as drivers of toxicity. For most bioassays, very little of the observed effects could be explained by the detected chemicals, with the exception of photosystem II inhibition. This indicates a joint effect of many unknown substances but interpre-tation is limited by the lack of effect data for the evaluation of several bioassays. This emphasizes on the one hand the importance of combining bioanalysis with chemical analysis to provide a more complete picture of the micropollutant burden and on the other hand the need for additional chemical effect data for improved mixture toxicity modelling.

RiBaTox – Full Set of Fact Sheets
294
Figure 1: Concentration levels of detected substances upstream (up) and downstream (down) of WWTPs. Organic micropollutants were measured at sites 1 to 24 over 8 time points (2 time points with extended target screening). Heavy metals were only measured at sites 13 to 24 in the 6 bi-monthly samples from March 2014 to January 2015. LOQ = limit of quantification. *Others: corrosion inhibitors, food additives, caffeine, industrial chemicals. Numbers in the boxplots indicate median value (Munz et al., 2017) [Ref01].
Upstream
Number of substances
Frac
tion
of to
tal m
sPAF
exp
lain
ed
1 5 10 150%
20%
40%
60%
80%
100%
Number of substances1 5 10 15
95% 95%
5738
Downstream
Figure 2: Number of substances explaining the risk expressed as cumulative msPAF over 24 sites up- and downstream wastewater treatment plants; substances were sorted in decreasing order by their hazard. The first 5 substances were diclofenac, naproxen, clothianidin, imidacloprid, flonicamid (Munz et al., 2017) [Ref01].
References
1. Munz, N.A., Burdon, F.J., de Zwart, D., Junghans, M., Melo, L., Reyes, M., Schönenberger, U., Singer, H.P., Spycher, B., Hollender, J., and Stamm, C., 2017. Pesticides drive risk of

RiBaTox – Full Set of Fact Sheets
295
micropollutants in wastewater-impacted streams during low flow conditions. Water Res. 110: 366-377; https://doi.org/10.1016/j.watres.2016.11.001
2. Neale, P.A., Munz, N.A., Ait-Aissa, S., Altenburger, R., Brion, F., Busch, W., Escher, B.I., Hilscherova, K., Kienle, C., Novak, J., Seiler, T.B., Shao, Y., Stamm, C. and Hollender, J., 2017. Integrating chemical analysis and bioanalysis to evaluate the contribution of wastewater effluent on the micropollutant burden in small streams. STOTEN, 576: 785-795; https://doi.org/10.1016/j.scitotenv.2016.10.141
Keywords
Wastewater treatment, chemical risk assessment, micropollutant analysis, bioassay, multi-substance potentially affected fraction (msPAF), mixture toxicity, pharmaceuticals, pesticides
Related topics
Effect-Based Tools (EBT) FS002 Ecological risk quantification via Species Sensitivity Distributions (SSD) FS035 Ecotoxicological modelling to estimate the total toxic pressure of water bodies FS037 in vivo tools FS053 in vitro tools FS054
Contact information
Juliane Hollender ([email protected])
Eawag, Swiss Federal Institute of Aquatic Science and Technology, Dübendorf, Switzerland
RiBaTox – Full Set of Fact Sheets
296
FP7 SOLUTIONS project - Fact Sheet 027
Name SOLUTIONS Tool or Service
FS027 Risk based prioritization (RBP) of emerging contaminants in drinking water
Description
1. Objective
You have reached this Fact Sheet because application of analytical strategies FS051 and/or strategies for toxicant identification FS045 have indicated the presence of chemical contaminants in drinking water or in its resources. This requires the application of Risk characterisation models FS019 and an Advanced methodological framework for the identification and prioritization of contaminants and contaminant mixtures FS041. The objective of Risk based prioritization (RBP) of emerging contaminants in drinking water is to derive provisional drinking water guidelines to which detected (drinking) water concentrations can be compared. Benchmark quotient values that serve as human health risk indices are then calculated by dividing the concentration levels in drinking water by the respective provisional guideline value. This tool complements Identification of new substances posing a high risk FS014.
2. Methodology
The product is based on the methodology as presented by Schriks et al. [Ref01] and Baken et al. [Ref02]. Triggered by the RBP process, an inventory of emerging contaminants in (sources of) drinking water was performed. First, chemical contaminants detected during the last decade in drinking water, raw drinking water (collected water that had not yet undergone treatment), and direct drinking water sources in the downstream parts of the Rhine (i.e. Rhine river basin FS027 case study) and Meuse river basins were collected. The primary data sources were the REWAB database, in which drinking water monitoring results of the Dutch drinking water companies are collected, and the database of RIWA association of river waterworks that includes compounds monitored in Dutch surface waters. Only organic compounds were included, and sum-parameters were excluded. In addition, monitoring results of the Dutch drinking water laboratories and Rijkswaterstaat (Netherlands Department of Public Works and Water Management) were consulted.
Subsequently, a number of criteria were used to select drinking water relevant compounds. Substances present in raw drinking water were selected when their concentrations were above the Threshold of Toxicological Concern (TTC) levels reported by Mons et al. [Ref03] of 0.01 µg/L for substances not labelled as carcinogenic, mutagenic, or toxic to reproduction (CMR) and 0.1 µg/L for non-CMR substances. Chemicals present in direct drinking water sources were considered relevant for drinking water when they were hydrophilic (octanol/water partition coefficient log Kow <4), not volatile (Henry’s Law constant KiH(w) <0.02), and detected at a concentration above the TTC thresholds. Log Kow and KiH(w) information may be retrieved from Substances Properties and Use Data FS020.
Next, the toxicological relevance of the selected compounds was assessed. A drinking water guideline value represents the concentration of a constituent that does not exceed tolerable risk to the health of a consumer at lifetime exposure. As a first step, existing statutory drinking water guideline values were obtained from e.g. the WHO and the US EPA. If not available, the second step was to obtain an established Tolerable Daily Intake (TDI), Acceptable Daily Intake (ADI) or Reference Dose (RfD) or exposure levels corresponding to a specified extra life time cancer risk.
RiBaTox – Full Set of Fact Sheets
297
When those were lacking as well, in a third step toxicity data collection focused primarily on established lowest/no observed (adverse) effect levels (LO/NO(A)ELs), from which a TDI was calculated. Finally, in a fourth step, miscellaneous toxicological information (such as the therapeutic dose) was collected and a TDI was calculated accordingly. TDIs, ADIs, RfDs and/or toxicity data were sourced from documents supporting regulatory drinking water guidelines or target levels or risk assessment reports published by acknowledged international institutes; toxicological databases such as the US EPA IRIS database, TERA (Toxicology Excellence for Risk Assessment) International Toxicity Estimates for Risk (ITER), and the Organisation for Economic Co-operation and Development (OECD) eChemPortal; and from other sources such as grey literature. In case of insufficient human relevant toxicological data, the compound of interest was not further evaluated.
To calculate provisional health based guideline values, first the Tolerable Daily Intake was determined (if not already available). The Point Of Departure (POD) for calculating the TDI was mostly a chronic LO(A)EL, NO(A)EL, benchmark dose level or equivalent. An appropriate safety factor to extrapolate to chronic exposure and to incorporate intra- and interspecies differences was utilized as part of the routine TDI calculation. A drinking water equivalent level (DWEL) was subsequently calculated by multiplying the TDI, ADI or RfD, or the 10-6 extra life time cancer risk level in case of a genotoxic substance, by a typical average adult body weight of 70 kg and dividing this intake level by a daily drinking water consumption of 2 L. Finally, for non-genotoxic substances the DWEL was multiplied by an allocation factor (between 20%-80%) to account for exposure via other sources than drinking water as well, to derive a provisional drinking water guideline value. To indicate the strength of the substantiation of the drinking water guideline values, substances were grouped in the following categories: (A) representing compounds with a statutory drinking water guideline value, (B) representing compounds with an established TDI, ADI or RFD, (C) representing compounds for which the TDI was calculated with an established LO(A)EL or NO(A)EL and (D) representing compounds for which the TDI was calculated based on miscellaneous toxicological information.
Finally, a Benchmark Quotient (BQ) was calculated as the ratio between the mean or maximum reported drinking water concentration and the (provisional) health-based drinking water guideline value. A BQ value of 1 represents a (drinking) water concentration equal to the (provisional) guideline value. A BQ value of ≥1 in drinking water may thus be of potential human health concern if the water were to be consumed over a lifetime period. Compounds with a BQ value ≥0.1 in drinking water may warrant further investigation. For compounds detected in raw drinking water, surface water and groundwater, drinking water treatment may provide additional safety. For these substances it was presumed that a BQ of ≤0.2 presents absence of appreciable concern for a risk to human health.
3. Application
This RBP tool allows selection of emerging substances with the highest drinking water relevance and prioritization of those substances based on toxicological information and detected concentrations. Human health risk associated with consumption of drinking water in which substances are present for which toxicity data are absent, cannot be assessed using this tool. In such cases, the TTC approach [Ref02], [Ref03], Effect-Based Tools (EBT) FS002, and Models for predicting human health endpoints FS068 may be applied to evaluate or predict the biological activity of the contaminants. For toxicological evaluation of mixtures of substances, the Combination Toxicity Calculator (CTC) FS026 can be consulted.

RiBaTox – Full Set of Fact Sheets
298
References
1. Schriks, M., Heringa M.B., van der Kooi M.M., de Voogt P. and van Wezel A.P., 2010. Toxicological relevance of emerging contaminants for drinking water quality. Water Res. 44: 461-476; https://doi.org/10.1016/j.watres.2009.08.023
2. Baken, K.A., R.M.A. Sjerps, M. Schriks and A.P. van Wezel, 2018. Toxicological relevance and Threshold of Toxicological Concern (TTC) for drinking water relevant contaminants of emerging concern. Environ. Int. 118: 293-303; https://doi.org/10.1016/j.envint.2018.05.006
3. Mons, M.N., Heringa, M.B., van Genderen, J., Puijker, L.M., Brand, W., van Leeuwen, C.J., Stoks, P., van der Hoek, J.P., van der Kooij, D., 2013. Use of the Threshold of Toxicological Concern (TTC) approach for deriving target values for drinking water contaminants. Water Res. 47(4): 1666-1678; https://doi.org/10.1016/j.watres.2012.12.025
Keywords
Risk based prioritization (RBP), drinking water, health risk assessment, provisional drinking water guideline value, threshold of toxicological concern
Related topics
Advanced methodological framework for the identification and prioritization of contaminants and contaminant mixtures FS041 Identification of new substances posing a high risk FS014 Modelling strategies FS060
Contact information
Kirsten Baken ([email protected]) KWR Watercycle Research Institute, Nieuwegein, The Netherlands

RiBaTox – Full Set of Fact Sheets
299
8 Communication
8.1 General
FP7 SOLUTIONS project - Fact Sheet 076
Name SOLUTIONS Tool or Service
FS076 SOLUTIONS online
Description
1. Objective
You have arrived on the Fact Sheet because you are interested in information about the EU project SOLUTIONS and its concepts, products, tools and services developed. The core medium for raising awareness of SOLUTIONS, as well as for the general dissemination, consists of an informative, appealing and interactive Website publicly available online.
Figure 1. Home page of the SOLUTIONS website
2. Methodology The scientifically interested public as well as policy oriented stakeholders are addressed by an attractive and interactive Website, which describes the whole project in an appealing way with lots of photos and graphics (http://www.solutions-project.eu/). thereon this site, visitors can find comprehensive information about the project SOLUTIONS, divided in 5 main categories: • Welcome to SOLUTIONS/Background • The project • Who is SOLUTIONS? • Results & Products • Collaboration.

RiBaTox – Full Set of Fact Sheets
300
Additional contents accessible via navigating through the project’s Web include: • News & Events • List of SOLUTIONS posts published in the digital blog “The Freshwater Blog” • Links to other FP7 Projects • Networks and selected Websites, as well as • Links to pages defining more into detail relevant concepts and terminology related to
SOLUTIONS.
Figure 2. Outcome of SOLUTIONS on the website
Important content of the site relates to the section Results and Products (www.solutions-project.eu/results-products/), which also includes a list of the Publications that are the result of the project. For most a link is included which enables you to address them.
This section will remain valuable source of information to the SOLUTIONS Tools and Services, even after completion of the project.
3. Application
For a full understanding of the project’s website, visit, explore and navigate through the SOLUTIONS Website, publicly available online.
References
1. http://www.solutions-project.eu/
2. https://freshwaterblog.net
Keywords
Website; Results; Products; Publications; Publicly available online

RiBaTox – Full Set of Fact Sheets
301
Contact information
Werner Brack ([email protected]) Helmholtz Centre for Environmental Research – UFZ, Leipzig, Germany

RiBaTox – Full Set of Fact Sheets
302
9 Acknowledgement
Listed below are the Fact Sheets (co)-Authors of the SOLUTIONS Tools and Services (sorted by
institute).
Ian Cousins, Claudia Lindim, ACES, Stockholm, Sweden
Andreas Kortenkamp, Brunel University London, Uxbridge, United Kingdom
Damià Barceló, Antoni Ginebreda, Miren López de Alda, Bozo Zonja, CSIC, Barcelona, Spain
Jos van Gils, Deltares, Delft, The Netherlands
Juliane Hollender, Emma Schymanski, Eawag, Dübendorf, Switzerland
Jaroslav Slobodnik, EI, KOS, Slovakia
Michael Faust, F+B, Bremen, Germany
Valeria Dulio, INERIS, Verneuil en Halatte, France
Steffen Neumann, Christoph Ruttkies, IPB, Halle, Germany
John Munthe, Magnus Rahmberg, Tina Skårman, IVL, Goeteborg, Sweden
Sara Comero, Bernd Manfred Gawlik, JRC, Ispra, Italy
Kirsten Baken, Annemarie van Wezel, KWR, Nieuwegein, The Netherlands
Sabcho Dimitrov, Stela Kutsarova, Ovanes Mekenyan, LMC, Bourgas, Bulgaria
Dick de Zwart, Kees J.M. Kramer, Dik van de Meent, Mermayde, Groet, The Netherlands
Dirk Bunke, Öko-Institut, Freiburg, Germany
Branislav Vrana, RECETOX, Brno, Czech Republic
Leo Posthuma, Michiel Zijp, RIVM, Bilthoven, The Netherlands
Björn Deutschmann, RWTH Aachen, Aachen, Germany
Felix Jäger, Synchem, Felsberg, Germany
Helmut Segner, UB, Bern, Switzerland
Rolf Altenburger, Liza-Marie Beckers, Werner Brack, Beate Escher, David López Herráez, Martin
Krauss, Ralph Kühne, Tobias Schulze, UFZ, Leipzig, Germany
Thomas Backhaus, UGOT, Goeteborg, Sweden
Andreas Focks, WUR, Wageningen, The Netherlands