fukushima daiichi—a case study for bwr instrumentation · pdf fileornl/tm-2013/154 rev 1...
TRANSCRIPT
ORNL/TM-2013/154 Rev 1
Fukushima Daiichi—A Case Study for BWR Instrumentation and Control Systems Performance During a Severe Accident
D. A. Clayton W. P. Poore, III June 2014
Approved for public release; distribution is unlimited.
DOCUMENT AVAILABILITY Reports produced after January 1, 1996, are generally available free via US Department of Energy (DOE) SciTech Connect. Website http://www.osti.gov/scitech/ Reports produced before January 1, 1996, may be purchased by members of the public from the following source: National Technical Information Service 5285 Port Royal Road Springfield, VA 22161 Telephone 703-605-6000 (1-800-553-6847) TDD 703-487-4639 Fax 703-605-6900 E-mail [email protected] Website http://www.ntis.gov/help/ordermethods.aspx Reports are available to DOE employees, DOE contractors, Energy Technology Data Exchange representatives, and International Nuclear Information System representatives from the following source: Office of Scientific and Technical Information PO Box 62 Oak Ridge, TN 37831 Telephone 865-576-8401 Fax 865-576-5728 E-mail [email protected] Website http://www.osti.gov/contact.html
This report was prepared as an account of work sponsored by an agency of the United States Government. Neither the United States Government nor any agency thereof, nor any of their employees, makes any warranty, express or implied, or assumes any legal liability or responsibility for the accuracy, completeness, or usefulness of any information, apparatus, product, or process disclosed, or represents that its use would not infringe privately owned rights. Reference herein to any specific commercial product, process, or service by trade name, trademark, manufacturer, or otherwise, does not necessarily constitute or imply its endorsement, recommendation, or favoring by the United States Government or any agency thereof. The views and opinions of authors expressed herein do not necessarily state or reflect those of the United States Government or any agency thereof.
ORNL/TM-2013/154 Rev 1
Measurement Science and Systems Engineering Division
Fukushima Daiichi—A Case Study for BWR Instrumentation and Control Systems Performance During a Severe Accident
D. A. Clayton W. P. Poore, III
Oak Ridge National Laboratory
Date Published: June 2014
Prepared by OAK RIDGE NATIONAL LABORATORY
Oak Ridge, Tennessee 37831-6283 managed by
UT-BATTELLE, LLC for the
US DEPARTMENT OF ENERGY under contract DE-AC05-00OR22725

iii
CONTENTS
Page CONTENTS ................................................................................................................................................. iii LIST OF FIGURES ...................................................................................................................................... v LIST OF TABLES ...................................................................................................................................... vii EXECUTIVE SUMMARY ......................................................................................................................... xi ABSTRACT .................................................................................................................................................. 1 1. INTRODUCTION ................................................................................................................................ 1 2. BACKGROUND .................................................................................................................................. 3
2.1 OVERVIEW OF BWR SAFETY PRINCIPLES ........................................................................ 3 2.1.1 Protect the Fuel .............................................................................................................. 4 2.1.2 Protect the Primary System ............................................................................................ 5 2.1.3 Protect the Containment ................................................................................................. 5
2.2 OVERVIEW OF IMPORTANT BWR/3- and BWR/4-MARK I INSTRUMENTATION PRINCIPLES .............................................................................................................................. 5 2.2.1 Reactor Protection .......................................................................................................... 6 2.2.2 Engineered Safety Features Actuation/Control/Monitoring Instrumentation .............. 10 2.2.3 Important Support and Service Systems ...................................................................... 20 2.2.4 Accident Monitoring .................................................................................................... 21 2.2.5 Reactor Vessel Temperature ........................................................................................ 23
3. REPRESENTATIVE SEVERE ACCIDENT RESEARCH: PARAMETER NEEDS AND INSTRUMENTATION PERFORMANCE ........................................................................................ 25 3.1 Types of Severe Accidents ........................................................................................................ 25 3.2 Accident Information Needs ..................................................................................................... 25
4. FUKUSHIMA DAIICHI ACCIDENT ............................................................................................... 31 4.1 ACCIDENT SEQUENCE PROGRESSION ............................................................................ 31 4.2 INSTRUMENTATION PERFORMANCE SUMMARY ........................................................ 35
4.2.1 Time Period: Earthquake to Tsunami .......................................................................... 35 4.2.2 Time Period: Tsunami to Reactor Building Explosions .............................................. 35 4.2.3 Time Period: Post-Reactor Building Explosions until the End of March 2011 ........... 44
4.3 INSTRUMENTATION AND CONTROL SYSTEM PERFORMANCE/FAILURE ASSESSMENT ......................................................................................................................... 52
5. CONCLUSIONS ................................................................................................................................ 57 6. References ........................................................................................................................................... 59 APPENDIX. TABLES 5 AND 6 FROM NUREG/CR-5444: SUMMARY OF INSTRUMENT
AVAILABILITY .............................................................................................................................. A-1

v
LIST OF FIGURES
Figure Page Fig. ES-1. Actual vs. calculated RPV water level—Unit 1 (TEPCO [4], p. 190). ............................... xii Fig. ES-2. RPV pressure—Unit 1........................................................................................................ xiii Fig. 1. Neutron monitoring system ranges [19]. ..................................................................................... 7 Fig. 2. Typical BWR RPV water level instrumentation ranges [21]. ..................................................... 8 Fig. 3. RCIC system [23]. ..................................................................................................................... 12 Fig. 4. Isolation condenser system [23]. ............................................................................................... 13 Fig. 5. HPCI system (typical) [23]. ...................................................................................................... 14 Fig. 6. LPCI system (Browns Ferry Nuclear Plant, Alabama) [26]. .................................................... 15 Fig. 7. Mark I D/W/torus containment design. Source: M. Hessheimer, Sandia National
Laboratories, Containment Integrity Research at Sandia National Laboratories: An Overview, NUREG/CR-6906, July 2006. ................................................................................. 17
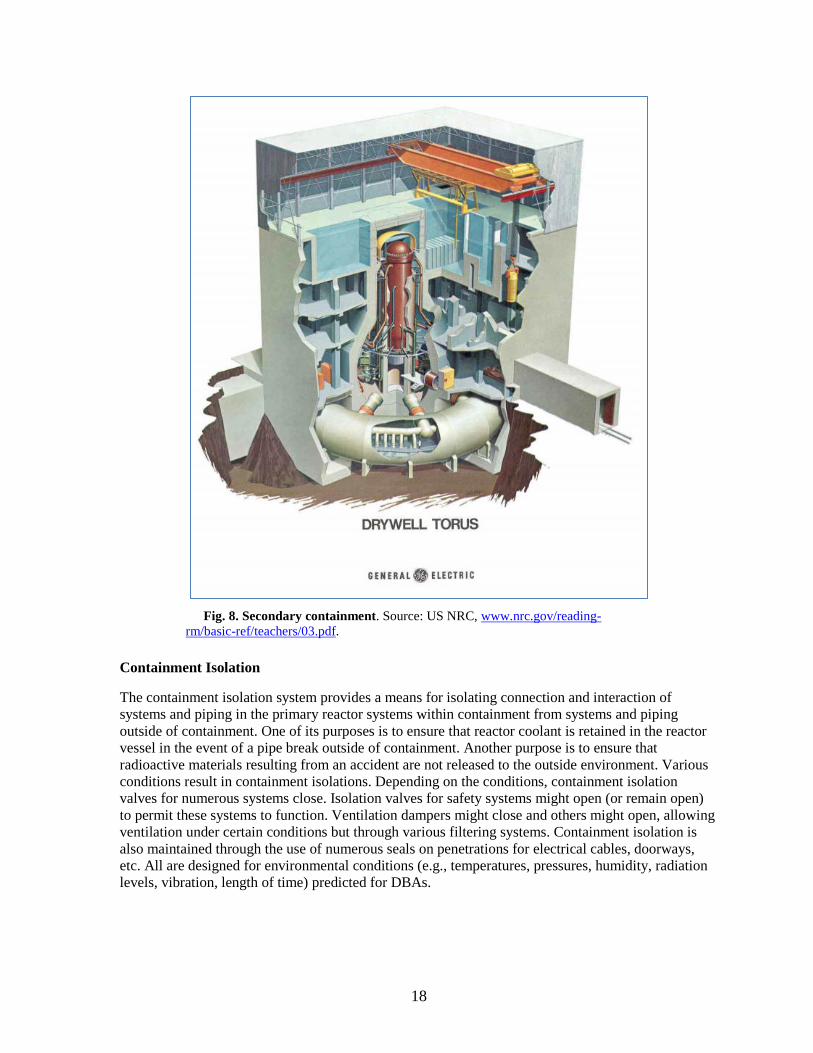
Fig. 8. Secondary containment. Source: US NRC, www.nrc.gov/reading-rm/basic-ref/teachers/03.pdf. ................................................................................................................... 18
Fig. 9. Fukushima Daiichi Unit 1 event progression summary (TEPCO [4], p. 179). ......................... 32 Fig. 10. Fukushima Daiichi Unit 2 event progression summary (TEPCO [4], p. 212). ....................... 33 Fig. 11. Fukushima Daiichi Unit 3 event progression summary (TEPCO [4], p. 237). ....................... 34 Fig. 12. Actual vs. calculated RPV pressure—Unit 1 (TEPCO [4], p. 188). ....................................... 37 Fig. 13. Actual vs. calculated RPV water level—Unit 1 (TEPCO [4], p. 190). ................................... 38 Fig. 14. Actual vs. calculated containment pressure—Unit 1 (TEPCO [4], p. 189). ........................... 39 Fig. 15. Actual vs. calculated RPV pressure—Unit 2 (TEPCO [4], p. 222). ....................................... 40 Fig. 16. Actual vs. calculated RPV water level—Unit 2 (TEPCO [4], p. 223). ................................... 41 Fig. 17. Actual vs. calculated containment pressure—Unit 2 (TEPCO [4], p. 226). ........................... 41 Fig. 18. Actual vs. calculated RPV water level—Unit 3 (TEPCO [4], p. 248). ................................... 43 Fig. 19. Actual vs. calculated RPV pressure—Unit 3 (TEPCO [4], p. 249). ....................................... 43 Fig. 20. Actual vs. calculated containment pressure—Unit 3 (TEPCO [4], p. 251). ........................... 44 Fig. 21. RPV pressure—Unit 1............................................................................................................. 45 Fig. 22. RPV water level—Unit 1. ....................................................................................................... 45 Fig. 23. D/W and S/P pressure—Unit 1. .............................................................................................. 46 Fig. 24. D/W and S/P radiation—Unit 1. ............................................................................................. 47 Fig. 25. RPV pressure—Unit 2............................................................................................................. 48 Fig. 26. RPV water level—Unit 2. ....................................................................................................... 48 Fig. 27. D/W and S/P pressure—Unit 2. .............................................................................................. 49 Fig. 28. Containment radiation—Unit 2. .............................................................................................. 49 Fig. 29. RPV pressure—Unit 3............................................................................................................. 50 Fig. 30. Reactor water level—Unit 3. ................................................................................................... 51 Fig. 31. D/W and S/P pressure—Unit 3. .............................................................................................. 51 Fig. 32. Containment radiation—Unit 3. .............................................................................................. 52


vii
LIST OF TABLES
Table Page Table ES-1. Summary of apparent deficiencies for key parameters .......................................................... xiv Table 1. Additional BWR-Mark I information needs ................................................................................. 26 Table 2. Summary of apparent deficiencies for key parameters ................................................................. 53 Table 3. Summary of degraded instrumentation ......................................................................................... 54

ix
ACRONYMS
ADS automatic depressurization system AM accident management AOO anticipated operational occurrence APRM average power range monitor ATWS anticipated transient without scram BAF bottom of active fuel BDBA beyond design basis accident BWR boiling water reactor CST condensate storage tank DBA design basis accident DOE U.S. Department of Energy D/W drywell ECCS emergency core cooling system EDG emergency diesel generator ENSREG European Nuclear Safety Regulators Group EOP emergency operating procedure ESF engineered safety feature HPCI high-pressure coolant injection I&C instrumentation and control IC isolation condenser INPO Institute for Nuclear Power Operations IRM intermediate range monitor LDHR loss of decay heat removal LOCA loss of coolant accident LPCI low-pressure coolant injection LPRM local power range monitor LWR light water reactor MS main steam NPP nuclear power plant NRC US Nuclear Regulatory Commission NTTF Near-Term Task Force PCIS primary containment isolation system PLR primary loop recirculation RBM rod block monitor RCIC reactor core isolation cooling RG US Nuclear Regulatory Commission Regulatory Guide RHR residual heat removal RPV reactor pressure vessel SBGTS standby gas treatment system SBO station blackout S/C suppression chamber SLC standby liquid control S/P suppression pool SRM source range monitor SRV safety relief valve TAF top of active fuel TEPCO Tokyo Electric Power Company TMI-2 Three Mile Island Unit 2

xi
EXECUTIVE SUMMARY
This report provides an assessment of the performance of various instrumentation and control (I&C) and monitoring systems, with a focus on the first few days of the Fukushima Daiichi accident starting on March 11, 2011. Similar to what occurred at the Three Mile Island Unit 2 (TMI-2) accident in 1979, operator responses were challenged when information on key parameters was lost, erroneous, or misleading. While numerous improvements in instrumentation capabilities have been made since the TMI-2 event, the accident at Fukushima Daiichi suggests the potential for further improvement. The objective of this research is to review the performance of the Fukushima Daiichi Units 1–3 instrumentation systems that could have helped ensure that plant operators and emergency responders had relevant, accurate, and timely knowledge of plant conditions as they managed the accident response. As was the case with TMI-2, forensic analyses of plant instrumentation failures will be a long-term effort. As an introduction to this long-term research, this report focuses on the information available in the control room during the accident and illustrates the challenges to operators in their understanding of plant conditions during the progression of the accident.
I&C systems monitor the success or failure of achievement of light water reactor safety principles in which the protection of the reactor fuel, reactor coolant system, and reactor containment is accomplished. This report (1) provides an overview of the safety principles; (2) notes parameters associated with the boiling water reactor (BWR)/3 and BWR/4 protection, actuation, and monitoring systems as they relate to the achievement of these principles; (3) presents data from past research on predicted instrumentation performance during severe accidents, and (4) assesses performance of the key I&C and monitoring systems associated with BWR/3 and BWR/4 reactors like those at Fukushima Daiichi. Lessons learned or potential improvements associated with the performance of these systems in the context of severe accidents are delineated.
As background information, an overview of key BWR/3- and BWR/4-Mark I reactor designs (BWR/3 and BWR/4 with a Mark I containment) reactor protection, engineered safety features actuation, and accident monitoring systems is provided. A brief description of plant safety systems used to prevent or mitigate reactor accidents is also provided. This background information provides context for the brief discussion of previous research that has been conducted on BWR severe accidents and for the discussion of the accident sequences, which led to core damage at Fukushima Daiichi Units 1–3.
The progression of the accident sequences at Fukushima Daiichi Units 1–3 occurred very much as predicted in prior severe accident research conducted in the United States [1] and internationally, given the complete station blackout that occurred when the tsunami generated by one of the most powerful earthquakes ever recorded rolled onshore.
Severe accident research noted the importance of I&C, monitoring systems, and their dependence on dc electrical power systems when ac electrical systems fail. Research in the early 1990s [2] found that approximately 20 pieces of information needed to help cope with severe accidents were not directly provided. Vulnerabilities of plant monitoring systems to various severe accidents were reviewed, and some responses were made. For example, at Fukushima Daiichi Units 2, 4, and 6, air-cooled diesel generators were added as part of the Tokyo Electric Power Company’s (TEPCO’s) accident management (AM) initiatives [3]. These provided redundancy and diversity to emergency power sources. However, because of flooded electrical panels they could not be connected for use at Units 1–4.

xii
Off-site power supplies to the Fukushima Daiichi power station were lost as a result of the earthquake. About 40 minutes later, a series of tsunami waves 10 m higher than than the station was designed to withstand flooded the site, causing the failure of the operating emergency on-site diesel generators and the critical failure of the batteries that provide emergency backup power for plant monitoring, control equipment, and the power distribution panels necessary for powering safety-related equipment.
The diverse emergency air-cooled diesel generators at Units 2 and 4 themselves were apparently operable but could not be used to provide the needed power plant loads because of the flooded electrical rooms. Lighting and communications equipment were also lost. These events, which were beyond the design basis of Fukushima Daiichi, precipitated core damage, the resulting generation of explosive hydrogen gases, releases to and from reactor pressure vessels (RPVs) to containments and from reactor containments, and subsequent explosions1 that severely damaged reactor buildings and greatly challenged efforts to prevent further damage and contain additional radioactive releases. Instrumentation and monitoring equipment necessary to guide AM activities and mitigative functions was lost. Operators were dispatched to hazardous areas of Fukushima Daiichi’s reactor buildings to obtain instrument readings and to control systems because of the lack of power to main control rooms. Importantly, even as power was restored, apparent deficiencies in instrumentation performance, such as shown in Fig. ES-1, were noted. In this figure, different reactor water level readings in redundant instruments A and B are shown in the March 12 time frame. For several days after, there were no reactor vessel water level readings from instrument A. Collectively, lack of instrument readings or uncertainty in the accuracy or timeliness of readings hinders accident response as demonstrated by the operators’ deliberate and time-consuming efforts to determine plant conditions and effectively respond at Fukushima Daiichi.
Fig. ES-1. Actual vs. calculated RPV water level—Unit 1 (TEPCO [4], p. 190).
1 As used in this report, “explosion” refers to either deflagration or detonation.
xiii
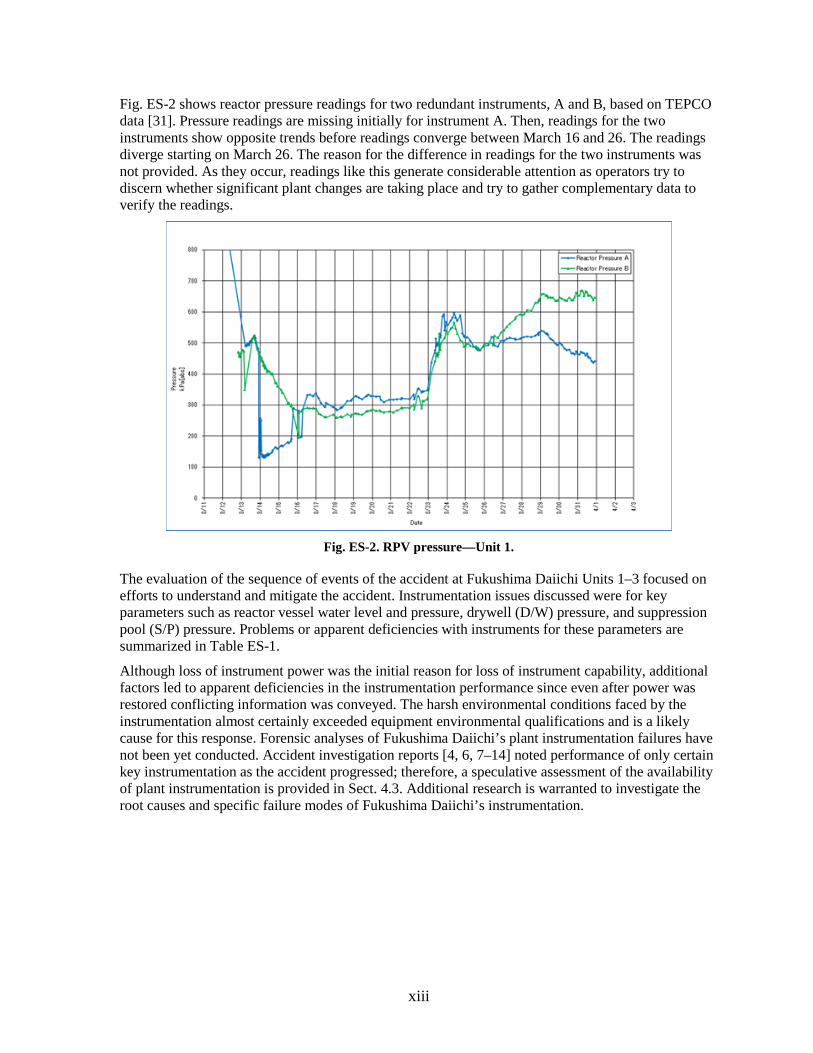
Fig. ES-2 shows reactor pressure readings for two redundant instruments, A and B, based on TEPCO data [31]. Pressure readings are missing initially for instrument A. Then, readings for the two instruments show opposite trends before readings converge between March 16 and 26. The readings diverge starting on March 26. The reason for the difference in readings for the two instruments was not provided. As they occur, readings like this generate considerable attention as operators try to discern whether significant plant changes are taking place and try to gather complementary data to verify the readings.
Fig. ES-2. RPV pressure—Unit 1.
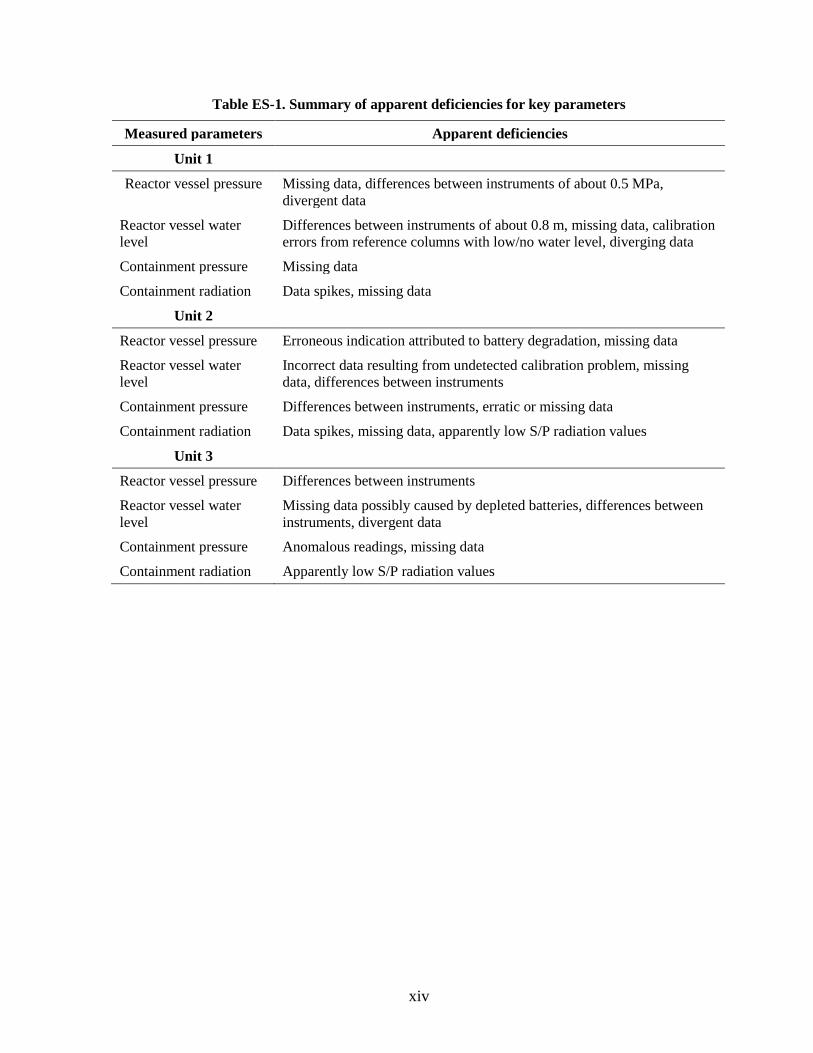
The evaluation of the sequence of events of the accident at Fukushima Daiichi Units 1–3 focused on efforts to understand and mitigate the accident. Instrumentation issues discussed were for key parameters such as reactor vessel water level and pressure, drywell (D/W) pressure, and suppression pool (S/P) pressure. Problems or apparent deficiencies with instruments for these parameters are summarized in Table ES-1.
Although loss of instrument power was the initial reason for loss of instrument capability, additional factors led to apparent deficiencies in the instrumentation performance since even after power was restored conflicting information was conveyed. The harsh environmental conditions faced by the instrumentation almost certainly exceeded equipment environmental qualifications and is a likely cause for this response. Forensic analyses of Fukushima Daiichi’s plant instrumentation failures have not been yet conducted. Accident investigation reports [4, 6, 7–14] noted performance of only certain key instrumentation as the accident progressed; therefore, a speculative assessment of the availability of plant instrumentation is provided in Sect. 4.3. Additional research is warranted to investigate the root causes and specific failure modes of Fukushima Daiichi’s instrumentation.
xiv
Table ES-1. Summary of apparent deficiencies for key parameters
Measured parameters Apparent deficiencies
Unit 1
Reactor vessel pressure Missing data, differences between instruments of about 0.5 MPa, divergent data
Reactor vessel water level
Differences between instruments of about 0.8 m, missing data, calibration errors from reference columns with low/no water level, diverging data
Containment pressure Missing data
Containment radiation Data spikes, missing data
Unit 2
Reactor vessel pressure Erroneous indication attributed to battery degradation, missing data
Reactor vessel water level
Incorrect data resulting from undetected calibration problem, missing data, differences between instruments
Containment pressure Differences between instruments, erratic or missing data
Containment radiation Data spikes, missing data, apparently low S/P radiation values
Unit 3
Reactor vessel pressure Differences between instruments
Reactor vessel water level
Missing data possibly caused by depleted batteries, differences between instruments, divergent data
Containment pressure Anomalous readings, missing data
Containment radiation Apparently low S/P radiation values
1
ABSTRACT
This document summarizes available information regarding instrumentation performance, with a focus on the first few days of the accident at the Fukushima Daiichi power station in Japan on March 11, 2011. Specifically, the report identifies some of the key parameters typically used for boiling water reactor (BWR)/3 with a Mark I containment (BWR/3-Mark I) and BWR/4-Mark I accident evaluations and what sensors are available to monitor these parameters, either directly or indirectly, within the reactor vessel, drywell, suppression pool, and reactor building. For each parameter, a description is provided regarding the measured data, observations related to the sensor survivability, and the confidence in the instrument readings for the parameter. Analyses of assessments of the Fukushima Daiichi accident were performed to assess the performance of key instrumentation during this event. The analyses included observation by Japanese experts regarding instrumentation performance, alternative measurement capabilities, and comparisons of instrument readings. The forensic analyses of plant instrumentation failures will be a long-term effort. Therefore, this report focuses on the information available in the control room during the accident and illustrates challenges the operators faced in their understanding of Fukushima Daiichi’s conditions during the progression of the accident.
1. INTRODUCTION
The accidents at Three Mile Island Unit 2 (TMI-2) and Fukushima Daiichi Units 1–3 demonstrate the critical importance of accurate, relevant, and timely information on the status of reactor systems during a severe accident. The TMI-2 accident highlighted the critical importance of understanding and focusing on the key elements of system status information in an environment where operators—even with emergency operating procedures (EOPs) to guide prompt, logical decision making to place the plant in a safe condition—were challenged when information on key parameters was lost, erroneous, or misleading. Although progress in these areas has been made since TMI-2, the accident at Fukushima Daiichi suggests that there is potential for further improvement. Recognizing the significant technical, regulatory, and economic challenges associated with modification of plant instrumentation, it is important to focus on the most essential data needs that can be factored into better guidance for accident prevention and mitigation and lead to enhanced plant safety.
This report provides an assessment of the performance of various instrumentation and control (I&C) and monitoring systems, with an emphasis on the first few days of the Fukushima Daiichi accident. The emphasis is on the first few days because this was a critical period during which having improved instrumentation capabilities that accurately and completely reflected the units’ status, and of the safety and support systems, could have supported more timely and appropriate operator activities, potentially delaying or limiting core, containment, and building structural damage and radiation release.
Instrumentation systems measure the success or failure of achievement of general light water reactor (LWR) safety principles2 in which the protection of the reactor fuel, reactor coolant system, and reactor containment is accomplished with multiple barriers, independence, redundancy, and defense in depth.
2 For example, see Appendix A to 10 CFR 50, “General Design Criteria for Nuclear Power Plants,” (http://www.nrc.gov/reading-rm/doc-collections/cfr/part050/) for requirements for reactor applicants that demonstrate these principles.

2
This report (1) provides an overview of the safety principles; (2) notes parameters associated with the boiling water reactor (BWR)/3 and BWR/4 reactor protection system (like those of Fukushima Daiichi Units 1–3), engineered safety features (ESFs) actuation system, and accident monitoring system as they relate to the achievement of these principles; (3) presents data from past research on likely instrumentation performance during severe accidents; and (4) assesses performance of the key I&C and monitoring systems associated with the Fukushima Daiichi accident. Initial lessons learned or potential improvements associated with I&C and monitoring systems performance in the context of this severe accident and prior research are also discussed.
A comprehensive evaluation of instrumentation performance is needed to glean the most information from the accidents at TMI-2 and Fukushima Daiichi Units 1–3. This comprehensive evaluation should include a careful examination of available data, an analysis relying on basic engineering principles, an analysis of operator information, laboratory evaluations, comparisons with accident simulations results and large integrated tests, and post-accident inspection.
As seen with the analysis of the TMI-2 event, many insights to what occurred were not available until at least a decade after the event. Gaining these insights required an integrated process including post-accident videos; examinations of samples of core debris and vessel structures; instrumentation data; calculations with “best-estimate” severe accident analysis tools; separate effects laboratory tests; and, in some cases, data from large integral tests [15]. Just as there was insufficient data available from any single source to develop a complete understanding about the TMI-2 accident, it is reasonable to expect a similar situation at Fukushima Daiichi and the need for a similar analysis to interpret and integrate information for the accident at Fukushima Daiichi.
This work describes the performance of some of the key instrumentation used to guide operator actions in response to the accident at Fukushima Daiichi Units 1–3 and thereby inform future research opportunities to better design and use instrumentation systems under severe, or beyond-design-basis, conditions to (1) protect the fuel, (2) protect reactor coolant system integrity, (3) preserve containment functions, and (4) help inform public safety decisions in the event that radioactive contamination is released to the environment. Benefits of the work include informing plant operators regarding the accuracy and survivability of existing plant instrumentation under severe accident conditions, guiding the adoption of additional instrumentation for use during accidents, and improving the state of the art of accident tolerant instrumentation.
3
2. BACKGROUND
The nuclear accidents at the Japanese Fukushima Daiichi reactors Units 1–4 are the worst tied to commercial nuclear power plants (NPPs) since the catastrophic Chernobyl accident in 1986. After Fukushima Daiichi survived one of the highest magnitude earthquakes on record, causing a loss of all off-site ac electrical power, a series of devastating tsunami waves far higher than the facility was designed to withstand inundated the site and caused an immediate loss of all emergency on-site ac and dc electrical power at Units 1 and 2 and led to a loss of dc electrical power caused by battery depletion at Unit 3 approximately 24 h later. Air-cooled diesel generators at Units 2 and 4 survived the flood. They were, however, rendered useless because of flooded power distribution panels.
A station blackout (SBO) is one of the most challenging events for a conventional LWR. As a result of a short-term SBO at Units 1 and 2 (i.e., all ac and dc electric power is lost in the short term) and a long-term SBO at Unit 3 (i.e., dc power is available until batteries are exhausted), active safety systems designed to flood and cool a nuclear reactor core were ultimately ineffective. Unit 4 experienced severe structural damage; however, fuel had been removed from the reactor to the spent fuel pool for refueling purposes. (The conditions and response actions at Unit 4 are not addressed in this report.)
Even as power was restored, instrumentation to indicate key parameters, monitor changing conditions, and control remaining functional equipment was inoperable, degraded, or inaccurate. There was also no effective means for repair, maintenance, or calibration. This section briefly describes the reactor safety principles and provides a brief description of the reactor protection, ESF actuation, and accident monitoring I&C systems—an important few of many I&C systems.
2.1 OVERVIEW OF BWR SAFETY PRINCIPLES
Simply stated, BWRs share safety principles with all commercial LWR power plants. These principles underlie the content of LWR regulatory requirements such as the General Design Criteria contained in Appendix A to NRC regulation 10 CFR 50, Domestic Licensing of Production and Utilization Facilities. These include protecting the public from harm associated with accidents by developing robust designs, with margin, that accommodate normal foreseen operating conditions, less frequent but more serious challenges, and even less frequent but severe challenges. To protect against these challenges, a design philosophy of diversity, redundancy, and defense in depth is intended to ensure that reactor fuel integrity is maintained for the spectrum of normal, expected events to design basis accidents (DBAs). Multiple and diverse safety systems are designed to protect the fuel and the reactor coolant system integrity surrounding the fuel, both to protect the fuel and provide a boundary to enclose radioactive contamination in the event of fuel failure. Containment structures and systems provide an additional boundary to contain radioactive contamination in the event of fuel failures and breaches of the reactor coolant system so that contamination does not reach the environment and a pathway to the public. In summary, the principles are to protect the fuel/clad boundary, the reactor coolant system boundary, and the containment boundary.

4
Instrumentation systems that are important to safety also employ principles of diversity, redundancy, and defense in depth to ensure that the observation and monitoring of parameters indicative of a sequence of events that could threaten fuel integrity lead to protective actions, such as a reactor scram and/or actuation of safety systems. Additionally, if there is an accident, instrumentation systems are provided to monitor, measure, and inform staff and emergency responders so that consequences to the site, environment, personnel, and the public can be minimized.
The accident at Fukushima Daiichi highlighted deficiencies in the implementation of these safety principles for the nuclear units at that site following the severe earthquake centered offshore and the resulting series of tsunami waves that followed shortly after. Many Japanese and international reviews of the accident and its causes have taken place, and more are under way [4, 6, 7–10, 16–17]. The reviews have been extensively documented from a number of perspectives and are widely available. This report looks specifically at the performance of instrumentation during and following the accident to identify opportunities to better design and use instrumentation systems under severe, or beyond-design-basis, conditions to protect the fuel, protect reactor coolant system integrity, preserve containment functions, and help inform public safety decisions in the event radioactive contamination is released to the environment.
2.1.1 Protect the Fuel
NPPs are operated within sets of limits designed to protect the nuclear fuel. This fuel, typically consisting of uranium oxide fuel encased in zirconium alloy cladding, performs well under design conditions, but as fuel and cladding temperatures rise significantly, an exothermic chemical reaction with the zirconium cladding and water/steam can occur. This reaction generates heat, further raising fuel temperature, potentially to the point of melting, plus produces hydrogen gas that could escape into buildings and structures. The gas could explode3 under some conditions. Designers develop a set of reactor operating limits under which fuel damage cannot occur. Instrumentation monitors numerous reactor core and balance-of-plant parameters to identify challenges to the operating limits and initiate protective or corrective responses. Protective responses include a reactor scram to rapidly shut down the reactor. This immediately decreases heat generation in the fuel at a typical 1,000 MWe nuclear unit by about 93%. The remaining 7% of the heat generated, approximately 250 MW (thermal) initially for a large NPP, decays away exponentially. The removal of decay heat is usually the most challenging factor in safely maintaining a reactor in a shutdown condition. Without systems to remove this decay heat, fuel damage can occur quickly.
Designers provide systems to respond to these challenges. Some challenges are normal operating conditions that are anticipated to occur frequently over the design lifetime of the NPP. Other challenges, termed anticipated operational occurrences (AOOs), are expected to occur less frequently, maybe once or a few times over the life of the plant. More serious challenges, DBAs, might not be expected to occur over the lifetime of the plant but could occur at a frequency high enough (e.g., less than 10-4 to 10-5 per year of reactor operation) and with consequences serious enough that they must be considered by the plant designers. Designers in the United States must ensure that their reactor designs are designed and built to withstand normal operating transients, AOOs, and DBAs; that is, the fuel performance, reactor coolant system integrity, and containment performance would prevent radiological doses to the public from exceeding certain values if one of these events were to occur. Another class of accidents—severe accidents, or beyond design basis accidents (BDBAs)—could have serious consequences, but the expected frequency of occurrence is below a low threshold (e.g., less than 10-5 to 10-6 per year of reactor operation for typical current plants and less than 10-6 to 10-7 per year for more advanced designs).
3 As used in this report, “explosion” refers to either deflagration or detonation.
5
BDBAs are not fully considered in the design process in the United States in the same way as for a design basis event; however, margin is expected to be provided in the design to accommodate for the unlikely BDBA.
A loss of off-site ac electrical power is an expected and planned for event. On-site emergency ac electrical power will be provided by emergency diesel generators (EDGs) in the event of a loss of off-site power. Fuel for the diesel generators is stored on-site to last for a minimum of seven days [18] following a loss of off-site power before delivery of additional fuel would be required. However, an event or sequence of events that could lead to a complete SBO—earthquake, flood, loss of off-site power, loss of emergency on-site emergency ac electrical power, and loss of on-site emergency dc electrical power (typically used to power monitoring and control systems and enable valve actions to bring the plant to a desired configuration)—is an exceptionally challenging BDBA.
2.1.2 Protect the Primary System
The function of the reactor coolant system is to ensure that heat from the nuclear fuel is removed and the fuel is cooled. During power operation, non-safety–related feed water systems, recirculation systems, and the main steam (MS) system provide water to absorb heat from the fuel, which is boiled into steam and used to turn a turbine and power an electrical generator. Upon detection of a problem that could threaten the ability to cool the fuel, the reactor will be scrammed and, under certain conditions, valves will close to isolate the system and prevent the escape of cooling water. The isolated system typically contains a large volume of water that covers the fuel elements to keep them cool. However, decay heat from the fuel causes the water to heat up and boil. Steam-powered safety systems use steam-powered turbine-driven pumps to provide additional cooling water as long as enough steam is generated to power the turbines. Additional electrically powered cooling water systems are also available to recirculate cooling water through the reactor core, cool the recirculating water, and cool structures, buildings, or rooms. With electrical power and an ultimate heat sink to serve as a source of cooling water, the core can be maintained shutdown, cool, and safe indefinitely.
2.1.3 Protect the Containment
Almost all commercial power reactors in the world, with an exception being some older Soviet RBMK designs, are surrounded by a containment structure to contain radioactive contamination released in AOOs and DBAs. Reactor containments are designed (with margin) to withstand the pressures, temperatures, radiation exposures, and water sprays or flooding expected during design basis events. With necessary isolation systems and support systems, such as cooling systems, containment systems serve as a final barrier to the uncontrolled release of radionuclides during an accident. Containment systems and various safety systems and components located therein are designed to accommodate the harsh accident environment expected during DBAs.
2.2 OVERVIEW OF IMPORTANT BWR/3- AND BWR/4-MARK I INSTRUMENTATION PRINCIPLES
The basic requirement for plant instrumentation systems is to accurately measure important parameters on a timely basis so that there is great confidence that various operating limits across the spectrum of reactor core, primary systems, and balance-of-plant systems are met. Instrumentation feeds information on plant conditions to control and monitoring systems that trigger or inform corrective or protective actions.
6
Instrumentation systems important to safety are designed with care and rigor to ensure that they perform as needed, such as those that initiate reactor protection system actions (i.e., scrams) and those that initiate ESFs (e.g., system isolations, actuations of emergency cooling systems) designed to ensure safety of the fuel, etc., during transients or accidents. (Note: this section is based on the BWR/4-Mark I design information from Nuclear Regulatory Commission [NRC] training materials [19–25]. Noteworthy differences of the BWR/3-Mark I design, such as its isolation condenser (IC), will be indicated.)
2.2.1 Reactor Protection
When monitored system parameters exceed predetermined limits, the reactor protection system detects conditions that threaten the fuel or primary coolant pressure boundary and initiates a rapid automatic reactor shutdown, or scram. (A manual scram mode is also provided.) This action prevents damage to the fuel and the primary coolant pressure boundary, limiting uncontrolled release of radioactive materials. The system consists of logic circuitry, sensors, transmitters, processors, cables, and operator indicators, controls, and interface hardware. The following subsections list typical parameters used as inputs to the reactor protection system. (Note that these parameters are typical for US BWR/3 and BWR/4 reactors with Mark I containments. Instrumentation for Japanese reactors is similar.)
2.2.1.1 Parameters monitored/instrumentation principles
The BWR reactor protection system monitors a number of parameters and initiates a plant trip when various settings are reached. The system is characterized as a redundant, diverse, and defense-in-depth system. Designers want to ensure that a scram occurs when needed but also strive to eliminate unwanted trips, their associated transients, and challenges to safety equipment. Typically, multiple sensors feed multiple channels. A scram signal requires conditions to be met for the same parameter from different sensors in multiple channels. Designers also recognize that parameter values may change depending on plant conditions. For example, changes in coolant flow rates, temperatures, and pressures can vary depending on the plant power level. Therefore, safety important systems like the reactor protection system are complicated. The descriptions of this system and the various parameters are meant to be illustrative rather than definitive.
Neutron Flux
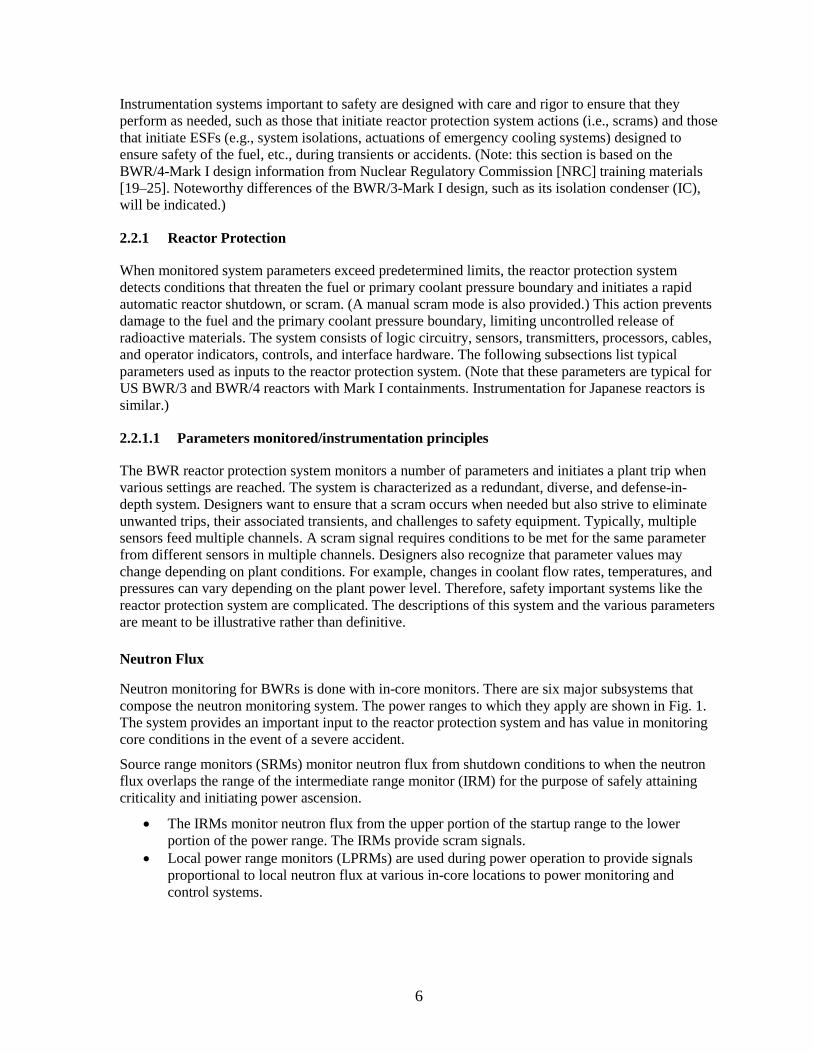
Neutron monitoring for BWRs is done with in-core monitors. There are six major subsystems that compose the neutron monitoring system. The power ranges to which they apply are shown in Fig. 1. The system provides an important input to the reactor protection system and has value in monitoring core conditions in the event of a severe accident.
Source range monitors (SRMs) monitor neutron flux from shutdown conditions to when the neutron flux overlaps the range of the intermediate range monitor (IRM) for the purpose of safely attaining criticality and initiating power ascension.
• The IRMs monitor neutron flux from the upper portion of the startup range to the lower portion of the power range. The IRMs provide scram signals.
• Local power range monitors (LPRMs) are used during power operation to provide signals proportional to local neutron flux at various in-core locations to power monitoring and control systems.
7
• Average power range monitors (APRMs) are used during power operation to continually monitor core average (bulk) thermal power. APRMs initiate rod block and scram signals to prevent thermal margins from being exceeded. APRMs receive signals from LPRMs and flow units in the recirculating water system that are used to control reactor power.
• The rod block monitor (RBM) provides alarm and rod withdrawal blocks if core power exceeds a preset limit in relation to recirculating water flow rate to help ensure that power increases from rod movements are maintained within desired limits.
• The traversing in-core probe provides a means of measuring thermal flux in the core in an axial direction. The probe can be inserted and removed axially in various channel tubes so that LPRMs that are in fixed positions in the core can be calibrated.
Fig. 1. Neutron monitoring system ranges [19].
Reactor Pressure Vessel Water Level
A low water level in the reactor vessel is a reactor trip condition on the basis that reactor fuel could be subject to inadequate cooling. Reactor pressure vessel (RPV) water level, measured in the reactor vessel downcomer annulus, is one of the most important parameters for a BWR. A key to keeping reactor fuel cool is to keep it covered with water. Level indications are used under normal operating conditions for feed water control system purposes and in accident conditions to measure and initiate numerous protective features and ESFs. Numerous level indicators are provided in the reactor building at various locations and in the control room.
8
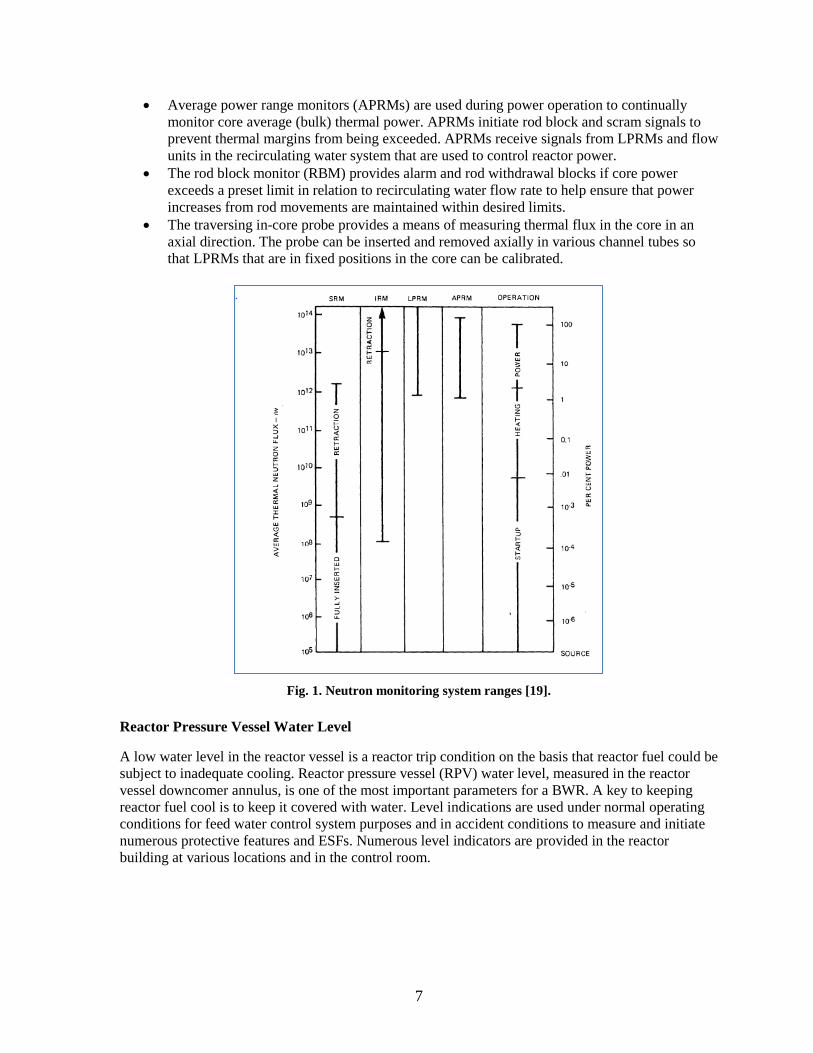
Figure 2 shows multiple reactor vessel water level ranges for a typical BWR. Multiple separate reactor vessel water level indications are provided in the control room and are continuously displayed on various panels to provide accident range readings, provide normal range readings for the feed water control system, support low-pressure coolant injection operation, and support refueling operations. Specific functions use specific level measurement ranges. Some are for a relatively narrow range, such as the feed water control system that controls level within a narrow band. Accident range readings cover a broader band and initiate various accident responses as level drops below the normal range.
Fig. 2. Typical BWR RPV water level instrumentation ranges [21].
The low-pressure injection system is controlled based on level readings across a somewhat broader range to ensure that fuel rods are covered. A broad range covering to the top of the reactor vessel is used for refueling operations.
Water level is determined by means of differential pressure sensors connected to reference columns that connect to the reactor vessel at points above and below where level measurements are needed. The sensors compare the pressure of water in reference columns with the pressure of water in the reactor vessel in the level ranges of interest and convert sensor output to correspond to a level of water corresponding to the pressure difference. Systems or equipment are often provided to ensure that reference columns are kept full. Maintenance of constant conditions in the reference columns is important to accurate level indications. If the reference level is off, then the measured reactor vessel water level will also be off.
9
During a severe accident, environmental conditions in containment could cause reference column changes (e.g., high temperatures in the reference column) and lead to erroneous level indications, creating a lack of confidence in the readings. It could be difficult, even with multiple sensors, to know which ones are correct.
Reactor Pressure Vessel High Pressure
A high-pressure reactor trip is provided to protect against a threat of rupture of the reactor coolant pressure boundary. Increasing pressure causes steam voids to collapse and a positive reactivity insertion leading to higher fuel temperatures, potentially exceeding fuel design temperatures and system pressure limits.
RPV is measured in the vessel steam space and is detected by pressure switches and indicators from instrument lines also used for water level measurements. Thus the conditions that affect level instruments affect pressure instruments. Knowledge of reactor pressure is necessary in estimating the integrity of the primary coolant pressure boundary and in assessing the success of low-pressure coolant injection options in a severe accident.
Turbine Stop Valve Closure
BWRs initiate a reactor trip upon turbine stop valve closure, such as for loss of load in anticipation of a reactor vessel pressure increase and a subsequent reactor power (neutron flux) increase.
Turbine Control Valve Fast Closure
Analogous to the turbine stop valve closure, a turbine control valve fast closure can also lead to a reactor vessel pressure increase and a subsequent reactor power (neutron flux) increase.
Main Condenser Low Vacuum
Related to the turbine stop valve and turbine control valve closures is the main condenser low vacuum reactor protection system trip. This condition protects the condenser from potential high-pressure conditions resulting from a turbine stop valve closure and anticipates the trip signal resulting from stop valve closure.
MS Isolation Valve Position
Automatic closure of the MS isolation valves is initiated to protect from a loss of reactor water inventory.
Containment Pressure High
A reactor trip signal on high containment pressure is provided to protect from a loss-of-reactor-coolant accident. The reactor trip is to prevent fuel damage and to reduce the addition of energy to the coolant. Containment pressure indication is critical to effectively managing a severe accident.
MS Line High Radiation
A reactor trip on high steam line radiation is provided to prevent the effects of a fuel failure from propagating to the environment.
10
Scram Discharge Volume High Level
The scram discharge volume receives water displaced by control rod drives piston motion during a reactor scram. A high scram discharge volume high-level reactor trip is provided to ensure that the scram discharge volume would be able to accept the water volume associated with a reactor scram. Without such a limit, the scram discharge volume could fill with water to a level such that it could not accommodate the water from a reactor trip; thus, a required reactor trip could be hindered.
Seismic Activity
US nuclear power plants do not typically include a direct input to the reactor protection system for seismic monitors. Some foreign reactors, including the Fukushima Daiichi units, do [4]. However, seismic activity can cause movement of core components, resulting in nuclear instrumentation sensing oscillatory flux profiles that could trigger a reactor trip [22].
2.2.2 Engineered Safety Features Actuation/Control/Monitoring Instrumentation
ESFs are provided in nuclear plants to mitigate the consequences of DBAs (e.g., loss of coolant accidents [LOCAs]). The ESF actuation system monitors selected parameters and determines whether the safety limits for those parameters are exceeded. Depending on which parameters are exceeded, certain safety systems are actuated to protect the reactor core and containment integrity. The system consists of logic circuitry, sensors, transmitters, processors, cables, and operator indicators, controls, and interface hardware. The following subsections list typical safety systems for US BWR/4-Mark I reactors. Japanese reactors are similar.
Plant instrumentation, monitoring, and control systems are used to manage operation of various systems, inform operators of the status of systems, and provide assurance that the complex systems of the facility are working correctly. They show that the plant is in compliance with regulations regarding release limits of radioactive materials and associated toxic chemicals (such as for water treatment). They also can respond in a protective manner to isolate release of the various materials or to isolate and protect personnel from their effects, for example, to isolate control room ventilation upon detection of a chlorine gas release. This section also includes monitoring systems that are important for ensuring that adequate data are available to inform plant operators about the status of plant conditions and guide potential accident mitigation or other responses. Instrument systems important for the performance of ESF equipment will be noted as necessary, such as control systems for coolant injection systems.
2.2.2.1 Parameters Monitored/Instrumentation Principles
The BWR ESFs actuation system monitors a number of parameters and actuates safety systems when various settings are reached. The system is characterized as a redundant, diverse, and defense-in-depth system. Designers want to ensure that an actuation occurs when needed but also strive to eliminate unwanted actuations. Typically, multiple sensors feed multiple channels. An actuation signal requires conditions to be met for the same parameter from different sensors in multiple channels. Designers also recognize that parameter values can change depending on plant conditions. For example, changes in coolant flow rates, temperatures, and pressures can vary depending on the plant power level. Therefore, like the reactor protection system, the ESF actuation system is a complicated system.
11
Key ESF actuation parameters are associated with core cooling, maintaining containment integrity, and initiating emergency power systems. Reactor vessel low level actuates at various level indications to initiate core cooling systems and equipment: automatic depressurization system (ADS), primary containment isolation system (PCIS), high-pressure coolant injection (HPCI), reactor core isolation cooling (RCIC) for the BWR/4 (IC for the BWR/3), core spray, and low-pressure coolant injection system (LPCI). As a response against a possible energy release to containment, the standby gas treatment system (SBGTS) also starts on low reactor vessel water level. As a response to help ensure that potential emergency core cooling systems (ECCSs) have electric power to respond as required, the EDGs receive a start signal on low reactor vessel water level.
The SBGTS also receives an actuation signal on high containment pressure.
Diesel generators receive an actuation signal based on low emergency bus voltage levels.
2.2.2.2 Re-Criticality Protection (Standby Liquid Control System)
The standby liquid control (SLC) system provides a means of shutting down the reactor from rated power operation by injecting boron in the form of sodium pentaborate into the reactor vessel. This system is used only in the unlikely event that the control rods cannot be inserted into the reactor core. If this system is needed, sodium pentaborate is pumped from its storage tank into the reactor vessel, where it mixes with the reactor coolant. The boron absorbs thermal neutrons and thereby terminates the nuclear fission chain reaction.
2.2.2.3 Core Flooding and Emergency Core Cooling Systems
Core flooding systems provide or promote core cooling by injecting cold water into the reactor vessel and core or depressurize the reactor to help remove heat and lower system pressure so that high-capacity low-pressure injection systems can function.
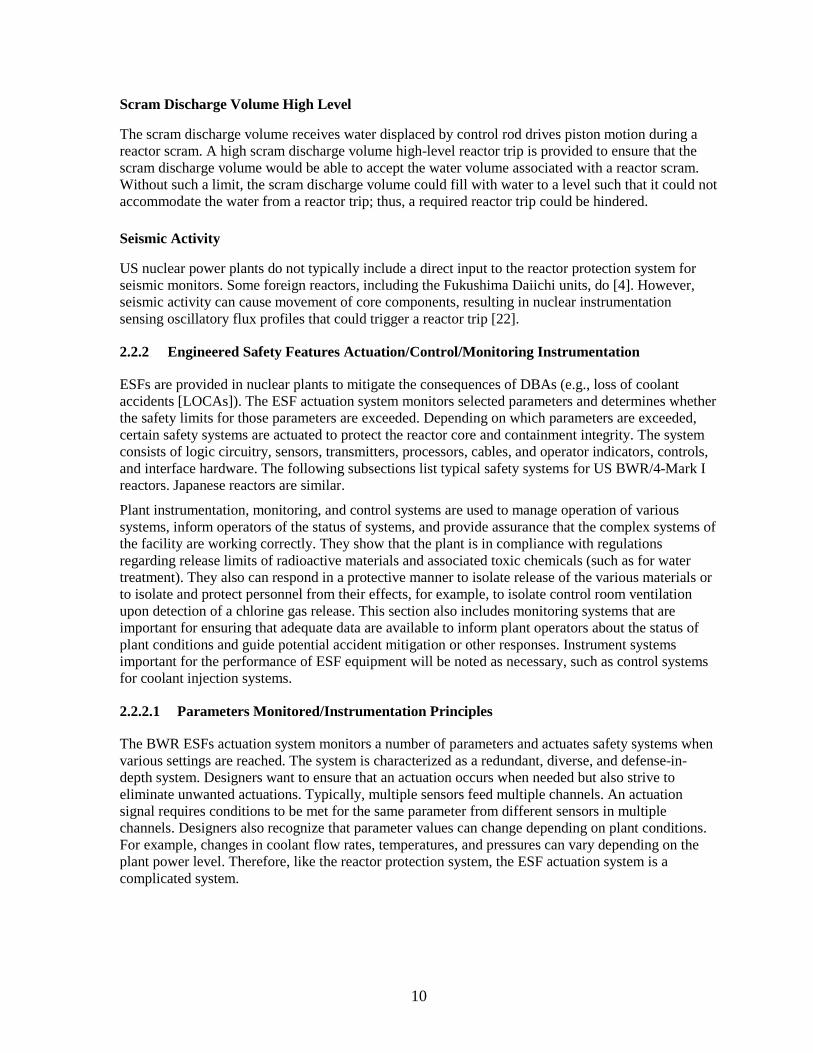
Reactor Core Isolation Cooling (BWR/3)
The reactor core isolation cooling (RCIC) system shown in Fig. 3 provides high-pressure cooling water flow (~100–140 m3/h) to the reactor vessel following a reactor shutdown and isolation to prevent damage to the reactor core. The reactor isolation stops the normal flow of feed water. The RCIC system uses reactor steam to power a turbine-driven pump to supply cold water preferentially from the condensate storage tank (CST) to the reactor vessel through the feed water piping to maintain an acceptable vessel water level. The steam discharges to the S/P. The system is typically used to cool the reactor fuel and lower vessel pressure to a point at which shutdown cooling water systems can be used.
The I&C system on the RCIC system manages system operation by monitoring system pressure, turbine speed, system flow, control and isolation valve positions, etc. Failure of the I&C system typically results in loss of the system. Because the system is turbine driven, it does not require off-site or on-site electrical power as long as battery-based vital ac electrical power is available to power system I&C equipment and valve positioning (It should be noted that the RCIC system at Fukushima Daiichi Unit 2 unexpectedly continued to function without control power for about 3 days—see the Unit 2 event response in Section 4.2.2.2).
12
Fig. 3. Reactor Core Isolation Cooling system [23].
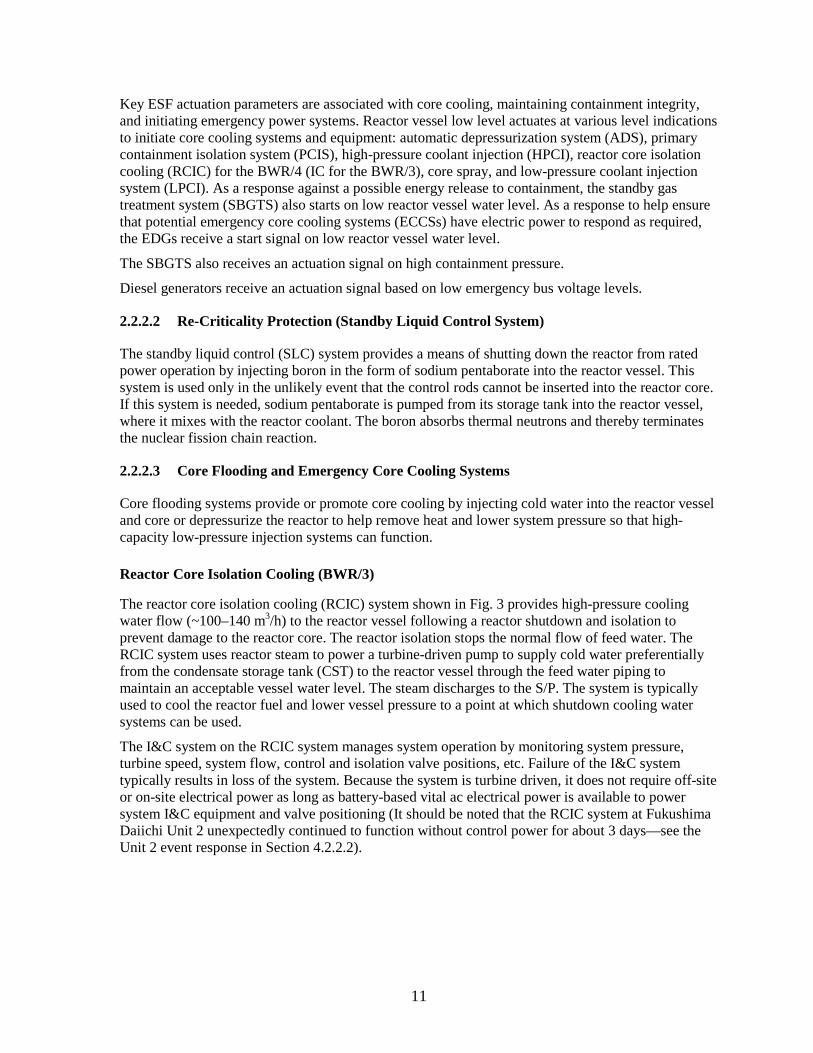
IC System
The IC system (Fig. 4) provides cooling for the reactor in the event that feed water capability is lost and heat removal systems that require ac electrical power for operation are not available. The IC system is a closed system that removes reactor decay heat but conserves reactor water inventory. It operates by natural circulation without the need for driving power, other than the dc electrical system used to place the system in operation. When the IC is in operation, steam flows up from the reactor through the tubes of the condenser where it is condensed. The condensate returns by gravity to the reactor. The IC is placed in operation by opening the closed condensate return valve to the recirculation water system. During operation, the water on the shell side of the condenser will boil and vent to the atmosphere while condensing steam from the reactor inside the tube bundles. Makeup water to the shell side of the IC can be from many sources, including the fire protection system if needed.
13
Fig. 4. Isolation Condenser system [23].
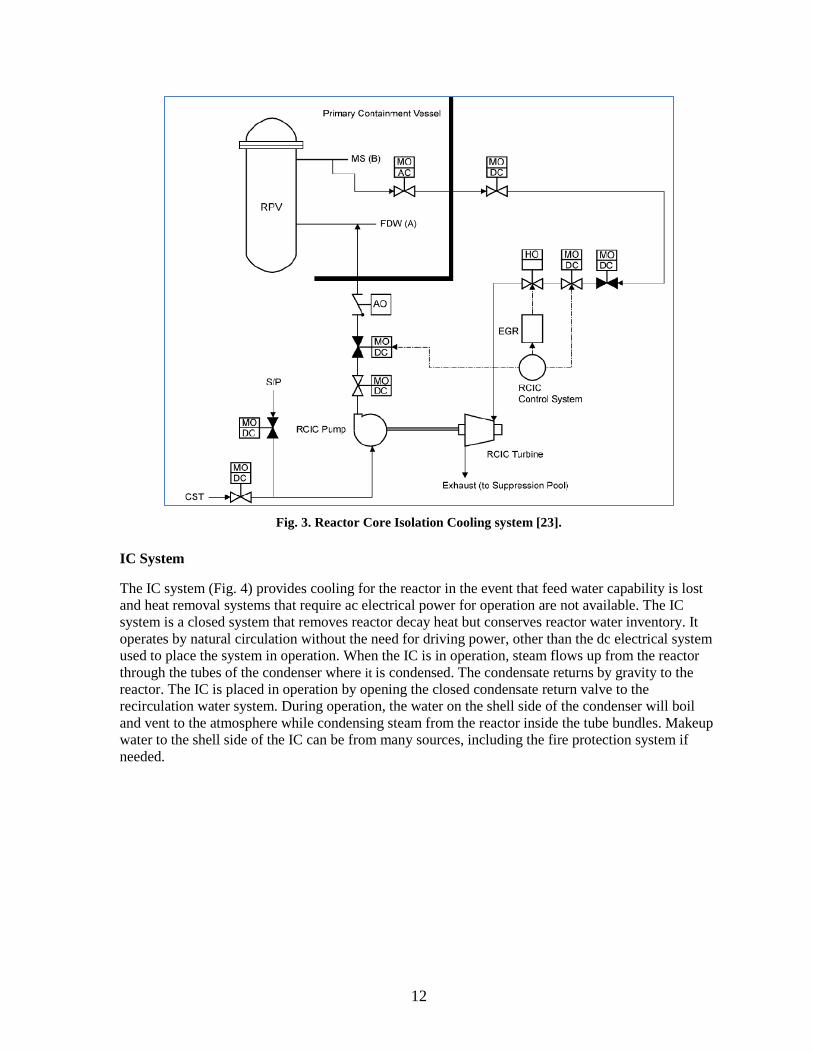
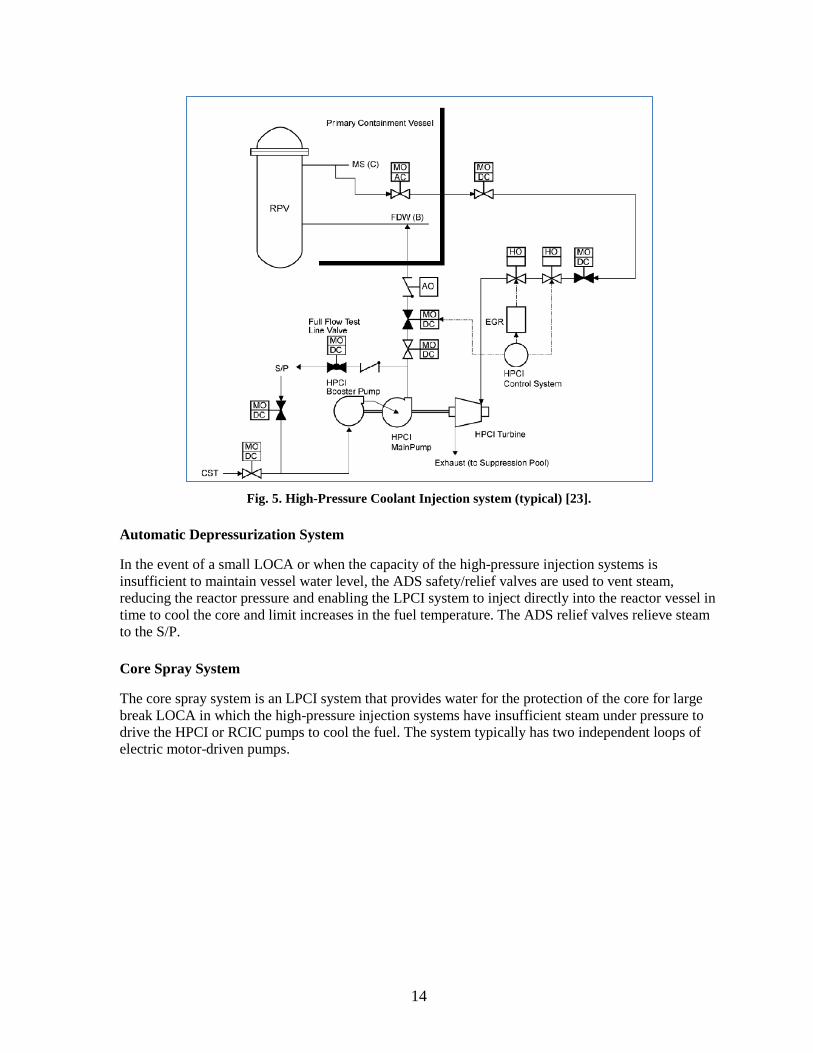
High-Pressure Coolant Injection
The HPCI system shown in Fig. 5 uses a high-pressure steam-driven pump to provide high-pressure emergency core cooling capability. The flow rate (~1000–1400 m3/h) of the system will keep the reactor core adequately cooled until the reactor pressure drops sufficiently to permit the low-pressure core cooling systems to inject into the reactor. The HPCI system is automatically started on either a low-low water level in the reactor or a high D/W pressure. The normal supply of demineralized makeup water is from the CST. The S/P is an alternate source of water. Steam supplied by the MS system drives the turbine and is condensed in the S/P.
The I&C system on the HPCI system manages system operation by monitoring system pressure, turbine speed, system flow, control and isolation valve positions, etc. Failure of the I&C system typically results in loss of the system. Because the system is turbine driven, it does not require off-site or on-site electrical power as long as battery-based dc electrical power is available to power system I&C equipment and valve positioning.
14
Fig. 5. High-Pressure Coolant Injection system (typical) [23].
Automatic Depressurization System
In the event of a small LOCA or when the capacity of the high-pressure injection systems is insufficient to maintain vessel water level, the ADS safety/relief valves are used to vent steam, reducing the reactor pressure and enabling the LPCI system to inject directly into the reactor vessel in time to cool the core and limit increases in the fuel temperature. The ADS relief valves relieve steam to the S/P.
Core Spray System
The core spray system is an LPCI system that provides water for the protection of the core for large break LOCA in which the high-pressure injection systems have insufficient steam under pressure to drive the HPCI or RCIC pumps to cool the fuel. The system typically has two independent loops of electric motor-driven pumps.
15
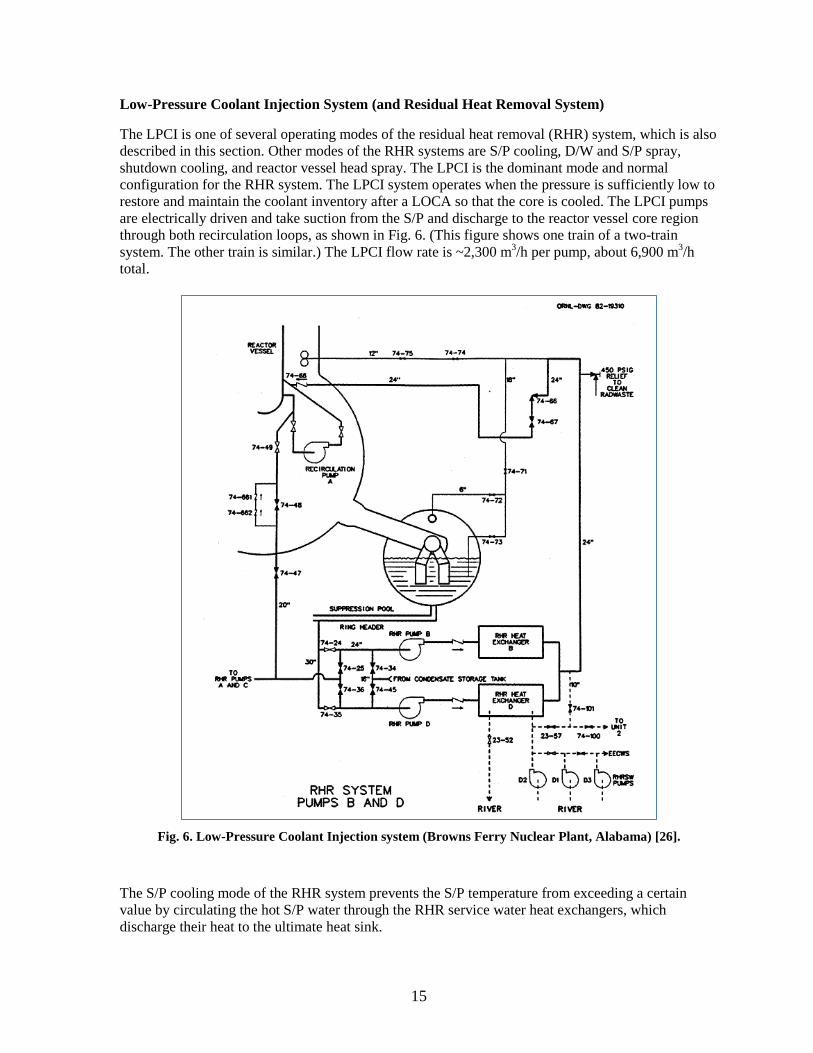
Low-Pressure Coolant Injection System (and Residual Heat Removal System)
The LPCI is one of several operating modes of the residual heat removal (RHR) system, which is also described in this section. Other modes of the RHR systems are S/P cooling, D/W and S/P spray, shutdown cooling, and reactor vessel head spray. The LPCI is the dominant mode and normal configuration for the RHR system. The LPCI system operates when the pressure is sufficiently low to restore and maintain the coolant inventory after a LOCA so that the core is cooled. The LPCI pumps are electrically driven and take suction from the S/P and discharge to the reactor vessel core region through both recirculation loops, as shown in Fig. 6. (This figure shows one train of a two-train system. The other train is similar.) The LPCI flow rate is ~2,300 m3/h per pump, about 6,900 m3/h total.
Fig. 6. Low-Pressure Coolant Injection system (Browns Ferry Nuclear Plant, Alabama) [26].
The S/P cooling mode of the RHR system prevents the S/P temperature from exceeding a certain value by circulating the hot S/P water through the RHR service water heat exchangers, which discharge their heat to the ultimate heat sink.
16
The D/W and S/P sprays prevent overpressurization of the containment following a LOCA. Water is pumped by motor-driven pumps from the S/P, where it is cooled in the RHR heat exchangers to spray headers where they discharge to the D/W or S/P. Sprays cool and condense steam in the D/W and thereby lower D/W pressure. S/P sprays cool gases that collect in the free volume above the pool.
The shutdown cooling mode of the RHR system removes heat generated by the reactor core after the reactor has been shut down by circulating reactor water through the RHR heat exchangers. Part of this flow may be diverted to a spray nozzle in the reactor vessel head volume to condense steam generated by the reactor vessel walls and internals.
Control Rod Drive Cooling Water System
Although not an ECCS system, the control rod drive hydraulic system can provide flow in excess of the control rod drive seal cooling requirements to provide emergency, high-pressure makeup water to the reactor vessel—typically 10–15 m3/h and higher (~45 m3/h) if the operators align the system to optimize flow.
2.2.2.4 Containment Integrity
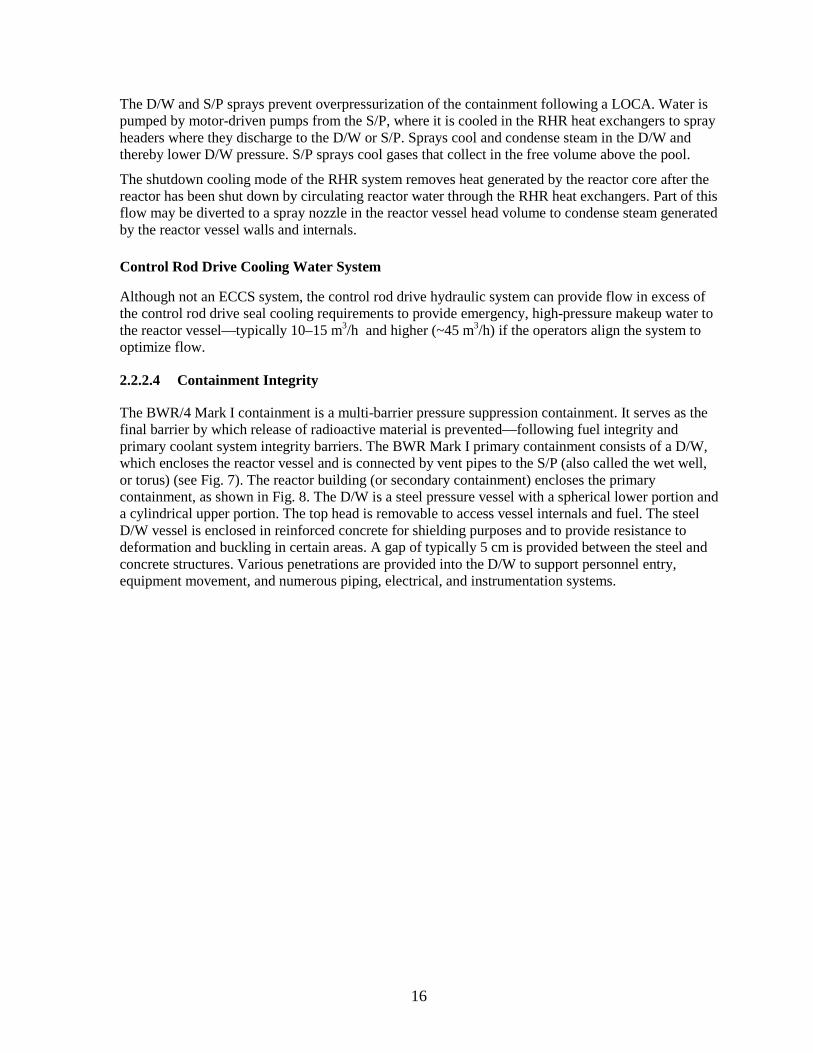
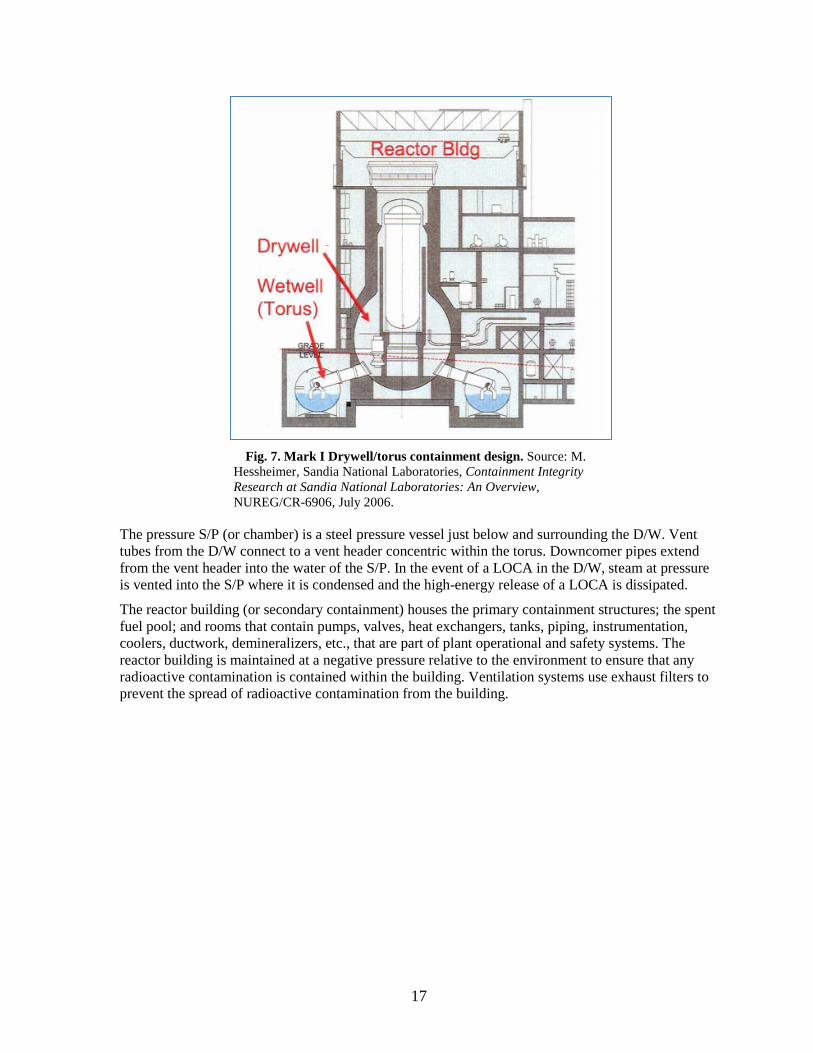
The BWR/4 Mark I containment is a multi-barrier pressure suppression containment. It serves as the final barrier by which release of radioactive material is prevented—following fuel integrity and primary coolant system integrity barriers. The BWR Mark I primary containment consists of a D/W, which encloses the reactor vessel and is connected by vent pipes to the S/P (also called the wet well, or torus) (see Fig. 7). The reactor building (or secondary containment) encloses the primary containment, as shown in Fig. 8. The D/W is a steel pressure vessel with a spherical lower portion and a cylindrical upper portion. The top head is removable to access vessel internals and fuel. The steel D/W vessel is enclosed in reinforced concrete for shielding purposes and to provide resistance to deformation and buckling in certain areas. A gap of typically 5 cm is provided between the steel and concrete structures. Various penetrations are provided into the D/W to support personnel entry, equipment movement, and numerous piping, electrical, and instrumentation systems.
17
Fig. 7. Mark I Drywell/torus containment design. Source: M.
Hessheimer, Sandia National Laboratories, Containment Integrity Research at Sandia National Laboratories: An Overview, NUREG/CR-6906, July 2006.
The pressure S/P (or chamber) is a steel pressure vessel just below and surrounding the D/W. Vent tubes from the D/W connect to a vent header concentric within the torus. Downcomer pipes extend from the vent header into the water of the S/P. In the event of a LOCA in the D/W, steam at pressure is vented into the S/P where it is condensed and the high-energy release of a LOCA is dissipated.
The reactor building (or secondary containment) houses the primary containment structures; the spent fuel pool; and rooms that contain pumps, valves, heat exchangers, tanks, piping, instrumentation, coolers, ductwork, demineralizers, etc., that are part of plant operational and safety systems. The reactor building is maintained at a negative pressure relative to the environment to ensure that any radioactive contamination is contained within the building. Ventilation systems use exhaust filters to prevent the spread of radioactive contamination from the building.
18
Fig. 8. Secondary containment. Source: US NRC, www.nrc.gov/reading-
rm/basic-ref/teachers/03.pdf.
Containment Isolation
The containment isolation system provides a means for isolating connection and interaction of systems and piping in the primary reactor systems within containment from systems and piping outside of containment. One of its purposes is to ensure that reactor coolant is retained in the reactor vessel in the event of a pipe break outside of containment. Another purpose is to ensure that radioactive materials resulting from an accident are not released to the outside environment. Various conditions result in containment isolations. Depending on the conditions, containment isolation valves for numerous systems close. Isolation valves for safety systems might open (or remain open) to permit these systems to function. Ventilation dampers might close and others might open, allowing ventilation under certain conditions but through various filtering systems. Containment isolation is also maintained through the use of numerous seals on penetrations for electrical cables, doorways, etc. All are designed for environmental conditions (e.g., temperatures, pressures, humidity, radiation levels, vibration, length of time) predicted for DBAs.

19
Containment Venting
The SBGTS maintains secondary containment at negative pressure relative to the environment through use of electrically powered fans in order to provide a controlled, filtered, elevated release via the plant stack. This minimizes radioactive releases to the environment. This system is a safety system, so redundancy is provided for the system functions.
In addition, BWR Mark I containments typically have a hardened vent that directly connects the primary containment with the plant stack. This vent provides a means for relieving containment pressure in a controlled manner in the event of a severe accident (such as an SBO during which electrically powered cooling water pumps are inoperable) during which the containment is pressurized and for which normal containment pressure suppression systems (e.g., S/P, D/W spray) are not available. (NRC Order EA-13-1094 issued on June 6, 2013, requires all US plants with Fukushima-style containments to implement requirements for reliable hardened containment vents capable of operating under severe accident conditions at their facilities.)
Containment Cooling
During normal operation, the temperature of the D/W is maintained by multiple cooling units. Fans circulate D/W air through the coolers. Heat is rejected from the coolers to the reactor building closed cooling water system. Containment cooling functions during accident conditions are provided by water sprays to the D/W and S/P from the RHR system described in Sect. 2.2.2.3.
2.2.2.5 Electrical Power Systems
The purpose of the electrical systems is to provide power to operate the plant and to ensure that it is safely maintained in a shutdown condition when required. Power is provided by multiple, redundant, off-site, high-voltage power lines through which the plant also transmits power when it is operating. Multiple off-site power lines help to ensure that off-site power is available in the event of a failure or outage affecting one or more other lines. In the event of a loss of all off-site power, EDGs provide backup ac electrical power. Multiple, independent trains of emergency on-site ac electrical generation are provided. In addition, dc electrical systems provide power for instrumentation, control, and monitoring functions that require highly reliable power.
On-Site AC Power Systems
The ac electrical power systems provide power to plant equipment required for normal plant operations and to ensure that the reactor can be rapidly and safely shutdown and cooled, if required. High-voltage lines connect the plant to the power grid. Connections are made to multiple diverse sections of the power grid to ensure that a disturbance on one line for one part of the grid does not negatively affect all lines. The lines are capable of being quickly reconfigured or realigned to accommodate problems. Various power lines, cables, bus work, transformers, circuit breakers, protective relays, and switchgear route the power as needed. Normal auxiliary and alternate systems are provided to help ensure that power from the power grid can be provided to the plant.
Transformers reduce voltage to power large motors and loads requiring medium voltage (e.g., 4160 V). Voltage is stepped down further to power low-voltage equipment (e.g., 480 or 120 V).
4 US NRC Order Eq-13-109, Issuance of Order to Modify Licenses with regard to Reliable Hardened Containment Vents Capable of Operation under Severe Accident Conditions, June 6, 2013, NRC ADAMS Accession Number ML13143A321.pdf.
20
The systems are designed with redundancy and independence to ensure that single failures of equipment do not cause a complete loss of a system. Circuits typically can be automatically or manually realigned or reconfigured to route around failed equipment.
Safety system loads are powered from safety buses. If safety bus voltage drops then RDGs automatically start to repower those buses. Connections to normal bus power supplies are dropped and loads important to safety are reloaded by load sequencers to the safety buses.
DC Power Systems
The dc power systems provide a highly reliable power supply to loads required by the reactor protection, ESF actuation, emergency core cooling, containment isolation, alarms, communications, lighting, and radiation monitoring systems. The dc power system loads are normally provided from ac-powered battery chargers that are connected to a battery bank. Multiple trains provide redundancy. In the event off-site ac power is lost, emergency on-site diesel generators will power the battery chargers. If all ac electrical power is lost, the battery banks support dc bus loads until ac electrical power is restored or the batteries are exhausted.
2.2.3 Important Support and Service Systems
Several other systems are employed in BWRs to support normal and emergency plant conditions. These systems transfer heat from primary systems to the ultimate heat sink, ensure that operating environments for personnel meet habitability requirements, and control and extinguish fires. They frequently serve as buffer systems between a system in potential contact with radioactive materials and systems with direct contact with the environment.
2.2.3.1 Component Cooling Water
The component cooling water system, sometimes called the reactor building closed cooling water system, is an intermediate heat sink for heat removal of potentially radioactive heat loads during normal and emergency conditions. It supplies cooling water to various equipment in the plant and provides a barrier to limit potential releases of radioactive materials to the environment.
2.2.3.2 Station Service Water
The service water system is an open system and uses water from the environment to service or cool various plant equipment or to cool an intermediate loop cooling water system.
The RHR service water system provides raw water to the RHR heat exchangers and provides standby core cooling. The RHR service water system provides water to the emergency cooling water system that supplies cooling water required for operation of the safety-related core spray system, RHR system, and diesel generator system. It also provides cooling water to the control room air-conditioning system, reactor building closed cooling water system, and station service air compressors.
2.2.3.3 Circulating Water System/Ultimate Heat Sink
The circulating water system provides a means for rejecting heat from the main condenser to the environment. The RHR service water system pumps take suction from the circulating water system intake structure. The RHR service water system is therefore a safety system.

21
2.2.3.4 Fire Protection System
The high-pressure fire protection system provides a source of relatively high-pressure raw water for fixed water spray or fog for certain equipment and to fire hydrants and hoses. Water can also be stored in elevated tanks.
2.2.3.5 Building Habitability Control and Monitoring
The environment in certain buildings and areas in the plant must remain habitable to ensure that plant operators are adequately protected against releases of toxic or radioactive gases. Safety-related equipment must also be maintained within certain environmental limits, such as temperature or adequate ventilation, to ensure that it will satisfy its mission requirements.
2.2.3.6 Essential Compressed Air System
The essential compressed air system supplies dry, filtered air to safety-related systems and components.
2.2.4 Accident Monitoring
US regulations [25] require that plants have the I&C systems necessary to monitor variables and systems over all anticipated ranges for accident conditions, provide a control room where actions can be taken to maintain the plant in a safe condition during accident conditions, and provide a means for monitoring radioactive releases as a result of an accident. Revision 4 of NRC Regulatory Guide (RG) 1.97, Criteria for Accident Monitoring Instrumentation for Nuclear Power Plants, describes a method that the NRC considers acceptable for complying with the agency’s regulations pertaining to accident monitoring instrumentation through endorsement of Institute of Electrical and Electronics Engineers Standard 497-2002 (with certain clarifying regulatory positions). This standard was written in part to provide a “consolidated source of post-accident monitoring requirements and bases for a new generation of advanced nuclear plant designs.” It replaced a more prescriptive approach from Revision 3 of NRC RG 1.97, which provided a specific list of instrument variables to monitor. Given that the BWR/3-Mark I and BWR/4-Mark I plants are mature designs and were in use at the time RG 1.97 Revision 3 was issued (1983), these variables will be highlighted in this section as being typical of those needed for accident monitoring, recognizing that this guidance has been superseded and might be based on the variables appropriate to specific accident response requirements.
Variables to be monitored were broken into several categories and then into specific types of variables listed for each category. The various categories and variables within the categories are described in the following sections. Note that variables can be in multiple categories.
2.2.4.1 Reactivity Control
Variables associated with neutron flux (from 10-6 to 100% full power) are control rod position (full in or not full in) and reactor coolant system soluble boron concentration grab sample.
2.2.4.2 Core Cooling
Variables associated with core cooling are reactor vessel water level (from the bottom of the core support plate to the lesser of the top of the vessel or the centerline of the steam line), reactor core temperature (a provision considered in the early 1980s), RCIC flow (from 0 to 110% design flow), HPCI flow (from 0 to 110% design flow), core spray system flow (from 0 to 110% design flow), LPCI system flow (from 0 to 110% design flow), SLC system flow (from 0 to 110% design flow), RHR system flow (from 0 to 110% design flow), and RHR heat exchanger outlet temperature (from ~5 to 180°C).
22
Variables specifically associated with fuel cladding are radioactivity concentration or radiation level in circulating primary coolant (from 50% to 100 × technical specification limit) and gamma spectrum analysis of primary coolant (from 10 µCi/mL to 10 Ci/mL or TID-14844 source term5 in coolant volume).
2.2.4.3 Reactor Coolant System Pressure Boundary Integrity
Variables associated with reactor coolant system pressure boundary integrity are reactor coolant system pressure (from 0 to 145 mPa), D/W pressure (from 0 to design pressure), D/W sump level (top to bottom), primary containment area radiation (from 0.01 to 100 Sv/h [1 to 105 R/h]), and S/P water level (from bottom of ECCS suction line to 1.5 m above normal water level).
2.2.4.4 Containment Integrity and Containment Radiation
Variables associated with containment integrity are primary containment pressure (from about -35 kPa psig to 4 times design pressure [for steel] and from about -35 to -20 kPa narrow range), S/P water level (from top of vent to top of weir well), S/P water temperature (~4–110°C), D/W atmosphere temperature (~4–230°C), D/W spray flow (0–110% design flow), primary containment isolation valve position (closed/not closed—excluding check valves), D/W hydrogen concentration (from 0 to 30 vol %, from about -35 kPa to design pressure), containment effluent radioactivity from release points including standby gas treatment vent (from 10-6 10-2 µCi/cc), effluent radioactivity from buildings or areas where penetrations or hatches in direct contact with primary containment are located (from 10-6 to 103 µCi/cc), primary containment area radiation-high range (from 1 to 107 R/h), and reactor building or secondary containment area radiation (from 10-1 to 104 R/h for Mark 1 containments).
2.2.4.5 Condensate and Feed Water System
Variables associated with the condensate and feed water system are main feed water flow (0–110% design flow) and CST level (from top to bottom).
2.2.4.6 MS System
Variables associated with the MS system are MS line isolation valve leakage control system pressure (~0–380 mm water narrow range and ~0–35 kPa wide range) and primary system pressure relief valve and ADS valve positions.
2.2.4.7 Cooling Water System
Variables associated with cooling water systems are cooling water temperature to ESF system components (~4–95°C) and cooling water flow to ESF system components (0–110% design flow).
2.2.4.8 Radioactive Waste Systems
A variable associated with the radioactive waste systems is the high-radioactivity liquid tank level (from top to bottom).
5 In 1962, the US Atomic Energy Commission published TID-14844, Calculation of Distance Factors for Power and Test Reactors, which specified a source term for a substantial meltdown of a reactor core.

23
2.2.4.9 Ventilation Systems
A variable associated with ventilation systems is emergency ventilation system damper position (open-closed status).
2.2.4.10 Power Supplies
Variables associated with the status of standby power and other energy sources important to safety (e.g., electric, hydraulic, and pneumatic) voltages, currents, pressures, etc., are plant specific.
2.2.4.11 Area Radiation
A variable associated with area radiation monitoring is the radiation exposure rate inside buildings or areas where access is required to service equipment important to safety (from 10-1 to 104 R/h).
2.2.4.12 Airborne Radioactive Materials Released from Plant
Variables associated with monitoring airborne radioactive noble gases released from the plant are D/W purge and standby gas treatment purge (from 10-6 to 105 µCi/cc for 0 to -110% vent design flow), secondary containment purge (from 10-6 to 104 µCi/cc for 0 to -110% vent design flow), auxiliary buildings containing primary system gases such as decay tanks (from 10-6 to 103 µCi/cc for 0 to 110% vent design flow), and common plant vent (from 10-6 to 103 µCi/cc for 0 to 110% vent design flow).
Variables are associated with monitoring airborne radioactive particulates or halogens from all identified plant release points (from 10-6 to 102 µCi/cc for 0 to 110% vent design flow).
2.2.4.13 Environs Radiation and Radioactivity
Variables are associated with airborne radiohalogens and particulates (portable sampling—from 10-9 to 10-3 µCi/cc), plant and environs radiation (portable instrumentation—from 10-2 to 105 mGy, photons; 10-2 to 105 mGy, beta radiation and low-energy photons).
2.2.4.14 Meteorology
Variables associated with meteorology include wind direction (0–360°), wind speed (0–22 mps), and estimation of atmospheric stability based on the vertical temperature difference from the primary meteorological system.
2.2.4.15 Accident Sampling
Variables associated with primary coolant and sump sampling are gross activity (from 1 to 10 Ci/cc), gamma spectrum (isotopic analysis), boron content (0–1000 ppm), chloride content (0–20 ppm), dissolved hydrogen or total gas (0–2000 cc(STP)/kg), dissolved oxygen (0–20 ppm), and pH (1–13).
Variables associated with containment air sampling are hydrogen content (0–10 vol %, 0–30 vol % for inerted containments), oxygen content (0–30 vol %), and gamma spectrum (isotopic analysis).
2.2.5 Reactor Vessel Temperature
A number of thermocouples (46 for one representative BWR vessel) measure reactor vessel temperature to monitor various vessel components to assess vessel stresses during heat-up and cooldown.

25
3. REPRESENTATIVE SEVERE ACCIDENT RESEARCH: PARAMETER NEEDS AND INSTRUMENTATION PERFORMANCE
This section briefly describes representative early research activities that highlighted instrumentation needs and vulnerabilities in severe accidents. It is provided to highlight some of the instrumentation deemed particularly valuable to plant operations staff, to identify information needs not available during severe accidents, and to identify particular instrumentation vulnerabilities that were noted at the time of the research activities.
Plant I&C systems are designed to provide necessary information to the reactor protection system, ESF actuation system, and operator information needs in the control room so that the plant is shutdown and cooled under normal operational transients and accident conditions. These instrumentation systems are designed with principles of redundancy, diversity, and defense in depth to ensure their availability and performance. They are necessary to inform and guide operating staff in understanding the nature and ongoing consequences of events and challenges to the plant and to assess the performance and condition of automatic systems. Timely and accurate information is key to implementing correct actions to prevent serious events, reduce their consequences, and inform accident responses. Severe accidents can certainly be postulated that threaten the performance of the instrumentation systems and the plant systems, operator actions, and accident monitoring functions they support.
3.1 TYPES OF SEVERE ACCIDENTS
Many research activities were carried out regarding BWR severe accidents since the 1980s following the accident at TMI-2 in March 1979 [1]. Research examined accident scenarios including SBOs, small break LOCAs, loss of decay heat removal, and anticipated transient without scram (ATWS). These were representative of potentially risk-significant scenarios identified in early risk studies, such as the WASH-1400 Reactor Safety Study [27]. BWR severe accidents were subjects of extensive research conducted by the NRC, US Department of Energy (DOE), national laboratories, universities, and industry over a decades-long period. International institutions and organizations performed similar research as well.
3.2 ACCIDENT INFORMATION NEEDS
Evaluation of accident scenarios [28] in this early research, of which NUREG/CR-2182, Station Blackout at Browns Ferry Unit One—Accident Sequence Analysis, is an example, confirmed the vulnerability of instrumentation in severe accidents. That report assessed an SBO scenario (loss of all ac electrical power—dc electrical power systems function until battery depletion). The scenario moves to a severe accident with core damage when the battery-powered dc electrical system loses power and the ability to monitor plant conditions and implement certain functions necessary to inject water into the core is lost. Alternative dc electrical power sources could provide D/W temperatures and reactor vessel temperatures for a longer period, perhaps giving indication of core uncovery. Mechanical level indicators available locally in the reactor building could also provide information about pending core uncovery. Essentially all accident monitoring capabilities would be lost as remaining battery power is depleted.
The information needed to manage severe accidents for BWRs with a Mark I containment was examined by research in the 1991 time period noted in NUREG/CR-5702, Accident Management Information Needs for a BWR with a MARK I Containment [29].
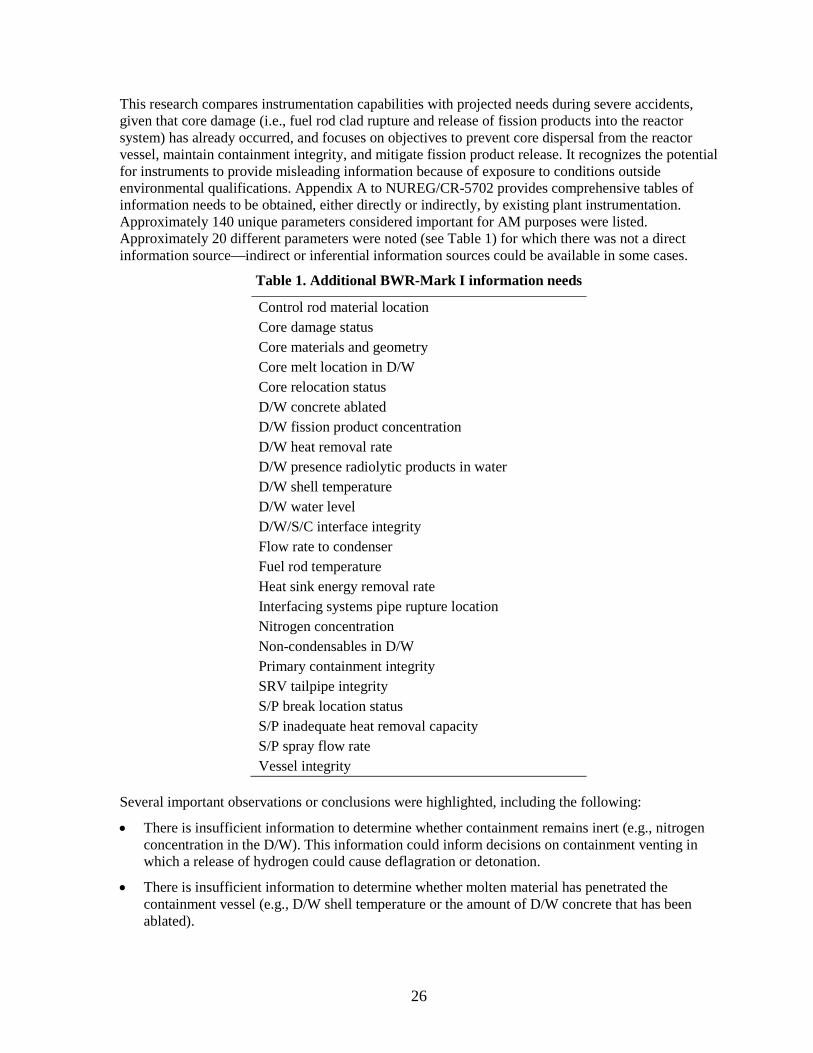
26
This research compares instrumentation capabilities with projected needs during severe accidents, given that core damage (i.e., fuel rod clad rupture and release of fission products into the reactor system) has already occurred, and focuses on objectives to prevent core dispersal from the reactor vessel, maintain containment integrity, and mitigate fission product release. It recognizes the potential for instruments to provide misleading information because of exposure to conditions outside environmental qualifications. Appendix A to NUREG/CR-5702 provides comprehensive tables of information needs to be obtained, either directly or indirectly, by existing plant instrumentation. Approximately 140 unique parameters considered important for AM purposes were listed. Approximately 20 different parameters were noted (see Table 1) for which there was not a direct information source—indirect or inferential information sources could be available in some cases.
Table 1. Additional BWR-Mark I information needs
Control rod material location Core damage status Core materials and geometry Core melt location in D/W Core relocation status D/W concrete ablated D/W fission product concentration D/W heat removal rate D/W presence radiolytic products in water D/W shell temperature D/W water level D/W/S/C interface integrity Flow rate to condenser Fuel rod temperature Heat sink energy removal rate Interfacing systems pipe rupture location Nitrogen concentration Non-condensables in D/W Primary containment integrity SRV tailpipe integrity S/P break location status S/P inadequate heat removal capacity S/P spray flow rate Vessel integrity
Several important observations or conclusions were highlighted, including the following:
• There is insufficient information to determine whether containment remains inert (e.g., nitrogen concentration in the D/W). This information could inform decisions on containment venting in which a release of hydrogen could cause deflagration or detonation.
• There is insufficient information to determine whether molten material has penetrated the containment vessel (e.g., D/W shell temperature or the amount of D/W concrete that has been ablated).
27
• There is insufficient information relative to two instruments to ensure containment integrity. The integrity of the safety relief valve (SRV) tailpipe is not measured. If the tailpipe fails, then the containment would be subject to elevated pressures. Information on tailpipe integrity would help AM personnel maintain containment integrity. This was noted to be an unlikely failure. Also, placing instruments to detect containment leakage would be difficult given the number and variety of containment penetrations. This was not considered practical.
• Eleven information needs could mislead AM personnel. Three were categorized as most important:
o Core relocation status: Although some indirect measurements do exist, unambiguous information regarding status of the core as core damage is occurring could be misleading.
o D/W and heat sink heat removal rates: The placement and interpretation of indirect measurements should be carefully examined as direct measurements were noted as not practical.
o Interfacing systems pipe rupture location: Responses to breaks or leaks—closing valves or flood break locations—depend on knowledge of where they occur. A leak detection system typically detects leaks in high-temperature systems and might not be effective for broad, changing conditions because of difficulty in determining actuation set points to detect small leaks without triggering false alarms.
A subsequent related report [2] specifically addressed instrument availability during severe accidents for a BWR with a Mark I containment. The report reiterates the necessity of timely and accurate information provided by plant instrumentation to monitor plant status and to guide preventive and mitigative actions. The objectives of this research included the identification of plant conditions that could affect instrument performance and information needs, definition of plant parameters for a broad range of accident sequences to assess instrumentation availability, and assessment of the availability of plant instrumentation during severe accidents. The assessment was based primarily on the environmental qualification limits, instrument ranges, and availability of backup power for the instruments.
An important assumption was that performance of any instrument would be considered degraded or failed if environmental qualifications (magnitude of condition and length of time) were exceeded or if the measured parameters were outside the instrument range. Erroneous readings could precipitate inappropriate operator actions or cause undesired changes in state of systems, such as erroneously starting or stopping.
The report included tables (Tables 5–6) that are repeated in the Appendix to this report. Table 5 in the Appendix is a list of instrumentation and its potential availability during a severe accident at the Peach Bottom plant pertinent to RG 1.97. Table 6 in the Appendix lists two instruments, reactor building temperature and reactor building pressure, that were not listed in RG 1.97. In these tables, Category 1 instruments are those that are fully environmentally qualified, are redundant, provide real-time display, and have standby power (not necessarily battery backup). Category 2 instrumentation meets less stringent qualifications—it might not be seismically qualified, might not have redundant continuous display, and might not have standby power. Category 3 instrumentation is the least stringent, being high-quality commercial-grade equipment powered only by off-site power. Table 6 is representative of Peach Bottom at the time of the report, which notes that loads and backup power sources can vary widely by plant.
28
The results from the excerpted tables in the Appendix can be summarized as follows:
• Severe conditions in the reactor system before core damage can potentially affect the availability of instruments for the following:
o Reactor pressure and water level.
o D/W pressure, sump level, spray flow rate, and atmosphere temperature.
o S/P water temperature, pressure, and spray flow rate.
o D/W and reactor building isolation valve position.
o Containment and D/W hydrogen and oxygen concentration.
o Containment area radiation.
o SLC system pressure and storage tank level.
o SRV position or flow.
o RCIC, HPCI, core spray, LPCI, and RHR flow.
o RCIC and HPCI room temperature.
o RHR heat exchanger outlet temperature.
o Vent stack monitoring (if there are severe conditions in the reactor building).
o Status of power (electrical and other).
• Severe conditions after core damage can potentially affect the availability of instruments for the following:
o Reactor pressure and water level.
o S/P water level and spray flow rate.
o D/W pressure and spray flow rate.
o Reactor building isolation valve position.
o Containment and D/W oxygen and hydrogen concentration.
o SLC system pressure and storage tank level.
o RCIC, HPCI, core spray, LPCI, and RHR flow.
o RCIC and HPCI room temperature.
o RHR heat exchanger outlet temperature.
o Vent stack monitoring.
o Status of power (electrical and other).
• Severe reactor building conditions can potentially degrade almost all of the accident monitoring requirements listed except (1) containment gas and reactor coolant grab sampling and (2) flow rates, tank levels, etc., from equipment located in the turbine building or outside of the reactor building.
29
The research concluded that pressure and temperature conditions, even before core damage, can greatly affect instrument availability for certain severe accidents. Problems with containment venting could lead to severe reactor building conditions (if hardened vents are not used, or have insufficient capacity, such as for ATWS conditions). Radiation exposure could affect instrument performance during a long-term accident. To summarize the conclusions:
• After the onset of core damage, neutron monitoring instrumentation temperature limits in the core will be exceeded and performance will degrade. Components of this system are also located in the D/W where pressures and temperatures above environmental qualification values could also degrade performance.
• D/W and torus conditions beyond qualification limits could degrade instrumentation located in the D/W and torus.
• Reactor vessel failure could create environmental conditions that degrade instrumentation located in the reactor vessel.
• Severe reactor building conditions resulting from containment failure or failures of non-hardened vents could affect instrumentation that monitors the reactor coolant system and containment.
It was noted that instrumentation that monitors the reactor coolant system and containment would be available until their power supplies (dc power with battery backup) were depleted or environmental limits were exceeded. Sampling systems might not be available during an SBO.
AM information needs were also being addressed internationally during this time. As an example of numerous international research results, a report describing severe accident instrumentation needs of the Finnish Teollisuuden Voima Oy BWR [30] noted the addition of instrumentation to:
• Indicate and alarm hardened vent rupture disk actuation.
• Indicate containment pressure, reactor pressure, water level inside the lower D/W, and D/W/wet well pressure difference to help prevent early containment failure.
• Indicate dose rate in D/W/wet well, water level in containment, and containment pressure to help control and limit releases.
• Indicate containment water level and pressure to help achieve a safe, stable state.
The instrumentation was to remain capable for 24 h following a loss of all ac power; withstand severe accident environmental conditions (including seismic); be provided in parallel, redundant channels; be safe from damage from molten core material; provide protection against sensing line damage from missile impacts; have transmitters located outside containment in rooms free from process system components; and provide measurement indications on a special emergency monitoring panel close to an emergency exit of the reactor building.

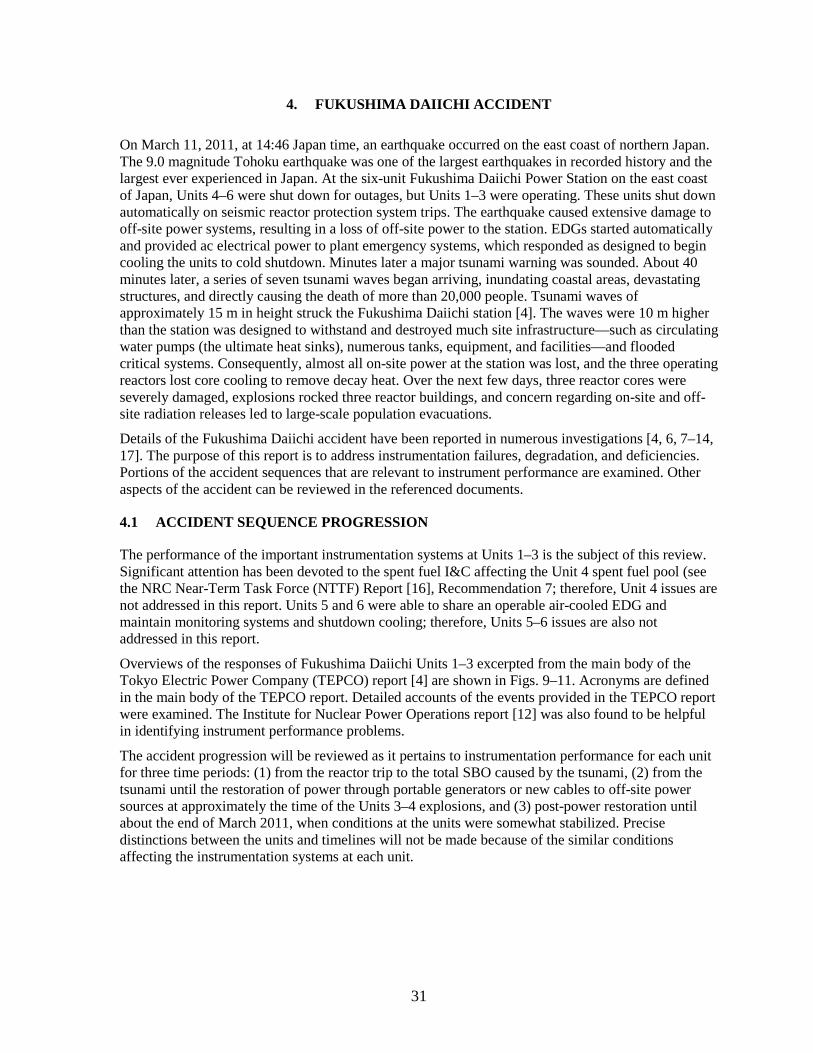
31
4. FUKUSHIMA DAIICHI ACCIDENT
On March 11, 2011, at 14:46 Japan time, an earthquake occurred on the east coast of northern Japan. The 9.0 magnitude Tohoku earthquake was one of the largest earthquakes in recorded history and the largest ever experienced in Japan. At the six-unit Fukushima Daiichi Power Station on the east coast of Japan, Units 4–6 were shut down for outages, but Units 1–3 were operating. These units shut down automatically on seismic reactor protection system trips. The earthquake caused extensive damage to off-site power systems, resulting in a loss of off-site power to the station. EDGs started automatically and provided ac electrical power to plant emergency systems, which responded as designed to begin cooling the units to cold shutdown. Minutes later a major tsunami warning was sounded. About 40 minutes later, a series of seven tsunami waves began arriving, inundating coastal areas, devastating structures, and directly causing the death of more than 20,000 people. Tsunami waves of approximately 15 m in height struck the Fukushima Daiichi station [4]. The waves were 10 m higher than the station was designed to withstand and destroyed much site infrastructure—such as circulating water pumps (the ultimate heat sinks), numerous tanks, equipment, and facilities—and flooded critical systems. Consequently, almost all on-site power at the station was lost, and the three operating reactors lost core cooling to remove decay heat. Over the next few days, three reactor cores were severely damaged, explosions rocked three reactor buildings, and concern regarding on-site and off-site radiation releases led to large-scale population evacuations.
Details of the Fukushima Daiichi accident have been reported in numerous investigations [4, 6, 7–14, 17]. The purpose of this report is to address instrumentation failures, degradation, and deficiencies. Portions of the accident sequences that are relevant to instrument performance are examined. Other aspects of the accident can be reviewed in the referenced documents.
4.1 ACCIDENT SEQUENCE PROGRESSION
The performance of the important instrumentation systems at Units 1–3 is the subject of this review. Significant attention has been devoted to the spent fuel I&C affecting the Unit 4 spent fuel pool (see the NRC Near-Term Task Force (NTTF) Report [16], Recommendation 7; therefore, Unit 4 issues are not addressed in this report. Units 5 and 6 were able to share an operable air-cooled EDG and maintain monitoring systems and shutdown cooling; therefore, Units 5–6 issues are also not addressed in this report.
Overviews of the responses of Fukushima Daiichi Units 1–3 excerpted from the main body of the Tokyo Electric Power Company (TEPCO) report [4] are shown in Figs. 9–11. Acronyms are defined in the main body of the TEPCO report. Detailed accounts of the events provided in the TEPCO report were examined. The Institute for Nuclear Power Operations report [12] was also found to be helpful in identifying instrument performance problems.
The accident progression will be reviewed as it pertains to instrumentation performance for each unit for three time periods: (1) from the reactor trip to the total SBO caused by the tsunami, (2) from the tsunami until the restoration of power through portable generators or new cables to off-site power sources at approximately the time of the Units 3–4 explosions, and (3) post-power restoration until about the end of March 2011, when conditions at the units were somewhat stabilized. Precise distinctions between the units and timelines will not be made because of the similar conditions affecting the instrumentation systems at each unit.

32
Fig. 9. Fukushima Daiichi Unit 1 event progression summary (TEPCO [4], p. 179).
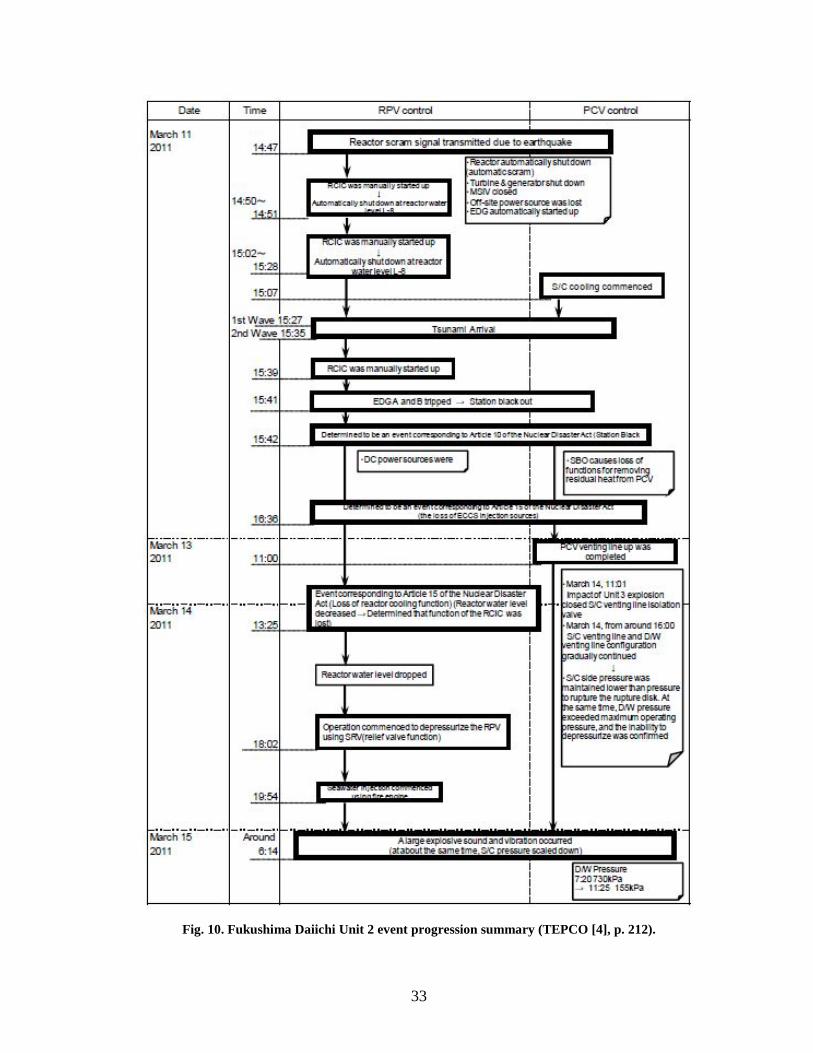
33
Fig. 10. Fukushima Daiichi Unit 2 event progression summary (TEPCO [4], p. 212).
34
Fig. 11. Fukushima Daiichi Unit 3 event progression summary (TEPCO [4], p. 237).
35
4.2 INSTRUMENTATION PERFORMANCE SUMMARY
The safety philosophy of today’s operating NPPs is based on principles of diversity, redundancy, and defense in depth to provide assurance that if there is a problem with the function of one safety system there is another effective means to accomplish the function of that system. These systems in today’s plants are active systems that depend on actuation of motors, turbines, pumps, relief valves, heat exchangers, coolers, etc., to enable core decay heat to be transferred from the core to the ultimate heat sink. I&C systems ensure that these systems are actuated as needed and perform within their design requirements (turbine speeds, pump flows, over-current/over-temperature protection, etc.). The earthquake and flooding from the tsunami knocked out all power to Units 1–4: off-site ac electrical power, emergency on-site ac electrical power, and on-site dc electrical power. (Note: Unit 3 retained dc electrical power for ~24 h.) Power for the motors, pumps, valves, coolers, etc., of the active systems was lost. Power to monitoring and control systems, control room displays and indicators, lighting, and communications was lost or significantly degraded. The ability to remove decay heat to cool the reactor cores was lost in spite of heroic attempts to connect temporary power sources and engineering workarounds. Gradually, and in an often piecemeal and sporadic fashion, operators reestablished some monitoring and indication functions at reactor building panels and in the control room. Valve manipulations in challenging reactor building locations were carried out with the aid of hand-carried batteries, electric generators, and bottled gas or air compressors.
4.2.1 Time Period: Earthquake to Tsunami
In summary, Units 1–3 responded as designed to the earthquake and its immediate consequences. The units scrammed on seismic readings as designed. As off-site ac electrical power systems were disabled by the earthquake, on-site EDGs started, loaded emergency buses, and powered safety-related cooling systems as designed. All plants were on expected paths to cold shutdown, as designed. Plant monitoring and I&C systems performed as designed. Operator actions were as expected. The response to this significant DBA was as designed.
For Unit 1, the IC controlled reactor pressure and removed decay heat. Reactor water level was maintained since the IC is a closed-loop system.
For Units 2–3, the steam-driven reactor core isolation cooling system maintained reactor vessel water level and removed decay heat by routing turbine exhaust steam to the S/P. S/P spray and cooling systems were started to remove this heat from the S/P to the ultimate heat sink.
4.2.2 Time Period: Tsunami to Reactor Building Explosions
About 40 minutes after the earthquake, the first of seven tsunami waves hit the site. Flood waters ~5 m above grade level inundated the first floors of the turbine buildings and service buildings, knocking out the EDGs, dc electrical power system batteries, and many power distribution panels in Units 1–4 . (Note: Unit 3 retained dc electrical power for ~24 h.) Motorized equipment was lost, as were monitoring instruments. Building and control room lighting was lost. Communications within and outside the plants’ control rooms were lost or degraded. Damage to the site was severe, greatly hindering recovery actions, as described by the various accounts of the accident and the account summaries [30].
During this time period, operators attempted to restore control room functions, monitor the plant to gain knowledge of important unit conditions, and reestablish core cooling and vent containment. Critical information needs during this time were RPV water level and pressure, D/W pressure, and S/P pressure. Critical control needs were the operability of high-pressure injection and cooling systems and the ability to depressurize the reactors and vent containment so that low-pressure injection systems could be established.
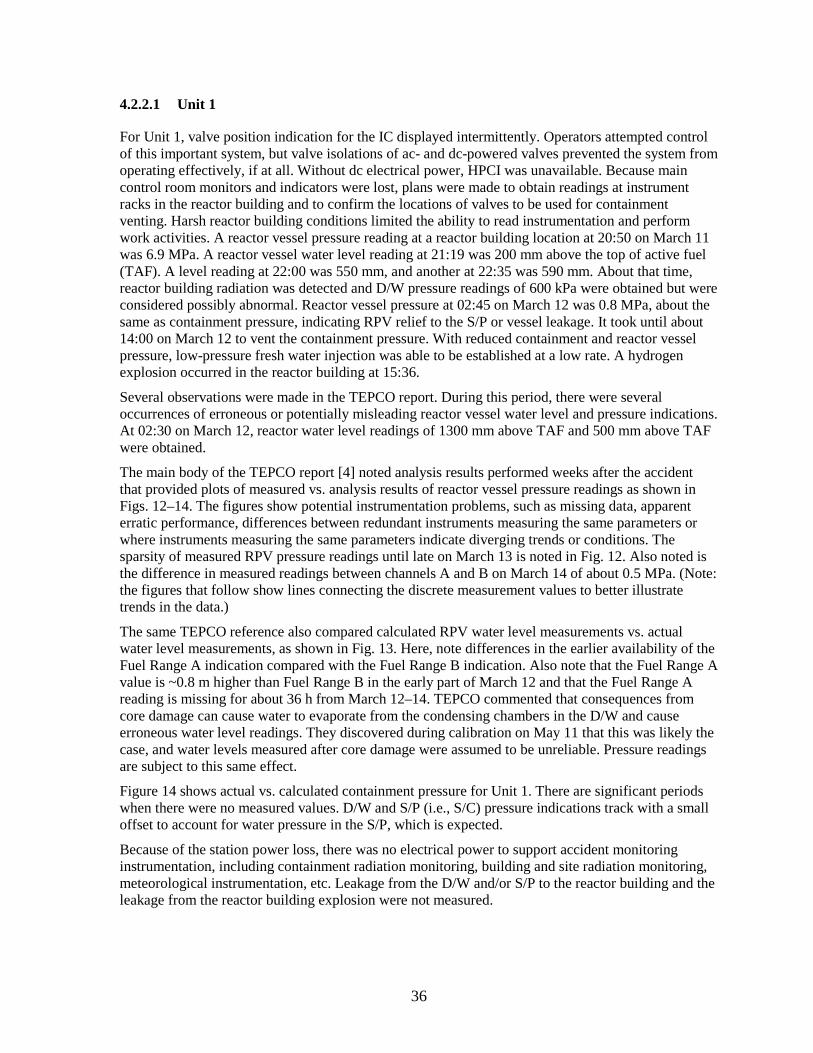
36
4.2.2.1 Unit 1
For Unit 1, valve position indication for the IC displayed intermittently. Operators attempted control of this important system, but valve isolations of ac- and dc-powered valves prevented the system from operating effectively, if at all. Without dc electrical power, HPCI was unavailable. Because main control room monitors and indicators were lost, plans were made to obtain readings at instrument racks in the reactor building and to confirm the locations of valves to be used for containment venting. Harsh reactor building conditions limited the ability to read instrumentation and perform work activities. A reactor vessel pressure reading at a reactor building location at 20:50 on March 11 was 6.9 MPa. A reactor vessel water level reading at 21:19 was 200 mm above the top of active fuel (TAF). A level reading at 22:00 was 550 mm, and another at 22:35 was 590 mm. About that time, reactor building radiation was detected and D/W pressure readings of 600 kPa were obtained but were considered possibly abnormal. Reactor vessel pressure at 02:45 on March 12 was 0.8 MPa, about the same as containment pressure, indicating RPV relief to the S/P or vessel leakage. It took until about 14:00 on March 12 to vent the containment pressure. With reduced containment and reactor vessel pressure, low-pressure fresh water injection was able to be established at a low rate. A hydrogen explosion occurred in the reactor building at 15:36.
Several observations were made in the TEPCO report. During this period, there were several occurrences of erroneous or potentially misleading reactor vessel water level and pressure indications. At 02:30 on March 12, reactor water level readings of 1300 mm above TAF and 500 mm above TAF were obtained.
The main body of the TEPCO report [4] noted analysis results performed weeks after the accident that provided plots of measured vs. analysis results of reactor vessel pressure readings as shown in Figs. 12–14. The figures show potential instrumentation problems, such as missing data, apparent erratic performance, differences between redundant instruments measuring the same parameters or where instruments measuring the same parameters indicate diverging trends or conditions. The sparsity of measured RPV pressure readings until late on March 13 is noted in Fig. 12. Also noted is the difference in measured readings between channels A and B on March 14 of about 0.5 MPa. (Note: the figures that follow show lines connecting the discrete measurement values to better illustrate trends in the data.)
The same TEPCO reference also compared calculated RPV water level measurements vs. actual water level measurements, as shown in Fig. 13. Here, note differences in the earlier availability of the Fuel Range A indication compared with the Fuel Range B indication. Also note that the Fuel Range A value is ~0.8 m higher than Fuel Range B in the early part of March 12 and that the Fuel Range A reading is missing for about 36 h from March 12–14. TEPCO commented that consequences from core damage can cause water to evaporate from the condensing chambers in the D/W and cause erroneous water level readings. They discovered during calibration on May 11 that this was likely the case, and water levels measured after core damage were assumed to be unreliable. Pressure readings are subject to this same effect.
Figure 14 shows actual vs. calculated containment pressure for Unit 1. There are significant periods when there were no measured values. D/W and S/P (i.e., S/C) pressure indications track with a small offset to account for water pressure in the S/P, which is expected.
Because of the station power loss, there was no electrical power to support accident monitoring instrumentation, including containment radiation monitoring, building and site radiation monitoring, meteorological instrumentation, etc. Leakage from the D/W and/or S/P to the reactor building and the leakage from the reactor building explosion were not measured.

37
Fig. 12. Actual vs. calculated RPV pressure—Unit 1 (TEPCO [4], p. 188).
Different pressure indications
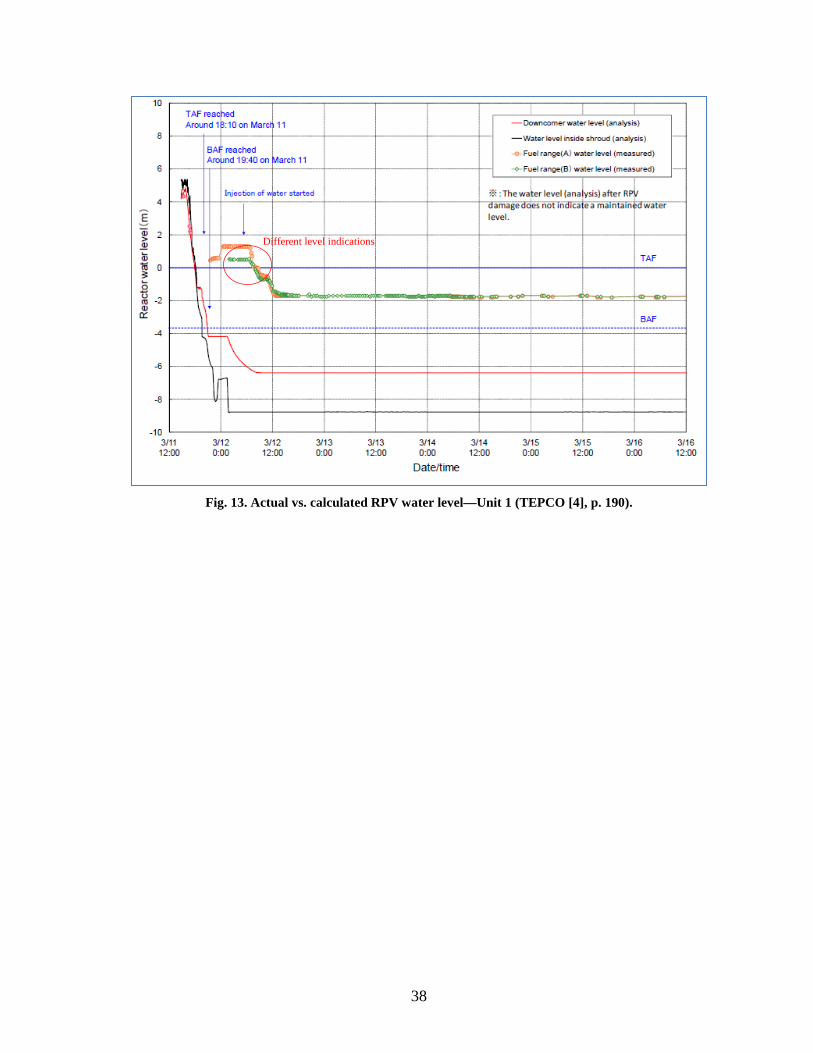
38
Fig. 13. Actual vs. calculated RPV water level—Unit 1 (TEPCO [4], p. 190).
Different level indications
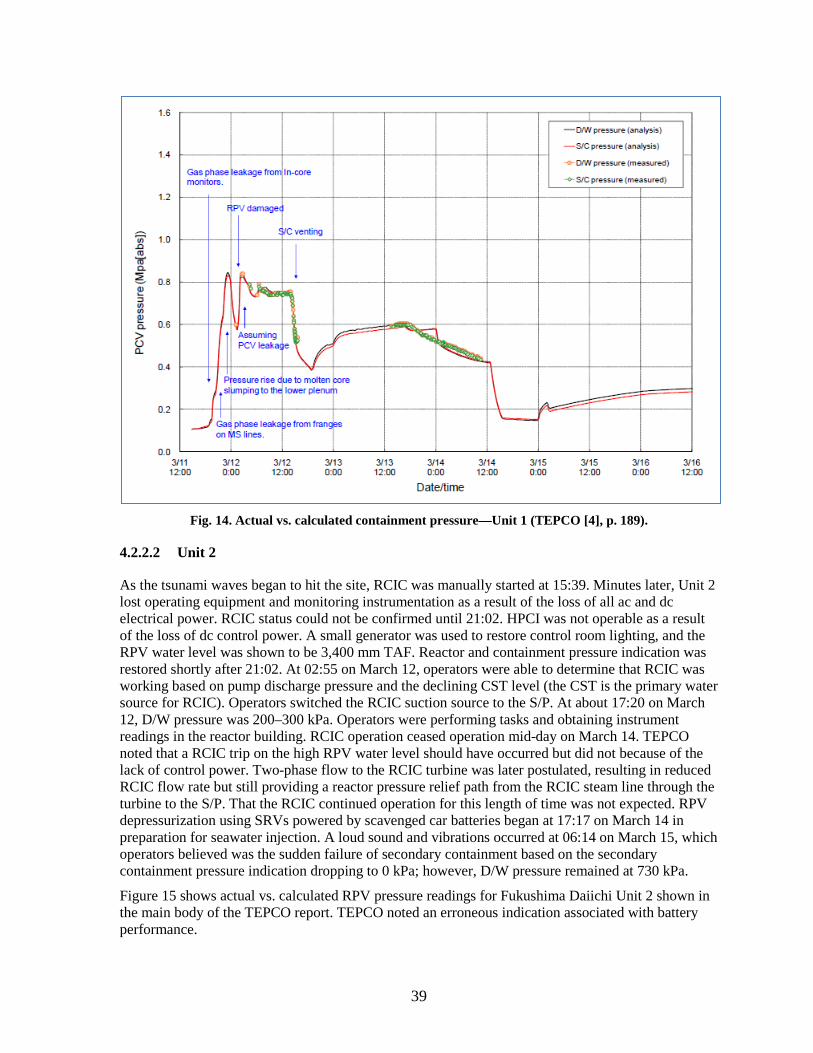
39
Fig. 14. Actual vs. calculated containment pressure—Unit 1 (TEPCO [4], p. 189).
4.2.2.2 Unit 2
As the tsunami waves began to hit the site, RCIC was manually started at 15:39. Minutes later, Unit 2 lost operating equipment and monitoring instrumentation as a result of the loss of all ac and dc electrical power. RCIC status could not be confirmed until 21:02. HPCI was not operable as a result of the loss of dc control power. A small generator was used to restore control room lighting, and the RPV water level was shown to be 3,400 mm TAF. Reactor and containment pressure indication was restored shortly after 21:02. At 02:55 on March 12, operators were able to determine that RCIC was working based on pump discharge pressure and the declining CST level (the CST is the primary water source for RCIC). Operators switched the RCIC suction source to the S/P. At about 17:20 on March 12, D/W pressure was 200–300 kPa. Operators were performing tasks and obtaining instrument readings in the reactor building. RCIC operation ceased operation mid-day on March 14. TEPCO noted that a RCIC trip on the high RPV water level should have occurred but did not because of the lack of control power. Two-phase flow to the RCIC turbine was later postulated, resulting in reduced RCIC flow rate but still providing a reactor pressure relief path from the RCIC steam line through the turbine to the S/P. That the RCIC continued operation for this length of time was not expected. RPV depressurization using SRVs powered by scavenged car batteries began at 17:17 on March 14 in preparation for seawater injection. A loud sound and vibrations occurred at 06:14 on March 15, which operators believed was the sudden failure of secondary containment based on the secondary containment pressure indication dropping to 0 kPa; however, D/W pressure remained at 730 kPa.
Figure 15 shows actual vs. calculated RPV pressure readings for Fukushima Daiichi Unit 2 shown in the main body of the TEPCO report. TEPCO noted an erroneous indication associated with battery performance.
40
Fig. 15. Actual vs. calculated RPV pressure—Unit 2 (TEPCO [4], p. 222).
Figure 16 shows actual vs. calculated RPV water level indications shown in the main body of the TEPCO report. Differences between the calculated and actual values are based on a calibration by atmospheric pressure and saturation temperature. It was corrected at a later time using reactor pressure and D/W temperature. Thus, the original measured values were incorrect.
Figure 17 shows actual vs. calculated containment pressure indications. This figure shows significant differences between the D/W and secondary containment actual measured values, which could potentially mislead or confuse operators in the midst of emergency actions. Both the D/W and secondary containment pressure indications are erratic, erroneous, and missing for significant portions from mid-day on March 14–18.
As a result of the station power loss, there was no electrical power to support accident monitoring instrumentation, including containment radiation monitoring, building and site radiation monitoring, meteorological instrumentation, etc. Leakage from the D/W and/or S/P to the reactor building and the leakage from the reactor building explosion were not measured.
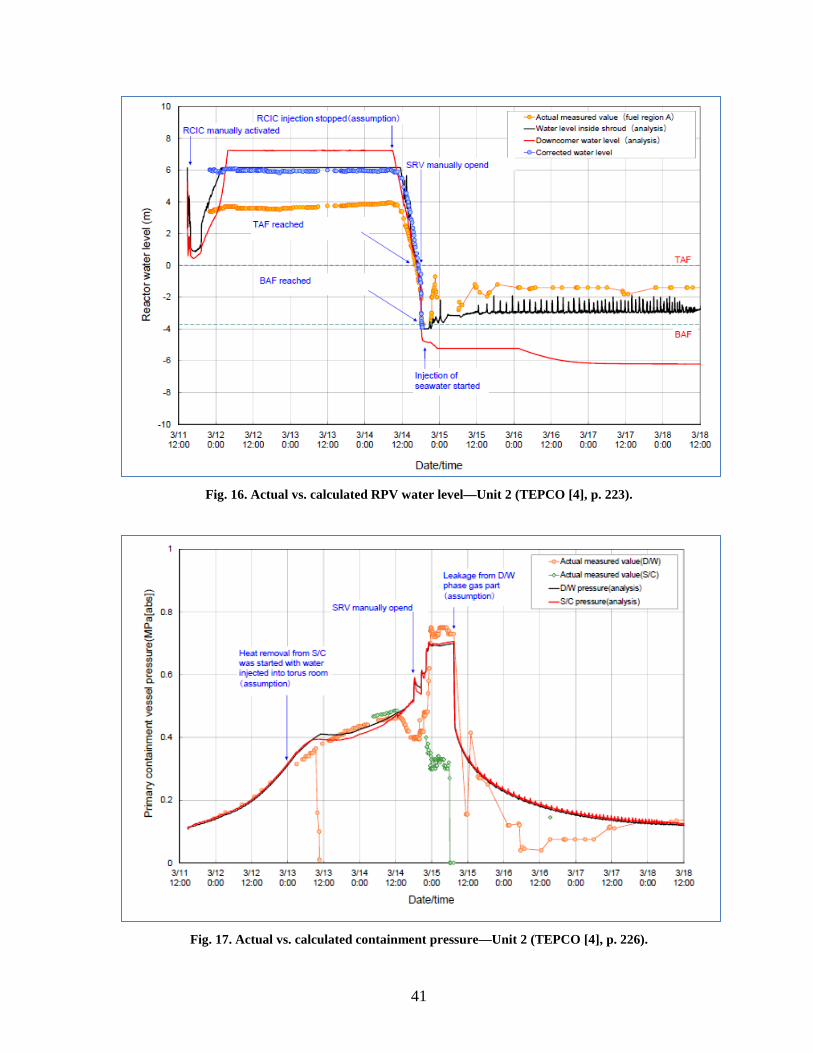
41
Fig. 16. Actual vs. calculated RPV water level—Unit 2 (TEPCO [4], p. 223).
Fig. 17. Actual vs. calculated containment pressure—Unit 2 (TEPCO [4], p. 226).
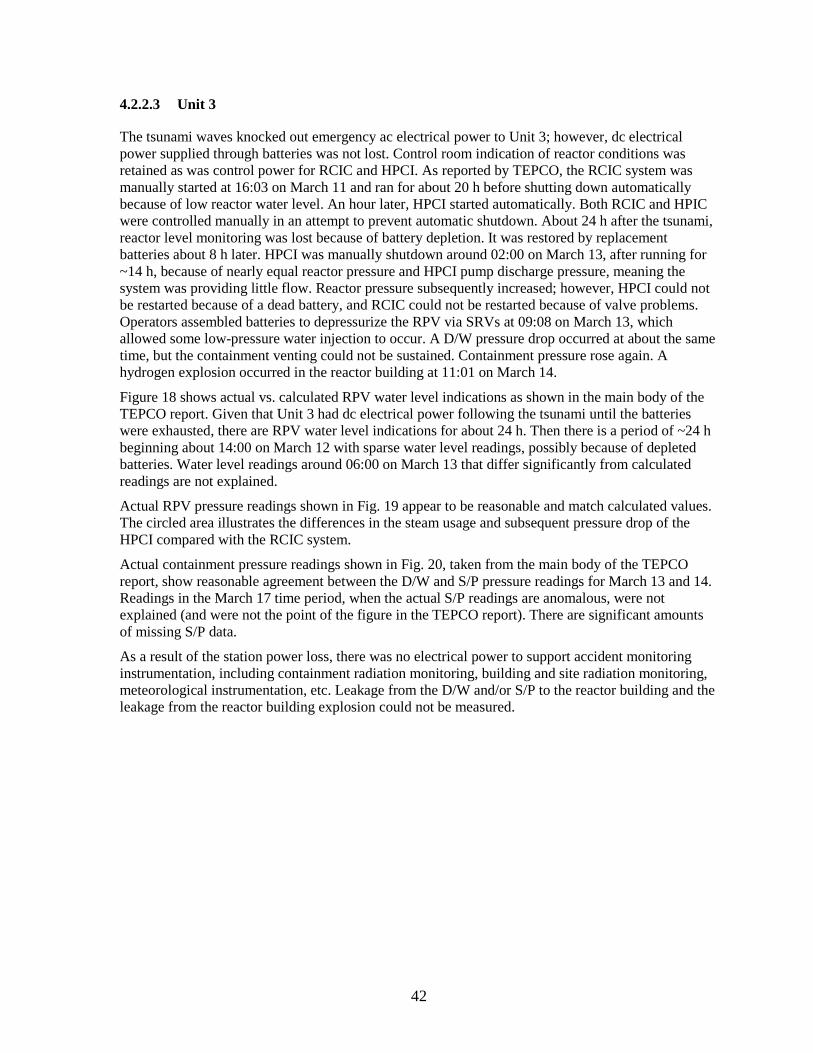
42
4.2.2.3 Unit 3
The tsunami waves knocked out emergency ac electrical power to Unit 3; however, dc electrical power supplied through batteries was not lost. Control room indication of reactor conditions was retained as was control power for RCIC and HPCI. As reported by TEPCO, the RCIC system was manually started at 16:03 on March 11 and ran for about 20 h before shutting down automatically because of low reactor water level. An hour later, HPCI started automatically. Both RCIC and HPIC were controlled manually in an attempt to prevent automatic shutdown. About 24 h after the tsunami, reactor level monitoring was lost because of battery depletion. It was restored by replacement batteries about 8 h later. HPCI was manually shutdown around 02:00 on March 13, after running for ~14 h, because of nearly equal reactor pressure and HPCI pump discharge pressure, meaning the system was providing little flow. Reactor pressure subsequently increased; however, HPCI could not be restarted because of a dead battery, and RCIC could not be restarted because of valve problems. Operators assembled batteries to depressurize the RPV via SRVs at 09:08 on March 13, which allowed some low-pressure water injection to occur. A D/W pressure drop occurred at about the same time, but the containment venting could not be sustained. Containment pressure rose again. A hydrogen explosion occurred in the reactor building at 11:01 on March 14.
Figure 18 shows actual vs. calculated RPV water level indications as shown in the main body of the TEPCO report. Given that Unit 3 had dc electrical power following the tsunami until the batteries were exhausted, there are RPV water level indications for about 24 h. Then there is a period of ~24 h beginning about 14:00 on March 12 with sparse water level readings, possibly because of depleted batteries. Water level readings around 06:00 on March 13 that differ significantly from calculated readings are not explained.
Actual RPV pressure readings shown in Fig. 19 appear to be reasonable and match calculated values. The circled area illustrates the differences in the steam usage and subsequent pressure drop of the HPCI compared with the RCIC system.
Actual containment pressure readings shown in Fig. 20, taken from the main body of the TEPCO report, show reasonable agreement between the D/W and S/P pressure readings for March 13 and 14. Readings in the March 17 time period, when the actual S/P readings are anomalous, were not explained (and were not the point of the figure in the TEPCO report). There are significant amounts of missing S/P data.
As a result of the station power loss, there was no electrical power to support accident monitoring instrumentation, including containment radiation monitoring, building and site radiation monitoring, meteorological instrumentation, etc. Leakage from the D/W and/or S/P to the reactor building and the leakage from the reactor building explosion could not be measured.
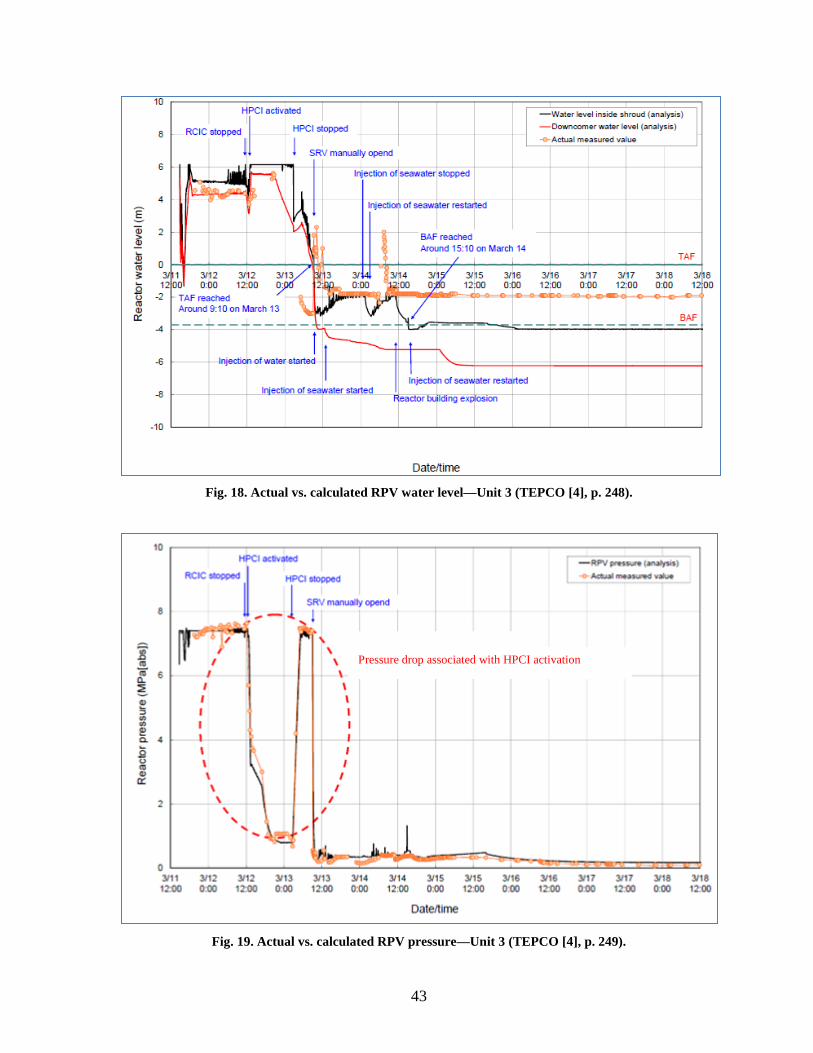
43
Fig. 18. Actual vs. calculated RPV water level—Unit 3 (TEPCO [4], p. 248).
Fig. 19. Actual vs. calculated RPV pressure—Unit 3 (TEPCO [4], p. 249).
Pressure drop associated with HPCI activation
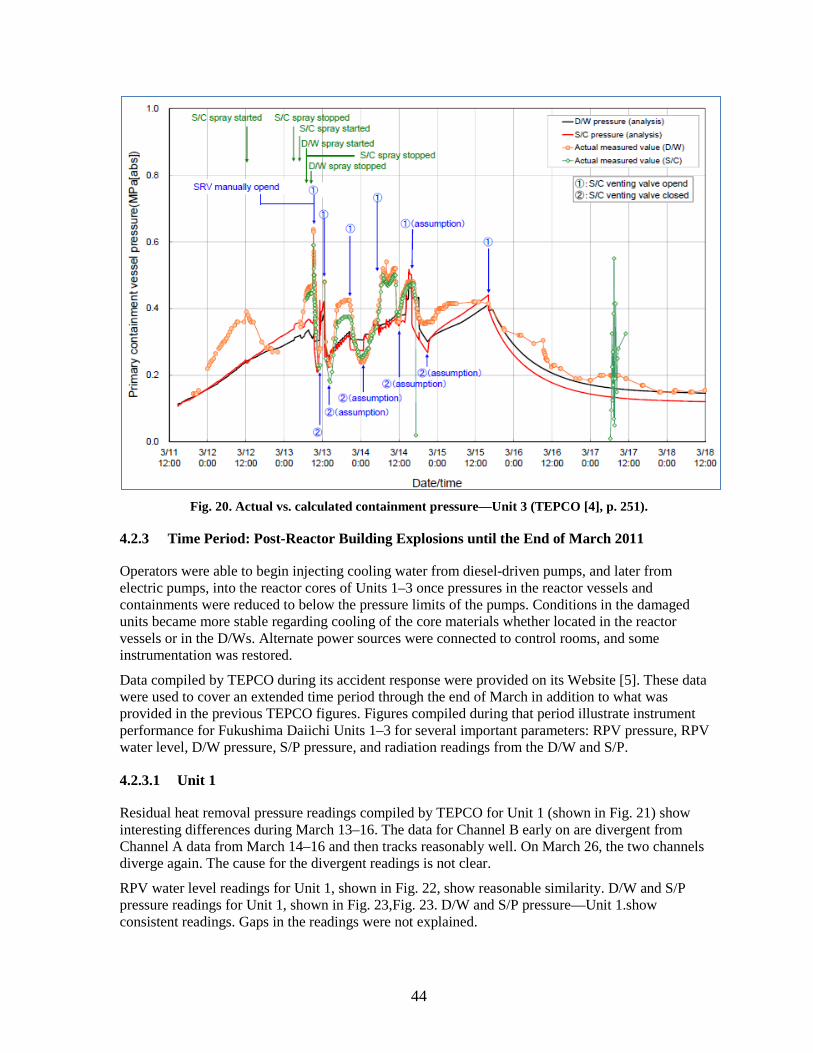
44
Fig. 20. Actual vs. calculated containment pressure—Unit 3 (TEPCO [4], p. 251).
4.2.3 Time Period: Post-Reactor Building Explosions until the End of March 2011
Operators were able to begin injecting cooling water from diesel-driven pumps, and later from electric pumps, into the reactor cores of Units 1–3 once pressures in the reactor vessels and containments were reduced to below the pressure limits of the pumps. Conditions in the damaged units became more stable regarding cooling of the core materials whether located in the reactor vessels or in the D/Ws. Alternate power sources were connected to control rooms, and some instrumentation was restored.
Data compiled by TEPCO during its accident response were provided on its Website [5]. These data were used to cover an extended time period through the end of March in addition to what was provided in the previous TEPCO figures. Figures compiled during that period illustrate instrument performance for Fukushima Daiichi Units 1–3 for several important parameters: RPV pressure, RPV water level, D/W pressure, S/P pressure, and radiation readings from the D/W and S/P.
4.2.3.1 Unit 1
Residual heat removal pressure readings compiled by TEPCO for Unit 1 (shown in Fig. 21) show interesting differences during March 13–16. The data for Channel B early on are divergent from Channel A data from March 14–16 and then tracks reasonably well. On March 26, the two channels diverge again. The cause for the divergent readings is not clear.
RPV water level readings for Unit 1, shown in Fig. 22, show reasonable similarity. D/W and S/P pressure readings for Unit 1, shown in Fig. 23,Fig. 23. D/W and S/P pressure—Unit 1.show consistent readings. Gaps in the readings were not explained.
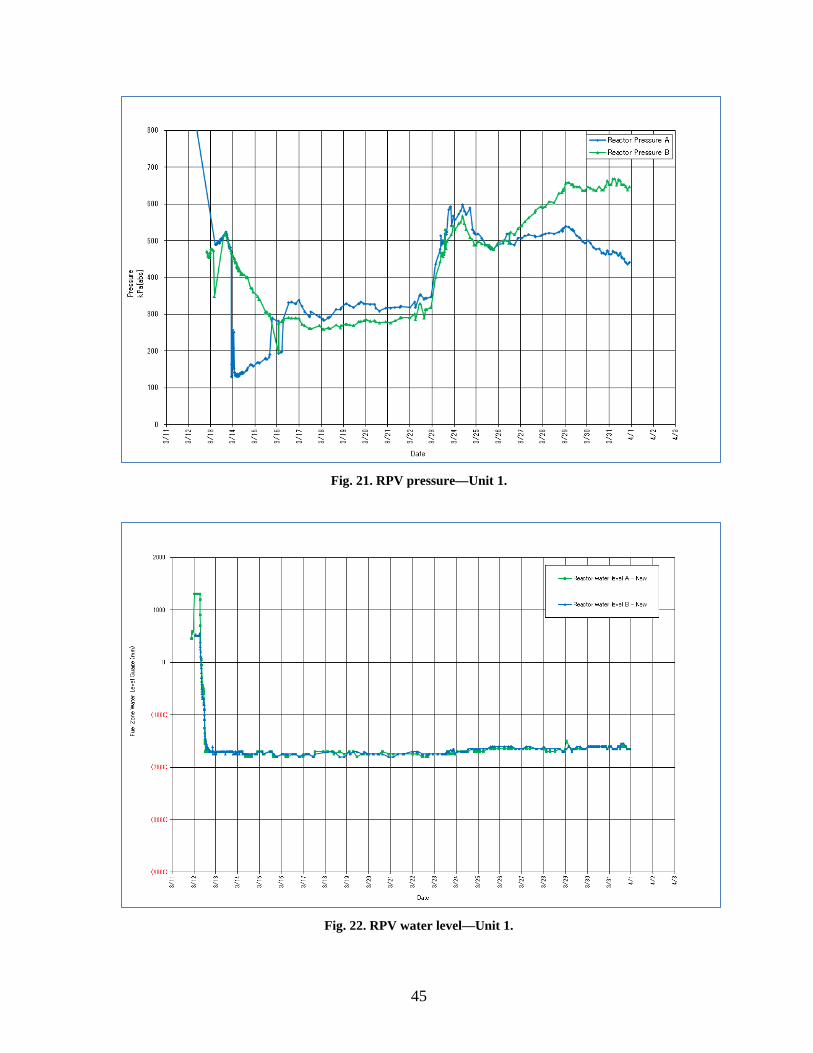
45
Fig. 21. RPV pressure—Unit 1.
Fig. 22. RPV water level—Unit 1.

46
D/W and S/P radiation readings for Unit 1 are shown in Fig. 24. D/W radiation readings from Channel A appear erratic in the March 14–16 time frame and then are no longer available. Channel B readings appear erratic until about March 21. The S/P radiation readings from Channel A are present from March 14–16 and then are no longer available. S/P radiation readings from Channel B are missing or appear erratic until about March 18. A number of dropouts are observed for D/W and S/P readings on March 21 and March 29.
Fig. 23. D/W and S/P pressure—Unit 1.
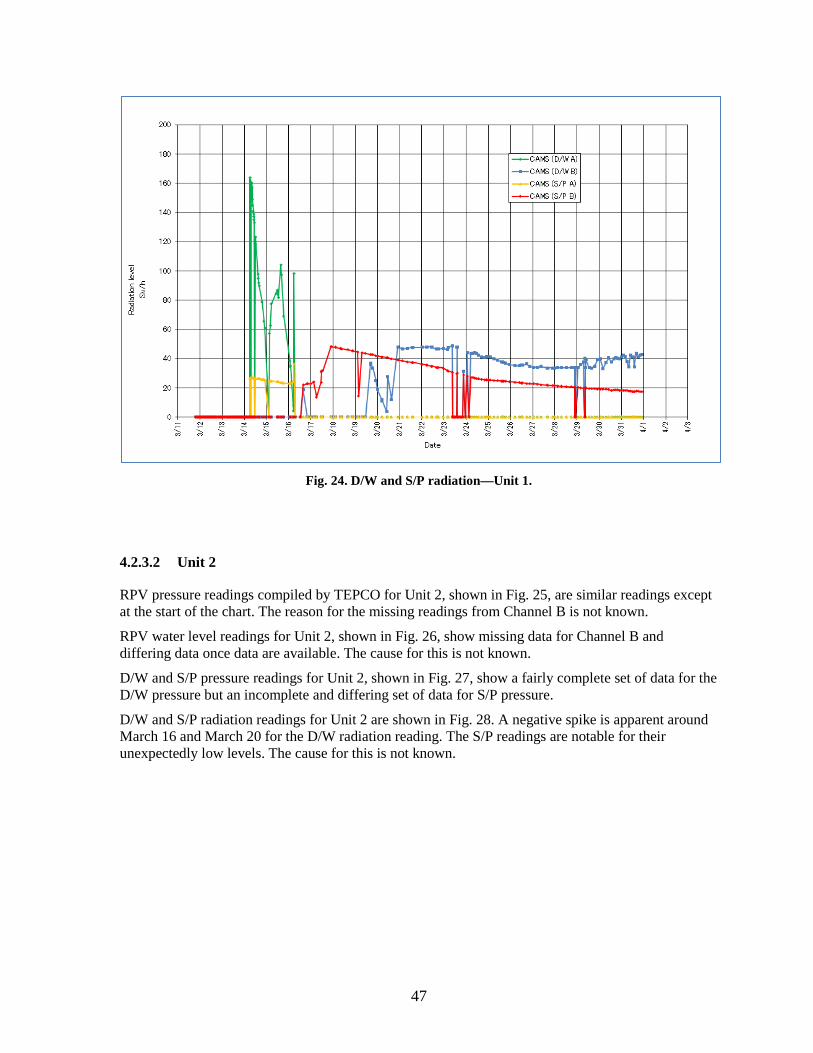
47
Fig. 24. D/W and S/P radiation—Unit 1.
4.2.3.2 Unit 2
RPV pressure readings compiled by TEPCO for Unit 2, shown in Fig. 25, are similar readings except at the start of the chart. The reason for the missing readings from Channel B is not known.
RPV water level readings for Unit 2, shown in Fig. 26, show missing data for Channel B and differing data once data are available. The cause for this is not known.
D/W and S/P pressure readings for Unit 2, shown in Fig. 27, show a fairly complete set of data for the D/W pressure but an incomplete and differing set of data for S/P pressure.
D/W and S/P radiation readings for Unit 2 are shown in Fig. 28. A negative spike is apparent around March 16 and March 20 for the D/W radiation reading. The S/P readings are notable for their unexpectedly low levels. The cause for this is not known.
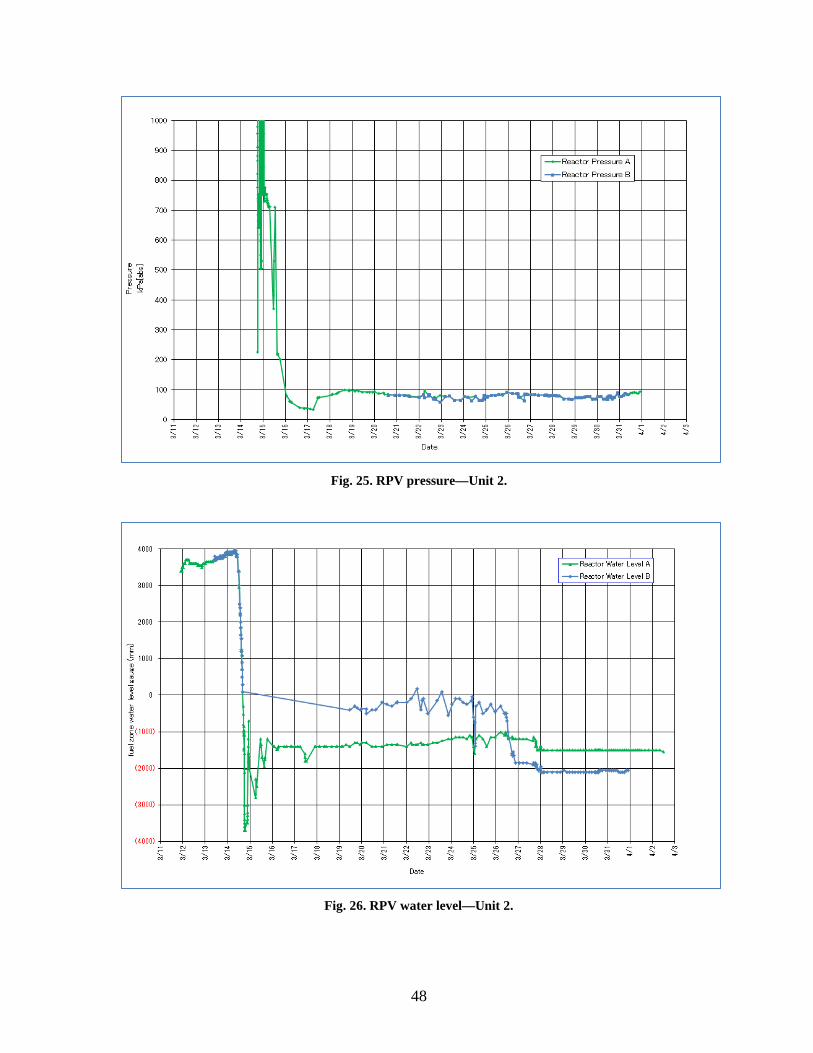
48
Fig. 25. RPV pressure—Unit 2.
Fig. 26. RPV water level—Unit 2.
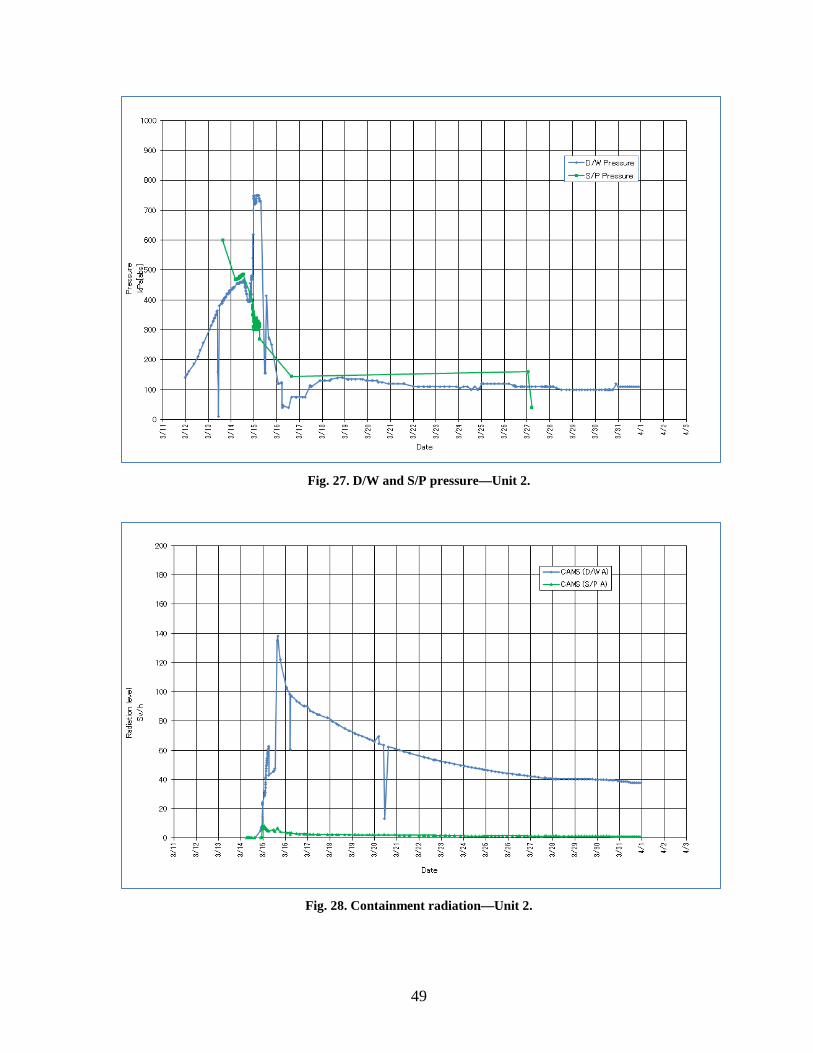
49
Fig. 27. D/W and S/P pressure—Unit 2.
Fig. 28. Containment radiation—Unit 2.
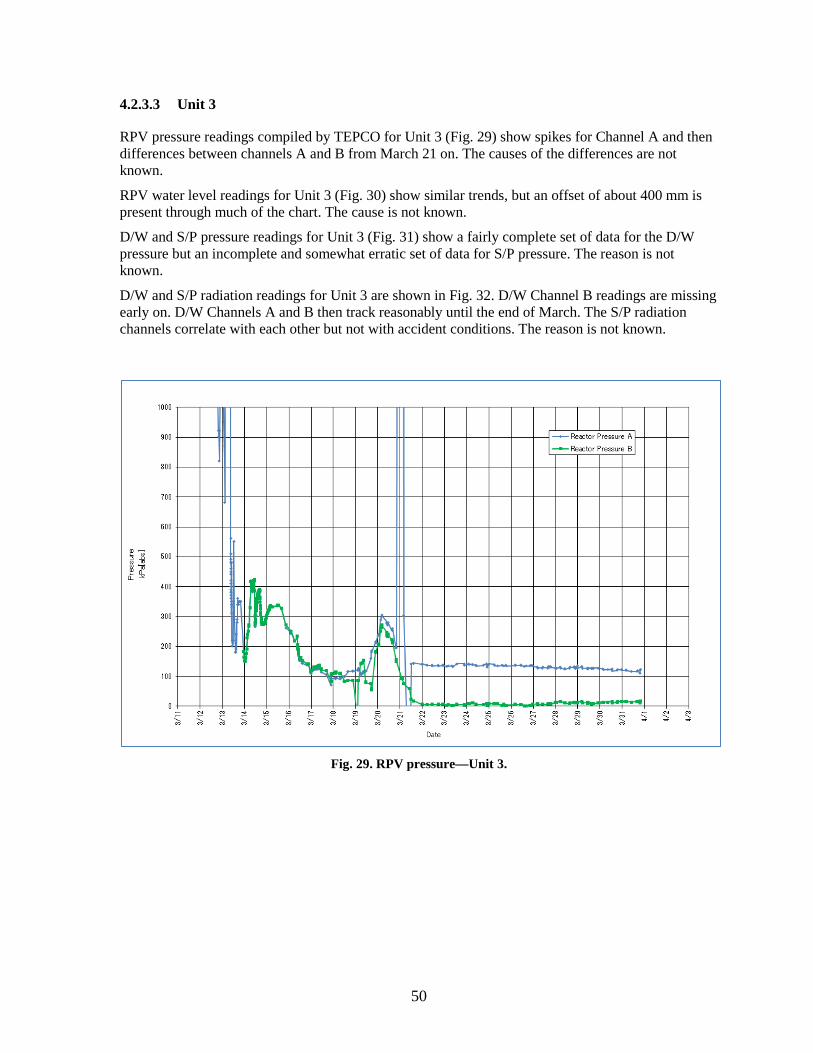
50
4.2.3.3 Unit 3
RPV pressure readings compiled by TEPCO for Unit 3 (Fig. 29) show spikes for Channel A and then differences between channels A and B from March 21 on. The causes of the differences are not known.
RPV water level readings for Unit 3 (Fig. 30) show similar trends, but an offset of about 400 mm is present through much of the chart. The cause is not known.
D/W and S/P pressure readings for Unit 3 (Fig. 31) show a fairly complete set of data for the D/W pressure but an incomplete and somewhat erratic set of data for S/P pressure. The reason is not known.
D/W and S/P radiation readings for Unit 3 are shown in Fig. 32. D/W Channel B readings are missing early on. D/W Channels A and B then track reasonably until the end of March. The S/P radiation channels correlate with each other but not with accident conditions. The reason is not known.
Fig. 29. RPV pressure—Unit 3.
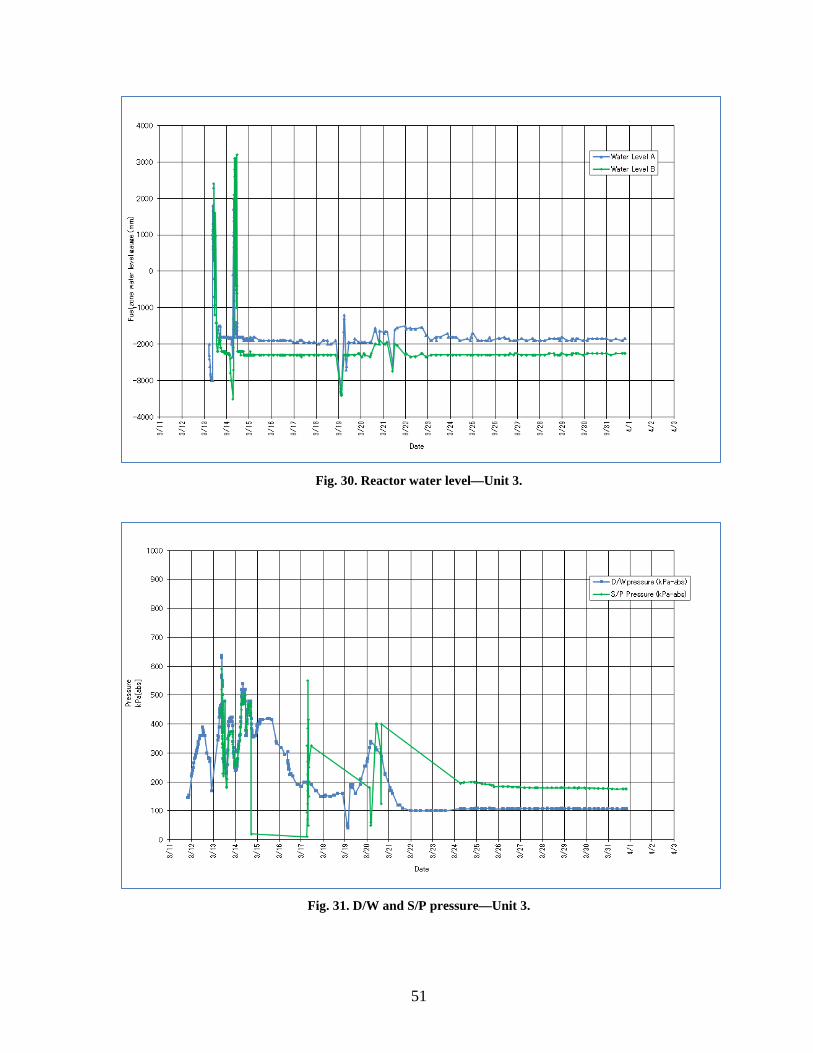
51
Fig. 30. Reactor water level—Unit 3.
Fig. 31. D/W and S/P pressure—Unit 3.
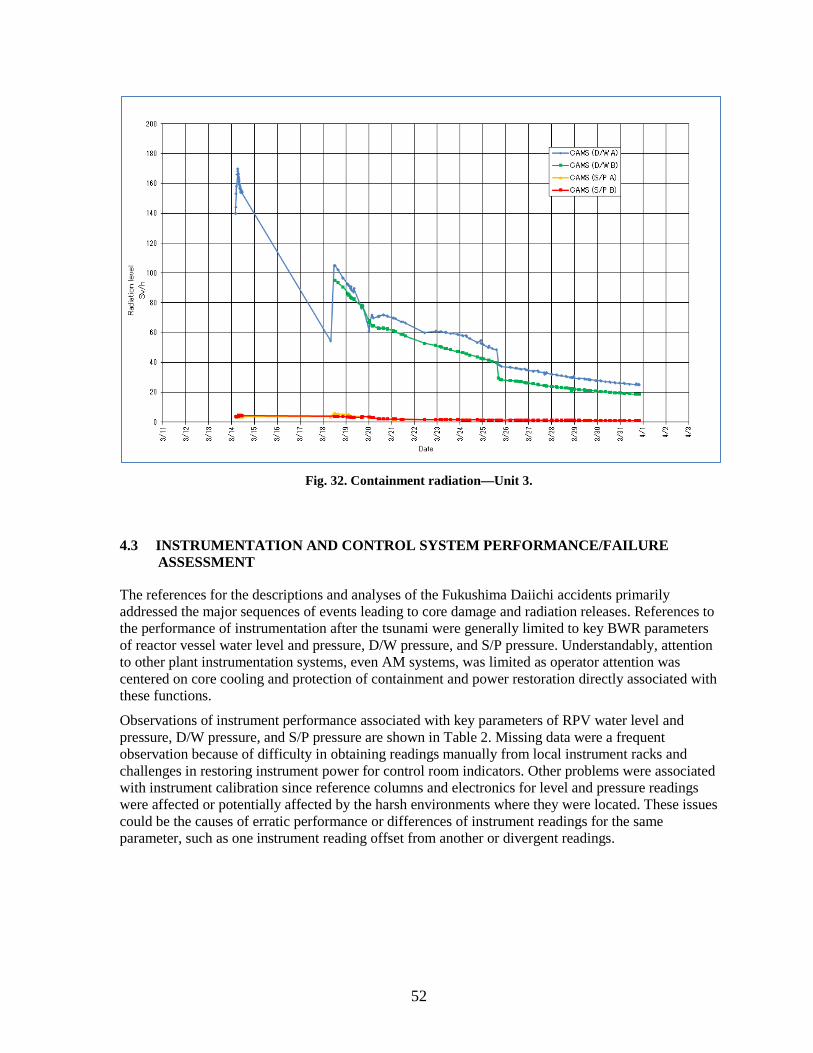
52
Fig. 32. Containment radiation—Unit 3.
4.3 INSTRUMENTATION AND CONTROL SYSTEM PERFORMANCE/FAILURE ASSESSMENT
The references for the descriptions and analyses of the Fukushima Daiichi accidents primarily addressed the major sequences of events leading to core damage and radiation releases. References to the performance of instrumentation after the tsunami were generally limited to key BWR parameters of reactor vessel water level and pressure, D/W pressure, and S/P pressure. Understandably, attention to other plant instrumentation systems, even AM systems, was limited as operator attention was centered on core cooling and protection of containment and power restoration directly associated with these functions.
Observations of instrument performance associated with key parameters of RPV water level and pressure, D/W pressure, and S/P pressure are shown in Table 2. Missing data were a frequent observation because of difficulty in obtaining readings manually from local instrument racks and challenges in restoring instrument power for control room indicators. Other problems were associated with instrument calibration since reference columns and electronics for level and pressure readings were affected or potentially affected by the harsh environments where they were located. These issues could be the causes of erratic performance or differences of instrument readings for the same parameter, such as one instrument reading offset from another or divergent readings.
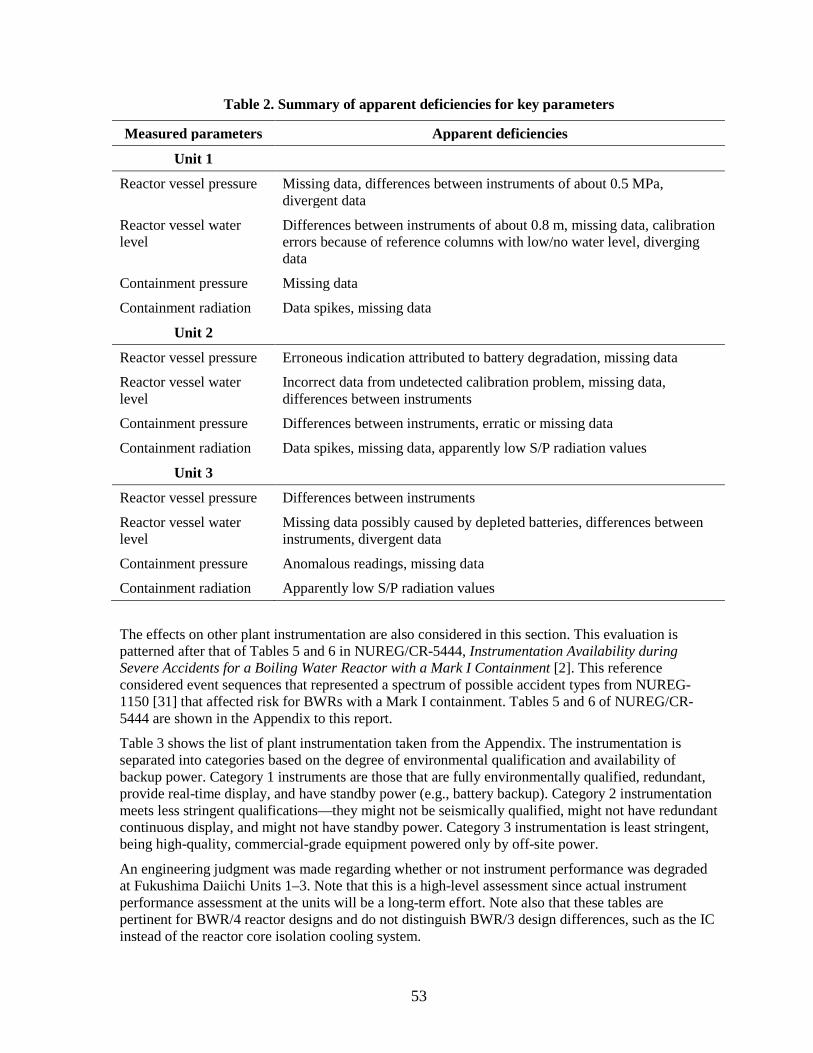
53
Table 2. Summary of apparent deficiencies for key parameters
Measured parameters Apparent deficiencies
Unit 1
Reactor vessel pressure Missing data, differences between instruments of about 0.5 MPa, divergent data
Reactor vessel water level
Differences between instruments of about 0.8 m, missing data, calibration errors because of reference columns with low/no water level, diverging data
Containment pressure Missing data
Containment radiation Data spikes, missing data
Unit 2
Reactor vessel pressure Erroneous indication attributed to battery degradation, missing data
Reactor vessel water level
Incorrect data from undetected calibration problem, missing data, differences between instruments
Containment pressure Differences between instruments, erratic or missing data
Containment radiation Data spikes, missing data, apparently low S/P radiation values
Unit 3
Reactor vessel pressure Differences between instruments
Reactor vessel water level
Missing data possibly caused by depleted batteries, differences between instruments, divergent data
Containment pressure Anomalous readings, missing data
Containment radiation Apparently low S/P radiation values
The effects on other plant instrumentation are also considered in this section. This evaluation is patterned after that of Tables 5 and 6 in NUREG/CR-5444, Instrumentation Availability during Severe Accidents for a Boiling Water Reactor with a Mark I Containment [2]. This reference considered event sequences that represented a spectrum of possible accident types from NUREG-1150 [31] that affected risk for BWRs with a Mark I containment. Tables 5 and 6 of NUREG/CR-5444 are shown in the Appendix to this report.
Table 3 shows the list of plant instrumentation taken from the Appendix. The instrumentation is separated into categories based on the degree of environmental qualification and availability of backup power. Category 1 instruments are those that are fully environmentally qualified, redundant, provide real-time display, and have standby power (e.g., battery backup). Category 2 instrumentation meets less stringent qualifications—they might not be seismically qualified, might not have redundant continuous display, and might not have standby power. Category 3 instrumentation is least stringent, being high-quality, commercial-grade equipment powered only by off-site power.
An engineering judgment was made regarding whether or not instrument performance was degraded at Fukushima Daiichi Units 1–3. Note that this is a high-level assessment since actual instrument performance assessment at the units will be a long-term effort. Note also that these tables are pertinent for BWR/4 reactor designs and do not distinguish BWR/3 design differences, such as the IC instead of the reactor core isolation cooling system.
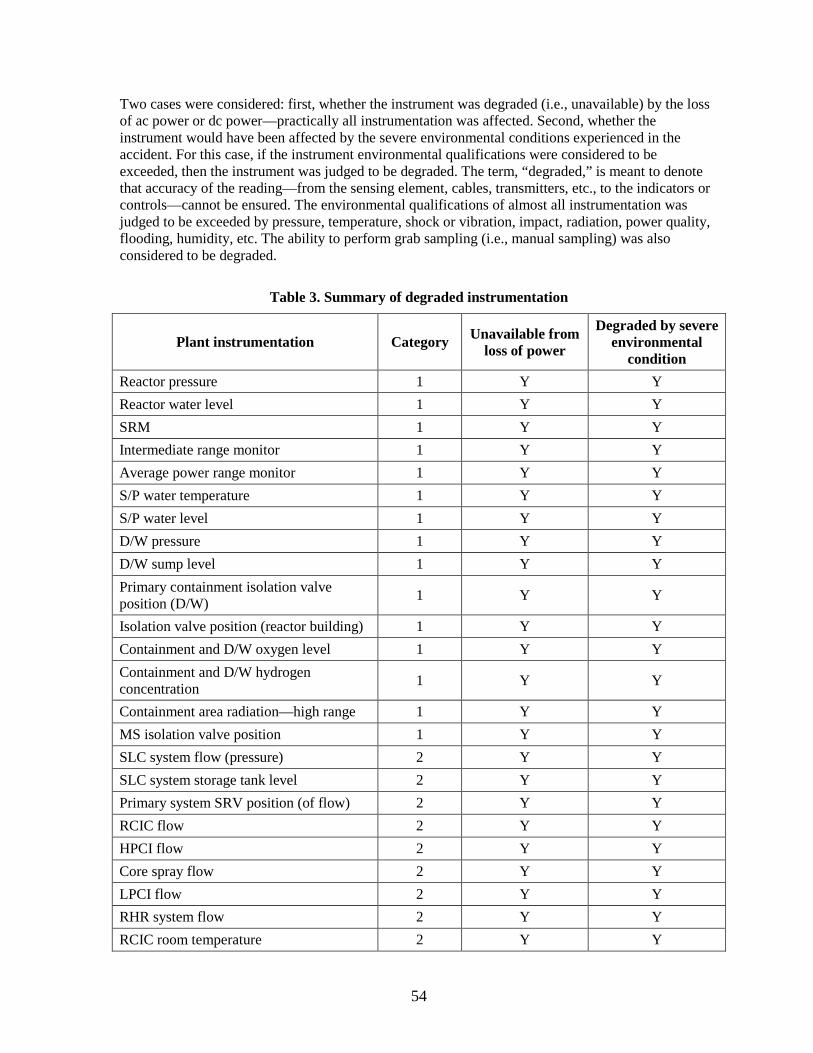
54
Two cases were considered: first, whether the instrument was degraded (i.e., unavailable) by the loss of ac power or dc power—practically all instrumentation was affected. Second, whether the instrument would have been affected by the severe environmental conditions experienced in the accident. For this case, if the instrument environmental qualifications were considered to be exceeded, then the instrument was judged to be degraded. The term, “degraded,” is meant to denote that accuracy of the reading—from the sensing element, cables, transmitters, etc., to the indicators or controls—cannot be ensured. The environmental qualifications of almost all instrumentation was judged to be exceeded by pressure, temperature, shock or vibration, impact, radiation, power quality, flooding, humidity, etc. The ability to perform grab sampling (i.e., manual sampling) was also considered to be degraded.
Table 3. Summary of degraded instrumentation
Plant instrumentation Category Unavailable from loss of power
Degraded by severe environmental
condition Reactor pressure 1 Y Y Reactor water level 1 Y Y SRM 1 Y Y Intermediate range monitor 1 Y Y Average power range monitor 1 Y Y S/P water temperature 1 Y Y S/P water level 1 Y Y D/W pressure 1 Y Y D/W sump level 1 Y Y Primary containment isolation valve position (D/W) 1 Y Y
Isolation valve position (reactor building) 1 Y Y Containment and D/W oxygen level 1 Y Y Containment and D/W hydrogen concentration 1 Y Y
Containment area radiation—high range 1 Y Y MS isolation valve position 1 Y Y SLC system flow (pressure) 2 Y Y SLC system storage tank level 2 Y Y Primary system SRV position (of flow) 2 Y Y RCIC flow 2 Y Y HPCI flow 2 Y Y Core spray flow 2 Y Y LPCI flow 2 Y Y RHR system flow 2 Y Y RCIC room temperature 2 Y Y
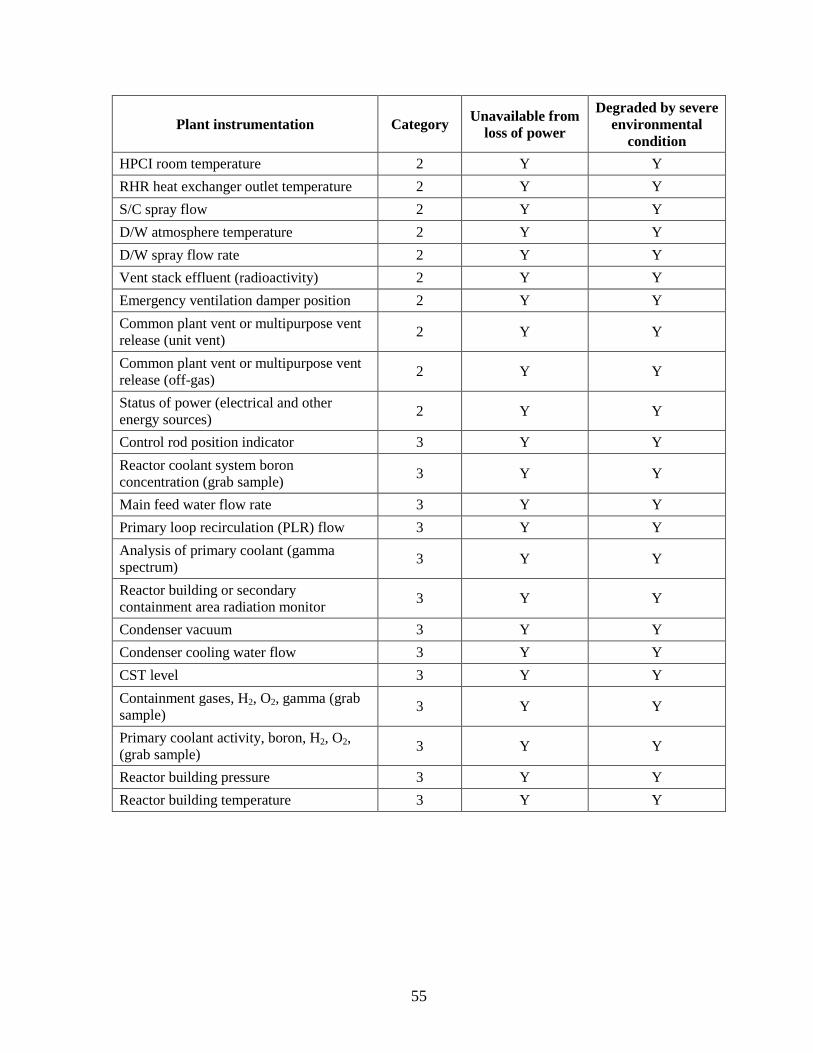
55
Plant instrumentation Category Unavailable from loss of power
Degraded by severe environmental
condition HPCI room temperature 2 Y Y RHR heat exchanger outlet temperature 2 Y Y S/C spray flow 2 Y Y D/W atmosphere temperature 2 Y Y D/W spray flow rate 2 Y Y Vent stack effluent (radioactivity) 2 Y Y Emergency ventilation damper position 2 Y Y Common plant vent or multipurpose vent release (unit vent) 2 Y Y
Common plant vent or multipurpose vent release (off-gas) 2 Y Y
Status of power (electrical and other energy sources) 2 Y Y
Control rod position indicator 3 Y Y Reactor coolant system boron concentration (grab sample) 3 Y Y
Main feed water flow rate 3 Y Y Primary loop recirculation (PLR) flow 3 Y Y Analysis of primary coolant (gamma spectrum) 3 Y Y
Reactor building or secondary containment area radiation monitor 3 Y Y
Condenser vacuum 3 Y Y Condenser cooling water flow 3 Y Y CST level 3 Y Y Containment gases, H2, O2, gamma (grab sample) 3 Y Y
Primary coolant activity, boron, H2, O2, (grab sample) 3 Y Y
Reactor building pressure 3 Y Y Reactor building temperature 3 Y Y


57
5. CONCLUSIONS
The Fukushima Daiichi plant experienced essentially what would be expected based on the severe accident scenarios examined more than 20 years ago in research on BWR plants with a Mark I containment. Long-term SBO accidents during which dc electrical power was lost led to severe consequences to the reactor core and radiation release in these studies. The importance of instrumentation, control, and monitoring systems was noted repeatedly in previous research. In addition, lessons learned from past research were not fully implemented. For example, Table 1 presents a list of information needs for AM purposes that were lacking in BWR-Mark I reactor designs in the early 1990s [29]. And, the instrumentation failures predicted by Alcieri and Hanson [2], shown in the Appendix, proved prescient at Fukushima Daiichi.
During the Fukushima Daiichi accident, very few of the information needs from Table 1 were available because the capability was not provided. One must recognize that having this instrumentation capability does not mean that the ability to mitigate these severe accident conditions would have been significantly affected.
Although these information needs might not have been addressed to the point where additional instrumentation was provided, national and international responses were implemented to reduce the likelihood of severe accidents and to improve the plant capability to cope if a severe accident occurred in the intervening years. Examples of responses are the addition of the air-cooled diesel generators at Fukushima Daiichi Units 2, 4, and 6 to add redundancy to the electrical power supply to better ensure operability of plant equipment, instrumentation, and accident monitoring and management. Unfortunately, connections to plant loads were made in the flooded electrical rooms affecting Units 1–4, therefore, they were not usable in this event.
Containment venting capabilities were enhanced internationally to improve the ability to cope with high containment pressures and the potential venting of hydrogen during severe accidents. However, at Fukushima Daiichi, they were difficult to operate given a lack of control power, lack of high-pressure air supplies, and difficult access under severe accident conditions.
Observations of instrument performance primarily associated with key parameters reported by TEPCO [4] of RPV water level and pressure, D/W pressure, and S/P pressure are shown in Table 2.
Essentially all plant instrumentation was considered to be degraded as a consequence of the accident, either by being unavailable because of loss of power or by exceeding equipment environmental qualifications. The examples of missing, misleading, or erroneous instrument readings cited in this report show periods where instruments were not powered, likely exceeded environmental limits, or experienced other degradation, such as pressure or level instrument readings dependent on the conditions of instrument sensing lines or reference columns. Sensing lines in the D/W were subject to pressure shocks and high temperatures that can affect measurements based on differential pressure. Forensics analyses of instrument degradation to determine specific instrumentation root causes and failure modes will take years to complete. An initial evaluation of the Fukushima Daiichi RPV pressure and water level, D/W pressure, and S/C pressure that was completed December 26, 2012, as described in [17], is an illustration of the time and effort required to examine just a few important parameters.
58
Important observations or potential lessons learned regarding the Fukushima Daiichi accident:
• Unit 1 experienced core damage in a few hours, in part because of the loss of monitoring and control of the IC system. During the almost simultaneous loss of both ac and dc power, the ac and dc isolation valves for the two ICs apparently closed as a result of an interlock. This left the operators uncertain of valve position and system operability. They considered the system shutdown and inoperable. Considerable effort was spent trying to open dc-powered valves so that the system would operate; however, during the time required for these actions, the core was likely exposed and damaged. ([4], p. 195–197).
• At Unit 2, the RCIC operated under manual control longer than expected, with system shutdown being prevented because of lack of control power [32].
• At Unit 3, RCIC and HPCI also operated longer than expected using manual control [32].
• Redundant trains of both ac- and dc-electrical power systems were lost because of seawater flooding of dc system batteries and ac system switchgear. Diversity in electrical supply to resist this level of flooding was absent and, therefore, the benefits of redundancy in supply were lost.
• Information needed to guide timely and effective emergency response was not available to the operators.
• Local instrumentation racks in the reactor buildings used for reactor and containment monitoring were difficult to access. The Finnish study [30] recommended the addition of new instrumentation for containment pressure, reactor pressure, water level inside the lower D/W, and D/W/wet well pressure difference to help prevent early containment failure. It also noted that measurements are provided in a central panel in a special emergency monitoring center close to the front door of the reactor building.
• Vulnerabilities, recommendations, and lessons learned from prior severe accident research and recent post-Fukushima assessments should be reexamined. The national and international responses to the Fukushima Daiichi accident, such as the NRC’s review of insights [16], US nuclear industry diverse and flexible coping (FLEX) capability [33], and the European Nuclear Safety Regulators Group (ENSRG) reactor stress test results [34] should be widely shared.
Although loss of instrument power was the initial reason for the loss of instrument capability, the harsh severe accident environmental conditions almost certainly exceeded equipment environmental qualifications for key instrumentation, as shown in the Appendix. These important factors were not thoroughly examined in the major accident investigation reports that were sources of information for this review. Additional research is warranted to investigate root causes and specific failure modes.
59
6. REFERENCES
1. For an informative overview see S. R. Greene, The Canary, the Ostrich, and the Black Swan: An Historical Perspective on our Understanding of BWR Severe Accidents and their Mitigation, American Nuclear Society International Meeting on Severe Accident Assessment and Management: Lessons Learned from Fukushima Dai-ichi, November 12, 2012, San Diego, Calif.
2. W. C. Arcieri and D. J. Hanson, Instrumentation Availability During Severe Accidents for a Boiling Water Reactor with the Mark I Containment, NUREG/CR-5444, Idaho National Engineering Laboratory, Idaho Falls, Idaho, February 1992.
3. Investigation Committee on the Accident at the Fukushima Nuclear Power Stations of Tokyo Electric Power Company, Interim Report, December 26, 2011, www.cas.go.jp/jp/seisaku/icanps/eng/interim-report.html.
4. Tokyo Electric Power Company, Inc., Fukushima Nuclear Accident Analysis Report, June 20, 2012, www.tepco.co.jp/en/press/corp-com/release/2012/1205638_1870.html.
5. Tokyo Electric Power Company, Inc., “The parameters related to the plants in Fukushima Daiichi Nuclear Power Station,” Archives, 2011, www.tepco.co.jp/en/nu/fukushima-np/f1/pla/2011/index-e.html.
6. The official report of The Fukushima Nuclear Accident Independent Investigation Commission, The National Diet of Japan, 2012, warp.da.ndl.go.jp/info:ndljp/pid/3856371/naiic.go.jp/en/report/.
7. IAEA Mission Report, The Great East Japan Earthquake Expert Mission—IAEA International Fact Finding Expert Mission of the Fukushima Dai-ichi NPP Accident Following the Great East Japan Earthquake and Tsunami, May 24–June 2, 2011, www-pub.iaea.org/mtcd/meetings/pdfplus/2011/cn200/documentation/cn200_final-fukushima-mission_report.pdf.
8. Nuclear Emergency Response Headquarters Government of Japan, Additional Report of the Japanese Government to the IAEA—The Accident at TEPCO’s Fukushima Nuclear Power Stations (Second Report), September 2011, www.iaea.org/newscenter/focus/fukushima/japan-report2/.
9. Nuclear and Industrial Safety Agency (Japan), Technical Knowledge of the Accident at Fukushima Dai-ichi Nuclear Power Station of Tokyo Electric Power Co., Inc. (Provisional Translation), March 2012, www.nsr.go.jp/archive/nisa/english/press/2012/06/en20120615-1-1.pdf.
10. Japan Nuclear Technology Institute, Examination of Accident at Tokyo Electric Power Co., Inc.’s Fukushima Daiichi Nuclear Power Stations and Proposal of Countermeasures, October 2011, www.gengikyo.jp/english/.
11. Masaya Yasui, Deputy Director General, Nuclear Safety Regulation Reform Ministry of Economy, Trade and Industry (METI), Causes and Countermeasures: The Accident at TEPCO’s Fukushima Nuclear Power Stations, March 2012, www.oecd-nea.org/nsd/fukushima/documents/NISAFukushimacausesandcountermeasuresMarch2012_en.pdf .
12. Institute for Nuclear Power Operations, Special Report on the Nuclear Accident at the Fukushima Daiichi Nuclear Power Station, Rev. 0, INPO 11-005, November 2011, www.nei.org/resourcesandstats/documentlibrary/safetyandsecurity/reports/special-report-on-the-nuclear-accident-at-the-fukushima-daiichi-nuclear-power-station.

60
13. Electric Power Research Institute (EPRI), Fukushima Daiichi Accident—Technical Causal Factor Analysis, No. 1024946, March 2012, www.epri.com/abstracts/Pages/ProductAbstract.aspx?ProductId=000000000001024946
14. American Nuclear Society, Fukushima Daiichi: ANS Committee Report, March 2012, fukushima.ans.org/report/Fukushima_report.pdf.
15. J. Rempe and D. Knudson, TMI-2–A Case Study for PWR Instrumentation Performance during a Severe Accident, INL/EXT-13-28043, Idaho National Engineering Laboratory, Idaho Falls, Idaho, March 2013.
16. US Nuclear Regulatory Commission, Recommendations for Enhancing Reactor Safety in the 21st Century—The Near-Term Task Force Review of Insights from the Fukushima Dai-ichi Accident, July 12, 2011, pbadupws.nrc.gov/docs/ML1125/ML112510271.pdf.
17. Investigation Committee on the Accident at the Fukushima Nuclear Power Stations of Tokyo Electric Power Company, Final Report, July 23, 2012, www.cas.go.jp/jp/seisaku/icanps/eng/final-report.html)
18. American Nuclear Society, Fuel Oil Systems for Safety-Related Emergency Diesel Generators, ANSI/ANS-59.51, reaffirmed October 2007.
19. R. B. Gallaher et al., Sequence Coding and Search System for Licensee Event Reports-Coder’s Manual, NUREG/CR-3905 LD, Vol. 4, Rev. 1, November 1984.
20. US Nuclear Regulatory Commission, Boiling Water Reactor Systems Manual, circa 1982.
21. US Nuclear Regulatory Commission, Introduction to Reactor Technology-BWR, Chapter 3.0, Reactor Vessel Instrumentation System, pbadupws.nrc.gov/docs/ML1215/ML12158A333.pdf.
22. Virginia Electric and Power Company, North Anna Power Station Unit 1 and 2 Licensee Event Report, 338/2011-003, https://lersearch.inl.gov/PDFView.ashx?DOC::3382011003R00.PDF.
23. American Nuclear Society, Fukushima Daiichi: ANS Committee Report, Appendix F-Safety System Descriptions for Station Blackout: Isolation Condenser, Reactor Core Isolation Cooling, and High Pressure Coolant Injection, March 2012, fukushima.ans.org/inc/Fukushima_Appendix_F.pdf.
24. (Note: revised version of reference 7) American Nuclear Society, Fukushima Daiichi: ANS Committee Report, Appendix F-Safety System Descriptions for Station Blackout Mitigation: Isolation Condenser, Reactor Core Isolation Cooling, and High-Pressure Coolant Injection, March 2012 (Revised June 2012), http://fukushima.ans.org/inc/Fukushima_Appendix_F.pdf.
25. As noted in US Nuclear Regulatory Commission Regulatory Guide 1.97—Criteria for Accident Monitoring Instrumentation for Nuclear Power Plants, Rev. 4, June 2006.
26. S. Hodge et al., Identification and Assessment of BWR In-Vessel Severe Accident Mitigation Strategies, NUREG/CR-5869 (ORNL/TM-12080), Oak Ridge National Laboratory, Oak Ridge, Tenn., October 1992.
27. Reactor Safety Study: An Assessment of Accident Risk in U. S. Commercial Nuclear Power Plants, WASH-1400 (NUREG-75-014), US Nuclear Regulatory Commission, October 1975.
28. Station Blackout at Browns Ferry Unit One—Accident Sequence Analysis, NUREG/CR-2182, November 1981.
29. D. N. Chien and D. J. Hanson, Accident Management Information Needs for a BWR with a MARK I Containment, NUREG/CR-5702, Idaho National Engineering Laboratory, May 1991.
61
30. Harri Tuomisto et al., Severe Accident Management Instrumentation in the Finnish NPPs, Proceedings of the OECD (NEA) CSNI Specialist Meeting on Instrumentation to Manage Severe Accidents held at Cologne, FRG, March 16–17, 1992, NEA/CSNI/R(92)11, July 1992.
31. US Nuclear Regulatory Commission, Severe Accident Risks: An Assessment for Five U. S. Nuclear Power Plants, NUREG-1150, Vols. 1–3, December 1990.
32. R. Chang et al., State-of-the-Art Reactor Consequences Analyses (SOARCA) Report–Draft for Comment, NUREG-1935, January 2012, p. 95.
33. Nuclear Energy Institute, “FLEX: The Industry Strategy to Enhance Safety,” safetyfirst.nei.org/industry-actions/flex-the-industry-strategy-to-enhance-safety/.
34. European Nuclear Safety Regulators Group, “EU Stress Tests and Follow-up,” www.ensreg.eu/EU-Stress-Tests.


APPENDIX
TABLES 5 AND 6 FROM NUREG/CR-5444: SUMMARY OF INSTRUMENT AVAILABILITY

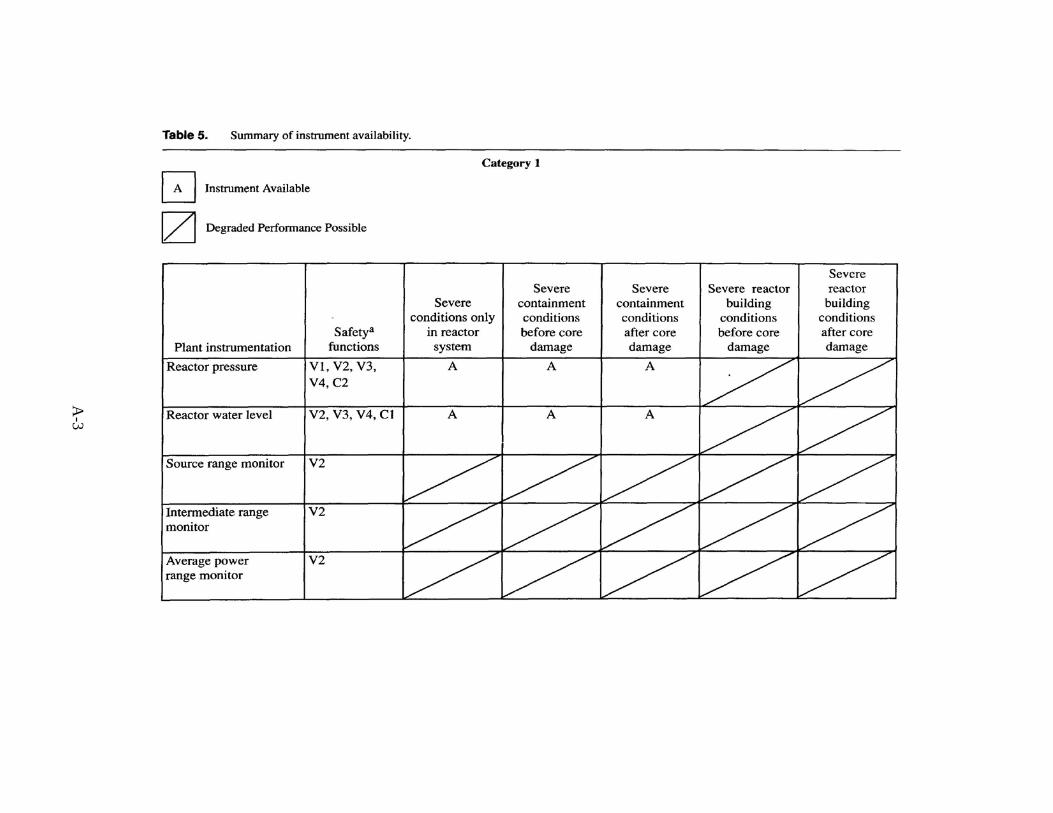
A-3
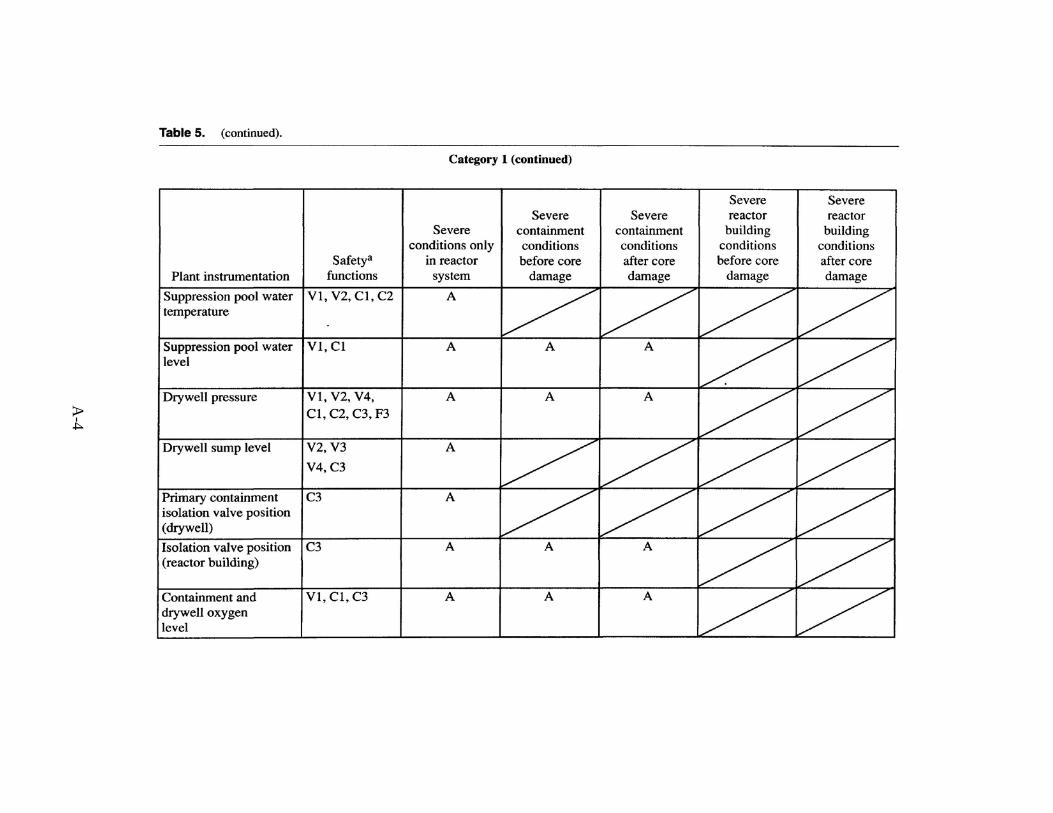
A-4
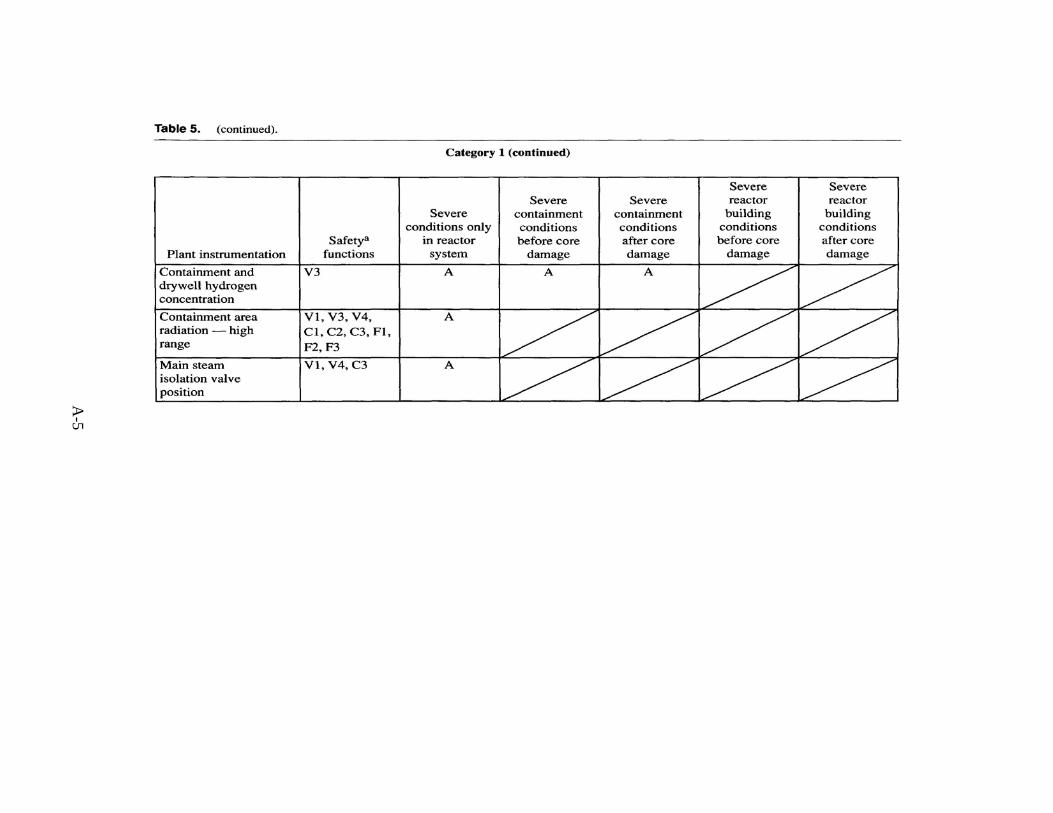
A-5
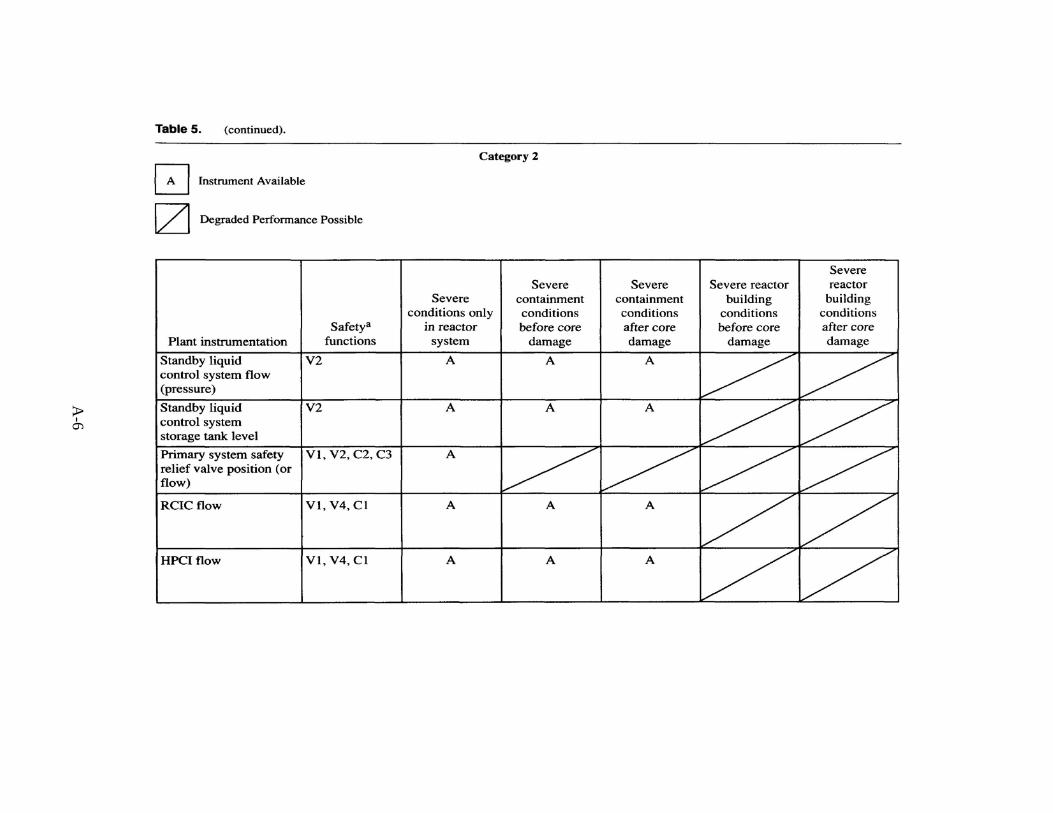
A-6
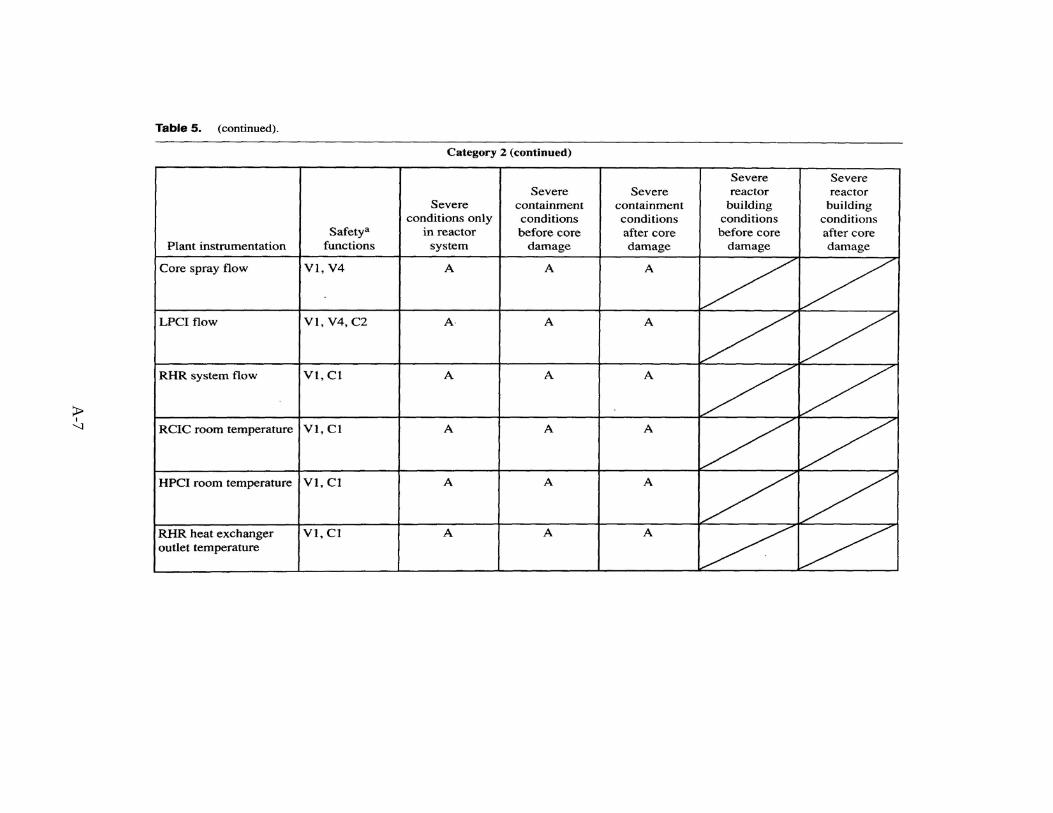
A-7
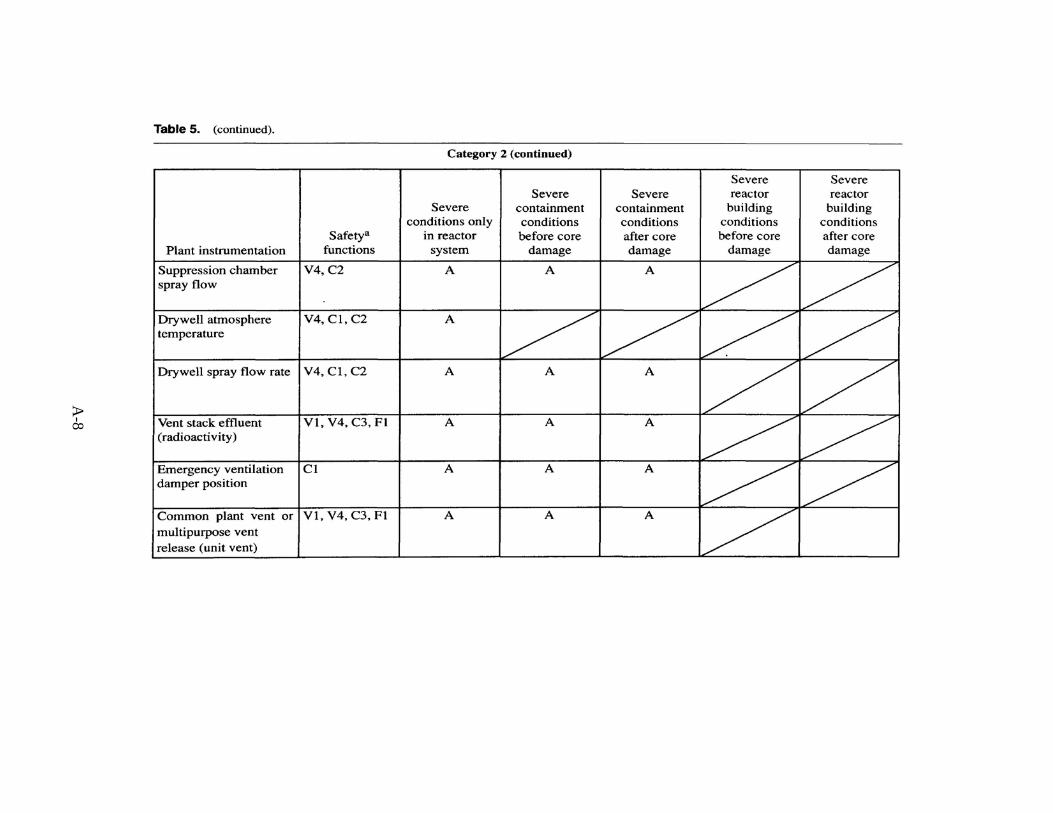
A-8
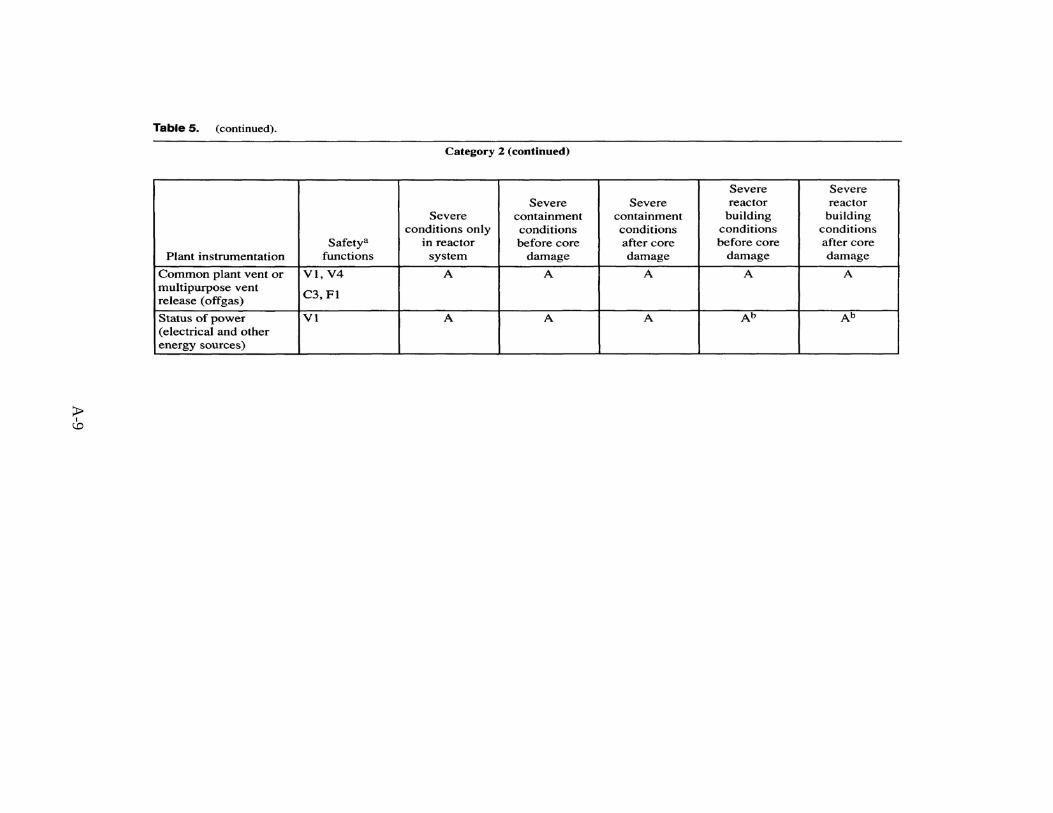
A-9
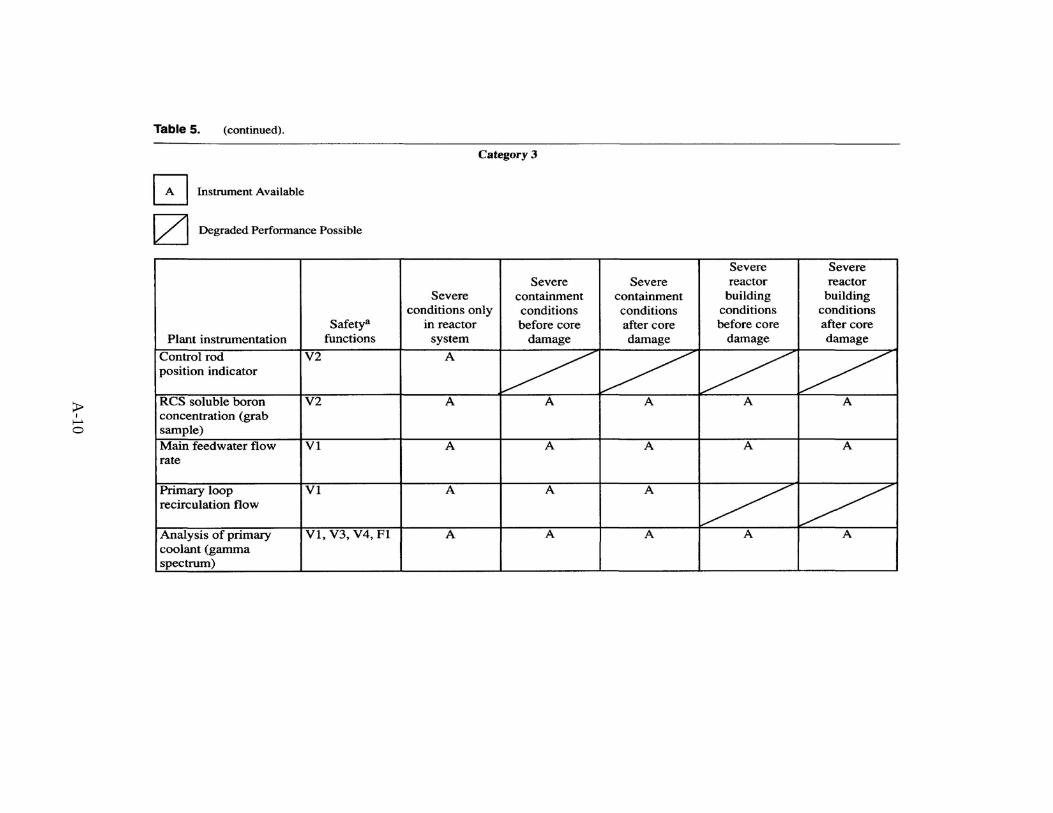
A-10

A-11
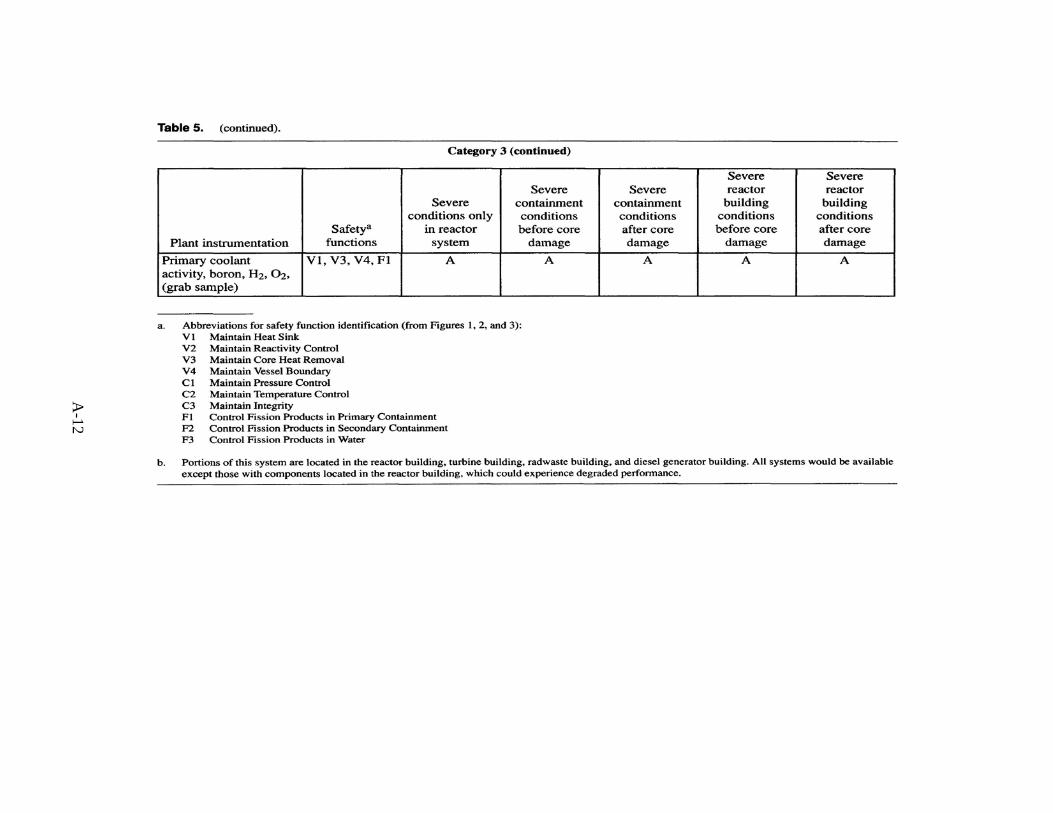
A-12
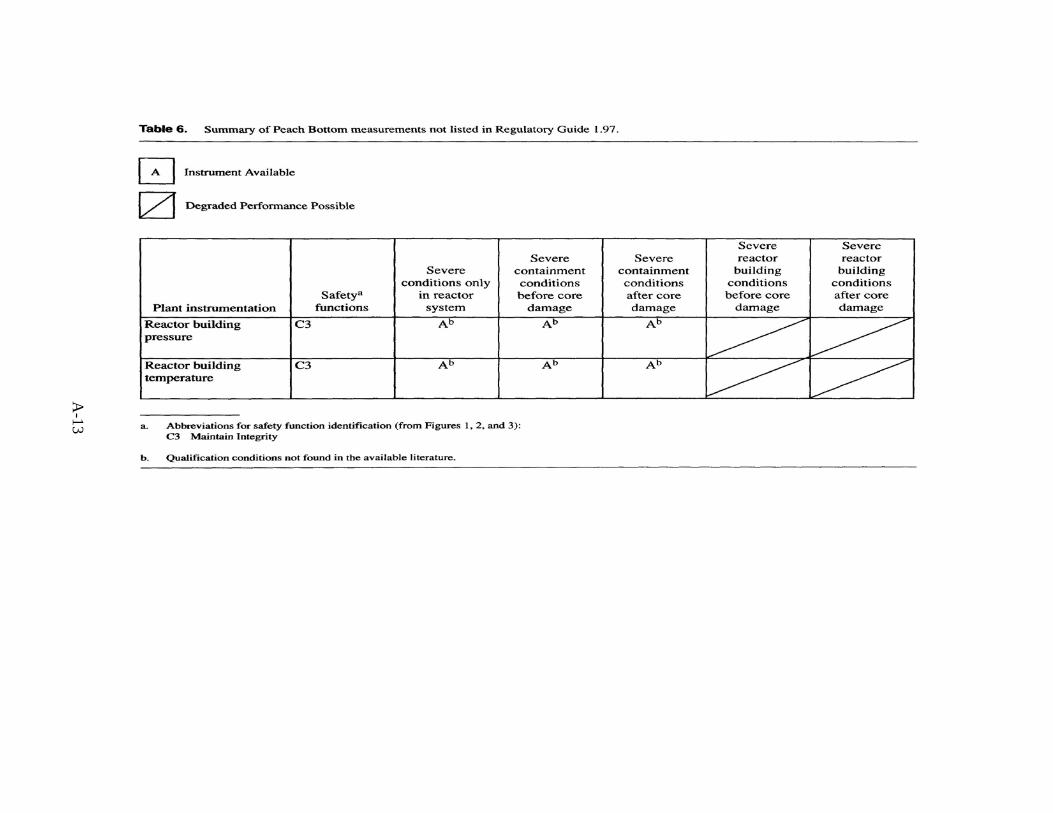
A-13