frtb markit modellability model: preliminary results€¦ · frtb markit modellability model:...
TRANSCRIPT

FRTB Markit Modellability Model: preliminary resultsMay 2017
FRTB Markit Modellability Model: preliminary results
Table of contents
Executive summary ........................................................................................................3
Regulatory context: addressing NMRFs ...................................................................... 4
The need for good, real data ...........................................................................................5
The need for rigour: introducing M3 .............................................................................6
Preliminary M3 results on selected risk factors ...........................................................7
Retaining flexibility ....................................................................................................... 9
The PLA / NMRF paradox .............................................................................................10
Conclusion and future enhancements .......................................................................10
The methodology and documentation behind M3 .................................................... 11
Appendix ......................................................................................................................... 12

3
FRTB Markit Modellability Model: preliminary results
Executive summaryIHS Markit and Oliver Wyman are launching the Markit Modellability Model (M3) – a rigorous methodology that allows firms to assess the modellability of the risk factors in their trading books. The technique can be used by firms for Quantitative Impact Studies (QIS) and to accelerate Internal Models Approach (IMA) waiver applications and address the significant ambiguity in the regulatory text.
A core component of M3 is the method used to segment continuous market data objects (e.g. IR curves) into buckets so that real price observations can be counted to assess risk factor modellability.
In this paper we present a sample of preliminary results from M3 using data across rates and credit for real-price observations in 2015 from MarkitSERV, our market-leading confirmation/affirmation platform. The results show that:
1. As expected, highly liquid yield curves are modellable at short, medium and long tenors
2. Medium-liquidity yield curves (1,000 – 10,000 transactions per year) display a range of modellability results. Non-modellable sections of these curves are commonly due to seasonal trading patterns
3. CDS curves are generally modellable around the 5Y tenor point, but not across the whole curve
If you would like to discuss the results of this report in more detail or learn more about our work on FRTB, please contact us at [email protected]
4
FRTB Markit Modellability Model: preliminary results
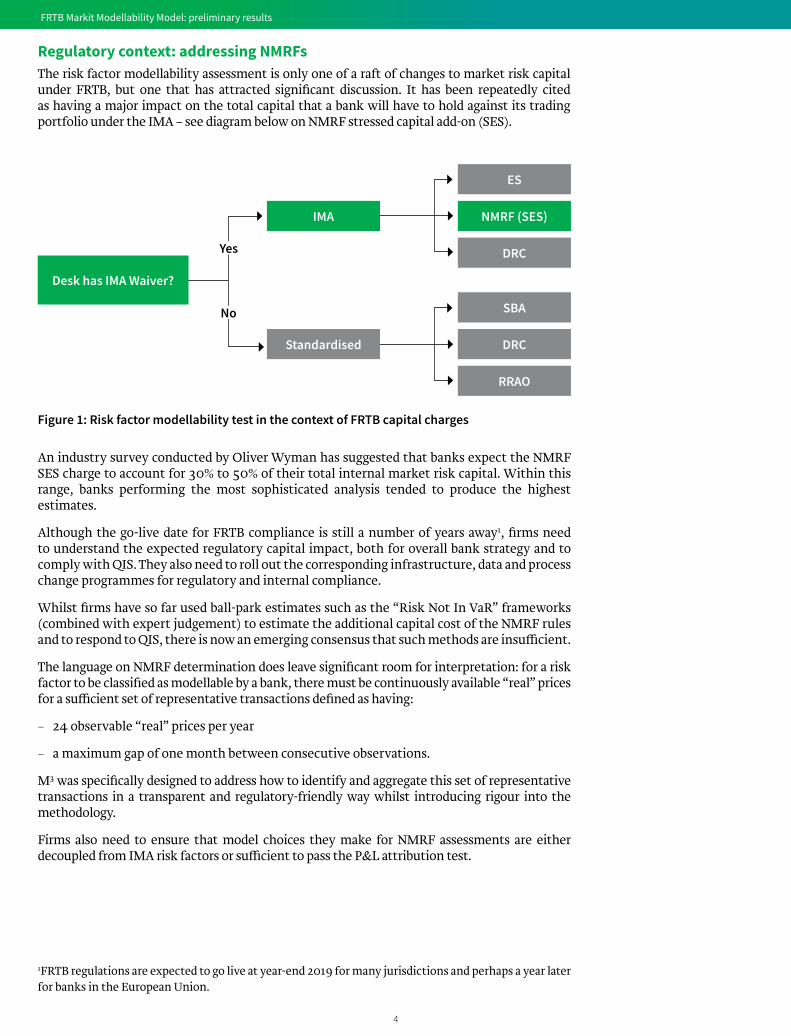
Regulatory context: addressing NMRFsThe risk factor modellability assessment is only one of a raft of changes to market risk capital under FRTB, but one that has attracted significant discussion. It has been repeatedly cited as having a major impact on the total capital that a bank will have to hold against its trading portfolio under the IMA – see diagram below on NMRF stressed capital add-on (SES).
ES
SBA
NMRF (SES)
Desk has IMA Waiver?
DRC
DRC
RRAO
IMA
Standardised
Yes
No
Figure 1: Risk factor modellability test in the context of FRTB capital charges
An industry survey conducted by Oliver Wyman has suggested that banks expect the NMRF SES charge to account for 30% to 50% of their total internal market risk capital. Within this range, banks performing the most sophisticated analysis tended to produce the highest estimates.
Although the go-live date for FRTB compliance is still a number of years away1, firms need to understand the expected regulatory capital impact, both for overall bank strategy and to comply with QIS. They also need to roll out the corresponding infrastructure, data and process change programmes for regulatory and internal compliance.
Whilst firms have so far used ball-park estimates such as the “Risk Not In VaR” frameworks (combined with expert judgement) to estimate the additional capital cost of the NMRF rules and to respond to QIS, there is now an emerging consensus that such methods are insufficient.
The language on NMRF determination does leave significant room for interpretation: for a risk factor to be classified as modellable by a bank, there must be continuously available “real” prices for a sufficient set of representative transactions defined as having:
‒ 24 observable “real” prices per year
‒ a maximum gap of one month between consecutive observations.
M3 was specifically designed to address how to identify and aggregate this set of representative transactions in a transparent and regulatory-friendly way whilst introducing rigour into the methodology.
Firms also need to ensure that model choices they make for NMRF assessments are either decoupled from IMA risk factors or sufficient to pass the P&L attribution test.
1FRTB regulations are expected to go live at year-end 2019 for many jurisdictions and perhaps a year later for banks in the European Union.
5
FRTB Markit Modellability Model: preliminary results
The need for good, real dataThe obvious challenge of the new NMRF assessment under FRTB seems to be the collection of observation data to evidence the count of and maximum gap between real prices.
Banks’ primary source of real-price observation data will most likely be their own transactions. However, the FRTB text also permits the use of third-party vendors to source this information.
IHS Markit has therefore launched the FRTB Modellability Service, which includes:
• Markit Risk Factor Utility (RFU), a cloud-based risk factor modelling environment for defining, deriving and monitoring risk factors
• Markit Modellability Model (M3), a module within the RFU which provides a methodolo-gy for risk factor modelling
• A unique and rich pool of transaction data, which combines contributions from leading banks with transactions from the market-leading MarkitSERV confirmation/affirmation platform.
At the time of publication, we are working with 20+ firms across all major regions to create a unique, cross-asset-class, global transaction data pool which can significantly reduce NMRFs. Banks have the option of supplementing this data with proprietary and third-party transaction data.
Leveraging this service, we have conducted a modellability study on rates and credit risk factors using MarkitSERV transaction data for 106 yield curves (covering 30 different currencies) and 1,389 CDS curves.
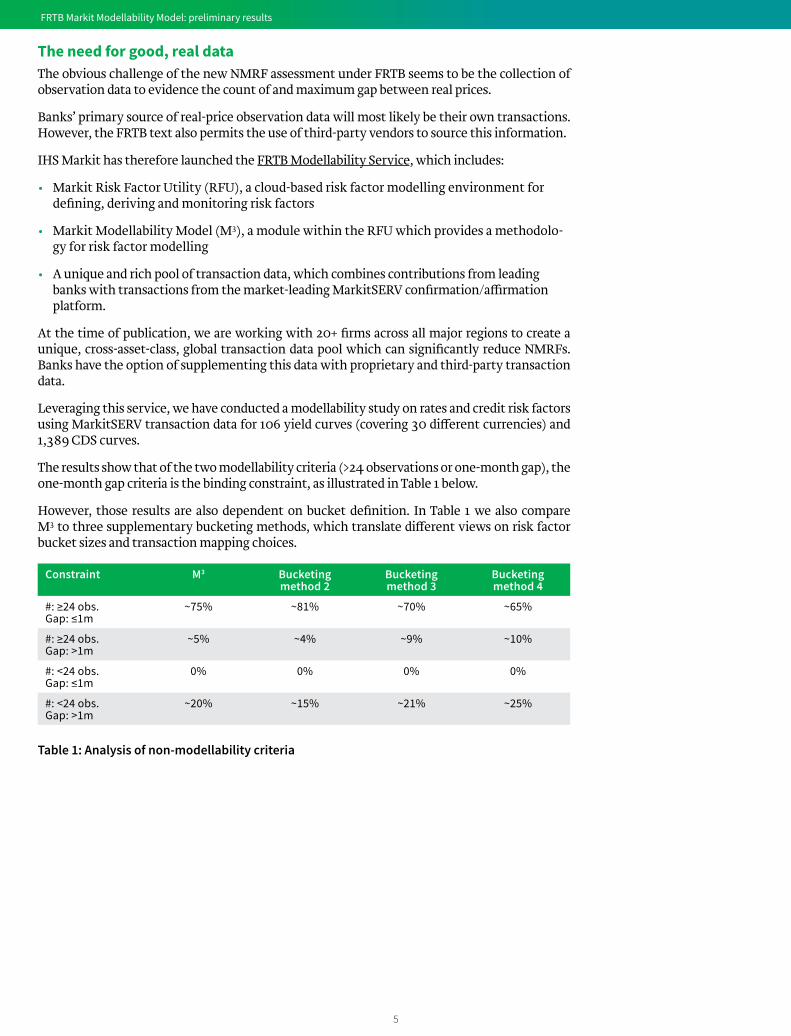
The results show that of the two modellability criteria (>24 observations or one-month gap), the one-month gap criteria is the binding constraint, as illustrated in Table 1 below.
However, those results are also dependent on bucket definition. In Table 1 we also compare M3 to three supplementary bucketing methods, which translate different views on risk factor bucket sizes and transaction mapping choices.
Constraint M3 Bucketing method 2
Bucketing method 3
Bucketing method 4
#: ≥24 obs.Gap: ≤1m
~75% ~81% ~70% ~65%
#: ≥24 obs.Gap: >1m
~5% ~4% ~9% ~10%
#: <24 obs.Gap: ≤1m
0% 0% 0% 0%
#: <24 obs.Gap: >1m
~20% ~15% ~21% ~25%
Table 1: Analysis of non-modellability criteria
6
FRTB Markit Modellability Model: preliminary results
The need for rigour: introducing M3
To perform meaningful NMRF tests, firms must now shift their focus to risk factors, as different choices of bucketing approaches will have a big impact on modellability results and consequently on capital.
Considerable ambiguity remains around what appropriate bucketing of “representative transactions” means, as described by the FRTB text. To accommodate this uncertainty without having to process millions of observations redundantly, transaction data is accessed via a bespoke and flexible modellability API within the RFU.
This approach enables banks to quickly and easily configure custom risk factor taxonomies, transaction-to-risk-factor mappings and bucketing settings to produce modellability results. The API also delivers a transparent lineage for both approved production settings and rapid what-ifs for QIS.
Built in partnership with Oliver Wyman, M3 introduces rigour into the methodology and pre-templates modellability settings within the RFU. As such, it significantly reduces the need for time-consuming and costly analysis and validation, such as:
1. Which transactions are eligible as an observation for each risk factor?
2. How should continuous risk factor objects be treated (such as yield curves and volatility surfaces)?
Addressing the first point (transaction-to-risk-factor mapping) requires a solution specific to each firm, with its own bespoke set of risk factors to cover. However, there are some common rules and principles which we believe will be applicable to the majority of institutions, and which we have pre-configured in M3.
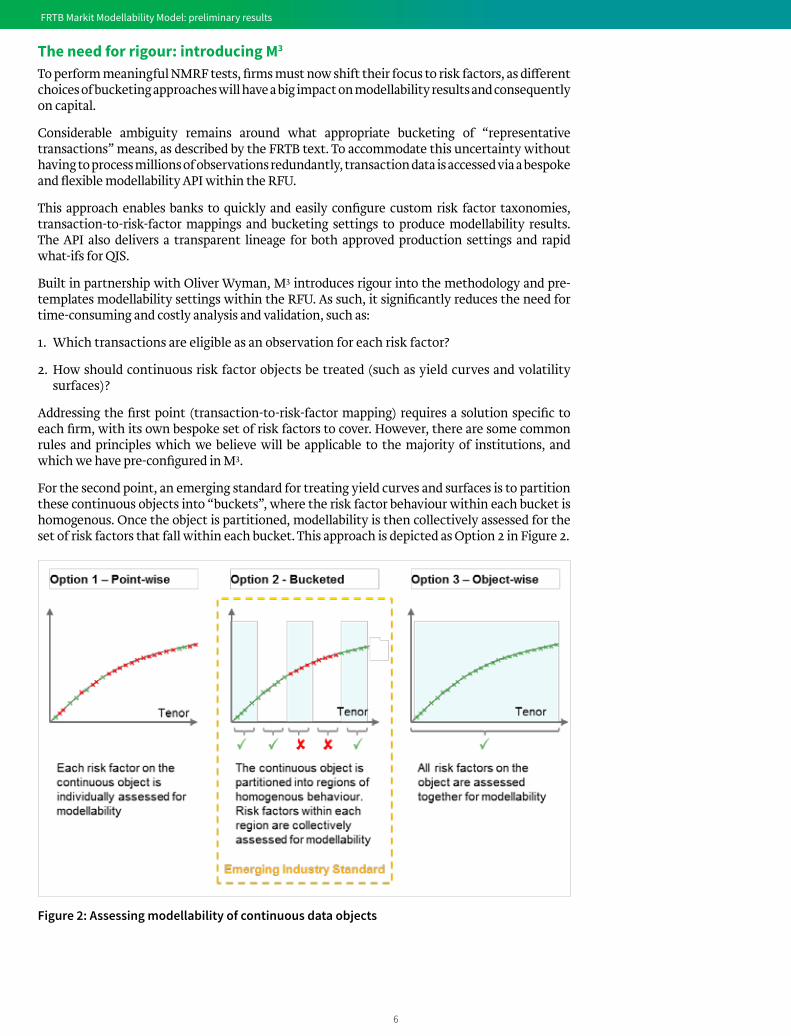
For the second point, an emerging standard for treating yield curves and surfaces is to partition these continuous objects into “buckets”, where the risk factor behaviour within each bucket is homogenous. Once the object is partitioned, modellability is then collectively assessed for the set of risk factors that fall within each bucket. This approach is depicted as Option 2 in Figure 2.
Figure 2: Assessing modellability of continuous data objects
7
FRTB Markit Modellability Model: preliminary results
Whilst M3 is based on the bucketing approach described in Option 2, the FRTB Modellability Service can still be individually configured to reflect any range of partitioning logic from Option 1 (point-wise) through to Option 3 (object-wise) with a number of nuances in between to accommodate internal model constraints. In that case, firms would still have to justify their chosen configuration with relevant analysis and documentation.
M3 focuses instead on delivering a template bucketed approach out of the box, which a firm may take as a given or adapt in whole or part.
In the next section, we present preliminary results of such a bucketing approach on representative IR and CR risk factors.
Preliminary M3 results on selected risk factors
Overview of approachUsing the MarkitSERV database combined with the M3 methodology, we have computed the modellability status of 106 yield curves (covering 30 different currencies) and 1,389 CDS curves. This study has been conducted using year-end 2015 as the snapshot date (i.e. transaction data from 2015 and calibrated using historical time-series data up to year-end 2015).
Rates – yield curvesThe liquidity of trading across the sample of 106 yield curves varies significantly, with the most liquid having more than 50,000 transactions per year, and the least liquid having fewer than 50.
Modellability results (status of all tenors)
Liquidity 100% MRF 75% MRF 50% MRF 25% MRF 100% NMRF Total
Very High(>50,000)
6 6
High(10,000 - 50,000)
15 2 17
Medium(1,000 - 10,000)
16 6 6 2 30
Low(50 - 1,000)
1 5 7 5 18
Very low(<50)
35 35
Total 38 8 11 9 40 106
Table 2: Yield curve summary modellability results
Table 2 displays a summary of the modellability results for yield curves. As expected, highly liquid curves are modellable at all tenors and very illiquid curves are not modellable at all. Medium-liquidity curves display a variety of results, ranging from full modellability to only a single section being modellable.
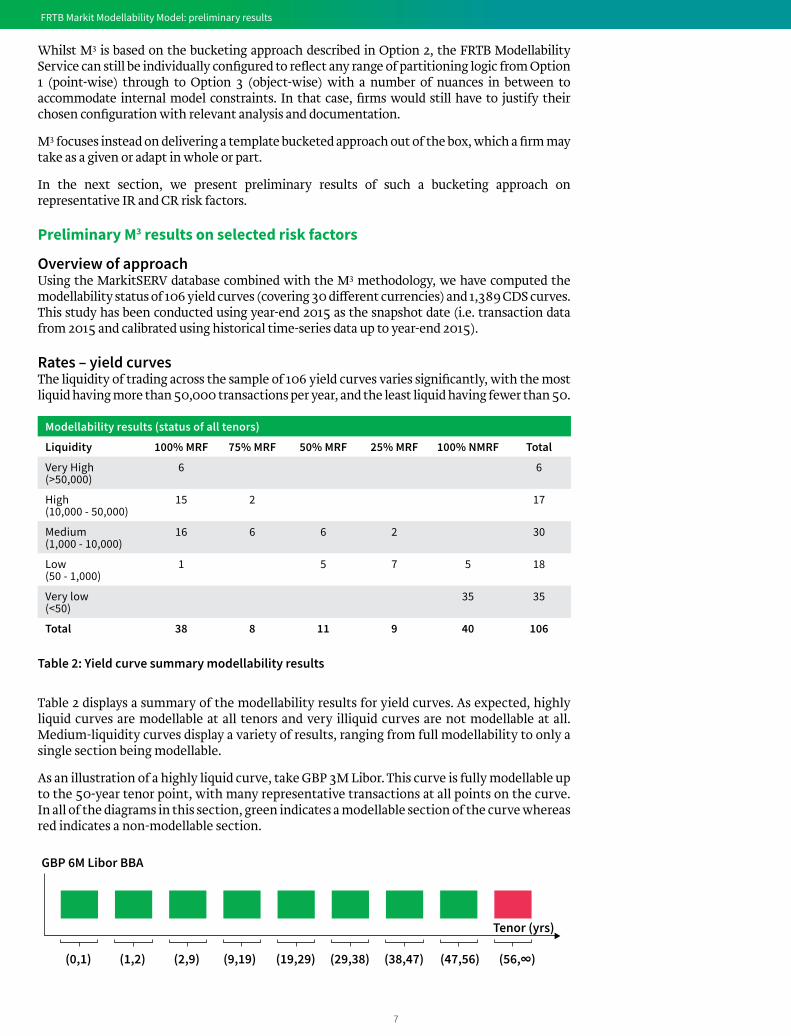
As an illustration of a highly liquid curve, take GBP 3M Libor. This curve is fully modellable up to the 50-year tenor point, with many representative transactions at all points on the curve. In all of the diagrams in this section, green indicates a modellable section of the curve whereas red indicates a non-modellable section.
GBP 6M Libor BBA
Tenor (yrs)
(0,1) (1,2) (2,9) (9,19) (47,56)(38,47)(29,38)(19,29) (56,∞)
8
FRTB Markit Modellability Model: preliminary results
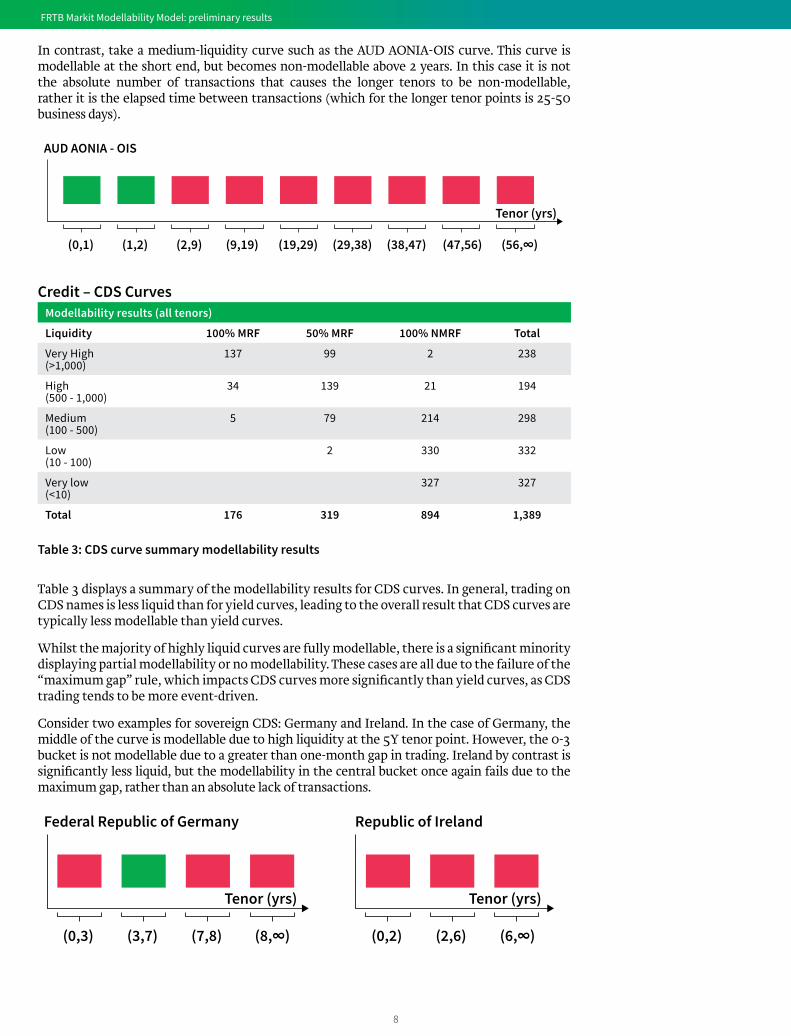
In contrast, take a medium-liquidity curve such as the AUD AONIA-OIS curve. This curve is modellable at the short end, but becomes non-modellable above 2 years. In this case it is not the absolute number of transactions that causes the longer tenors to be non-modellable, rather it is the elapsed time between transactions (which for the longer tenor points is 25-50 business days).
Credit – CDS CurvesModellability results (all tenors)
Liquidity 100% MRF 50% MRF 100% NMRF Total
Very High(>1,000)
137 99 2 238
High(500 - 1,000)
34 139 21 194
Medium(100 - 500)
5 79 214 298
Low(10 - 100)
2 330 332
Very low(<10)
327 327
Total 176 319 894 1,389
Table 3: CDS curve summary modellability results
Table 3 displays a summary of the modellability results for CDS curves. In general, trading on CDS names is less liquid than for yield curves, leading to the overall result that CDS curves are typically less modellable than yield curves.
Whilst the majority of highly liquid curves are fully modellable, there is a significant minority displaying partial modellability or no modellability. These cases are all due to the failure of the “maximum gap” rule, which impacts CDS curves more significantly than yield curves, as CDS trading tends to be more event-driven.
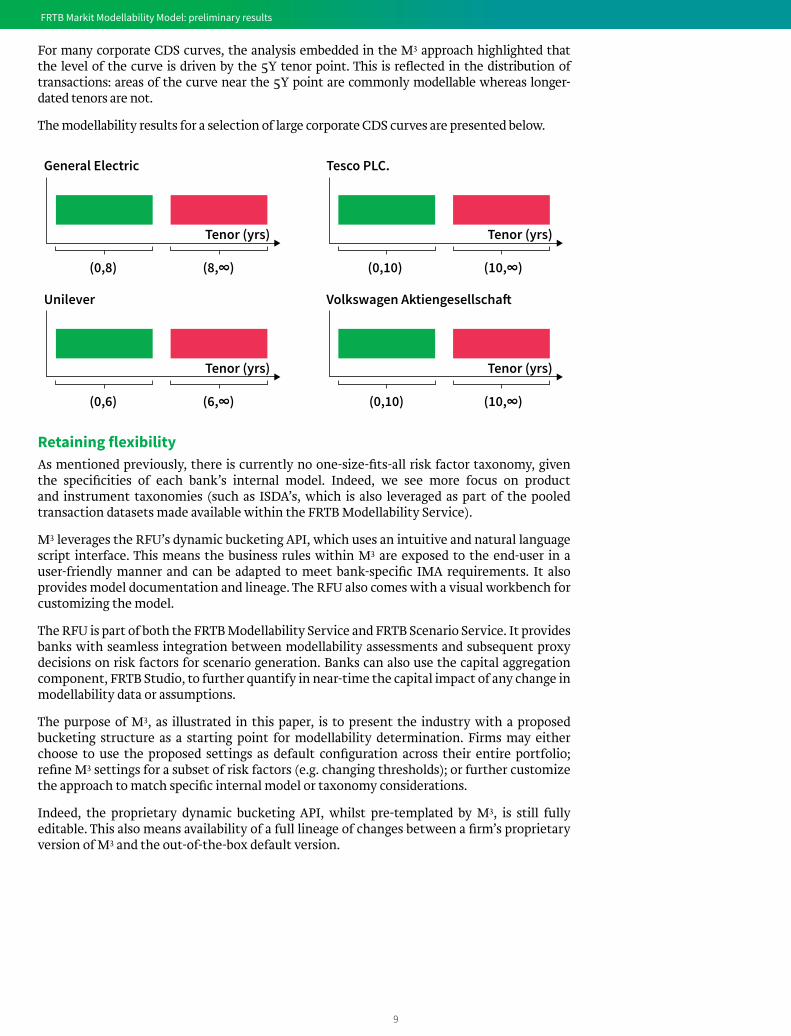
Consider two examples for sovereign CDS: Germany and Ireland. In the case of Germany, the middle of the curve is modellable due to high liquidity at the 5Y tenor point. However, the 0-3 bucket is not modellable due to a greater than one-month gap in trading. Ireland by contrast is significantly less liquid, but the modellability in the central bucket once again fails due to the maximum gap, rather than an absolute lack of transactions.
AUD AONIA - OIS
Tenor (yrs)
(0,1) (1,2) (2,9) (9,19) (47,56)(38,47)(29,38)(19,29) (56,∞)
Federal Republic of Germany Republic of Ireland
Tenor (yrs)
(0,3) (3,7) (7,8) (8,∞)
Tenor (yrs)
(0,2) (2,6) (6,∞)
9
FRTB Markit Modellability Model: preliminary results
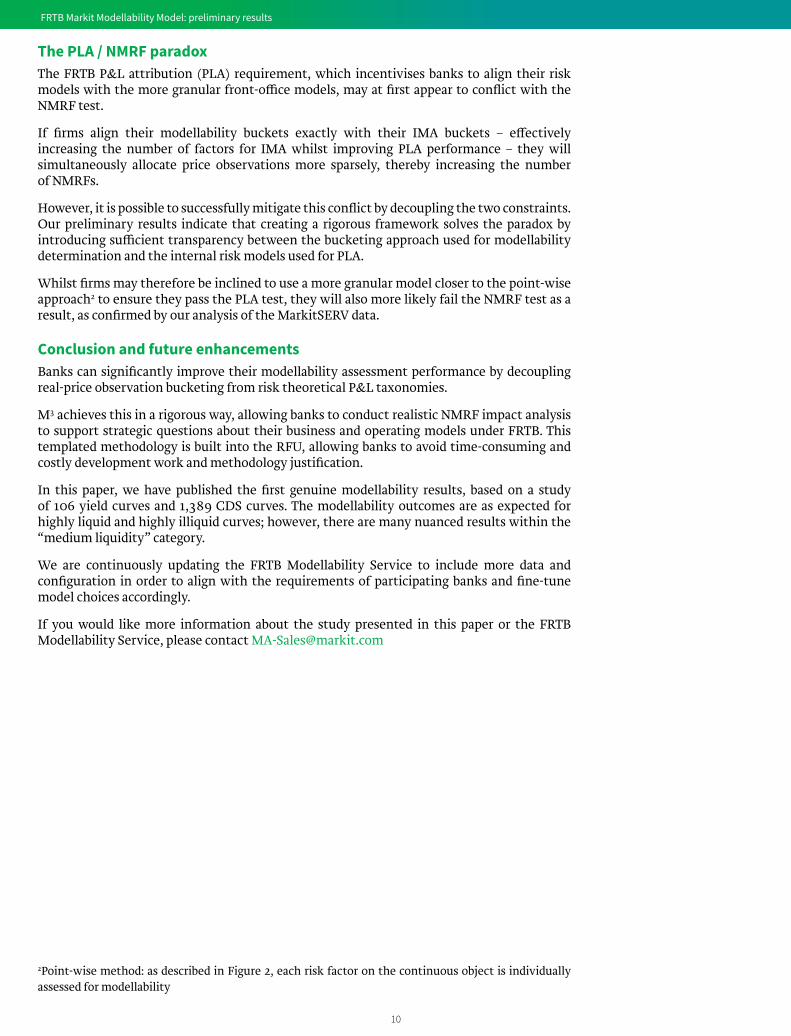
For many corporate CDS curves, the analysis embedded in the M3 approach highlighted that the level of the curve is driven by the 5Y tenor point. This is reflected in the distribution of transactions: areas of the curve near the 5Y point are commonly modellable whereas longer-dated tenors are not.
The modellability results for a selection of large corporate CDS curves are presented below.
Retaining flexibilityAs mentioned previously, there is currently no one-size-fits-all risk factor taxonomy, given the specificities of each bank’s internal model. Indeed, we see more focus on product and instrument taxonomies (such as ISDA’s, which is also leveraged as part of the pooled transaction datasets made available within the FRTB Modellability Service).
M3 leverages the RFU’s dynamic bucketing API, which uses an intuitive and natural language script interface. This means the business rules within M3 are exposed to the end-user in a user-friendly manner and can be adapted to meet bank-specific IMA requirements. It also provides model documentation and lineage. The RFU also comes with a visual workbench for customizing the model.
The RFU is part of both the FRTB Modellability Service and FRTB Scenario Service. It provides banks with seamless integration between modellability assessments and subsequent proxy decisions on risk factors for scenario generation. Banks can also use the capital aggregation component, FRTB Studio, to further quantify in near-time the capital impact of any change in modellability data or assumptions.
The purpose of M3, as illustrated in this paper, is to present the industry with a proposed bucketing structure as a starting point for modellability determination. Firms may either choose to use the proposed settings as default configuration across their entire portfolio; refine M3 settings for a subset of risk factors (e.g. changing thresholds); or further customize the approach to match specific internal model or taxonomy considerations.
Indeed, the proprietary dynamic bucketing API, whilst pre-templated by M3, is still fully editable. This also means availability of a full lineage of changes between a firm’s proprietary version of M3 and the out-of-the-box default version.
General Electric
Tenor (yrs)
(0,8) (8,∞)
Tesco PLC.
Tenor (yrs)
(0,10) (10,∞)
Unilever
Tenor (yrs)
(0,6) (6,∞)
Volkswagen Aktiengesellscha�
Tenor (yrs)
(0,10) (10,∞)
10
FRTB Markit Modellability Model: preliminary results
The PLA / NMRF paradoxThe FRTB P&L attribution (PLA) requirement, which incentivises banks to align their risk models with the more granular front-office models, may at first appear to conflict with the NMRF test.
If firms align their modellability buckets exactly with their IMA buckets – effectively increasing the number of factors for IMA whilst improving PLA performance – they will simultaneously allocate price observations more sparsely, thereby increasing the number of NMRFs.
However, it is possible to successfully mitigate this conflict by decoupling the two constraints. Our preliminary results indicate that creating a rigorous framework solves the paradox by introducing sufficient transparency between the bucketing approach used for modellability determination and the internal risk models used for PLA.
Whilst firms may therefore be inclined to use a more granular model closer to the point-wise approach2 to ensure they pass the PLA test, they will also more likely fail the NMRF test as a result, as confirmed by our analysis of the MarkitSERV data.
Conclusion and future enhancementsBanks can significantly improve their modellability assessment performance by decoupling real-price observation bucketing from risk theoretical P&L taxonomies.
M3 achieves this in a rigorous way, allowing banks to conduct realistic NMRF impact analysis to support strategic questions about their business and operating models under FRTB. This templated methodology is built into the RFU, allowing banks to avoid time-consuming and costly development work and methodology justification.
In this paper, we have published the first genuine modellability results, based on a study of 106 yield curves and 1,389 CDS curves. The modellability outcomes are as expected for highly liquid and highly illiquid curves; however, there are many nuanced results within the “medium liquidity” category.
We are continuously updating the FRTB Modellability Service to include more data and configuration in order to align with the requirements of participating banks and fine-tune model choices accordingly.
If you would like more information about the study presented in this paper or the FRTB Modellability Service, please contact [email protected]
2Point-wise method: as described in Figure 2, each risk factor on the continuous object is individually assessed for modellability
11
FRTB Markit Modellability Model: preliminary results
The methodology and documentation behind M3
M3 provides an out-of-the-box configuration for:
a. Transaction-to-risk-factor mapping – rule-based approach for associating transactions with risk factors
b. Tenor mapping - rule-based approach for defining which tenor point(s) a given transaction can represent on a continuous risk factor object
c. Risk factor bucketing – quantitative analytical approach for partitioning risk factor curves and surfaces
This pre-configured and ready-to-use template has been constructed using a “no black boxes” philosophy: each calculation step is visible in the RFU and is supported by thorough documentation. However, as noted above, the requirements and risk factor definitions of each bank are different. Therefore, M3 configurations are fully modifiable: users can change any and all settings as needed.
The M3 bucketing methodologyM3 applies robust statistical methods to determine which price observations are “representative” of which risk factors (such as yield curve buckets) based on the historical movements of risk factors and the observation data itself.
The results displayed in this paper use the current configuration of the M3 approach for partitioning risk factor curves. We anticipate that the resulting buckets may change with further testing and refinement of the method, and with updates incorporating more recent market data (for this study we have used 2015 transaction data).
The M3 bucketing methodology takes into account the following considerations:
• Correlation – to determine which risk factors within a curve behave homogenously, we make use of historical correlation analysis. Taking a yield curve for example, if the 1Y, 2Y and 3Y tenor points all move in a highly correlated fashion, this justifies their collective assessment for the purposes of modellability (a single observation of any of the three risk factors is effectively an observation of all three). As such we have analysed relevant time-series data for each risk factor set and put in place a threshold for the minimum required correlation within a bucket.
• Stability – we have also tested the stability of different bucketing regimes to avoid excessive switching of buckets between modellable and non-modellable statuses as we move through time. We have received feedback from both banks and regulators that such switching effects are generally undesirable for industry participants and market stability.
• End points – we follow the general principle that interpolation is easier to justify than extrapolation so we have handled the outer boundaries of curves with care. For example, typically there are only a handful of transactions in the longer tenors of a yield curve. We use the positions of these transactions on the curve to take a view on where modellability ends, rather than assuming that modellability can be extended out to infinity through aggregation/bucketing.
One core design principle of M3 is the dynamic bucketing approach: whilst the buckets themselves may not be static, the parameters of the algorithms used to determine the buckets are deterministic and supported by a robust, justified and verifiable approach.
Throughout the development of the FRTB Modellability Service and M3, we have engaged with global regulators to obtain feedback on the pooling and analytical components. We will continue this dialogue to ensure that the solution is of the correct standard to support IMA banks as the regulatory requirements evolve.
12
FRTB Markit Modellability Model: preliminary results
Appendix
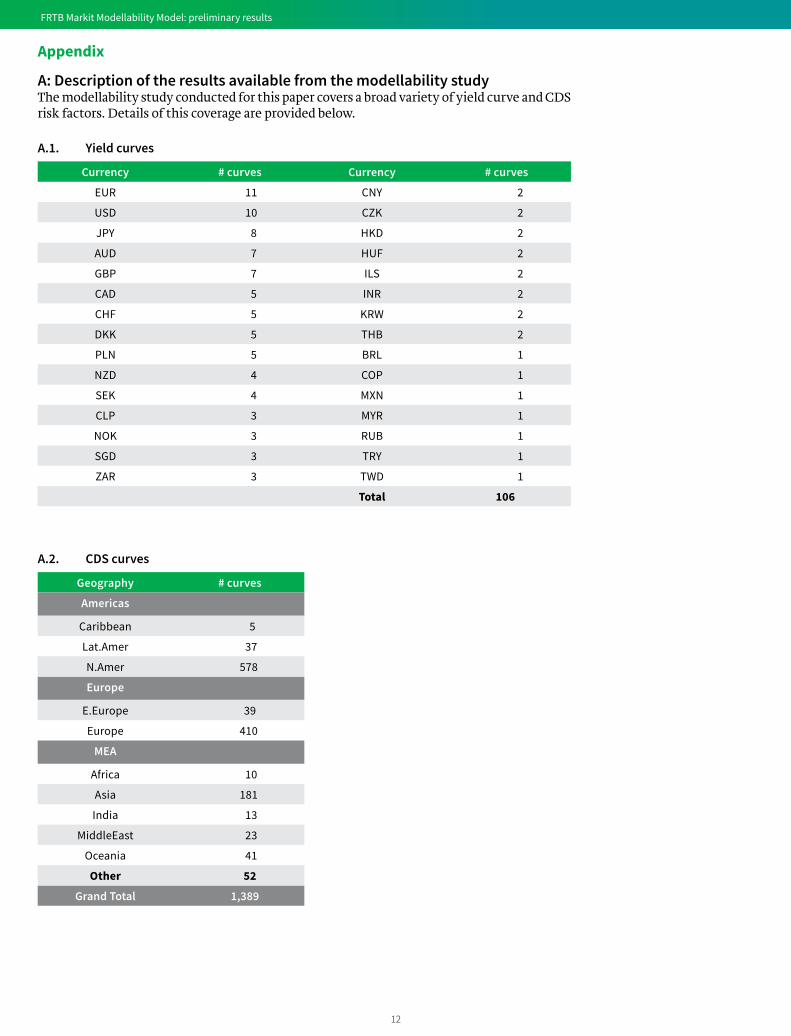
A: Description of the results available from the modellability studyThe modellability study conducted for this paper covers a broad variety of yield curve and CDS risk factors. Details of this coverage are provided below.
A.1. Yield curves
Currency # curves Currency # curves
EUR 11 CNY 2
USD 10 CZK 2
JPY 8 HKD 2
AUD 7 HUF 2
GBP 7 ILS 2
CAD 5 INR 2
CHF 5 KRW 2
DKK 5 THB 2
PLN 5 BRL 1
NZD 4 COP 1
SEK 4 MXN 1
CLP 3 MYR 1
NOK 3 RUB 1
SGD 3 TRY 1
ZAR 3 TWD 1
Total 106
A.2. CDS curves
Geography # curves
Americas
Caribbean 5
Lat.Amer 37
N.Amer 578
Europe
E.Europe 39
Europe 410
MEA
Africa 10
Asia 181
India 13
MiddleEast 23
Oceania 41
Other 52
Grand Total 1,389
13
FRTB Markit Modellability Model: preliminary results
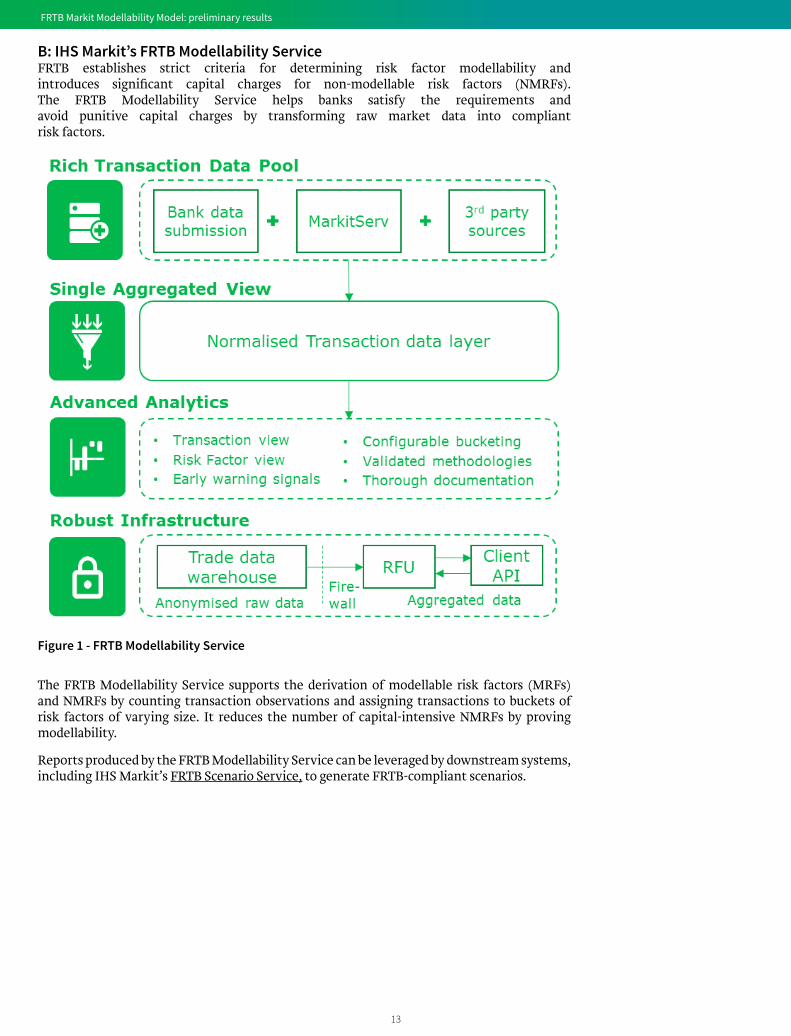
B: IHS Markit’s FRTB Modellability ServiceFRTB establishes strict criteria for determining risk factor modellability and introduces significant capital charges for non-modellable risk factors (NMRFs). The FRTB Modellability Service helps banks satisfy the requirements and avoid punitive capital charges by transforming raw market data into compliant risk factors.
Figure 1 - FRTB Modellability Service
The FRTB Modellability Service supports the derivation of modellable risk factors (MRFs) and NMRFs by counting transaction observations and assigning transactions to buckets of risk factors of varying size. It reduces the number of capital-intensive NMRFs by proving modellability.
Reports produced by the FRTB Modellability Service can be leveraged by downstream systems, including IHS Markit’s FRTB Scenario Service, to generate FRTB-compliant scenarios.
14
FRTB Markit Modellability Model: preliminary results
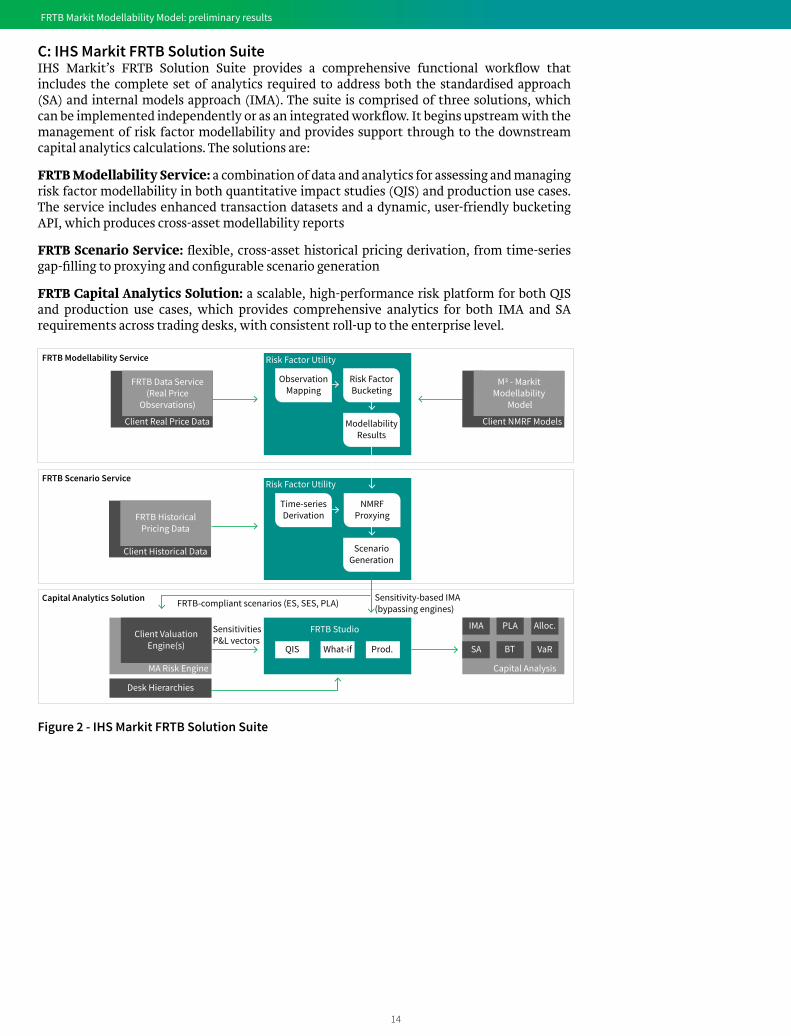
C: IHS Markit FRTB Solution SuiteIHS Markit’s FRTB Solution Suite provides a comprehensive functional workflow that includes the complete set of analytics required to address both the standardised approach (SA) and internal models approach (IMA). The suite is comprised of three solutions, which can be implemented independently or as an integrated workflow. It begins upstream with the management of risk factor modellability and provides support through to the downstream capital analytics calculations. The solutions are:
FRTB Modellability Service: a combination of data and analytics for assessing and managing risk factor modellability in both quantitative impact studies (QIS) and production use cases. The service includes enhanced transaction datasets and a dynamic, user-friendly bucketing API, which produces cross-asset modellability reports
FRTB Scenario Service: flexible, cross-asset historical pricing derivation, from time-series gap-filling to proxying and configurable scenario generation
FRTB Capital Analytics Solution: a scalable, high-performance risk platform for both QIS and production use cases, which provides comprehensive analytics for both IMA and SA requirements across trading desks, with consistent roll-up to the enterprise level.
FRTB Data Service(Real Price
Observations)
Client Real Price Data
M3 - MarkitModellability
Model
Client NMRF Models
Client ValuationEngine(s)
MA Risk Engine
Desk Hierarchies
FRTB HistoricalPricing Data
Client Historical Data
Time-seriesDerivation
NMRFProxying
ScenarioGeneration
Risk Factor Utility
IMA
Capital Analysis
SA
PLA
BT
Alloc.
VaRFRTB Studio
Risk Factor Utility
ObservationMapping
ModellabilityResults
Risk FactorBucketing
FRTB Studio
QIS What-if Prod.
FRTB-compliant scenarios (ES, SES, PLA) Sensitivity-based IMA(bypassing engines)
SensitivitiesP&L vectors
FRTB Modellability Service
FRTB Scenario Service
Capital Analytics Solution
Figure 2 - IHS Markit FRTB Solution Suite

15
FRTB Markit Modellability Model: preliminary results
Glossary
Term Description
ETL Extract Transfer Load
FRTB Fundamental Review of the Trading Book
ICS Interactive Capital Study
IMA Internal Model Approach (under FRTB)
M3 Markit Modellability Model – optional component
NMRF Non-Modellable Risk Factors
PLA P&L Attribution
QIS Quantitative Impact Study
RFU Risk Factor Utility
SA Standardised Approach (under FRTB)
UI/API User Interface / Application Protocol Interface

Copyright © 2017 IHS Markit. All Rights Reserved 144815083-CU-0417
About IHS MarkitIHS Markit (Nasdaq: INFO) is a world leader in critical information, analytics and solutions for the major industries and markets that drive economies worldwide. The company delivers next-generation information, analytics and solutions to customers in business, finance and government, improving their operational efficiency and providing deep insights that lead to well-informed, confident decisions. IHS Markit has more than 50,000 key business and government customers, including 85 percent of the Fortune Global 500 and the world’s leading financial institutions. Headquartered in London, IHS Markit is committed to sustainable, profitable growth.
For more information www.ihsmarkit.com
customer care americasT +1 800 447 2273
+1 303 858 6187 (Outside US/Canada)
customer care europe, middle east, africaT +44 1344 328 300
customer care asia pacificT +604 291 3600
FRTB Markit Modellability Model: preliminary results
DisclaimerThe information contained in this document has been compiled by IHS Markit and includes material which may have been obtained from information provided by various sources and discussions with management but has not been verified or audited. This document also contains material proprietary to IHS Markit.
Whilst IHS Markit has used its reasonable endeavours to ensure that the information contained in this document is accurate, IHS Markit does not guarantee that the document is free from errors or omissions. No representation or warranty, express or implied, is given and no responsibility or liability is or will be accepted by or on behalf of IHS Markit or by any of its partners, members, employees, agents or any other person as to the accuracy, completeness, fitness for a purpose, merchantability, non-infringement or correctness of the information contained in this document or any other oral information made available and any such responsibility and liability is expressly disclaimed. IHS Markit is not responsible for any commitments or actions that any person may take in relation to this document. IHS Markit shall not be held liable for any loss or damage whatsoever resulting from reliance on the information contained herein.
This document and its contents are confidential and prepared solely for your information, and may not be reproduced, redistributed or passed on, directly or indirectly, to any other person in whole or in part. Therefore you should not refer to or use our name or this document for any other purpose, disclose them or refer to them in any prospectus or other document, or make them available or communicate them to any other party.
This document is not an offer and is not intended to be contractually binding.