frontierscanadianequitypool interimfinancialreports(unaudited) · frontierscanadianequitypool...
TRANSCRIPT

The accompanying notes are an integral part of these financial statements.
Frontiers Canadian Equity Pool
Interim Financial Reports (unaudited)for the period ended February 29, 2016
† Securities LendingThe tables that follow indicate the Pool had assets involved in securities lending transactionsoutstanding as at February 29, 2016 and August 31, 2015:
Aggregate Valueof Securities
on Loan($000s)
AggregateValue
of Collateralfor Loan
($000s)x
x
February 29, 2016 47,003 49,298x
August 31, 2015 36,338 38,172x
Collateral Type* ($000s)i ii iii iv
xx
February 29, 2016 8,552 40,644 – 102x
August 31, 2015 3,338 34,834 – –x
x
* See note 2j for Collateral Type definitions.
Organization of the Pool (note 1)The Pool was established on November 19, 1999 (Date Established).
Inception Datexx
Class A November 24, 1999x
Class C February 16, 2006x
Class I April 4, 2006x
Class O March 15, 2005xx
Statements of Financial Position (unaudited)(in 000s, except per unit amounts)
As at February 29, 2016 and August 31, 2015 (note 1)
February 29, 2016 August 31, 2015x
x
Assetsxxx
Current assetsx
Investments (non-derivative financial assets) † (notes2 and 3) $ 307,304 $ 343,976
x
Cash including foreign currency holdings, at fair value 4,167 7,716x
Margin 943 193x
Interest receivable 2 10x
Dividends receivable 533 610x
Receivable for portfolio securities sold 2,253 1,770x
Receivable for units issued 721 169x
Derivative assets 742 –xxx
Total Assets 316,665 354,444xxx
Liabilitiesxxx
Current liabilitiesx
Payable for portfolio securities purchased 1,354 3,731x
Payable for units redeemed 486 2,056x
Management fees payable – 1x
Derivative liabilities 45 138xxx
Total Liabilities 1,885 5,926xxx
Net Assets Attributable to Holders ofRedeemable Units (note 5) $ 314,780 $ 348,518
xxx
Net Assets Attributable to Holders ofRedeemable Units per Class
x
Class A $ 82,168 $ 86,927x
Class C $ 8,214 $ 8,945x
Class I $ 3,169 $ 7,980x
Class O $ 221,229 $ 244,666xxx
Net Assets Attributable to Holders ofRedeemable Units per Unit (note 5)
x
Class A $ 20.50 $ 22.07x
Class C $ 10.50 $ 11.25x
Class I $ 10.28 $ 10.87x
Class O $ 12.75 $ 13.87x
1

The accompanying notes are an integral part of these financial statements.
Frontiers Canadian Equity Pool
Statements of Comprehensive Income (unaudited)(in 000s, except per unit amounts)
For the periods ended February 29, 2016 and February 28, 2015 (note 1)
February 29, 2016 February 28, 2015x
x
Net Gain (Loss) on Financial Instrumentsx
Interest for distribution purposes $ 140 $ 164x
Dividend revenue 4,011 4,765x
Derivative income (loss) (430) (392)x
Other changes in fair value of investments andderivatives
x
Net realized gain (loss) on sale of investments andderivatives 1,326 5,753
x
Net realized gain (loss) on foreign currency (notes 2fand g) (52) (1)
x
Net change in unrealized appreciation (depreciation)of investments and derivatives (21,127) (26,427)
xxx
Net Gain (Loss) on Financial Instruments ±±± (16,132) (16,138)xx
x
Other Incomex
Foreign exchange gain (loss) on cash (4) 1x
Securities lending revenue 62 44xxx
58 45xx
x
Expenses (note 6)x
Management fees ± 1,113 1,377x
Audit fees 7 4x
Custodial fees 24 27x
Independent review committee fees 1 1x
Legal fees 1 3x
Regulatory fees 10 11x
Transaction costs ±± 339 439x
Unitholder reporting costs 200 228x
Withholding taxes (note 7) 8 9x
Other expenses 4 6xxx
1,707 2,105xx
x
Expenses waived/absorbed by the Manager (124) (126)xx
x
1,583 1,979xx
x
Increase (Decrease) in Net Assets Attributable toHolders of Redeemable Units (excludingdistributions) (17,657) (18,072)
xx
x
Increase (Decrease) in Net Assets Attributable toHolders of Redeemable Units per Class(excluding distributions)
x
Class A $ (5,156) $ (5,663)x
Class C $ (519) $ (1,106)x
Class I $ (334) $ (1,017)x
Class O $ (11,648) $ (10,286)xxx
Average Number of Units Outstanding for thePeriod per Class
x
Class A 3,888 4,010x
Class C 780 1,105x
Class I 465 2,363x
Class O 17,429 18,024xxx
Increase (Decrease) in Net Assets Attributable toHolders of Redeemable Units per Unit(excluding distributions)
x
Class A $ (1.32) $ (1.41)x
Class C $ (0.67) $ (1.00)x
Class I $ (0.72) $ (0.43)x
Class O $ (0.67) $ (0.57)x
x
±±± Net Gain (Loss) on Financial InstrumentsNet Gain (Loss)
Category February 29, 2016 February 28, 2015x..
Financial assets at FVTPL:..
Held for Trading $ 115 $ (558)..
Designated at Inception (16,247) (15,580)......
Total financial assets at FVTPL $ (16,132) $ (16,138)..
± Maximum Chargeable Management Fee Rates (note 6)xx
Class A 2.25%x
Class C 1.65%x
Class I 0.65%x
Class O 0.00%xx
±± Brokerage Commissions and Fees (notes 8 and 9)
2016 2015x
x
Brokerage commissions and other fees ($000s)x
Total Paid 338 440x
Paid to CIBC World Markets Inc. 35 34x
Paid to CIBC World Markets Corp. – –x
Soft dollars ($000s)x
Total Paid 87 123x
Paid to CIBC World Markets Inc. and CIBC World Markets Corp. 6 6xx
Administrative and Other Fund Operating Expenses (note 9)
2016 2015x
x
($000s) 87 109xx
Service Provider (note 9)The amounts paid by the Pool (including all applicable taxes) to CIBC Mellon Trust Company forcustodial fees, and to CIBC Mellon Global Securities Services Company (CIBC GSS) for securitieslending, fund accounting and reporting, and portfolio valuation (all net of absorptions) for the periodsended February 29, 2016 and February 28, 2015 were as follows:
2016 2015x
x
($000s) 54 51xx
2

The accompanying notes are an integral part of these financial statements.
Frontiers Canadian Equity Poolx
Statements of Changes in Net Assets Attributable to Holders of Redeemable Units (unaudited)(in 000s)For the periods ended February 29, 2016 and February 28, 2015 (note 1)
Class A Units Class C Units Class I Units Class O Units
February 29,2016
February 28,2015
February 29,2016
February 28,2015
February 29,2016
February 28,2015
February 29,2016
February 28,2015
xx.
Increase (Decrease) in Net Assets Attributable toHolders of Redeemable Units (excludingdistributions) $ (5,156) $ (5,663) $ (519) $ (1,106) $ (334) $ (1,017) $ (11,648) $ (10,286)
xxx.
Distributions Paid or Payable to Holders ofRedeemable Units
x.
From net investment income – – (22) – (4) (489) (5,399) (5,553)x.
From net realized capital gains (745) – (44) – – – (2,172) –x.xx
(745) – (66) – (4) (489) (7,571) (5,553)xxx.
Redeemable Unit Transactionsx.
Amount received from the issuance of units 8,433 5,799 447 443 217 10,034 9,159 19,795x.
Amount received from reinvestment of distributions 742 – 65 – 4 483 7,571 5,553x.
Amount paid on redemptions of units (8,033) (10,073) (658) (10,686) (4,694) (2,343) (20,948) (17,302)x.xx
1,142 (4,274) (146) (10,243) (4,473) 8,174 (4,218) 8,046xxx.
Increase (Decrease) in Net Assets Attributable toHolders of Redeemable Units (4,759) (9,937) (731) (11,349) (4,811) 6,668 (23,437) (7,793)
x.
Net Assets Attributable to Holders of Redeemable Unitsat Beginning of Period 86,927 104,035 8,945 21,796 7,980 22,702 244,666 276,988
x.xx
Net Assets Attributable to Holders of Redeemable Unitsat End of Period $ 82,168 $ 94,098 $ 8,214 $ 10,447 $ 3,169 $ 29,370 $ 221,229 $ 269,195
xxx.
Redeemable Units Issued and Outstanding (note 5)x.
As at February 29, 2016 and February 28, 2015x.
Balance - beginning of period 3,939 4,126 795 1,710 734 1,831 17,635 17,584x.
Redeemable units issued 414 245 42 37 22 854 726 1,388x.
Redeemable units issued on reinvestments 35 – 6 – – 43 579 392x.xx
4,388 4,371 843 1,747 756 2,728 18,940 19,364x.
Redeemable units redeemed (379) (430) (61) (885) (448) (206) (1,590) (1,177)x.xx
Balance - end of period 4,009 3,941 782 862 308 2,522 17,350 18,187x
x
3

The accompanying notes are an integral part of these financial statements.
Frontiers Canadian Equity Poolx
x
Statements of Cash Flows (unaudited)(in 000s)For the periods ended February 29, 2016 and February 28, 2015 (note 1)
February 29, 2016 February 28, 2015xx.
Cash Flows from Operating Activitiesx.
Increase (Decrease) in Net Assets Attributable to Holders of Redeemable Units from Operations (excluding distributions) $ (17,657) $ (18,072)x.
Adjustments for:x.
Foreign exchange loss (gain) on cash 4 (1)x.
Net realized (gain) loss on sale of investments and derivatives (1,326) (5,753)x.
Net change in unrealized (appreciation) depreciation of investments and derivatives 21,127 26,427x.
Purchase of investments (172,068) (250,235)x.
Proceeds from the sale of investments 185,244 257,900x.
Margin (750) –x.
Interest receivable 8 (4)x.
Dividends receivable 77 (2)x.
Other liabilities (1) –x.xx
14,658 10,260xxx.
Cash Flows from Financing Activitiesx.
Amount received from the issuance of units 17,704 35,940x.
Amount paid on redemptions of units (35,903) (40,637)x.
Distributions paid to unitholders (4) (6)x.xx
(18,203) (4,703)xxx.
Increase (Decrease) in Cash during the Period (3,545) 5,557xxx.
Foreign Exchange Loss (Gain) on Cash (4) 1xxx.
Cash (Bank Overdraft) at Beginning of Period 7,716 2,923xxx.
Cash (Bank Overdraft) at End of Period $ 4,167 $ 8,481x
x.
Interest received $ 148 $ 160x.
Dividends received, net of withholding taxes $ 4,080 $ 4,754
4

The accompanying notes are an integral part of these financial statements.
Frontiers Canadian Equity Pool
x
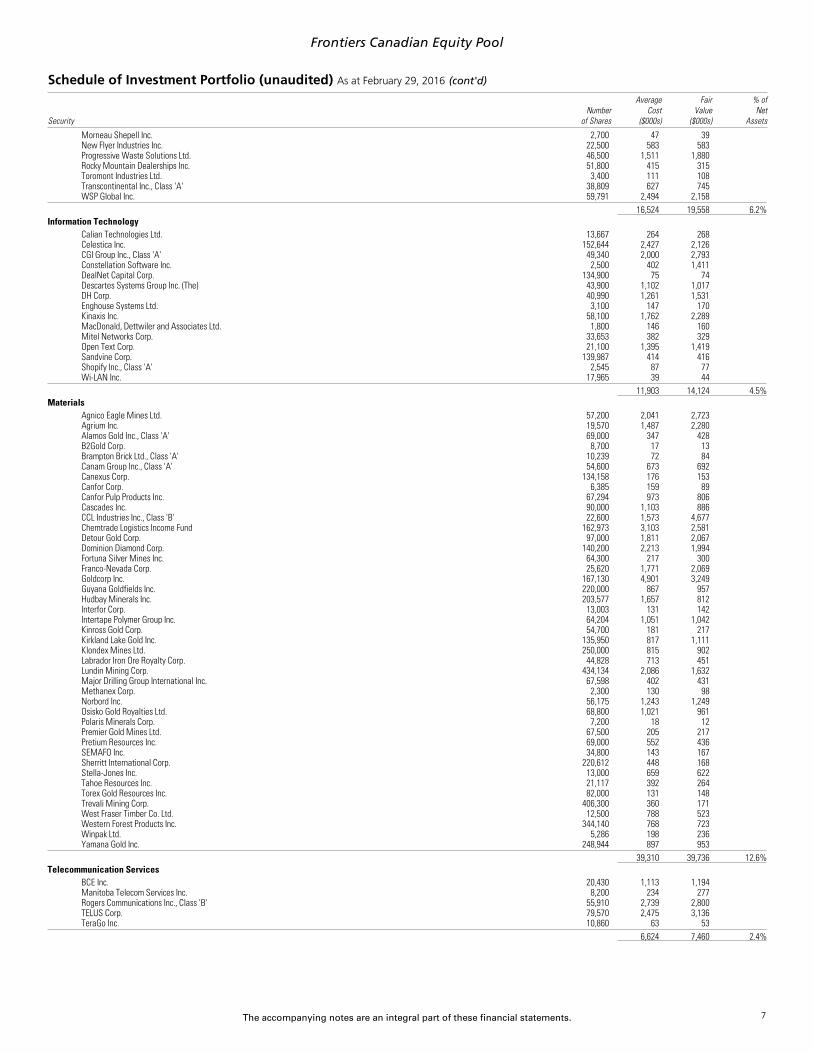
Schedule of Investment Portfolio (unaudited) As at February 29, 2016
SecurityNumber
of Shares
AverageCost
($000s)
FairValue
($000s)
% ofNet
Assets
CANADIAN EQUITIESx
Consumer Discretionary..
BRP Inc. 77,040 1,846 1,270..
Canadian Tire Corp. Ltd., Class 'A' 31,300 2,900 4,117..
Cara Operations Ltd. 19,026 638 464..
Cineplex Inc. 800 33 40..
Cogeco Communications Inc. 2,700 159 171..
Cogeco Inc. 10,349 595 549..
Diversified Royalty Corp. 31,900 86 67..
Dollarama Inc. 11,400 467 898..
Dorel Industries Inc., Class 'B' 20,946 744 672..
Gildan Activewear Inc. 83,760 2,085 2,930..
Glacier Media Inc. 188,407 284 164..
Great Canadian Gaming Corp. 75,424 1,538 1,404..
Hudson's Bay Co. 6,800 170 116..
IMAX Corp. 5,400 147 216..
Indigo Books & Music Inc. 27,477 310 409..
Linamar Corp. 21,558 1,428 1,274..
Magna International Inc., Class 'A' 85,950 2,205 4,512..
Quebecor Inc., Class 'B' 199,740 6,120 6,881..
Reitmans (Canada) Ltd. 6,584 41 30..
Reitmans (Canada) Ltd., Class 'A' 53,605 332 252..
Shaw Communications Inc., Class 'B' 19,500 525 457..
Sleep Country Canada Holdings Inc. 47,000 809 896..
Spin Master Corp. 5,405 99 124..
Torstar Corp., Class 'B' 69,929 456 139..
TVA Group Inc., Class 'B' 16,400 106 78..
Uni-Select Inc. 21,400 1,282 1,229..
....
25,405 29,359 9.3%..x
Consumer Staples..
AGT Food and Ingredients Inc. 24,518 819 899..
Alimentation Couche-Tard Inc., Class 'B' 85,500 1,980 5,234..
Cott Corp. 95,131 1,322 1,578..
George Weston Ltd. 6,000 624 661..
Lassonde Industries Inc., Class 'A' 2,808 384 446..
Liquor Stores NA Ltd. 23,700 344 197..
Loblaw Cos. Ltd. 19,000 1,223 1,306..
Maple Leaf Foods Inc. 20,100 402 458..
Metro Inc., Class 'A' 52,700 1,980 2,279..
Premium Brands Holdings Corp. 16,000 692 750..
Saputo Inc. 36,800 1,236 1,450..
Ten Peaks Coffee Co. Inc. 6,400 67 64..
....
11,073 15,322 4.9%..x
Energy..
Advantage Oil & Gas Ltd. 202,500 1,531 1,393..
AKITA Drilling Ltd., Class 'A' 38,997 419 253..
AltaGas Ltd. 52,131 1,835 1,677..
ARC Resources Ltd. 226,804 4,670 4,072..
Bonterra Energy Corp. 6,700 155 129..
Calfrac Well Services Ltd. 42,221 302 51..
Canadian Natural Resources Ltd. 101,120 3,266 2,860..
Canyon Services Group Inc. 33,500 170 135..
Cardinal Energy Ltd. 29,346 322 206..
Crew Energy Inc. 119,700 621 383..
Enbridge Inc. 66,900 3,747 3,197..
Enbridge Income Fund Holdings Inc. 1,086 36 31..
Encana Corp. 92,300 1,147 540..
Enerflex Ltd. 30,500 493 315..
Freehold Royalties Ltd. 62,100 717 664..
Gibson Energy Inc. 3,400 86 59..
Granite Oil Corp. 25,628 184 188..
Imperial Oil Ltd. 76,910 3,323 3,322..
Inter Pipeline Ltd. 47,762 1,467 1,185..
Keyera Corp. 49,997 2,033 1,875..
Macro Enterprises Inc. 16,500 58 31..
Newalta Corp. 15,403 35 42..
Nuvista Energy Ltd. 230,230 1,633 1,018..
Parex Resources Inc. 138,197 1,396 1,350..
Parkland Fuel Corp. 126,548 3,104 2,626..
Pason Systems Inc. 30,000 900 495..
Pembina Pipeline Corp. 33,100 987 1,116..
Peyto Exploration & Development Corp. 27,300 769 760..
PHX Energy Services Corp. 114,732 727 163..
Precision Drilling Corp. 10,600 49 46..
Raging River Exploration Inc. 131,000 948 1,233..
Savanna Energy Services Corp. 231,971 520 290..
Secure Energy Services Inc. 27,980 337 207..
ShawCor Ltd. 21,263 824 585..
Storm Resources Ltd. 39,186 166 131..
Suncor Energy Inc. 207,590 7,051 6,867..
Tamarack Valley Energy Ltd. 168,600 806 518
5

The accompanying notes are an integral part of these financial statements.
Frontiers Canadian Equity Pool
Schedule of Investment Portfolio (unaudited) As at February 29, 2016 (cont'd)
SecurityNumber
of Shares
AverageCost
($000s)
FairValue
($000s)
% ofNet
Assets..
Tidewater Midstream and Intrastructure Ltd. 149,400 202 221..
Total Energy Services Inc. 37,406 541 492..
TransCanada Corp. 97,450 4,436 4,838..
Trinidad Drilling Ltd. 86,080 305 128..
Valeura Energy Inc. 5,000 3 4..
Veresen Inc. 98,700 1,604 785..
Vermilion Energy Inc. 28,716 1,345 1,057..
Western Energy Services Corp. 39,757 331 140..
Whitecap Resources Inc. 98,700 1,371 755..
....
56,972 48,433 15.4%..x
Financials..
Alignvest Acquisition Corp., Class 'A', Restricted 57,327 559 554..
Alignvest Acquisition Corp., Class 'A', Warrants, 06/15/2023 28,663 14 8..
Bank of Montreal 91,269 6,183 6,813..
Bank of Nova Scotia 54,547 2,377 2,987..
Brookfield Asset Management Inc., Class 'A' 183,797 7,021 7,634..
Canadian Apartment Properties REIT 52,000 1,442 1,491..
Canadian Imperial Bank of Commerce 67,160 5,446 6,041..
Canadian Western Bank 26,002 684 518..
Chartwell Retirement Residences 54,600 668 708..
Colliers International Group Inc. 35,100 1,034 1,632..
Cominar REIT 56,527 980 864..
Crombie REIT 7,671 96 103..
DealNet Capital Corp., Restricted 233,900 129 124..
Dream Industrial REIT 231,465 1,930 1,815..
Dream Office REIT 7,938 136 157..
Echelon Financial Holdings Inc. 18,202 256 245..
E-L Financial Corp. Ltd. 1,113 686 715..
Element Financial Corp. 349,611 6,357 5,011..
Equitable Group Inc. 12,498 748 584..
Fairfax India Holdings Corp. 5,900 78 76..
First Capital Realty Inc. 2,600 47 51..
FirstService Corp. 45,000 1,229 2,374..
Genworth MI Canada Inc. 14,430 453 396..
Granite Real Estate Investment Trust, Stapled Units 34,844 1,287 1,333..
Guardian Capital Group Ltd., Class 'A' 3,400 37 57..
Home Capital Group Inc. 10,926 446 371..
Industrial Alliance Insurance and Financial Services Inc. 1,900 82 69..
INFOR Acquisition Corp., Class 'A', Restricted 174,067 1,702 1,715..
INFOR Acquisition Corp., Class 'A', Warrants, 2020/07/06 87,033 39 34..
Intact Financial Corp. 14,100 1,249 1,188..
Killam Apartment REIT 228,612 2,320 2,503..
Laurentian Bank of Canada 10,085 493 460..
Manulife Financial Corp. 489,578 10,285 8,867..
Melcor Developments Ltd. 29,569 516 407..
Milestone Apartments REIT 7,300 113 118..
Onex Corp. 30,000 2,286 2,388..
Power Corp. of Canada 125,450 3,780 3,688..
Power Financial Corp. 130,300 4,608 4,108..
Royal Bank of Canada 171,420 9,333 11,841..
Smart REIT 6,400 176 206..
Sun Life Financial Inc. 133,592 4,725 5,389..
Toronto-Dominion Bank (The) 299,650 12,610 15,711..
Tricon Capital Group Inc. 303,800 2,997 2,391..
Westaim Corp. (The) 18,900 61 49..
WPT Industrial REIT 11,898 165 163..
....
97,863 103,957 33.0%..x
Health Care..
Concordia Healthcare Corp. 2,000 94 79..
ProMetic Life Sciences Inc. 815,630 1,698 2,129..
Valeant Pharmaceuticals International Inc. 10,600 1,777 1,002..
....
3,569 3,210 1.0%..x
Industrials..
Aecon Group Inc. 70,000 995 976..
AG Growth International Inc. 1,200 43 30..
Air Canada 120,500 1,485 870..
Algoma Central Corp. 34,993 582 460..
ATS Automation Tooling Systems Inc. 9,000 95 90..
Bird Construction Inc. 9,560 113 113..
Black Diamond Group Ltd. 5,100 45 20..
Boyd Group Income Fund 17,264 1,016 1,102..
CAE Inc. 13,800 195 206..
Canadian National Railway Co. 104,940 4,394 8,248..
Chorus Aviation Inc., Class 'B' 93,969 539 554..
ENTREC Corp. 267,771 124 84..
Exco Technologies Ltd. 21,597 315 337..
Finning International Inc. 900 19 17..
Hammond Power Solutions Inc. 34,800 241 211..
Hardwoods Distribution Inc. 10,600 96 180..
Héroux-Devtek Inc. 1,400 16 18..
HNZ Group Inc. 17,038 346 176..
Horizon North Logistics Inc. 30,100 74 35..
Magellan Aerospace Corp. 200 3 3
6
The accompanying notes are an integral part of these financial statements.
Frontiers Canadian Equity Pool
Schedule of Investment Portfolio (unaudited) As at February 29, 2016 (cont'd)
SecurityNumber
of Shares
AverageCost
($000s)
FairValue
($000s)
% ofNet
Assets..
Morneau Shepell Inc. 2,700 47 39..
New Flyer Industries Inc. 22,500 583 583..
Progressive Waste Solutions Ltd. 46,500 1,511 1,880..
Rocky Mountain Dealerships Inc. 51,800 415 315..
Toromont Industries Ltd. 3,400 111 108..
Transcontinental Inc., Class 'A' 38,809 627 745..
WSP Global Inc. 59,791 2,494 2,158..
....
16,524 19,558 6.2%..x
Information Technology..
Calian Technologies Ltd. 13,667 264 268..
Celestica Inc. 152,644 2,427 2,126..
CGI Group Inc., Class 'A' 49,340 2,000 2,793..
Constellation Software Inc. 2,500 402 1,411..
DealNet Capital Corp. 134,900 75 74..
Descartes Systems Group Inc. (The) 43,900 1,102 1,017..
DH Corp. 40,990 1,261 1,531..
Enghouse Systems Ltd. 3,100 147 170..
Kinaxis Inc. 58,100 1,762 2,289..
MacDonald, Dettwiler and Associates Ltd. 1,800 146 160..
Mitel Networks Corp. 33,653 382 329..
Open Text Corp. 21,100 1,395 1,419..
Sandvine Corp. 139,987 414 416..
Shopify Inc., Class 'A' 2,545 87 77..
Wi-LAN Inc. 17,965 39 44..
....
11,903 14,124 4.5%..x
Materials..
Agnico Eagle Mines Ltd. 57,200 2,041 2,723..
Agrium Inc. 19,570 1,487 2,280..
Alamos Gold Inc., Class 'A' 69,000 347 428..
B2Gold Corp. 8,700 17 13..
Brampton Brick Ltd., Class 'A' 10,239 72 84..
Canam Group Inc., Class 'A' 54,600 673 692..
Canexus Corp. 134,158 176 153..
Canfor Corp. 6,385 159 89..
Canfor Pulp Products Inc. 67,294 973 806..
Cascades Inc. 90,000 1,103 886..
CCL Industries Inc., Class 'B' 22,600 1,573 4,677..
Chemtrade Logistics Income Fund 162,973 3,103 2,581..
Detour Gold Corp. 97,000 1,811 2,067..
Dominion Diamond Corp. 140,200 2,213 1,994..
Fortuna Silver Mines Inc. 64,300 217 300..
Franco-Nevada Corp. 25,620 1,771 2,069..
Goldcorp Inc. 167,130 4,901 3,249..
Guyana Goldfields Inc. 220,000 867 957..
Hudbay Minerals Inc. 203,577 1,657 812..
Interfor Corp. 13,003 131 142..
Intertape Polymer Group Inc. 64,204 1,051 1,042..
Kinross Gold Corp. 54,700 181 217..
Kirkland Lake Gold Inc. 135,950 817 1,111..
Klondex Mines Ltd. 250,000 815 902..
Labrador Iron Ore Royalty Corp. 44,828 713 451..
Lundin Mining Corp. 434,134 2,086 1,632..
Major Drilling Group International Inc. 67,598 402 431..
Methanex Corp. 2,300 130 98..
Norbord Inc. 56,175 1,243 1,249..
Osisko Gold Royalties Ltd. 68,800 1,021 961..
Polaris Minerals Corp. 7,200 18 12..
Premier Gold Mines Ltd. 67,500 205 217..
Pretium Resources Inc. 69,000 552 436..
SEMAFO Inc. 34,800 143 167..
Sherritt International Corp. 220,612 448 168..
Stella-Jones Inc. 13,000 659 622..
Tahoe Resources Inc. 21,117 392 264..
Torex Gold Resources Inc. 82,000 131 148..
Trevali Mining Corp. 406,300 360 171..
West Fraser Timber Co. Ltd. 12,500 788 523..
Western Forest Products Inc. 344,140 768 723..
Winpak Ltd. 5,286 198 236..
Yamana Gold Inc. 248,944 897 953..
....
39,310 39,736 12.6%..x
Telecommunication Services..
BCE Inc. 20,430 1,113 1,194..
Manitoba Telecom Services Inc. 8,200 234 277..
Rogers Communications Inc., Class 'B' 55,910 2,739 2,800..
TELUS Corp. 79,570 2,475 3,136..
TeraGo Inc. 10,860 63 53..
....
6,624 7,460 2.4%..
7

The accompanying notes are an integral part of these financial statements.
Frontiers Canadian Equity Pool
Schedule of Investment Portfolio (unaudited) As at February 29, 2016 (cont'd)
SecurityNumber
of Shares
AverageCost
($000s)
FairValue
($000s)
% ofNet
Assetsx
Utilities..
ATCO Ltd., Class 'I' 15,948 718 572..
Boralex Inc., Class 'A' 207,370 2,420 3,351..
Brookfield Infrastructure Partners L.P. 2,900 96 148..
Brookfield Renewable Energy Partners L.P. 3,443 113 122..
Canadian Utilities Ltd., Class 'A' 30,487 1,114 992..
Emera Inc. 28,600 1,244 1,288..
Hydro One Ltd. 24,400 507 564..
Just Energy Group Inc. 125,000 1,133 990..
Northland Power Inc. 55,850 1,080 1,062..
TransAlta Corp. 87,900 471 521..
TransAlta Renewables Inc. 3,400 42 38..
....
8,938 9,648 3.1%..
..
TOTAL CANADIAN EQUITIES 278,181 290,807 92.4%..
..
INTERNATIONAL EQUITIESx1Finland (note 10)
..
Nokia OYJ, ADR 41,900 432 342..
....
432 342 0.1%..
x1United States (note 10)..
Alphabet Inc., Class 'A' 650 588 631..
Amazon.com Inc. 450 317 336..
Bristol-Myers Squibb Co. 6,400 519 536..
Brookfield Property Partners L.P. 64,300 1,656 1,768..
ConAgra Foods Inc. 13,000 584 740..
Edwards Lifesciences Corp. 6,000 652 706..
Ellie Mae Inc. 4,500 266 512..
Honeywell International Inc. 3,900 372 535..
Microsoft Corp. 8,500 624 585..
Nike Inc., Class 'B' 5,600 422 467..
NVIDIA Corp. 5,400 210 229..
Pattern Energy Group Inc., Class 'A' 1,015 30 23..
Performance Sports Group Ltd. 4,167 81 43..
Sabre Corp. 10,500 389 386..
Salesforce.com Inc. 5,600 606 513..
SolarEdge Technologies Inc. 5,600 214 185..
Visa Inc., Class 'A' 2,800 262 274..
Zoetis Inc. 8,500 489 472..
....
8,281 8,941 2.8%..
..
TOTAL INTERNATIONAL EQUITIES 8,713 9,283 2.9%..
..
TOTAL EQUITIES 286,894 300,090 95.3%..
SecurityCoupon
Rate (%)Maturity
Date Additional Details Par Value
AverageCost
($000s)
FairValue
($000s)
% ofNet
Assets
CANADIAN BONDSx
Corporate..
Element Financial Corp. 4.25% 2020/06/30 Convertible, Callable 314,000 314 308..
Emera Inc. 4.00% 2025/09/29 Convertible 1,229,000 413 466..
..
..
727 774 0.2%..
..
TOTAL BONDS 727 774 0.2%..
..
TOTAL INVESTMENTS BEFORE SHORT-TERM INVESTMENTS 287,621 300,864 95.5%..x
Short-Term Investments..
Government of Canada 0.47% 2016/06/02 Treasury Bill 2,050,000 2,047 2,048..
Government of Canada 0.43% 2016/07/14 Treasury Bill 900,000 898 898..
Government of Canada 0.40% 2016/12/15 Treasury Bill 1,000,000 997 997..
Province of Manitoba 0.58% 2016/05/18 Treasury Bill 1,000,000 999 999..
Province of Newfoundland and Labrador 0.53% 2016/04/07 Treasury Bill 500,000 499 499..
Province of Newfoundland and Labrador 0.60% 2016/04/28 Treasury Bill 1,000,000 999 999..
..
..
TOTAL SHORT-TERM INVESTMENTS 6,439 6,440 2.1%..
..
Less: Transaction costs included in average cost (482).
..
..
TOTAL INVESTMENTS 293,578 307,304 97.6%..
..
Margin 943 0.3%..
Derivative assets 742 0.2%..
Derivative liabilities (45) 0.0%..
Other Assets, less Liabilities 5,836 1.9%..
..
..
TOTAL NET ASSETS ATTRIBUTABLE TO HOLDERS OFREDEEMABLE UNITS 314,780 100.0%
.
...
1Hedging reference number. Refers to a corresponding number on the Schedule of Derivative Assets and Liabilities - Forward Foreign Currency Contracts.x
8

The accompanying notes are an integral part of these financial statements.
Frontiers Canadian Equity Pool
x
Schedule of Derivative Assets and Liabilities - Options
Security Expiry Date Strike PriceNumber of
Options
UnderlyingInterest on Equity
OptionsProceeds
($000s)
FairValue
($000s)x..
Purchased Call Options..
iShares S&P/TSX Capped Energy Index ETF 2018/03/17 $ 12.00 CAD 4,809 480,900 477 526......
477 526......
Total Purchased Options 477 526..
..
Written Call Options..
BCE Inc. 2016/03/19 $ 60.00 CAD (68) (6,800) (3) –..
Element Financial Corp. 2016/03/19 $ 17.00 CAD (1,080) (108,000) (11) (13)..
Franco-Nevada Corp. 2016/03/19 $ 90.00 CAD (59) (5,900) (4) (4)..
George Weston Ltd. 2016/03/19 $ 115.00 CAD (30) (3,000) (2) (1)..
Goldcorp Inc. 2016/03/19 $ 23.00 CAD (414) (41,400) (22) (6)..
Magna International Inc., Class 'A' 2016/03/19 $ 56.00 CAD (196) (19,600) (4) (4)..
Quebecor Inc., Class 'B' 2016/03/19 $ 36.00 CAD (423) (42,300) (8) (7)......
(54) (35)......
Total Written Options (54) (35)..
..
Derivative Assets and Liabilities - Options 423 491..
x
Schedule of Derivative Assets and Liabilities - Forward Foreign Currency Contracts (note 10)
Hedging Ref.No.** Counterparty
Credit Rating forCounterparty*
SettlementDate
CurrencyBuys Par Value
CurrencySells Par Value Forward Rate Current Rate
Unrealized Gain(Loss) ($000s)
x..
1 Bank of Nova Scotia A-1 2016/04/14 USD 240,000 CAD 334,582 1.394 1.353 (10)..
1 Bank of Nova Scotia A-1 2016/04/14 CAD 4,064,106 USD 2,854,027 0.702 0.739 203..
1 Bank of Nova Scotia A-1 2016/04/14 CAD 256,270 USD 180,000 0.702 0.739 13......
Derivative Assets and Liabilities - Forwards 206..
..
* The credit rating of each counterparty (as rated by Standard & Poor's, a division of McGraw-Hill Financial Inc.) of the forward foreign currency contracts held by the Pool meets or exceeds the minimum approvedcredit rating.
..
** See corresponding reference number on the Schedule of Investment Portfolio.
9

The accompanying notes are an integral part of these financial statements.
Frontiers Canadian Equity Pool
Supplemental Schedule to Schedule of Investment Portfolio (unaudited)
Offsetting Arrangements (note 2d)
The Pool may enter into various master netting arrangements or other similar agreements that do not meet the criteria for offsetting in the Statements of Financial Position but still allowfor the related amounts to be set off in certain circumstances, such as bankruptcy or the termination of the contracts.
The following table reconciles the net amount of “Over-The-Counter” derivatives presented in the Statements of Financial Position, as at February 29, 2016 and August 31, 2015, to:
l The gross amount before offsetting required under IFRS; and
l The net amount after offsetting under the terms of master netting arrangements or other similar arrangements, but which do not meet the criteria for offsetting under IFRS.
x
Financial Assets and Liabilities Amounts Offset Amounts Not Offset Net
Gross Assets(Liabilities)
Amounts Offset UnderIFRS
Net AmountsPresented onStatements of
Financial PositionMaster NettingArrangements
Cash CollateralReceived
x..
As at February 29, 2016..
OTC Derivative Assets $ 216 $ – $ 216 $ (10) $ – $ 206..
OTC Derivative Liabilities (10) – (10) 10 – –......
Total 206 – 206 – – 206..
..
As at August 31, 2015..
OTC Derivative Assets $ – $ – $ – $ – $ – $ –..
OTC Derivative Liabilities (116) – (116) – – (116)......
Total (116) – (116) – – (116)..
Interests in Underlying Funds (note 4)
As at February 29, 2016 and August 31, 2015, the Pool had no investments in underlying funds where the ownership exceeded 20% of each underlying Fund.
10

The accompanying notes are an integral part of these financial statements.
Frontiers Canadian Equity Pool
Financial Instrument RisksInvestment Objective: Frontiers Canadian Equity Pool (the Pool) seeks to achievelong-term capital growth by investing in a diversified portfolio consisting primarily ofequity securities of companies domiciled in Canada.
Investment Strategies: The Pool invests primarily in common shares, may also buysecurities that are convertible into common shares. When making investment decisions, acombination of investment styles may be employed, such as growth- and value-orientedstrategies.
Significant risks that are relevant to the Pool are discussed here. General information onrisk management and specific discussion on concentration, credit, currency, interest rate,liquidity, and other price/market risk can be found in note 2 of the financial statements.
In the following risk tables, Net Assets is defined as meaning “Net assets attributable toholders of redeemable units".
Concentration Risk as at February 29, 2016 and August 31, 2015The Schedule of Investment Portfolio presents the securities held by the Pool as atFebruary 29, 2016.The following table presents the investment sectors held by the Pool as at August 31,2015, and groups the securities by asset type, industry sector, geographic region, orcurrency exposure:
As at August 31, 2015
Portfolio Breakdown% of
Net Assetsx
x
Canadian Equitiesx
Consumer Discretionary 10.0x
Consumer Staples 4.3x
Energy 15.3x
Financials 32.8x
Health Care 2.6x
Industrials 8.2x
Information Technology 4.6x
Materials 10.9x
Telecommunication Services 3.1x
Utilities 1.8x
International Equitiesx
Ireland 0.1x
United States 3.0x
Canadian Bondsx
Corporate 0.2x
Short-Term Investments 1.7x
Margin 0.1x
Other Assets, less Liabilities 1.3xxx
Total 100.0xx
Credit RiskCredit ratings represent a consolidation of the ratings provided by various outside serviceproviders and are subject to change, which could be material.
See the Schedule of Investment Portfolio for counterparty from over-the-counterderivative contracts, where applicable.
As at February 29, 2016 and August 31, 2015, the Pool invested in debt securities withthe following credit ratings:
.
% of Net Assets
Debt Securities by Credit Rating February 29, 2016 August 31, 2015x
x
'AAA' 1.3 1.7x
'AA' 0.3 –x
'A' 0.5 –x
'BBB' 0.2 –x
Unrated – 0.2xxx
Total 2.3 1.9xx
Currency RiskThe tables that follow indicate the currencies to which the Pool had significant exposureas at February 29, 2016 and August 31, 2015, based on the market value of the Pool'sfinancial instruments (including cash and cash equivalents) and the underlying principalamounts of forward foreign currency contracts, as applicable.
As at February 29, 2016
Currency (note 2m)Total Currency
Exposure* ($000s)% of
Net Assetsx
x
USD 4,255 1.4xxx
* Amounts reflect the carrying value of monetary and non-monetary items (including the notionalamount of forward foreign currency contracts, if any).
As at August 31, 2015
Currency (note 2m)Total Currency
Exposure* ($000s)% of
Net Assetsx
x
USD 4,386 1.3xxx
* Amounts reflect the carrying value of monetary and non-monetary items (including the notionalamount of forward foreign currency contracts, if any).
The table that follows indicates how net assets as at February 29, 2016 and August 31,2015 would have decreased or increased had the Canadian dollar strengthened orweakened by 1% in relation to all foreign currencies. This analysis assumes that all othervariables remain unchanged. In practice, the actual results may differ from this analysisand the difference could be material.
February 29, 2016 August 31, 2015x
x
Impact on Net Assets ($000s) 43 44xx
Interest Rate RiskThe Pool’s short-term assets and liabilities were not subject to significant amounts of riskdue to fluctuations in the prevailing level of market interest rates.
The table that follows indicates the Pool’s exposure to fixed income securities byremaining term-to-maturity.
.
February 29, 2016 August 31, 2015Remaining Term-to-Maturity ($000s) ($000s)
xx
3-5 years 308 345x
> 5 years 466 488xxx
Total 774 833xx
The table that follows indicates how net assets as at February 29, 2016 and August 31,2015 would have increased or decreased had the interest rate decreased or increased by25 basis points and assuming a parallel shift in the yield curve. This change is estimatedusing the weighted average duration of the fixed income portfolio. This analysis assumesthat all other variables remain unchanged. In practice, actual results may differ from thisanalysis and the difference could be material..
February 29, 2016 August 31, 2015x
x
Impact on Net Assets ($000s) 11 10xx
Liquidity RiskLiquidity risk is the risk that the Pool will encounter difficulty in meeting obligationsassociated with financial liabilities. The Pool is exposed to daily cash redemptions ofredeemable units. The Pool maintains sufficient cash on hand to fund anticipatedredemptions.
With the exception of derivative contracts, where applicable, all of the Pool’s financialliabilities are short-term liabilities maturing within 90 days after the period end.
For pools that hold derivative contracts with a term-to-maturity that exceeds 90 days fromthe period end, further information related to those contracts can be referenced in thederivative schedules following the Schedule of Investment Portfolio.
Other Price/Market RiskThe table that follows indicates how net assets as at February 29, 2016 and August 31,2015 would have increased or decreased had the value of the Pool’s benchmark(s)increased or decreased by 1%. This change is estimated based on the historicalcorrelation between the return of Class A units of the Pool as compared to the return ofthe Pool’s benchmark(s), using 36 monthly data points, as available, based on the monthlynet returns of the Pool. This analysis assumes that all other variables remain unchanged.The historical correlation may not be representative of the future correlation and,accordingly, the impact on net assets could be materially different..
Impact on Net Assets ($000s)
Benchmark February 29, 2016 August 31, 2015x
x
S&P/TSX Composite Index 2,937 3,269xx
11

The accompanying notes are an integral part of these financial statements.
Frontiers Canadian Equity Pool
Fair Value Measurement of Financial InstrumentsThe following is a summary of the inputs used as at February 29, 2016 and August 31,2015 in valuing the Pool’s financial assets and financial liabilities, carried at fair value:
As at February 29, 2016Level 1 (i) Level 2 (ii) Level 3 (iii) Total
Classification ($000s) ($000s) ($000s) ($000s)xx
Financial Assetsx
Fixed Income Securities – 774 – 774x
Short-Term Investments – 6,440 – 6,440x
Equities 299,207 883 – 300,090x
Derivative assets – 5,172 – 5,172xxx
Total Financial Assets 299,207 13,269 – 312,476xx
x
Financial Liabilitiesx
Derivative liabilities (6) (4,469) – (4,475)xxx
Total Financial Liabilities (6) (4,469) – (4,475)xx
x
Total Financial Assets and Liabilities 299,201 8,800 – 308,001xx
x
(i) Quoted prices in active markets for identical assetsx
(ii) Significant other observable inputsx
(iii) Significant unobservable inputs
As at August 31, 2015Level 1 (i) Level 2 (ii) Level 3 (iii) Total
Classification ($000s) ($000s) ($000s) ($000s)xx
Financial Assetsx
Fixed Income Securities – 833 – 833x
Short-Term Investments – 5,898 – 5,898x
Equities 336,249 996 – 337,245x
Derivative assets – 4,191 – 4,191xxx
Total Financial Assets 336,249 11,918 – 348,167xx
x
Financial Liabilitiesx
Derivative liabilities – (4,329) – (4,329)xxx
Total Financial Liabilities – (4,329) – (4,329)xx
x
Total Financial Assets and Liabilities 336,249 7,589 – 343,838xx
x
(i) Quoted prices in active markets for identical assetsx
(ii) Significant other observable inputsx
(iii) Significant unobservable inputs
Transfer of assets between Level 1 and Level 2Financial assets and liabilities transferred from Level 1 to Level 2 are the result ofsecurities no longer being traded in an active market.
.
February 29, 2016 August 31, 2015x
x
Fair value of assets transferred from Level 1 toLevel 2 during the period ($000s) 45 –
x
x
Financial assets and liabilities transferred from Level 2 to Level 1 are the result ofsecurities now being traded in an active market..
February 29, 2016 August 31, 2015x
x
Fair value of assets transferred from Level 2 toLevel 1 during the period ($000s) 484 –
x
x
Reconciliation of financial asset and liability movement – Level 3The Pool did not hold any significant positions of Level 3 investments at the beginning of,during, or at the end of either reporting period.
12

Notes to Financial Statements (unaudited)
x
As at and for the periods as disclosed in the financial statements (see note 1)
1. Frontiers Pools — Organization of the Pools and Financial Reporting Periods
The Frontiers Pools consist of Frontiers Canadian Short Term Income Pool, Frontiers Canadian Fixed Income Pool, Frontiers Equity Income Pool, Frontiers Canadian Equity Pool, Frontiers U.S. Equity Pool, Frontiers U.S.Equity Currency Neutral Pool, Frontiers International Equity Pool, Frontiers Emerging Markets Equity Pool, and Frontiers Global Bond Pool.
As at April 17, 2016, the name of the Frontiers Pools changed to Renaissance Private Pools, as follows: Frontiers Canadian Equity Pool to Renaissance Canadian Equity Private Pool; Frontiers Canadian Fixed IncomePool to Renaissance Canadian Fixed Income Private Pool; Frontiers Canadian Short Term Income Pool to Renaissance Ultra Short-Term Income Private Pool; Frontiers Emerging Markets Equity Pool to RenaissanceEmerging Markets Equity Private Pool; Frontiers Equity Income Pool to Renaissance Equity Income Private Pool; Frontiers Global Bond Pool to Renaissance Global Bond Private Pool; Frontiers International Equity Pool toRenaissance International Equity Private Pool; Frontiers U.S. Equity Pool to Renaissance U.S. Equity Private Pool; Frontiers U.S. Equity Currency Neutral Pool to Renaissance U.S. Equity Currency Neutral Private Pool.
Each of the Frontiers Pools (individually, a Pool, and collectively, the Pools) is a mutual fund trust organized under the laws of Ontario and governed by a declaration of trust (Declaration of Trust). The address of thePools' registered office is 18 York Street, Suite 1300, Toronto, Ontario.
The Pools are managed by CIBC Asset Management Inc. (the Manager). The Manager is also the trustee, registrar, and transfer agent of the Pools.
Each Pool may issue an unlimited number of classes of units and an unlimited number of units of each class. Class A, C, I, and O units of each of the Pools are available for sale, except Frontiers Canadian Short TermIncome Pool which only offers Class A units, and Frontiers U.S. Equity Currency Neutral Pool, which only offers Class O units. In the future, the offering of any classes of a Pool may be terminated or additional classesmay be offered.
Each class of units may charge a different management fee. Operating expenses can either be common or class-specific. Class-specific expenses are allocated on a class-by-class basis. As a result, a separate netasset value per unit is calculated for each class of units.
Class A units are available only to investors participating in the Frontiers Program. This program will invest in a number of Pools, which will form a Frontiers Portfolio. Class A units are available on a no-load basis.Investors do not pay a sales commission when purchasing Class A units, nor are they charged a redemption fee if they redeem their Class A units. They may have to pay a short-term trading fee, if applicable.
Class C units are available to all investors on a no-load basis. Investors do not pay a sales commission when purchasing Class C units, nor are they charged a redemption fee if they redeem their Class C units. They mayhave to pay a short-term trading fee, if applicable.
Class I units are available to investors participating in programs that do not require the payment of sales charges by investors and do not require the payment of service or trailing commissions to dealers. For theseinvestors, the Manager “unbundles” the typical distribution costs and charges a lower management fee. Potential investors include clients of “fee-for-service” investment advisors, dealer-sponsored “wrap accounts”,and others who pay an annual fee to their dealer instead of transactional sales charges and where the dealer does not receive service fees or trailing commissions from the Manager.
Class O units are only available to selected investors who have been approved by and have entered into a Class O account agreement with the Manager or whose dealer or discretionary manager offers separatelymanaged accounts or similar programs and has entered into a Class O unit account agreement with the Manager. These investors are typically financial services companies, including the Manager, that will use ClassO units of the Pools to facilitate offering other products to investors. No management fees or operating expenses are charged to the Pools in respect of Class O units held; instead, a negotiated management fee ischarged by the Manager directly to, or as directed by, Class O unitholders or dealers or discretionary managers on behalf of unitholders.
The date upon which each Pool was established by Declaration of Trust (Date Established) and the date upon which each class of units of each Pool was first sold to the public (Inception Date) are reported in footnoteOrganization of the Pool on the Statements of Financial Position.
The Schedule of Investment Portfolio of each Pool is as at February 29, 2016. The Statements of Financial Position are as at February 29, 2016 and August 31, 2015. The Statements of Comprehensive Income,Statements of Changes in Net Assets Attributable to Holders of Redeemable Units and Statements of Cash Flows are for the six month periods ended February 29, 2016 and February 28, 2015 except for Pools orclasses established during either period, in which case the information presented is from the Date Established or the Inception Date to February 29, 2016 and February 28, 2015.
These financial statements were approved for issuance by the Manager on April 20, 2016.xx
2. Summary of Significant Accounting Policies
These financial statements have been prepared in accordance with International Accounting Standard Interim Financial Reporting (IAS 34) as published by the International Accounting Standards Board (IASB). ThePools adopted International Financial Reporting Standards (IFRS) in 2014 as required by Canadian securities legislation and the Canadian Accounting Standards Board. Previously, the Pools prepared their financialstatements in accordance with Canadian generally accepted accounting principles (GAAP) as defined in Part V of the CPA Canada Handbook.
The financial statements have been prepared on a going concern basis using the historical-cost convention. However, each Pool is an investment entity and primarily all financial assets and financial liabilities aremeasured at fair value in accordance with IFRS. Accordingly, the Pools’ accounting policies for measuring the fair value of investments and derivatives are consistent with those used in measuring the Net Asset valuefor transactions with unitholders. In applying IFRS, these financial statements include estimates and assumptions made by management that affect the reported amounts of assets, liabilities, income, and expensesduring the reporting perioSaveds. However, existing circumstances and assumptions may change due to market changes or circumstances arising beyond the control of the Pools. Such changes are reflected in theassumptions when they occur.
These financial statements have been presented in Canadian dollars, which is the Pools’ functional currency (unless otherwise noted).
a) Financial Instruments
Classification and recognition of financial instruments
In accordance with IAS 39 Financial Instruments: Recognition and Measurement, financial assets and financial liabilities are classified at initial recognition into the following categories:
Financial assets and liabilities at fair value through profit or loss (FVTPL)
This category is sub-divided into:
l Financial instruments classified as Held For Trading: Financial assets and liabilities are classified as Held For Trading if they are acquired for the purpose of selling and/or repurchasing in the near term, andare acquired principally for the purpose of generating a profit from short-term fluctuations in price. Derivatives and securities sold short held by the Pools are classified as Held For Trading and do not meetthe definition of effective hedging instruments as defined by IAS 39.
l Financial instruments designated as FVTPL through inception: All investments held by the Pools, excluding those classified as Held For Trading (discussed above), are designated as fair value through profitor loss upon initial recognition. These financial assets are designated upon initial recognition on the basis that they are part of a group of financial assets that are managed and have their performanceevaluated on a fair value basis, in accordance with risk management and investment strategies of the Pools, as set out in the Pools’ prospectus.
Loans and receivables
The Pools include in this category receivable balances relating to portfolio investments and other short-term receivables such as receivable for units issued.
Other financial liabilities
This category includes all financial liabilities, other than those classified as fair value through profit or loss. The Pools include in this category amounts relating to payables for portfolio securities purchased and otheraccrued liabilities such as payable for units redeemed and distributions payable to holders of redeemable units.
All Pools have contractual obligations to distribute cash to the unitholders. As a result, the Pools’ obligation for net assets attributable to holders of redeemable units represents a financial liability and is presented atthe redemption amount.
b) Risk Management
The Pools’ overall risk management approach includes formal guidelines that govern the extent of exposure to various types of risk, including diversification within asset classes and limits on the exposure to individualinvestments and counterparties. In addition, derivative financial instruments may be used to manage certain risk exposures. The Manager also has various internal controls to oversee the Pools’ investment activities,
13

p / 2 Notes to Financial Statements (unaudited)
including monitoring compliance with the investment objectives and strategies, internal guidelines, and securities regulations. Please refer to each Pool’s Supplemental Schedule to Schedule of Investment Portfolio forspecific risk disclosures.
Fair value of financial instruments
Financial instruments are valued at their fair value, which is defined as the price that would be received to sell an asset or paid to transfer a liability in an orderly transaction between market participants at themeasurement date. Refer to notes 3a to 3f for valuation of each specific type of financial instruments held by the Pools. The fair value of financial assets and liabilities traded in active markets are based on quotedmarket prices at the close of trading on the reporting date. The Pools use the last traded market price for both financial assets and financial liabilities where the last traded price falls within that day’s bid-ask spread. Incircumstances where the last traded price is not within the bid-ask spread, the Manager determines the point within the bid-ask spread that is most representative of fair value based on the specific facts andcircumstances.
For financial assets and financial liabilities that are not traded in an active market, fair value is determined using valuation techniques.
The Pools classify fair value measurement within a hierarchy which gives the highest priority to unadjusted quoted prices in active markets for identical assets or liabilities (Level 1) and the lowest priority tounobservable inputs (Level 3). The three levels of the fair value hierarchy are:
Level 1: Quoted prices (unadjusted) in active markets for identical assets or liabilities that the entity can access at the measurement date;
Level 2: Inputs other than quoted prices included within Level 1 that are observable for the asset or liability, either directly or indirectly; and
Level 3: Inputs are unobservable for the asset or liability.
If inputs are used to measure an asset’s or liability’s fair value, the classification within the hierarchy is based on the lowest level input that is significant to the fair value measurement. Each Pool’s fair value hierarchyclassification of its assets and liabilities is included in the Supplemental Schedule to Schedule of Investment Portfolio.
The carrying values of all non-investment assets and liabilities approximate their fair values due to their short-term nature. Fair values are classified as Level 1 when the related security or derivative is actively tradedand a quoted price is available. If an instrument classified as Level 1 subsequently ceases to be actively traded, it is transferred out of Level 1. In such cases, instruments are reclassified into Level 2, unless themeasurement of its fair value requires the use of significant unobservable inputs, in which case it is classified as Level 3.
The Manager is responsible for performing the fair value measurements included in the financial statements of a Pool, including the Level 3 measurements. The Manager obtains pricing from third-party pricing vendorsand the pricing is reviewed daily. At each financial reporting date, the Manager reviews and approves all Level 3 fair value measurements. The Pools also have a Valuation Committee which meets quarterly to performdetailed reviews of the valuations of investments held by the Pools, which includes discussion on Level 3 measurements.
Credit risk
Credit risk is the risk that a counterparty to a financial instrument, such as a fixed income security or a derivative contract, will fail to discharge an obligation or commitment that it has entered into with the Pools. Thevalue of fixed income securities and derivatives as presented on the Schedule of Investment Portfolio includes consideration of the creditworthiness of the issuer and, accordingly, represents the maximum credit riskexposure of the Pools.
Certain Pools may invest in short-term fixed income securities issued or guaranteed primarily by the Government of Canada or any Canadian provincial government, obligations of Canadian chartered banks or trustcompanies, and commercial paper with approved credit ratings. The risk of default on these short-term fixed income securities is considered low and these securities primarily have credit ratings of ‘A-1 (Low)’ or higher(as rated by Standard & Poor’s, a division of The McGraw-Hill Financial, Inc., or equivalent rating from another rating service).
The Pools may engage in securities lending transactions. The credit risk related to securities lending transactions is limited by the fact that the value of cash or securities held as collateral by the Pools in connectionwith these transactions is at least 102% of the fair value of the securities loaned. The collateral and loaned securities are marked to market on each business day. Further information regarding the collateral andsecurities on loan can be found in the footnotes to the Statements of Financial Position and in note 2i.
Currency risk
Currency risk is the risk that the value of an investment will fluctuate due to changes in foreign exchange rates. This is because the Pools may invest in securities denominated or traded in currencies other than a Pool’sreporting currency.
Interest rate risk
Prices of fixed income securities generally increase when interest rates decline and decrease when interest rates rise. This risk is known as interest rate risk. Prices of longer-term fixed income securities will generallyfluctuate more in response to interest rate changes than would shorter-term securities. Due to the nature of short-term fixed income securities with a remaining term-to-maturity of less than one year, theseinvestments are not generally exposed to a significant risk that their value will fluctuate in response to changes in the prevailing levels of market interest rates.
Liquidity risk
The Pools are exposed to daily cash redemptions of redeemable units. Generally, the Pools retain sufficient cash and cash equivalent positions to maintain adequate liquidity. However, liquidity risk also involves theability to sell an asset for cash easily and at a fair price. Some securities are illiquid due to legal restrictions on their resale, the nature of the investment, or simply a lack of interested buyers for a particular security orsecurity type. Certain securities may become less liquid due to changes in market conditions, such as interest rate changes or market volatility, which could impair the ability of a Pool to sell such securities quickly or ata fair price. Difficulty in selling securities could result in a loss or lower return for a Pool.
Other price/market risk
Other price/market risk is the risk that the value of investments will fluctuate as a result of changes in market conditions. Several factors can influence market trends, such as economic developments, changes ininterest rates, political changes, and catastrophic events. All investments are exposed to other price/market risk.
c) Investment Transactions, Income Recognition, and Recognition of Realized and Unrealized Gains and Losses
i) Each transaction of purchase or sale of a portfolio asset by a Pool is reflected in the net assets no later than the first computation of net assets made after the date on which the transaction becomesbinding upon the Pool.
ii) Interest for distribution purposes shown on the Statements of Comprehensive Income represents the coupon interest received by the Pool accounted for on an accrual basis. The Pools do not amortizepremiums paid or discounts received on the purchase of fixed income securities except for zero coupon bonds which are amortized on a straight-line basis.
iii) Dividend income is recorded on the ex-dividend date.
iv) Securities that are exchange-traded are recorded at fair value established by the last traded market price when that price falls within that day’s bid-ask spread. Debt securities are recorded at fair value,established by the last traded price on the Over-the-Counter market (OTC) when that price falls within that day’s bid-ask spread. In circumstances where the last traded price is not within the bid-ask spread,the Manager determines the point within the bid-ask spread that is most representative of fair value based on the specific facts and circumstances. Unlisted securities are recorded at fair value using fairvaluation techniques established by the Manager in establishing a fair value.
v) Realized gains and losses on investments and unrealized appreciation or depreciation of investments are calculated using the average cost, excluding transaction costs, of the related investments.
vi) Investment income is the sum of income paid to the Pool that is generated from a Pool’s investment fund holdings.
vii) Other income is the sum of income, excluding transaction costs, other than that which is separately classified on the Statements of Comprehensive Income.
d) Offsetting
Financial assets and liabilities are offset and the net amount reported in the Statements of Financial Position if there is a currently enforceable legal right to offset the recognized amounts and there is an intention tosettle on a net basis, or to realize the asset and settle the liability simultaneously.
14

Notes to Financial Statements (unaudited) p / 3
Where applicable, additional information can be found in the table Offsetting Arrangements as part of the Supplemental Schedule to Schedule of Investment Portfolio. This supplemental schedule discloses the OTCderivatives which are subject to offsetting.
e) Portfolio Securities
The cost of securities of the Pools is determined in the following manner. Securities are purchased and sold at a market-traded price to arrive at a value for the position traded. The total purchased value represents thetotal cost of the security to the Pool. When additional units of the same security are purchased, the cost of those additional units is added to the total security cost. When units of the same security are sold, theproportionate cost of the units of the security sold is deducted from the total security cost. If there is a return of capital paid by a security, the amount of this return of capital is deducted from the total security cost.This method of tracking security cost is known as “average cost” and the current total for any one security is referred to as the adjusted cost base or “ACB” of the security. Transaction costs incurred in portfoliotransactions are excluded from the average cost of investments and are recognized immediately in Increase (Decrease) in Net Assets Attributable to Holders of Redeemable Units and are presented as a separateexpense item in the financial statements.
The difference between the fair value of securities and their average cost, excluding transaction costs, represents the unrealized appreciation (depreciation) in value of the portfolio investments. The applicable periodchange in unrealized appreciation (depreciation) of investments is included on the Statements of Comprehensive Income.
Short-term investments on the Schedule of Investment Portfolio are presented at their amortized cost which approximates their fair value. Accrued interest for bonds is disclosed separately on the Statements ofFinancial Position.
f) Foreign Exchange
The value of investments and other assets and liabilities denominated in foreign currencies is translated into Canadian dollars, which is the Pools’ functional and presentation currency at the current rates prevailing oneach Valuation Date.
Purchases and sales of investments, income, and expenses are translated into Canadian dollars, which is the Pools' functional and presentation currency at the foreign exchange rates prevailing on the dates of suchtransactions. Foreign currency translation gains (losses) on investments and income transactions are included in Net realized gain (loss) on foreign currency and in Income, respectively, on the Statements ofComprehensive Income.
g) Forward Foreign Currency Contracts
The Pools may enter into forward foreign currency contracts for either hedging or non-hedging purposes where such activity is consistent with their investment objectives and as permitted by the Canadian securitiesregulatory authorities.
Changes in the fair value of forward foreign currency contracts are included in derivative assets or derivative liabilities on the Statements of Financial Position and are recorded as an Increase (decrease) in unrealizedappreciation (depreciation) of investments and derivatives during the applicable period on the Statements of Comprehensive Income.
The gain or loss arising from the difference between the value of the original forward foreign currency contract and the value of such contract at close or delivery is realized and recorded as Net realized gain (loss) onforeign currency for Pools that use the forward foreign currency contracts for hedging, or as Derivative income (loss) for Pools that do not use the forward foreign currency contracts for hedging.
h) Futures Contracts
The margin deposits with brokers relating to futures contracts are included in Margin on the Statements of Financial Position. Any change in the margin requirement is settled daily and included in Receivable forportfolio securities sold or Payable for portfolio securities purchased on the Statements of Financial Position.
Any difference between the settlement value at the close of business on each Valuation Date and the settlement value at the close of business on the previous Valuation Date is recorded as Derivative Income (loss) onthe Statements of Comprehensive Income.
i) Options
Premiums paid for purchased call and put options are included in derivative assets and subsequently measured at fair value on the Statements of Financial Position. When a purchased option expires, the Pool willrealize a loss in the amount of the cost of the option. For a closing transaction, the Pool will realize a gain or loss depending on whether the proceeds are greater or less than the premium paid at the time of purchase.
When a purchased call option is exercised, the cost of the security purchased is increased by the premium paid at the time of purchase.
Premiums received from writing options are included in derivative liabilities and subsequently measured at fair value on the Statements of Financial Position as initial reductions in the value of investments. Premiumsreceived from writing options that expire unexercised are recorded as realized gains and reported as Net gain (loss) on sale of investments and derivatives on the Statements of Comprehensive Income. For a closingtransaction, if the cost of closing the transaction exceeds the premium received, the Pool will record a realized loss or, if the premium received at the time the option was written is greater than the amount paid, thePool will record a realized gain and are reported as Net gain (loss) on sale of investments and derivatives. If a written put option is exercised, the cost for the security delivered is reduced by the premiums received atthe time the option was written.
j) Securities Lending
A Pool may lend portfolio securities in order to earn additional revenue, which is disclosed on the Statements of Comprehensive Income. The loaned assets of any one Pool are not permitted to exceed 50% of the fairvalue of the assets of that Pool (excluding collateral debt for the loaned securities). The minimum allowable collateral is 102% of the market value of the loaned securities as per the requirements of NationalInstrument 81-102-Mutual Funds. Collateral can consist of the following:
i) Cash;
ii) Qualified securities;
iii) Irrevocable letters of credit issued by a Canadian financial institution that is not the counterparty, or an affiliate counterparty, of the fund in the transaction, if evidences of indebtedness of the Canadianfinancial institution that are rated as short-term debt by an approved credit rating organization have an approved credit rating; and
iv) Securities that are immediately convertible into securities of the same issuer, class, or type, and the same term, as the securities loaned.
The market value of the loaned securities is determined on the close of any valuation date and any additional required collateral is delivered to the Pool on the next business day. The securities on loan continue to beincluded on the Schedule of Investment Portfolio and are included in the total value on the Statements of Financial Position in Investments (non-derivative financial assets) at fair value. Where applicable, a Pool’ssecurities lending transactions are reported in footnote Securities Lending on the Statements of Financial Position.
k) Multi-Class Structured Pools
The realized and unrealized capital gains or capital losses, income, and common expenses (other than class-specific operating expenses and management fees) of the Pool are allocated on each Valuation Date to theunitholders in proportion to the respective prior day’s net asset value, which includes unitholder trade(s) dated for that day, of each class of units at the date on which the allocation is made. Class-specific operatingexpenses and management fees do not require allocation. All class-specific operating expenses are paid by the Manager and are collected from the Pools on a recoverable basis.
l) Loans and Receivables, Other Assets and Liabilities
Loans and receivables, other assets and liabilities (other than those classified as FVTPL) are recorded at cost, which approximates their fair value with the exception of net assets attributable to holders of redeemableunits, which are presented at the redemption value.
m) Legend for Abbreviations
The following is a list of abbreviations (foreign currency translation and others) that may be used in the Statements of Investment Portfolio:
x
x..x
15

p / 4 Notes to Financial Statements (unaudited)
x
Currency Abbreviations
x..
AUD – Australian Dollar KRW – South Korean Won..
BRL – Brazilian Real MXN – Mexican Peso..
CAD – Canadian Dollar MYR – Malaysian Ringgit..
CHF – Swiss Franc NOK – Norwegian Krone..
CLP – Chilean Peso NZD – New Zealand Dollar..
CZK – Czech Koruna PHP – Philippine Peso..
DKK – Danish Krone PLN – Polish Zloty..
EUR – Euro RUB – Russian Ruble..
GBP – British Pound SEK – Swedish Krona..
HKD – Hong Kong Dollar SGD – Singapore Dollar..
HUF – Hungarian Forint THB – Thai Baht..
IDR – Indonesian Rupiah TRY – New Turkish Lira..
ILS – Israeli Shekel TWD – Taiwan Dollar..
INR – Indian Rupee USD – United States Dollar..
JPY – Japanese Yen ZAR – South African Rand..
Other Abbreviations
..
ADR – American Depositary Receipt iUnits – Index Units Securities..
ADC – Austrian Depositary Certificates LEPOs – Low Exercise Price Options..
CVO – Contingent Value Obligations International MSCI – Morgan Stanley Capital Index..
ETF – Exchange-Traded Fund OPALS – Optimized Portfolios as Listed..
GDR – Global Depositary Receipt Securities PERLES – Performance Linked to Equity..
IPN – International Participation Note REIT – Real Estate Investment Trust..
iShares – Index Shares SDR – Swedish Depositary Receiptxx
x..
xxxxxxxx
n) Standards Issued but not yet Effective
Standards issued but not yet effective up to the date of issuance of the Pools’ financial statements are listed below. The Pools intend to adopt applicable standards when they become effective.
IFRS 9, Financial Instruments - Classification and Measurement
In July 2014, the IASB issued the final version of IFRS 9 Financial Instruments which reflects all phases of the financial instruments project and replaces IAS 39 Financial Instruments: Recognition and Measurementand all previous versions of IFRS 9. The standard introduces new requirements for classification and measurement, impairment, and hedge accounting. IFRS 9 is effective for annual periods beginning on or afterJanuary 1, 2018, with early application permitted. The Pools are in the process of assessing the impact of IFRS 9.
o) Increase (Decrease) in Net Assets Attributable to Holders of Redeemable Units per Unit
Increase (decrease) in net assets attributable to holders of redeemable units per unit of each class is calculated by dividing the Increase (decrease) in net assets attributable to holders of redeemable units (excludingdistributions), as reported in the Statements of Comprehensive Income, by the weighted average number of units in issue during the related period.
3. Valuation of Investments
The valuation date for a Pool is any day when the Manager’s head office is open for business (Valuation Date). The Trustee may, at its discretion, establish other Valuation Dates. The value of the investments or assetsof a Pool is determined as follows:
a) Cash and Other Assets
Cash, accounts receivable, dividends receivable, distributions receivable, and interest receivable are valued at fair value or at their recorded cost, plus or minus any foreign exchange between recognition of the assetby the Pool and the current Valuation Date, which approximates fair value.
Short-term investments (money market instruments) are valued at fair value.
b) Bonds, Debentures, and Other Debt Obligations
Bonds, debentures, and other debt obligations are fair valued using the last traded price provided by a recognized vendor upon the close of trading on a Valuation Date, whereby the last traded price falls within thatday’s bid-ask spread. If the last traded price does not fall within that day’s bid-ask spread, then the Manager will determine the point within the bid-ask spread that is most representative of fair value based on thespecific facts and circumstances.
c) Listed Securities, Unlisted Securities, and Fair Value Pricing of Foreign Securities
Any security that is listed or traded on a securities exchange is fair valued using the last traded price, whereby the last traded price falls within that day’s bid-ask spread or, if there is no traded price on that exchangeor the last traded price does not fall within that day’s bid-ask spread and in the case of securities traded on an OTC market, at the fair value as determined by the Manager as an appropriate basis for valuation. In suchsituations, a fair value will be determined by the Manager to establish current value. If any securities are inter-listed or traded on more than one exchange or market, the Manager will use the principal exchange ormarket for the fair value of such securities.
Units of each mutual fund in which a Pool invests will be valued at fair value using the most recent net asset value quoted by the Trustee or Manager of the mutual fund on the Valuation Date.
Unlisted securities are fair valued using the last traded price quoted by a recognized dealer, or the Manager may determine a price that more accurately reflects the fair value of these securities if the Manager feelsthe last traded price does not reflect fair value.
Fair value pricing is designed to avoid stale prices and to provide a more accurate fair value, and may assist in the deterrence of harmful short-term or excessive trading in the Pool. When securities listed or traded onmarkets or exchanges that close prior to North or South American markets or exchanges are valued by the Manager at their fair market value, instead of using quoted or published prices, the prices of such securitiesused to calculate the Pool's net assets or net asset value may differ from quoted or published prices of such securities.
d) Derivatives
Long positions in options, debt-like securities, and listed warrants are fair valued using the last traded price as established on either their principal trading exchange or by a recognized dealer in such securities,whereby the last traded price falls within that day’s bid-ask spread and the credit rating of each counterparty (as rated by Standard & Poor’s, a division of The McGraw-Hill Financial, Inc.) meets or exceeds theminimum approved credit rating.
When any option is written by any Pool, the premium received by the Pool will be reflected as a liability that will be valued at an amount equal to the current value of the option that would have the effect of closing theposition. Any difference resulting from revaluation shall be treated as an unrealized gain or loss on investment; the liability shall be deducted in arriving at the net assets attributable to holders of redeemable units ofthe Pool. The securities that are the subject of a written option, if any, will be valued in the manner described above for listed securities.
16

Notes to Financial Statements (unaudited) p / 5
Futures contracts, forward contracts, or swaps will be valued at fair value of the gain or loss, if any, that would be realized on the Valuation Date if the position in the futures contracts, forward contracts, or swapswere to be closed out.
Margin paid or deposited in respect of futures contracts and forward contracts will be reflected as an account receivable and margin consisting of assets other than cash will be noted as held as collateral.
Other derivatives and margin are fair valued in a manner that the Manager determines to represent their fair value.
e) Restricted Securities
Restricted securities purchased by any Pool will be fair valued in a manner that the Manager determines to represent their fair value.
f) Other Securities
All other investments of the Pools will be valued at fair value in accordance with the laws of the Canadian securities regulatory authorities where applicable.
The value of any security or other property of a Pool for which a market quotation is not readily available or where the market quotations do not properly reflect the fair value of such securities will be determined bythe Manager by valuing the securities at their fair value. In such situations, fair value will be determined using fair valuation techniques that most accurately reflect their fair value as established by the Manager.
4. Interest in Underlying Funds
The Pools may invest in other investment funds ("Underlying Funds”). Each Underlying Fund invests in a portfolio of assets to generate returns in the form of investment income and capital appreciation for itsunitholders. Each Underlying Fund finances its operations primarily through the issuance of redeemable units, which are puttable at the unitholder’s option and entitle the unitholder to a proportionate share of theUnderlying Fund’s net assets. The Pools’ interests in Underlying Funds held in the form of redeemable units, are reported in its Schedule of Investments at fair value, which represents the Pools’ maximum exposure onthose investments. The Pools’ interests in Underlying Funds as at the prior year-end periods are presented in the Financial Instrument Risks – Concentration Risks section in the Supplemental Schedule to the Scheduleof Investment Portfolio. Distributions earned from Underlying Funds are included in “Investment Income” in the Statements of Comprehensive Income. The total realized and change in unrealized gains (losses) arisingfrom Underlying Funds are also included in the Statement of Comprehensive Income. The Pools do not provide any additional significant financial or other support to Underlying Funds.
Where applicable, the table “Interests in Underlying Funds” is presented as part of the Supplemental Schedule to Schedule of Investment Portfolio which provides additional information on the Pools’ investments inUnderlying Funds where the ownership interest exceeds 20% of each Underlying Fund.
5. Redeemable Units Issued and Outstanding
Each Pool is permitted to have an unlimited number of classes of units and may issue an unlimited number of units of each class. The outstanding units represent the net assets attributable to holders of redeemableunits of the Pools. Each unit has no par value and the value of each unit is the net asset value as determined on each valuation date. Settlement of the cost for units issued is completed as per laws of the Canadiansecurities regulatory authorities in place at the time of issue. Distributions made by the Pools and reinvested by unitholders in additional units also constitute issued redeemable units of the Pools.
Units are redeemed at the net assets attributable to holders of redeemable units per unit of each class of units of the Pool. A right to redeem units of a Pool may be suspended with the approval of the Canadiansecurities regulatory authorities or when normal trading is suspended on a stock, options, or futures exchange within Canada or outside of Canada on which securities or derivatives that make up more than 50% of thevalue or underlying exposure of the total assets of the Pool, not including any liabilities of the Pool, are traded and when those securities or derivatives are not traded on any other exchange that represents areasonably practical alternative for the Pool. The Pools are not subject to any externally imposed capital requirements.
The capital received by a Pool is utilized within the respective investment mandate of a Pool. For all Pools, this includes the ability to make liquidity available to satisfy unitholder unit redemption requirements upon theunitholder’s request.
Changes in issued and outstanding units for the periods ended February 29, 2016 and February 28, 2015 can be found on the Statements of Changes in Net Assets Attributable to Holders of Redeemable Units.x
6. Management Fees and Operating Expenses
Management fees are based on the net asset value of the Pools and are calculated daily and paid monthly. Management fees are paid to the Manager in consideration for providing, or arranging for the provision of,management, distribution, and portfolio advisory services. Advertising and promotional expenses, office overhead expenses related to the Manager’s activities, trailing commissions and the fees of the portfoliosub-advisors are paid by the Manager out of the management fees received from the Pools. The maximum annual management fee expressed as a percentage of the average net asset value for each class of units ofthe Pool is reported in footnote Maximum Chargeable Management Fee Rates on the Statements of Comprehensive Income. For Class O units, management fees are negotiated with and paid by, or as directed by,unitholders, or dealers and discretionary managers on behalf of unitholders.
In addition to the management fees, the Pools are responsible for all expenses relating to the operation and conduct of the business of the Pools, including interest, operating, and administrative costs (other thanadvertising and promotional expenses, which are the responsibility of the Manager), brokerage fees, commissions, spreads, regulatory fees (including the portion of the regulatory fees paid by the Manager that areattributable to the Pools), Independent Review Committee fees, taxes, audit and legal fees and expenses, trustee fees, safekeeping fees, custodial fees, any agency fees, securities lending, repurchase, and reverserepurchase fees, investor servicing costs, and costs of unitholder reports, prospectuses, fund facts, and other reports. All class-specific operating expenses are paid by the Manager and recovered from the Pools. ThePools do not pay a fee to the trustee.
The Manager may recover from a Pool less than the actual class-specific operating expenses paid by the Manager, resulting in the Manager absorbing class-specific expenses. The Manager may also charge to a Poolless than the maximum management fee noted in footnote Maximum Chargeable Management Fee Rates on the Statements of Comprehensive Income, resulting in the Manager waiving management fees.
At its sole discretion, the Manager may stop absorbing class-specific operating expenses and/or waiving management fees at any time. Class-specific operating expenses absorbed and/or management fees waivedby the Manager are disclosed on the Statements of Comprehensive Income.
In some cases, the Manager may charge management fees to a Pool that are less than the management fees the Manager is entitled to charge in respect of certain investors in a Pool. The difference in the amount ofthe management fees will be paid out by the Pool to the applicable investors as a distribution of additional units of the Pool (Management Fee Distributions).
Management Fee Distributions are negotiable between the Manager and the investor and are dependent primarily on the size of the investor’s investment in the Pool. Management Fee Distributions paid to qualifiedinvestors do not adversely impact the Pool or any of the Pool’s other investors. The Manager may increase or decrease the amount of Management Fee Distributions to certain investors from time to time.
7. Income Taxes and Withholding Taxes
All of the Pools (except Frontiers Equity Income Pool and Frontiers U.S. Equity Currency Neutral Pool) qualify as mutual fund trusts under the Income Tax Act (Canada). No income tax is payable by the Pools on netincome and/or net realized capital gains that are distributed to unitholders. In addition, for all of the Pools (except those that do not qualify as mutual fund trusts under the Income Tax Act (Canada)), income taxespayable on undistributed net realized capital gains are refundable on a formula basis when units of the Pools are redeemed. Sufficient net income and realized capital gains of the Pools have been, or will be,distributed to the unitholders such that no tax is payable by the Pools and accordingly, no provision for income taxes has been made in the financial statements. Occasionally, a Pool may pay distributions in excess ofnet income and net realized capital gains of the Pool. This excess distribution is called a return of capital and is non-taxable to the unitholder. However, a return of capital reduces the average cost of the unitholder’sunits for tax purposes.
Non-capital losses that arose in 2006 and after are available to be carried forward for 20 years.
Capital losses for income tax purposes may be carried forward indefinitely and applied against capital gains realized in future years. Where applicable, a Pool’s net capital and non-capital losses are reported infootnote Net Capital and Non-Capital Losses on the Statements of Changes in Net Assets Attributable to Holders of Redeemable Units.
Frontiers Equity Income Pool and Frontiers U.S. Equity Currency Neutral Pool have a taxation year-end of December 31. All other Pools have a taxation year-end of December 15.
The Pools currently incur withholding taxes imposed by certain countries on investment income and capital gains. Such income and gains are recorded on a gross basis and the related withholding taxes are shown as aseparate expense in the Statements of Comprehensive Income.
8. Brokerage Commissions and Fees
The total commissions paid by the Pools to brokers in connection with portfolio transactions are reported in footnote Brokerage Commissions and Fees on the Statements of Comprehensive Income of each Pool. Inallocating brokerage business to a dealer, consideration may be given by the portfolio sub-advisors of the Pools to the provision of goods and services by the dealer or a third party, other than order execution (referredto in the industry as “soft dollar” arrangements). These goods and services are paid for with a portion of brokerage commissions and assist the portfolio sub-advisors with their investment decision-making services tothe Pools or relate directly to the execution of portfolio transactions on behalf of the Pools. The services are supplied by the dealer executing the trade or by a third party and paid for by that dealer. The total soft dollar
17

p / 6 Notes to Financial Statements (unaudited)
payments paid by the Pools to brokers are reported in footnote Brokerage Commissions and Fees on the Statements of Comprehensive Income of each Pool. In addition, the Manager may enter into commissionrecapture arrangements with certain dealers with respect to the Pool. Any commission recaptured will be paid to the applicable Pool.
Fixed income, other securities, and certain derivative products (including forwards) are transacted in an over-the-counter market, where participants are dealing as principals. Such securities are generally traded on anet basis and do not normally involve brokerage commissions, but will typically include a “spread” (being the difference between the bid and the offer prices on the security of the applicable marketplace).
Spreads associated with fixed income securities trading and certain derivative products (including forwards) are not ascertainable and, for that reason, are not included in the dollar amounts. In addition, the soft dollaramounts only include the value of research and other services supplied by a third party to the portfolio sub-advisors, as the value of the services supplied to the portfolio sub-advisors by the dealer is not ascertainable.When these services benefit more than one Pool, the costs are allocated among the Pools based on transaction activity or some other fair basis as determined by the portfolio sub-advisors.x
9. Related Party Transactions
Canadian Imperial Bank of Commerce (CIBC) and its affiliates have the following roles and responsibilities with respect to the Pools and receive the fees described below in connection with their roles andresponsibilities. The Pools may hold securities of CIBC. CIBC and its affiliates may also be involved in underwriting or lending to issuers that may be held by the Pools, have purchased or sold securities from or to thePools while acting as principal, have purchased or sold securities from or to the Pools on behalf of another investment fund managed by CIBC or an affiliate, or have been involved as a counterparty to derivativetransactions. Management fees payable and other accrued expenses on the Statements of Financial Position are amounts generally payable to a related party of the Pool.
Manager, Trustee, Portfolio Advisor, and Portfolio Sub-Advisor of the Pools
CIBC Asset Management Inc. (CAMI), a wholly owned subsidiary of CIBC, is the Manager, trustee, and portfolio advisor of each of the Pools.
The Manager also arranges for fund administrative services (other than advertising and promotional services, which are the responsibility of the Manager), legal, investor servicing, and costs of unitholder reports,prospectuses, and other reports. The Manager is the registrar and transfer agent for the Pools and provides, or arranges for the provision of, all other administrative services required by the Pools. The dollar amount(including all applicable taxes) of all fund administrative expenses (net of absorptions) that the Manager recovers from the Pool is reported in footnote Administrative and Other Fund Operating Expenses on theStatements of Comprehensive Income.
Brokerage Arrangements and Soft Dollars
The portfolio sub-advisors make decisions, including the selection of markets and dealers and the negotiation of commissions, with respect to the purchase and sale of portfolio securities, certain derivative products(including futures), and the execution of portfolio transactions. Brokerage business may be allocated by portfolio sub-advisors, to CIBC World Markets Inc. and CIBC World Markets Corp., each a subsidiary of CIBC. Thetotal commissions paid to related brokers in connection with portfolio transactions are reported in footnote Brokerage Commissions and Fees on the Statements of Comprehensive Income of each Pool.
CIBC World Markets Inc. and CIBC World Markets Corp. may also earn spreads on the sale of fixed income, other securities, and certain derivative products (including forwards) to the Pools. Dealers, including CIBCWorld Markets Inc. and CIBC World Markets Corp., may furnish goods and services, other than order execution, to portfolio sub-advisors, that process trades through them (referred to in the industry as “soft-dollar”arrangements). These goods and services are paid for with a portion of brokerage commissions and assist the portfolio sub-advisors with their investment decision-making services to the Pools or relate directly toexecuting portfolio transactions on behalf the Pools. They are supplied by the dealer executing the trade or by a third party and paid for by that dealer. As per the terms of the portfolio sub-advisory agreements, suchsoft dollar arrangements are in compliance with applicable laws. The Manager has entered into an expense reimbursement agreement with CAMI which provides that custodial fees directly related to portfoliotransactions incurred by a Pool, or a portion of a Pool, for which CAMI acts as advisor, shall be paid by CAMI and/or dealer(s) directed by CAMI up to the amount of the credits generated under soft dollar arrangementsfrom trading on behalf of the Pool, or portion of the Pool, during the month. The total soft dollar payments paid by the Pool to related brokers are reported in footnote Brokerage Commissions and Fees on theStatements of Comprehensive Income of each Pool. In addition, the Manager may enter into commission recapture arrangements with certain dealers with respect to the Pools. Any commission recaptured will be paidto the relevant Pool.
Spreads associated with fixed income securities trading and certain derivative products (including forwards) are not ascertainable and, for that reason, are not included in the dollar amounts. In addition, the soft dollaramounts only include the value of research and other services supplied by a third party to the portfolio sub-advisors, as the value of the services supplied to the portfolio sub-advisors by the dealer is not ascertainable.When these services benefit more than one Pool, the costs are allocated among the Pools based on transaction activity or some other fair basis as determined by the portfolio sub-advisors.
Custodian
The custodian holds all cash and securities for the Pools and ensures that those assets are kept separate from any other cash or securities that the custodian might be holding. The custodian also provides otherservices to the Pool including record keeping and processing of foreign exchange transactions. CIBC Mellon Trust Company is the custodian of the Pools (the Custodian). The fees and spreads for services of theCustodian directly related to the execution of portfolio transactions by a Pool, or a portion of a Pool, for which CAMI acts as portfolio advisor are paid by CAMI and/or dealer(s) directed by CAMI up to the amount of thecredits generated under soft dollar arrangements from trading on behalf of the Pool, or portion of the Pool, during that month. All other fees and spreads for the services of the Custodian are borne as an operatingexpense by the Pools. CIBC owns a 50 percent interest in the Custodian.
Service Provider
CIBC Mellon Global Securities Services Company (CIBC GSS) provides certain services to the Pools, including securities lending, fund accounting and reporting, and portfolio valuation. CIBC indirectly owns a 50percent interest in CIBC GSS. The dollar amount paid by the Pools (including all applicable taxes) to CIBC Mellon Trust Company for custodian fees (net of absorptions) and to CIBC GSS for securities lending, fundaccounting, reporting, and fund valuation (all net of absorptions) for the periods ended February 29, 2016 and February 28, 2015 is reported in footnote Service Provider on the Statements of Comprehensive Income.
10. Hedging
Certain foreign currency denominated positions have been hedged, or partially hedged, by forward foreign currency contracts as part of the investment strategies of the Pool. These hedges are indicated by a hedgingreference number on the Schedule of Investment Portfolio and a corresponding hedging reference number on the Forward Foreign Currency Contracts Schedule for the Pools.
11. Collateral on Specified Derivatives
Short-term investments may be used as collateral for futures contracts outstanding with brokers.
x
18

Renaissance Investments
1500 Robert-Bourassa Boulevard, Suite 800Montreal, Quebec
H3A 3S61-888-888-3863
Websiterenaissanceinvestments.ca
CIBC Asset Management Inc., the manager and trustee of the Frontiers Pools, is a wholly-owned subsidiary of Canadian Imperial Bank of Commerce. Please read the Frontiers Poolssimplified prospectus before investing. To obtain a copy of the simplified prospectus, call 1-888-888-3863, email us at [email protected], or ask your advisor.
® Frontiers is a registered trademark of Canadian Imperial Bank of Commerce.® Renaissance Investments is a registered trademark of CIBC Asset Management Inc.Renaissance Investments is offered by CIBC Asset Management Inc.
55-124 (201602)