from provider-centered to team-based care: our experience mary szecsey, executive director dana...
TRANSCRIPT
From Provider-Centered to Team-Based Care:
OUR EXPERIENCE
Mary Szecsey, Executive DirectorDana Valley, Clinical Support Manager

• Clinical Sites:– Primary Care – Occidental, Guerneville, Sebastopol– Dental and Mental Health Services – Guerneville– Teen Clinic – Forestville– Graton Labor Center Outreach – Forestville Wellness Center
Patients 12,990 individuals, 85 % under 200% of poverty level
2012 Budget $10 million 70% patient fees, 30% grants, contracts, fundraising
Staff and Providers– 135 employees in seven locations; 107 FTEs– 17 medical providers, 2 dentists, 7 mental health
counselors and including .6 FTE psychiatrist
2

Provider
Chronic Disease
Monitoring
Preventive Med
Intervention
Mental Health Provider
Referral to Specialist
after Assessment
Medication Refill
New Acute Complaint
Certified Medical
Assistant
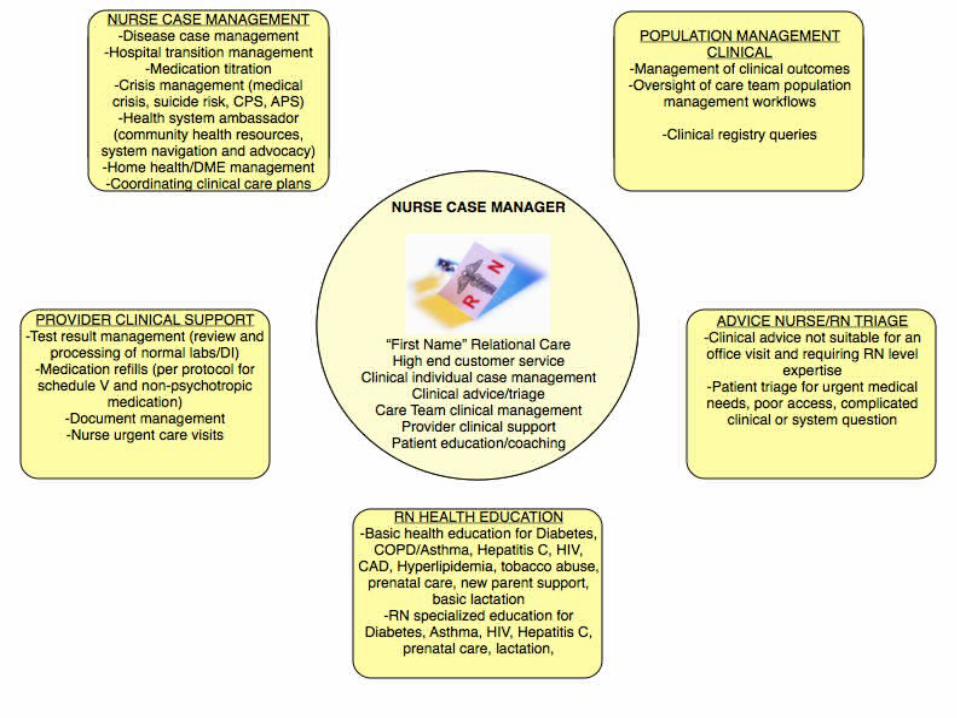
Case Manager
Test Results
HealthcareSupport Team

There has to be a better way!

Our Process
Adopted Principles of CareDefine Care Team RolesEMR (Data)Patient EmpanelmentWorkflowsDocumentationImplementation TrainingSustain

WCHC Principles of Care
Relational AccessTeam basedComprehensive Primary CareAdaptable and measurableCost effective


Medical Staff Ratios
Provider : MA = 1:1.5
Provider : RN = 1:1
Provider : FO = 1: 1.5
9


Quality Dashboard
55% 55%63% 65% 72% 74%
0%
20%
40%
60%
80%
100%
Feb-12
Mar-12
Apr-12
May-12
Jun-12
Jul-12
Diabetic foot exam Good
6

Quality Dashboard
67% 67%
100%100%100%100%
0%
20%
40%
60%
80%
100%
Feb-12
Mar-12
Apr-12
May-12
Jun-12
Jul-12
A1C >9 & care plan
6

Quality Dashboard
70% 70% 69% 70% 68% 68%
0%
20%
40%
60%
80%
100%
Feb-12
Mar-12
Apr-12
May-12
Jun-12
Jul-12
DM on ASA Good
2

Quality Dashboard
58%
72% 66% 78% 84% 65%
0%
20%
40%
60%
80%
100%
Feb-11
Mar-11
Apr-11
May-11
Jun-11
Jul-11
% charges collected at time of service
Good
21

Creating a Culture


Changing the way we do business!
