friction ridge analysis towards lights-out … ridge analysis. towards lights-out latent...
TRANSCRIPT
Friction Ridge AnalysisTowards Lights-out Latent Recognition
Elham TabassiImage Group – NIST
August 31, 2015SAMSI Forensics Opening Workshop
Outline
-We, at NIST-NIST Biometric Evaluations-1:N Latent Fingerprint Matching
-1:N Metrics
-Current latent matching process -Current research at NIST -Closing
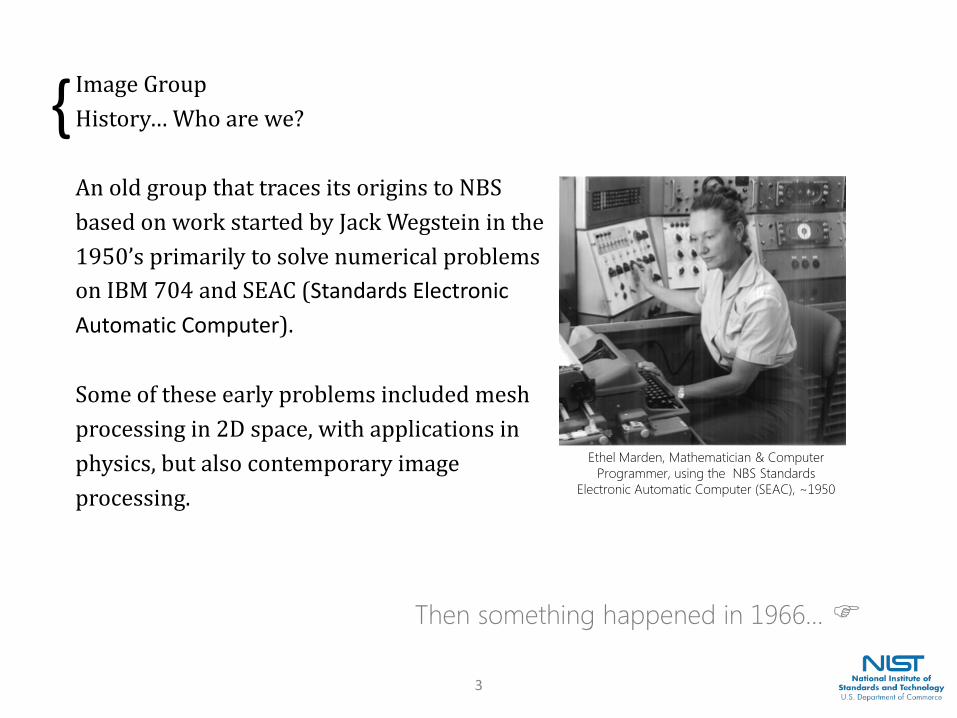
Image GroupHistory… Who are we?An old group that traces its origins to NBS based on work started by Jack Wegstein in the1950’s primarily to solve numerical problemson IBM 704 and SEAC (Standards ElectronicAutomatic Computer).Some of these early problems included mesh processing in 2D space, with applications in physics, but also contemporary image processing.
Then something happened in 1966…
3
{
Ethel Marden, Mathematician & Computer Programmer, using the NBS Standards
Electronic Automatic Computer (SEAC), ~1950
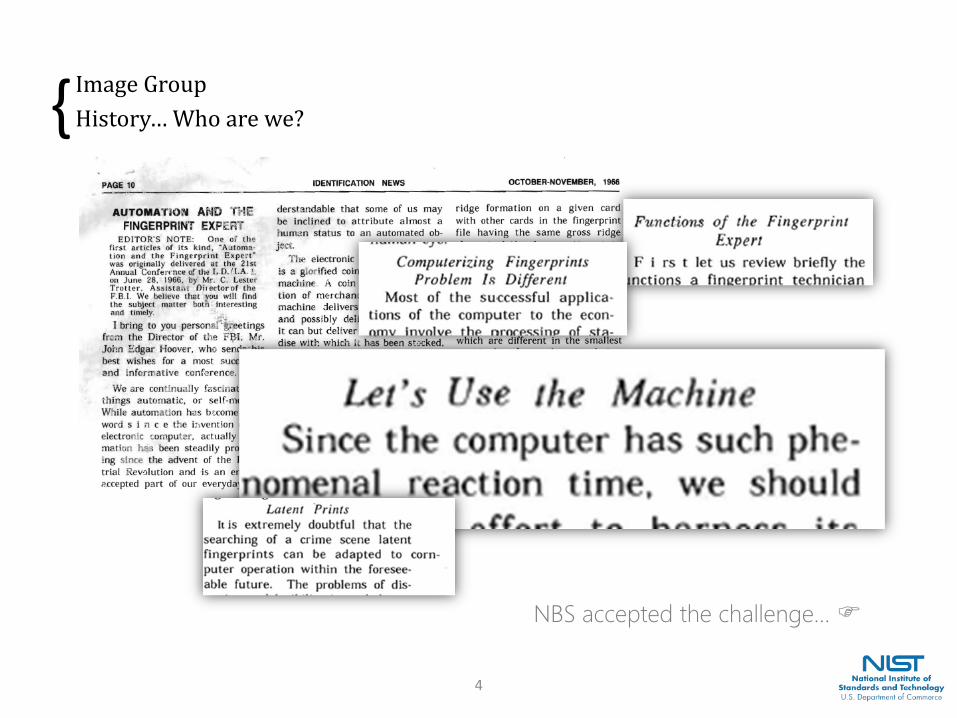
Image GroupHistory… Who are we?
NBS accepted the challenge…
4
{
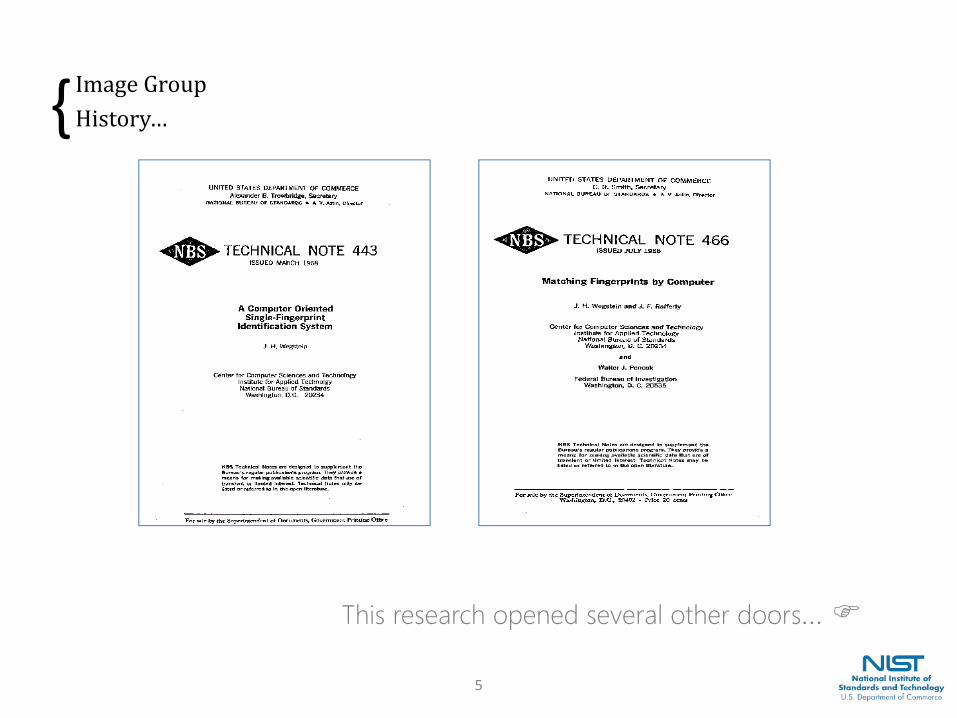
Image GroupHistory…
This research opened several other doors…
5
{
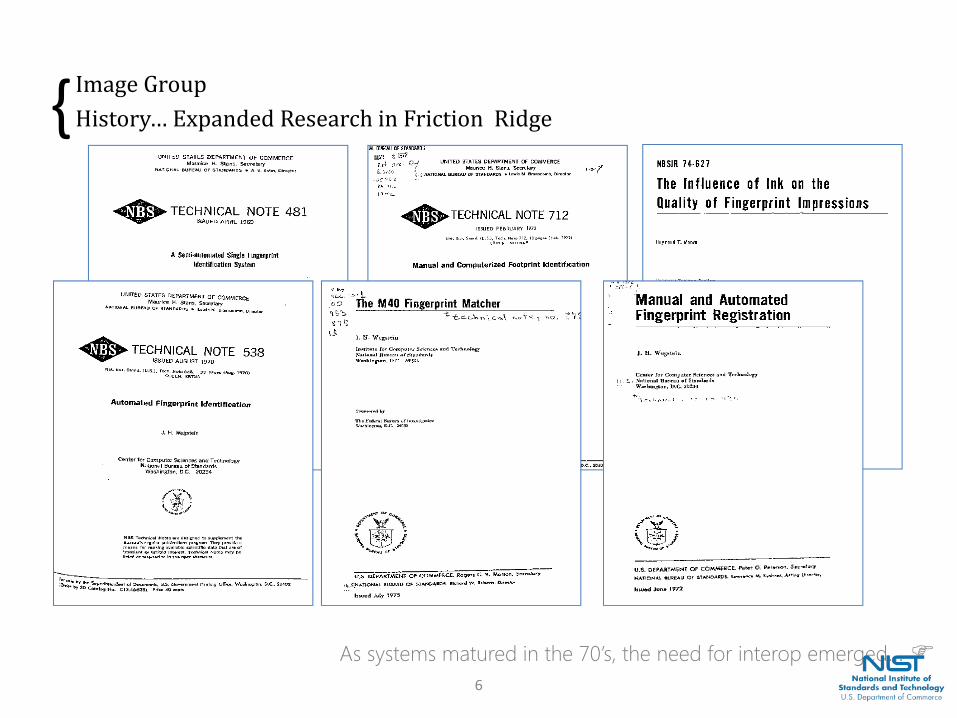
Image GroupHistory… Expanded Research in Friction Ridge
As systems matured in the 70’s, the need for interop emerged… 6
{
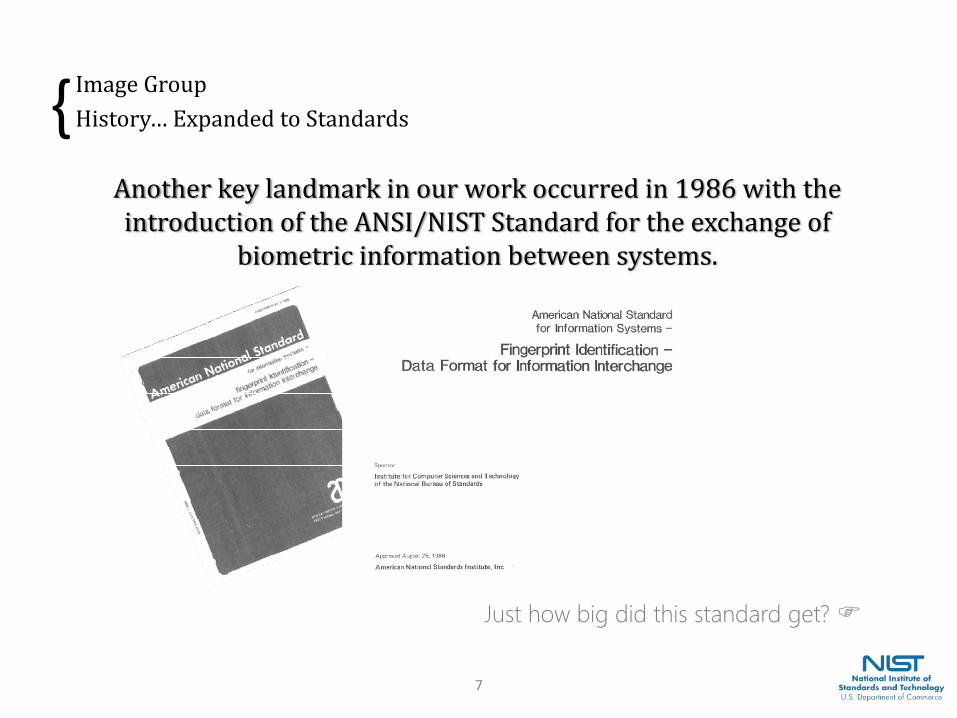
Image GroupHistory… Expanded to Standards
Just how big did this standard get?
7
{ Another key landmark in our work occurred in 1986 with the introduction of the ANSI/NIST Standard for the exchange of biometric information between systems.
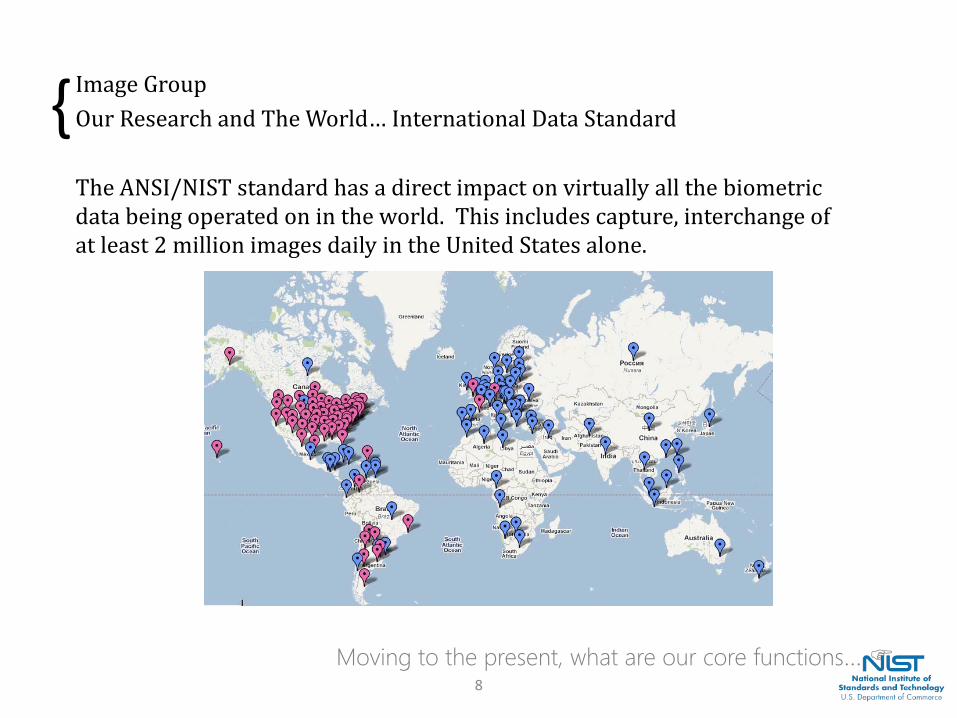
Image GroupOur Research and The World… International Data StandardThe ANSI/NIST standard has a direct impact on virtually all the biometric data being operated on in the world. This includes capture, interchange of at least 2 million images daily in the United States alone.
Moving to the present, what are our core functions… 8
{
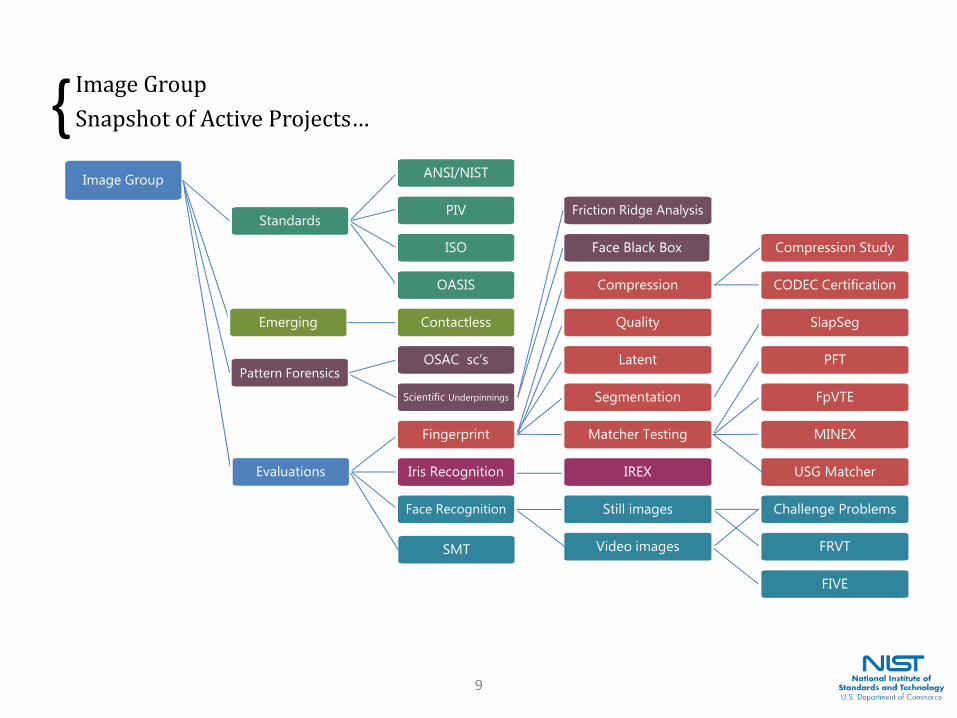
Image GroupSnapshot of Active Projects…
9
{Standards
Pattern Forensics
Emerging
ANSI/NIST
PIV
ISO
Contactless
OSAC sc’s
OASIS
Latent
Matcher Testing
Compression
Segmentation
Quality
MINEX
FpVTE
USG Matcher
PFT
Image Group
Evaluations Iris Recognition
Face Recognition Still images
Video images
IREX
FRVT
FIVE
Fingerprint
Compression Study
CODEC Certification
Friction Ridge Analysis
Face Black Box
Scientific Underpinnings
Challenge Problems
SlapSeg
SMT
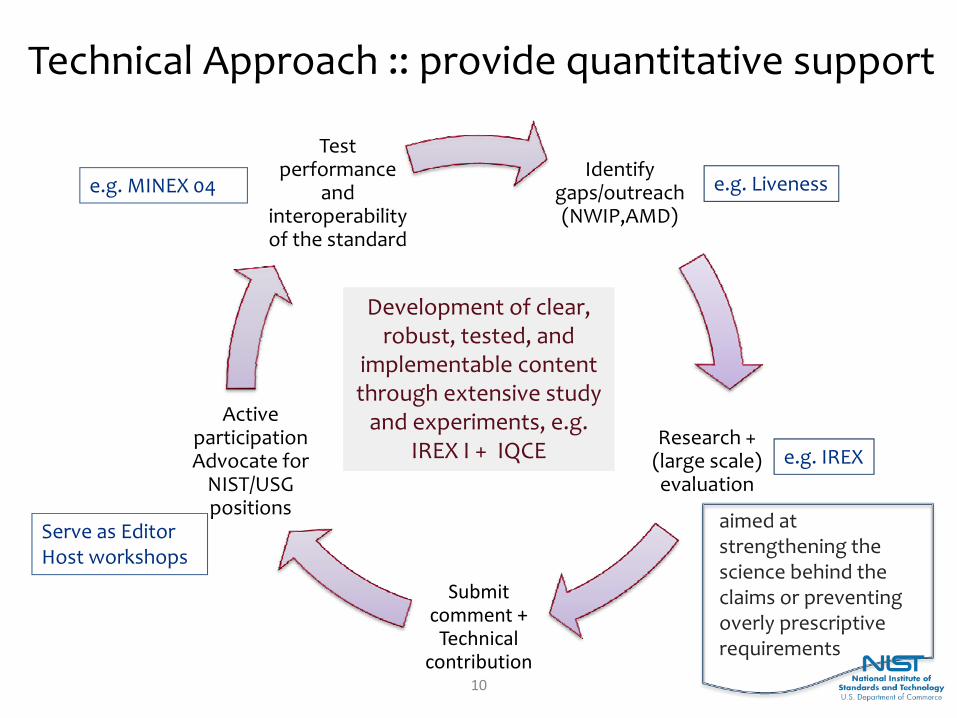
Technical Approach :: provide quantitative support
Identify gaps/outreach (NWIP,AMD)
Research + (large scale) evaluation
Submit comment + Technical
contribution
Active participation Advocate for
NIST/USG positions
Test performance
and interoperability of the standard
Development of clear, robust, tested, and
implementable content through extensive study
and experiments, e.g. IREX I + IQCE
aimed at strengthening the science behind the claims or preventing overly prescriptive requirements
e.g. Livenesse.g. MINEX 04
e.g. IREX
Serve as EditorHost workshops
10

NIST BIOMETRIC EVALUATIONShttp://www.nist.gov/itl/iad/ig/biometric_evaluations.cfm
12
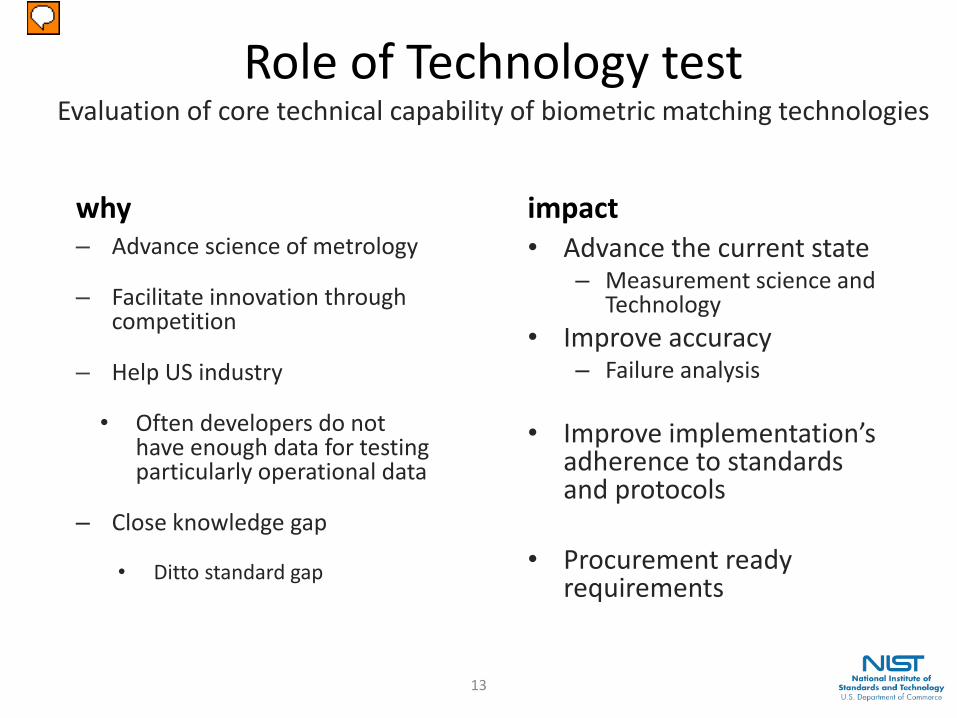
Role of Technology testEvaluation of core technical capability of biometric matching technologies
why– Advance science of metrology
– Facilitate innovation through competition
– Help US industry
• Often developers do not have enough data for testing particularly operational data
– Close knowledge gap
• Ditto standard gap
impact• Advance the current state
– Measurement science and Technology
• Improve accuracy– Failure analysis
• Improve implementation’s adherence to standards and protocols
• Procurement ready requirements
13
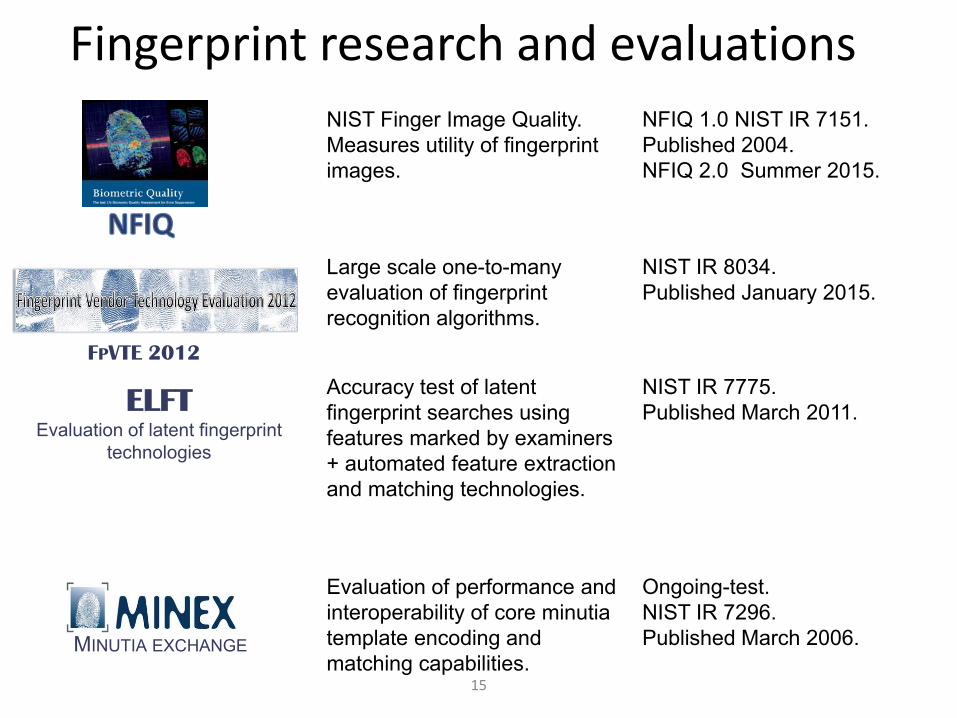
Fingerprint research and evaluationsNIST Finger Image Quality.Measures utility of fingerprint images.
NFIQ 1.0 NIST IR 7151. Published 2004.NFIQ 2.0 Summer 2015.
Large scale one-to-many evaluation of fingerprint recognition algorithms.
NIST IR 8034. Published January 2015.
ELFTEvaluation of latent fingerprint
technologies
Accuracy test of latent fingerprint searches using features marked by examiners+ automated feature extraction and matching technologies.
NIST IR 7775. Published March 2011.
Evaluation of performance and interoperability of core minutia template encoding and matching capabilities.
Ongoing-test.NIST IR 7296. Published March 2006.MINUTIA EXCHANGE
FPVTE 2012
4
15
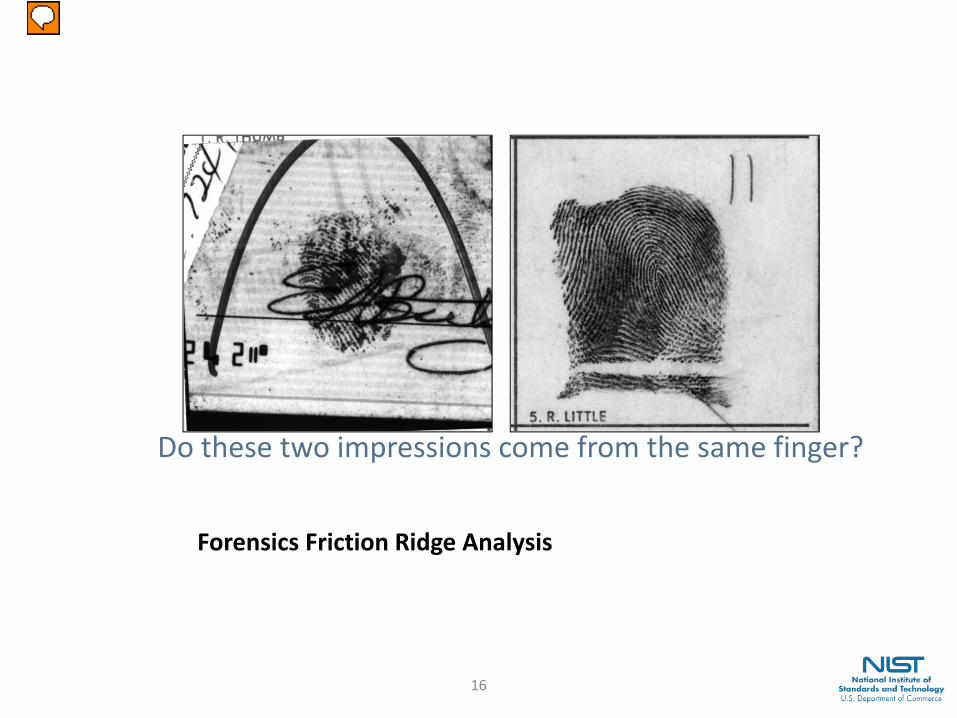
Do these two impressions come from the same finger?
Forensics Friction Ridge Analysis
16
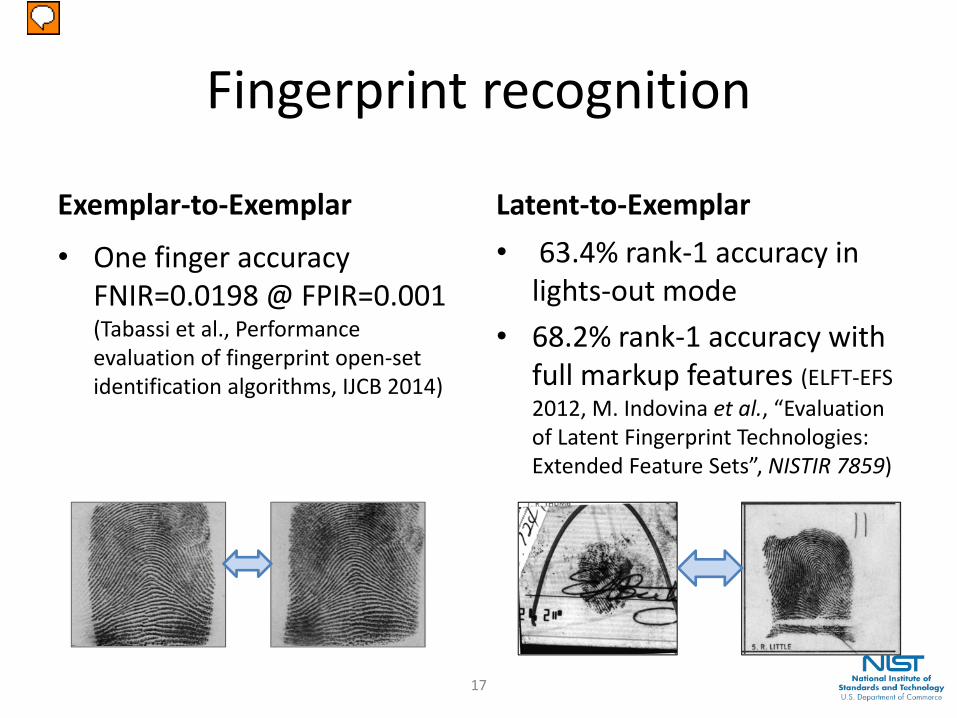
Fingerprint recognition
Exemplar-to-Exemplar Latent-to-Exemplar• 63.4% rank-1 accuracy in
lights-out mode• 68.2% rank-1 accuracy with
full markup features (ELFT-EFS 2012, M. Indovina et al., “Evaluation of Latent Fingerprint Technologies: Extended Feature Sets”, NISTIR 7859)
• One finger accuracy FNIR=0.0198 @ FPIR=0.001 (Tabassi et al., Performance evaluation of fingerprint open-set identification algorithms, IJCB 2014)
17
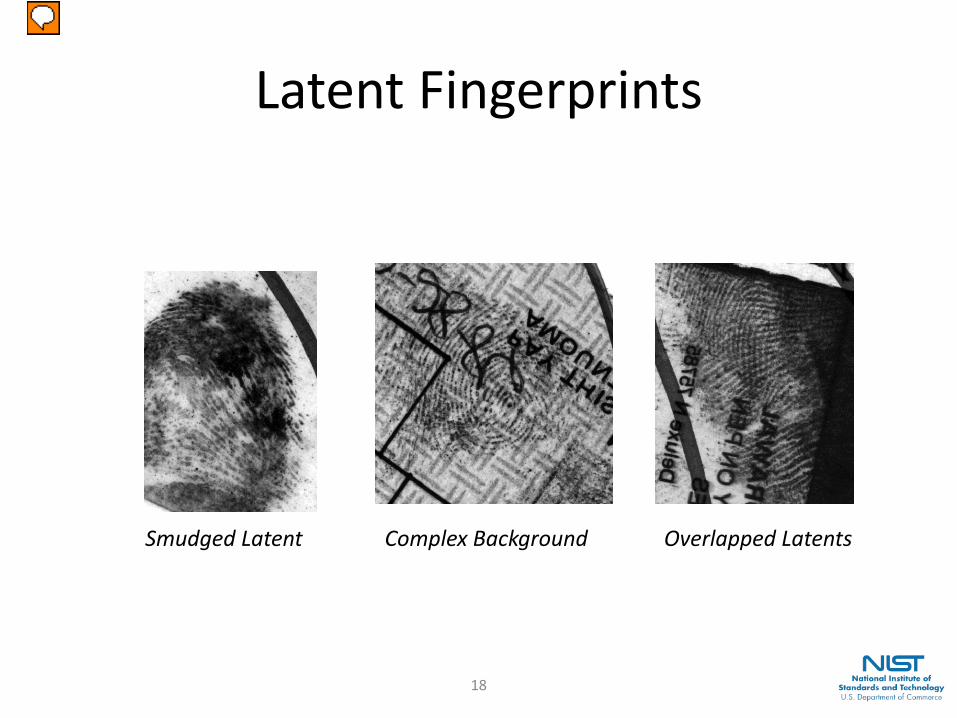
Latent Fingerprints
Smudged Latent Complex Background Overlapped Latents
18
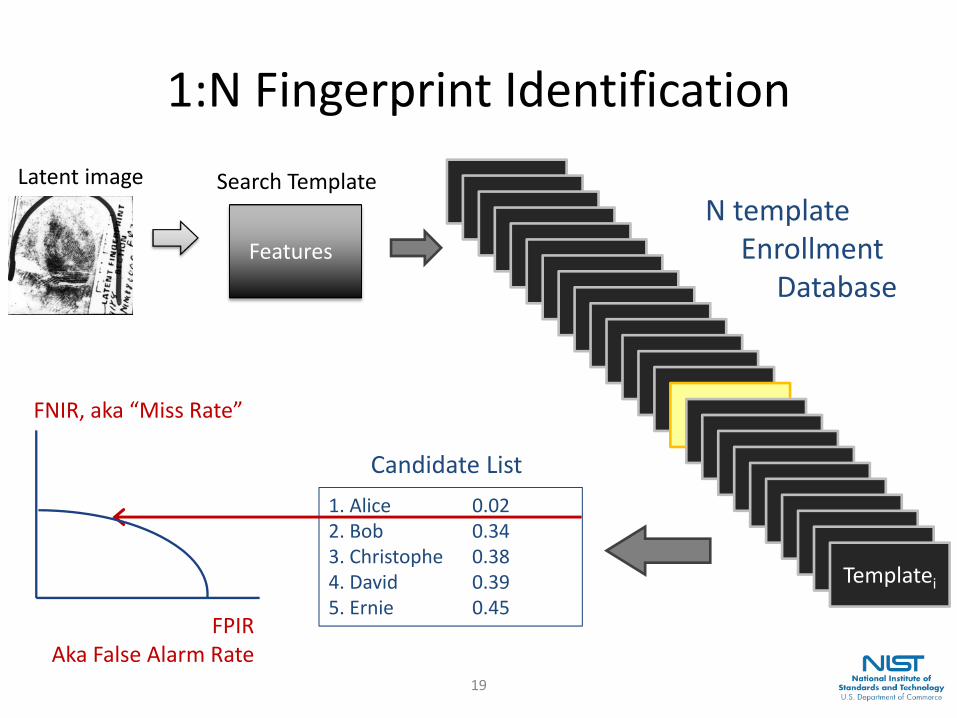
1:N Fingerprint Identification
Templatei
N templateEnrollment
Database
1. Alice 0.022. Bob 0.343. Christophe 0.384. David 0.395. Ernie 0.45
Candidate List
FNIR, aka “Miss Rate”
FPIRAka False Alarm Rate
Latent image
Features
Search Template
19
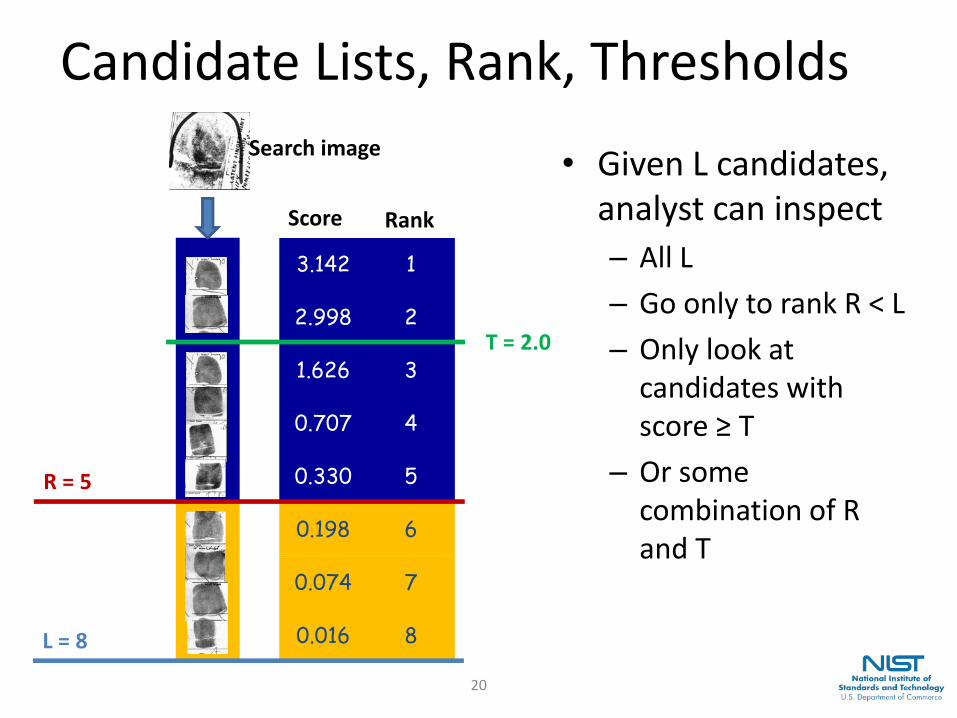
Candidate Lists, Rank, Thresholds
• Given L candidates, analyst can inspect– All L– Go only to rank R < L– Only look at
candidates with score ≥ T
– Or some combination of R and T
3.142 1
2.998 2
1.626 3
0.707 4
0.330 5
0.198 6
0.074 7
0.016 8
R = 5
Search image
L = 8
Score Rank
T = 2.0
20
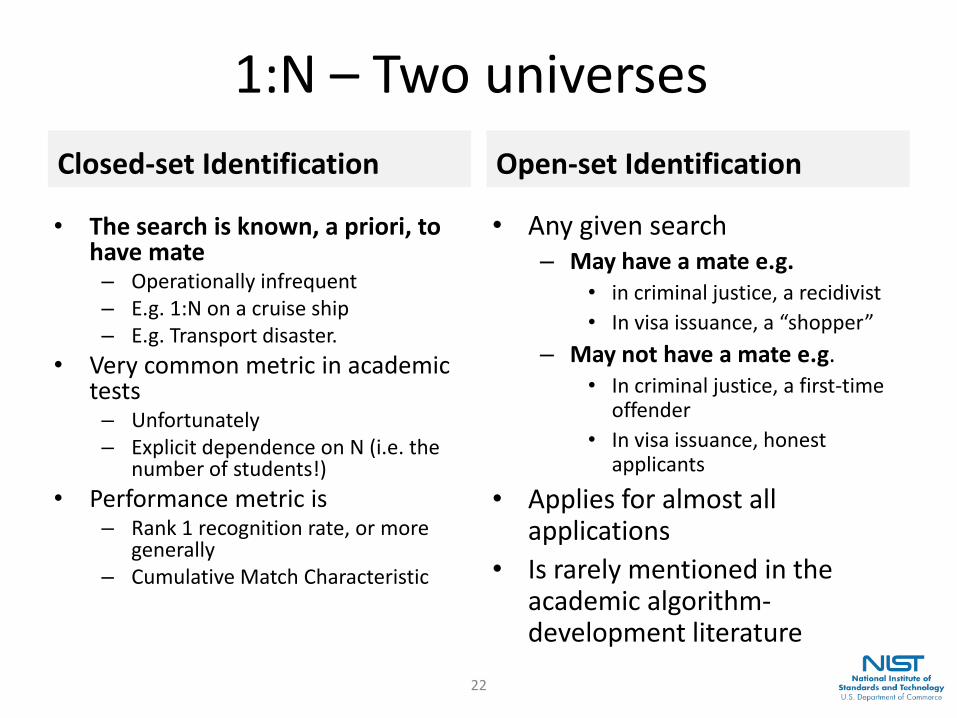
1:N – Two universesClosed-set Identification
• The search is known, a priori, to have mate– Operationally infrequent– E.g. 1:N on a cruise ship– E.g. Transport disaster.
• Very common metric in academic tests– Unfortunately– Explicit dependence on N (i.e. the
number of students!)• Performance metric is
– Rank 1 recognition rate, or more generally
– Cumulative Match Characteristic
Open-set Identification
• Any given search– May have a mate e.g.
• in criminal justice, a recidivist• In visa issuance, a “shopper”
– May not have a mate e.g.• In criminal justice, a first-time
offender• In visa issuance, honest
applicants
• Applies for almost all applications
• Is rarely mentioned in the academic algorithm-development literature
22
1:N ACCURACY METRICS
23
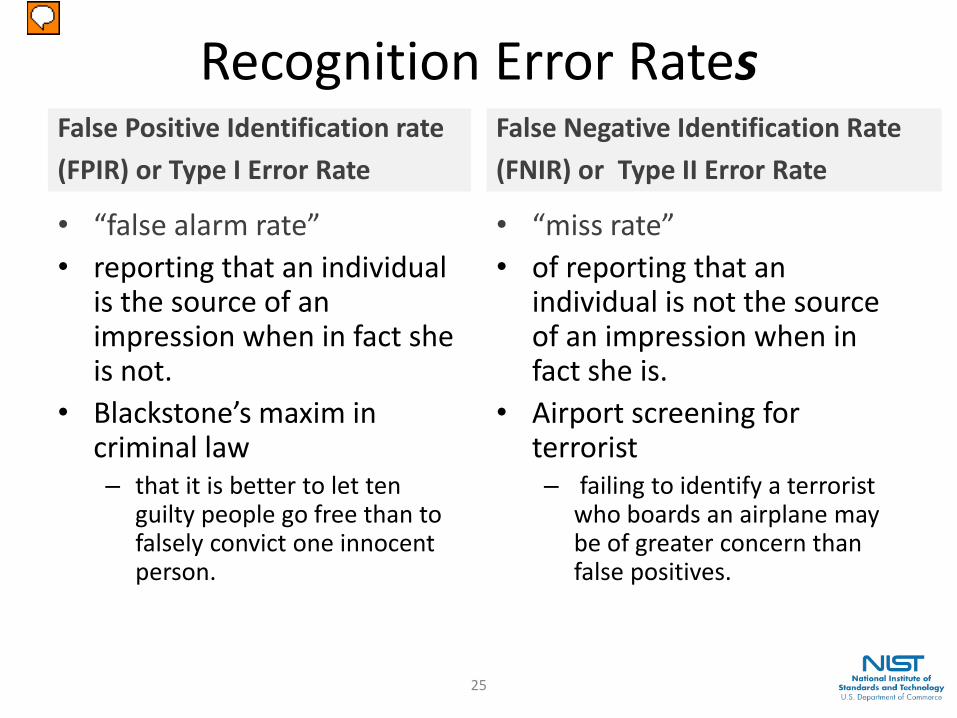
Recognition Error RatesFalse Positive Identification rate (FPIR) or Type I Error Rate
• “false alarm rate” • reporting that an individual
is the source of an impression when in fact she is not.
• Blackstone’s maxim in criminal law– that it is better to let ten
guilty people go free than to falsely convict one innocent person.
False Negative Identification Rate (FNIR) or Type II Error Rate
• “miss rate”• of reporting that an
individual is not the source of an impression when in fact she is.
• Airport screening for terrorist– failing to identify a terrorist
who boards an airplane may be of greater concern than false positives.
25
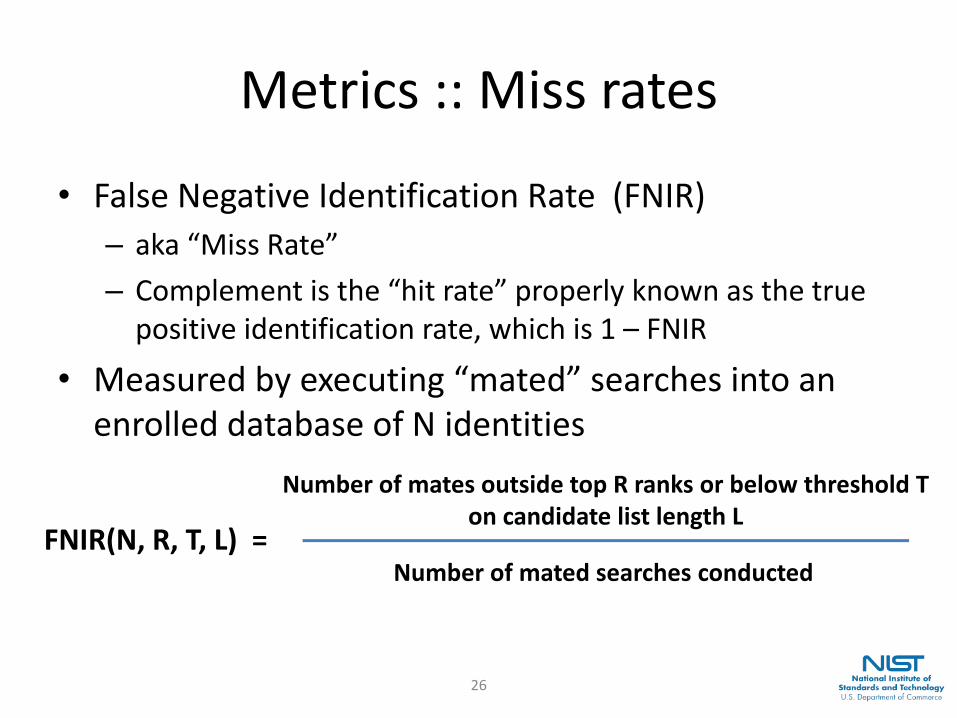
Metrics :: Miss rates
• False Negative Identification Rate (FNIR)– aka “Miss Rate”– Complement is the “hit rate” properly known as the true
positive identification rate, which is 1 – FNIR
• Measured by executing “mated” searches into an enrolled database of N identities
FNIR(N, R, T, L) =
Number of mates outside top R ranks or below threshold Ton candidate list length L
Number of mated searches conducted
26
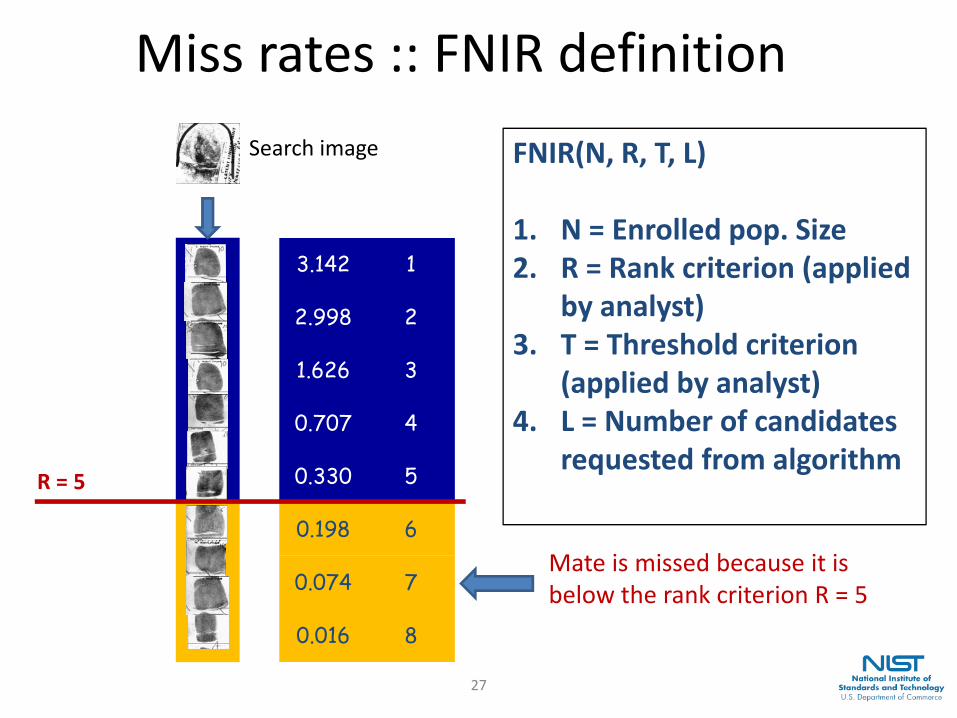
Miss rates :: FNIR definition
3.142 1
2.998 2
1.626 3
0.707 4
0.330 5
0.198 6
0.074 7
0.016 8
R = 5
Mate is missed because it is below the rank criterion R = 5
Search image FNIR(N, R, T, L)
1. N = Enrolled pop. Size2. R = Rank criterion (applied
by analyst)3. T = Threshold criterion
(applied by analyst)4. L = Number of candidates
requested from algorithm
27
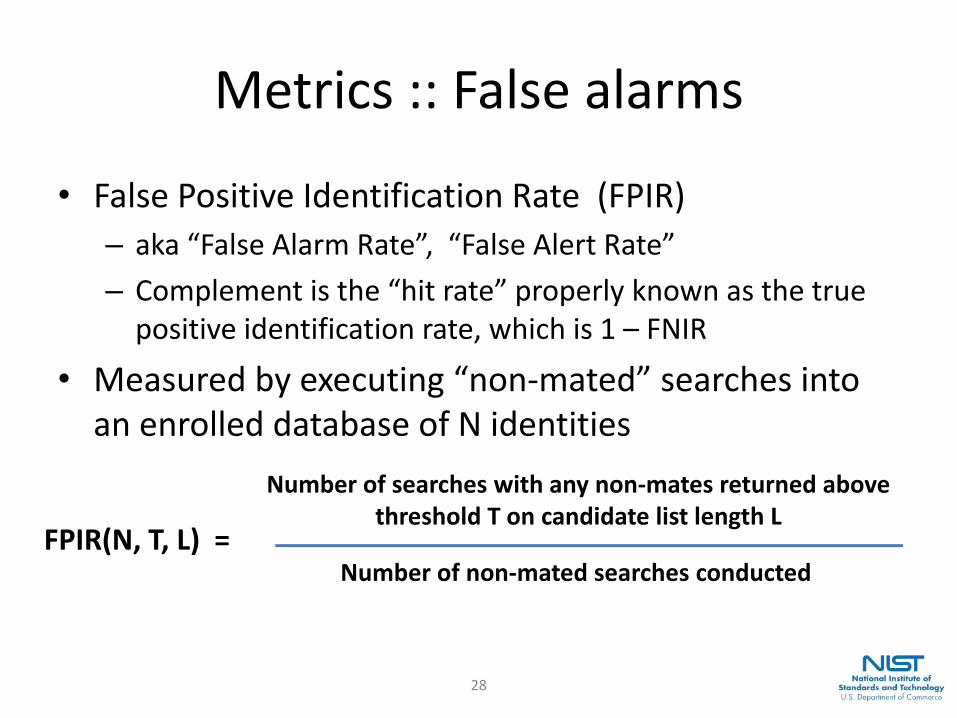
Metrics :: False alarms
• False Positive Identification Rate (FPIR)– aka “False Alarm Rate”, “False Alert Rate”– Complement is the “hit rate” properly known as the true
positive identification rate, which is 1 – FNIR
• Measured by executing “non-mated” searches into an enrolled database of N identities
FPIR(N, T, L) =
Number of searches with any non-mates returned abovethreshold T on candidate list length L
Number of non-mated searches conducted
28
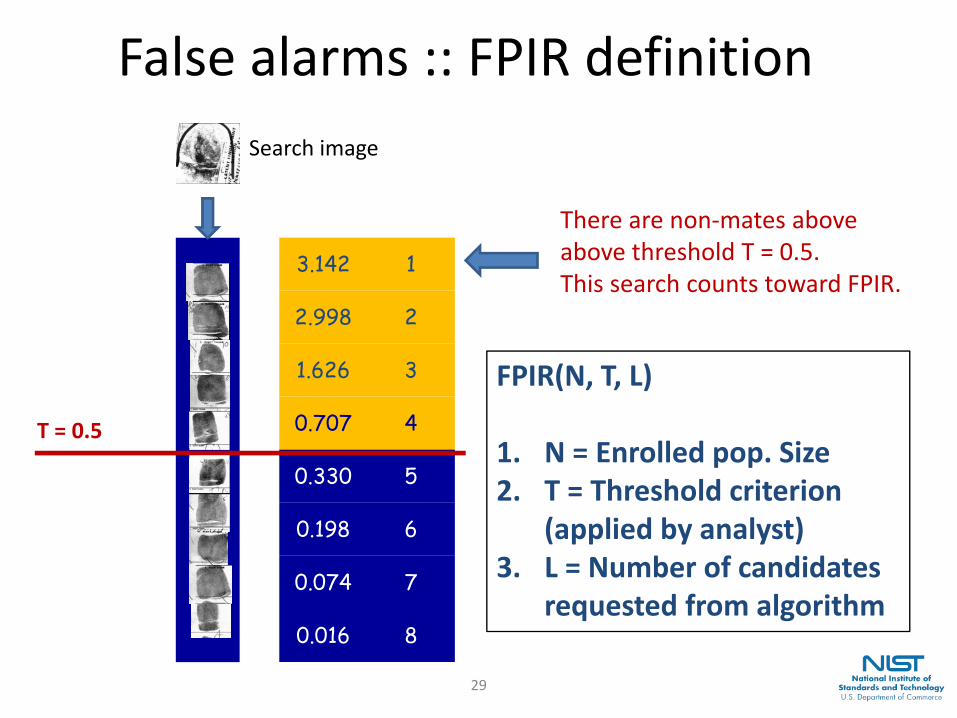
False alarms :: FPIR definition
3.142 1
2.998 2
1.626 3
0.707 4
0.330 5
0.198 6
0.074 7
0.016 8
T = 0.5
There are non-mates above above threshold T = 0.5.This search counts toward FPIR.
Search image
FPIR(N, T, L)
1. N = Enrolled pop. Size2. T = Threshold criterion
(applied by analyst)3. L = Number of candidates
requested from algorithm
29
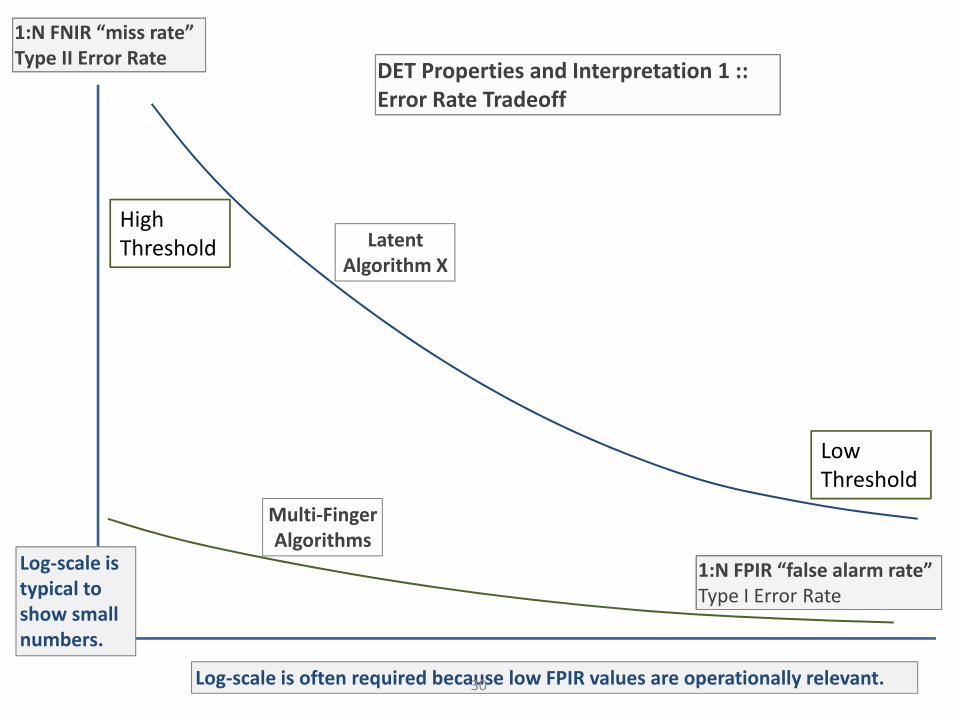
DET Properties and Interpretation 1 :: Error Rate Tradeoff
LatentAlgorithm X
1:N FNIR “miss rate”Type II Error Rate
1:N FPIR “false alarm rate”Type I Error Rate
Log-scale is typical to show small numbers.
Log-scale is often required because low FPIR values are operationally relevant.
High Threshold
Low Threshold
Multi-FingerAlgorithms
30
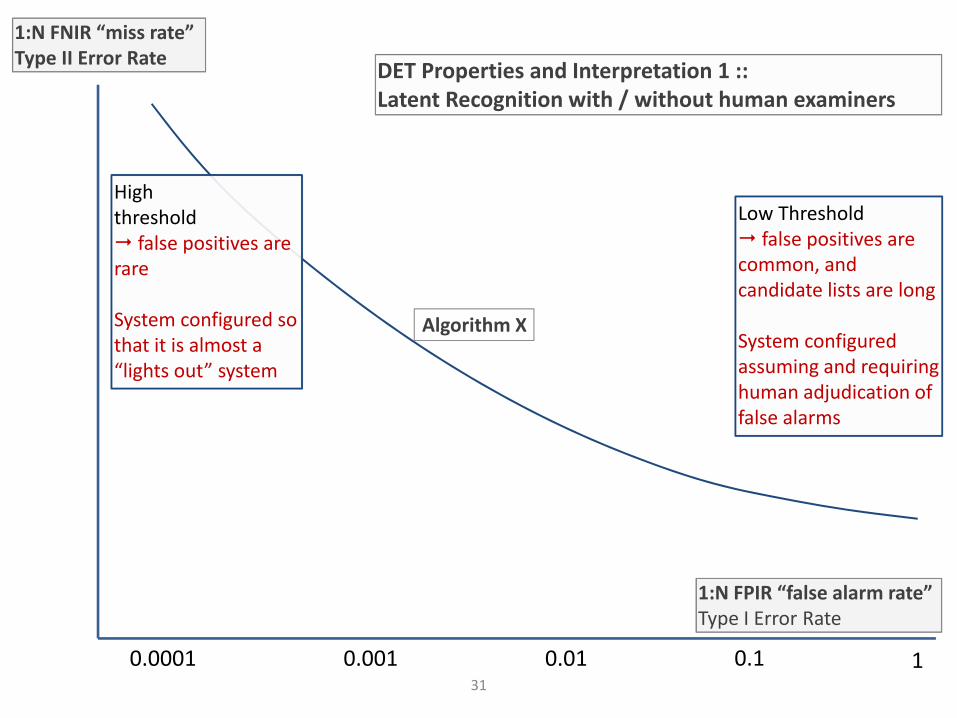
DET Properties and Interpretation 1 ::Latent Recognition with / without human examiners
Algorithm X
1:N FNIR “miss rate”Type II Error Rate
1:N FPIR “false alarm rate”Type I Error Rate
Highthreshold
false positives are rare
System configured so that it is almost a “lights out” system
Low Thresholdfalse positives are
common, and candidate lists are long
System configured assuming and requiring human adjudication of false alarms
0.0001 0.001 0.01 0.1 131
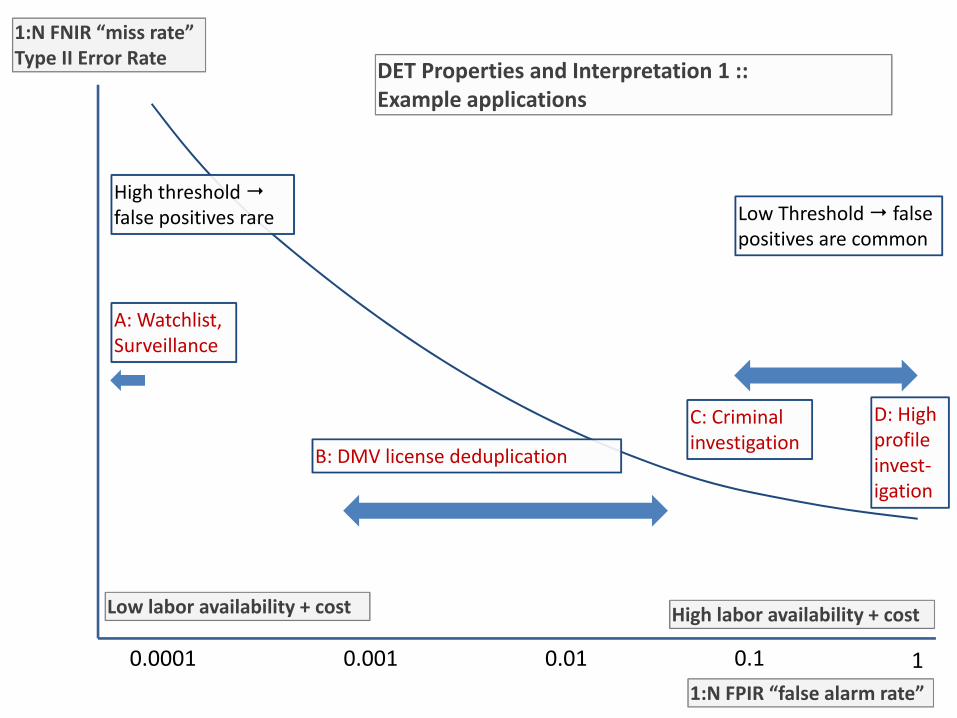
DET Properties and Interpretation 1 ::Example applications
1:N FNIR “miss rate”Type II Error Rate
1:N FPIR “false alarm rate”
High threshold false positives rare Low Threshold false
positives are common
0.0001 0.001 0.01 0.1 1
A: Watchlist,Surveillance
B: DMV license deduplication
C: Criminal investigation
D: High profile invest-igation
High labor availability + costLow labor availability + cost
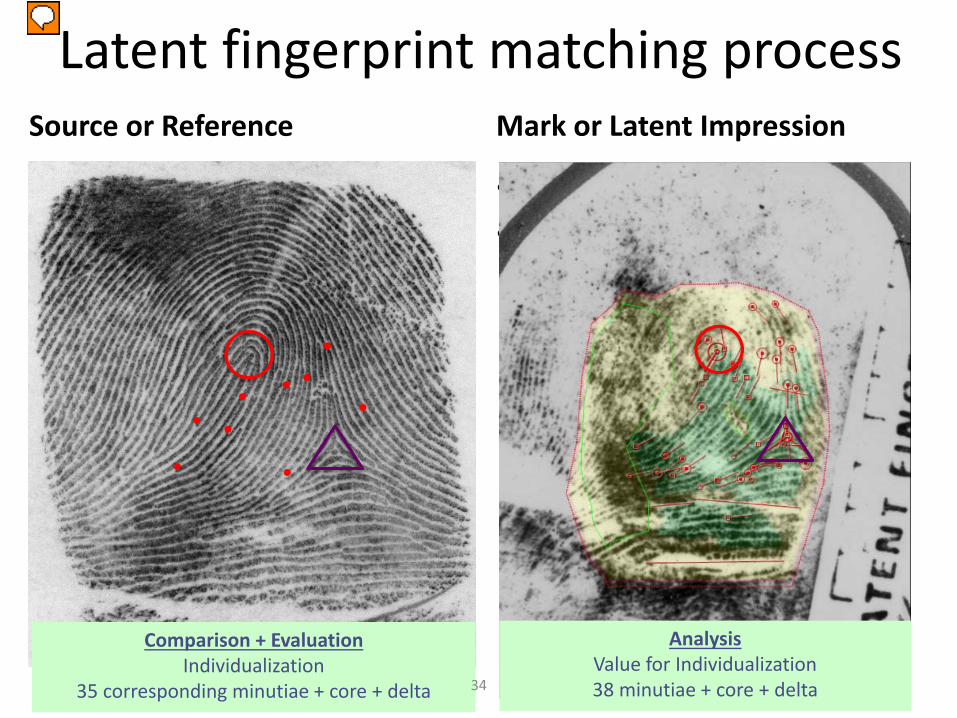
Latent fingerprint matching processSource or Reference
» Large area» Better defined
Mark or Latent Impression
• Less area • Less well defined
AnalysisValue for Individualization 38 minutiae + core + delta
Comparison + EvaluationIndividualization
35 corresponding minutiae + core + delta
5
34
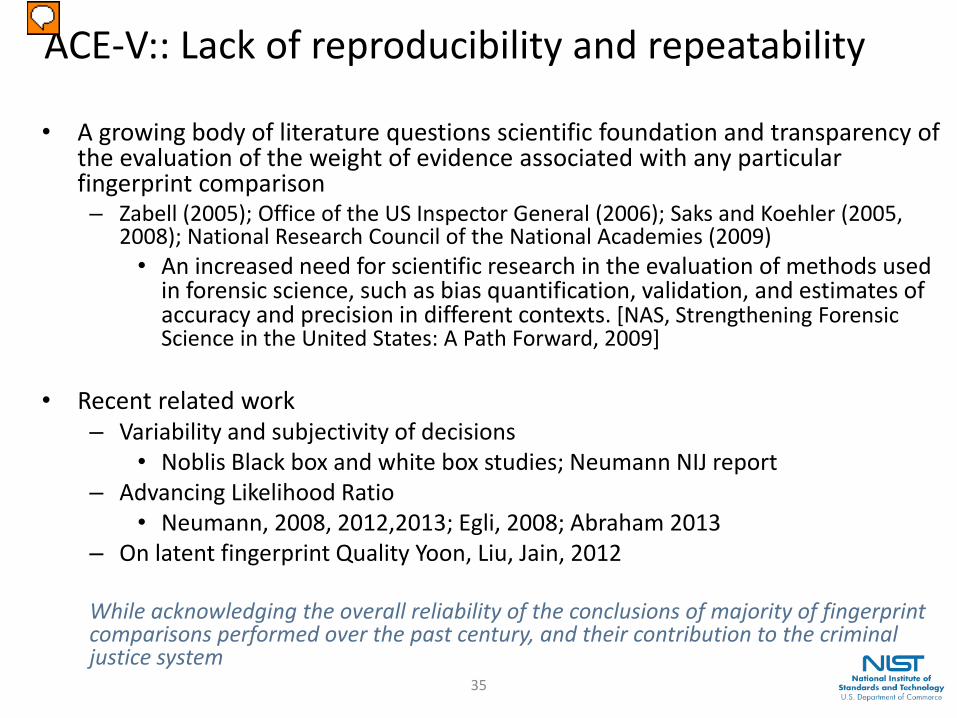
ACE-V:: Lack of reproducibility and repeatability
• A growing body of literature questions scientific foundation and transparency of the evaluation of the weight of evidence associated with any particular fingerprint comparison – Zabell (2005); Office of the US Inspector General (2006); Saks and Koehler (2005,
2008); National Research Council of the National Academies (2009)• An increased need for scientific research in the evaluation of methods used
in forensic science, such as bias quantification, validation, and estimates of accuracy and precision in different contexts. [NAS, Strengthening Forensic Science in the United States: A Path Forward, 2009]
• Recent related work– Variability and subjectivity of decisions
• Noblis Black box and white box studies; Neumann NIJ report– Advancing Likelihood Ratio
• Neumann, 2008, 2012,2013; Egli, 2008; Abraham 2013– On latent fingerprint Quality Yoon, Liu, Jain, 2012
While acknowledging the overall reliability of the conclusions of majority of fingerprint comparisons performed over the past century, and their contribution to the criminal justice system
35
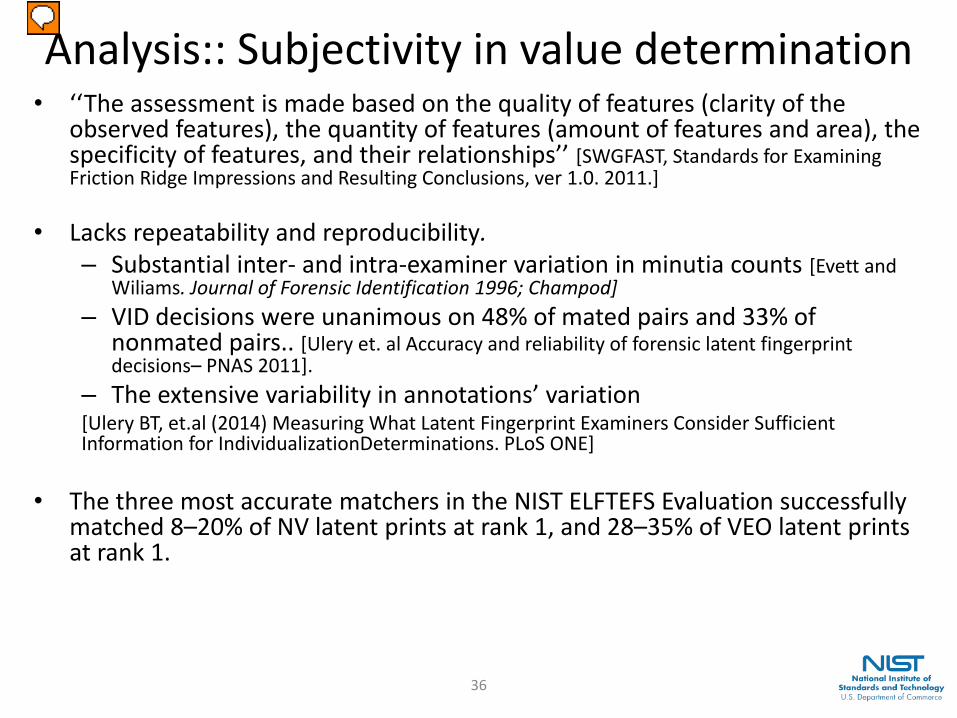
Analysis:: Subjectivity in value determination• ‘‘The assessment is made based on the quality of features (clarity of the
observed features), the quantity of features (amount of features and area), the specificity of features, and their relationships’’ [SWGFAST, Standards for Examining Friction Ridge Impressions and Resulting Conclusions, ver 1.0. 2011.]
• Lacks repeatability and reproducibility. – Substantial inter- and intra-examiner variation in minutia counts [Evett and
Wiliams. Journal of Forensic Identification 1996; Champod] – VID decisions were unanimous on 48% of mated pairs and 33% of
nonmated pairs.. [Ulery et. al Accuracy and reliability of forensic latent fingerprint decisions– PNAS 2011].
– The extensive variability in annotations’ variation[Ulery BT, et.al (2014) Measuring What Latent Fingerprint Examiners Consider Sufficient Information for IndividualizationDeterminations. PLoS ONE]
• The three most accurate matchers in the NIST ELFTEFS Evaluation successfully matched 8–20% of NV latent prints at rank 1, and 28–35% of VEO latent prints at rank 1.
36
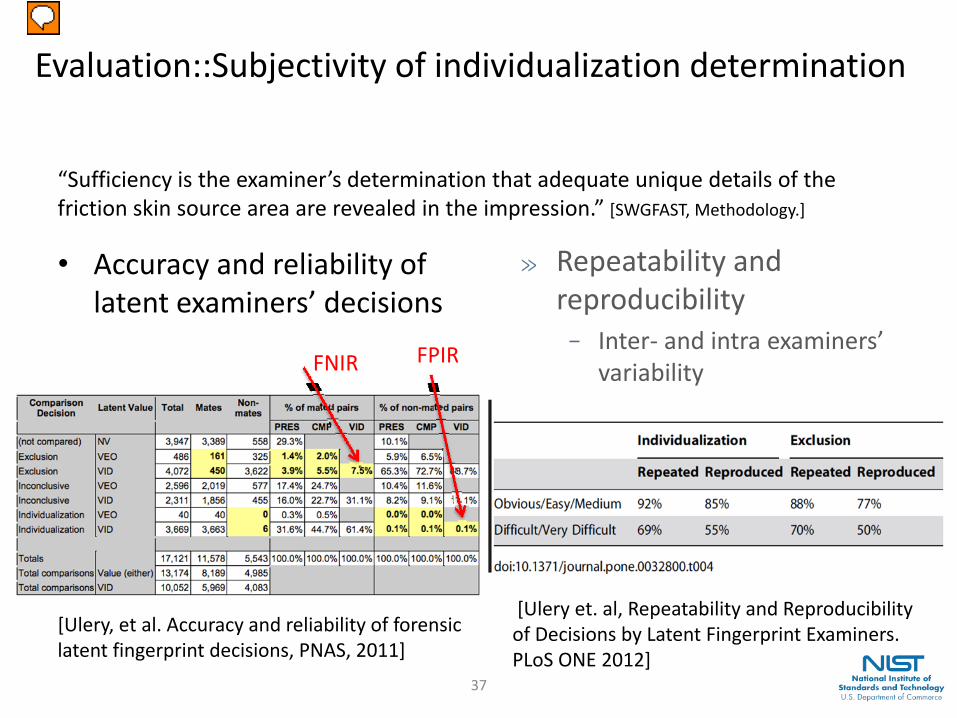
Evaluation::Subjectivity of individualization determination
• Accuracy and reliability of latent examiners’ decisions
“Sufficiency is the examiner’s determination that adequate unique details of the friction skin source area are revealed in the impression.” [SWGFAST, Methodology.]
[Ulery, et al. Accuracy and reliability of forensiclatent fingerprint decisions, PNAS, 2011]
≫ Repeatability and reproducibility − Inter- and intra examiners’
variability
[Ulery et. al, Repeatability and Reproducibility of Decisions by Latent Fingerprint Examiners. PLoS ONE 2012]
FNIR FPIR
37
NIST STATISTICAL FRICTION RIDGE ANALYSIS
39
Objectives» To quantify the weight of evidence and uncertainty in friction ridge
forensic determination.
➾ Develop a probabilistic framework to assess the strength of comparison between a latent and the suspected print in a robust reliable manner.
➾ provide the fingerprint community with a body of research, empirically validated methods and data to support development of better standards for expressing and supporting the conclusions of fingerprint examinations.
≫ Develop population statistics− to limit the possible reference population of a particular print in a
statistical approach, and− provide examiners with a more robust understanding of the
prevalence of different ridge flows and crease patterns
2
40
Research Area» Measuring discriminating value of the various ridge formations and
clusters of ridge formations- Minutia quality, ridge quality- Rarity of features
» Measuring information content − Sufficiency for individualization− Sufficiency for exclusion− Uncertainty of individualization or exclusion− Likelihood ratio, pros and cons.
3
41
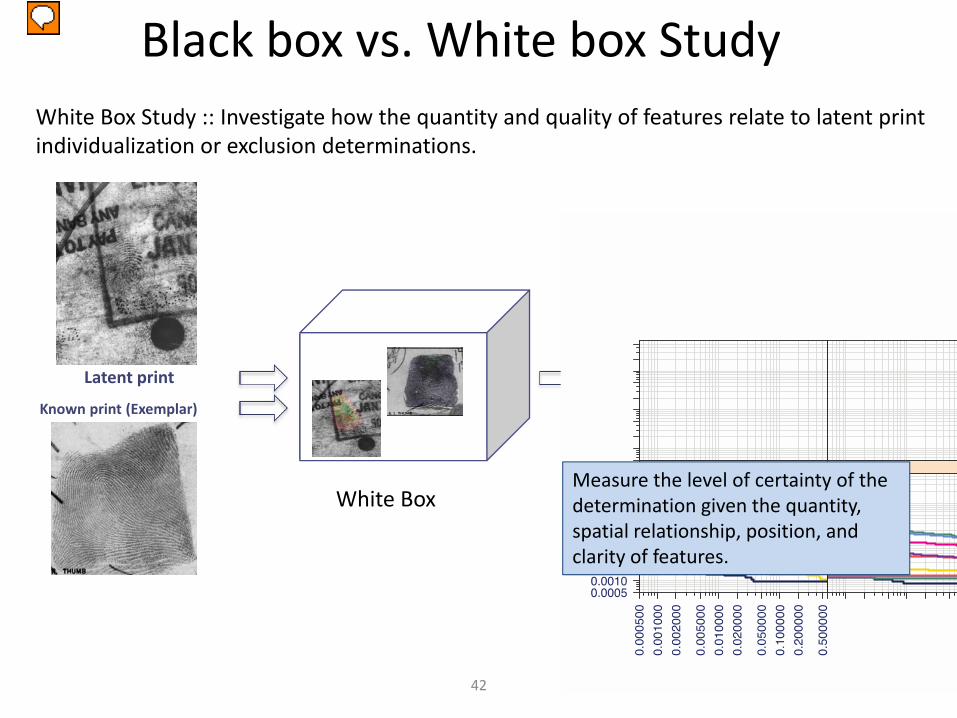
Black box vs. White box Study
Latent print Comparison Score
Black Box
White Box Study :: Investigate how the quantity and quality of features relate to latent print individualization or exclusion determinations.
White Box
FPIR (False Alarm Rate)
FNIR
(Miss
Rat
e)
Measure the level of certainty of the determination given the quantity, spatial relationship, position, and clarity of features.
Known print (Exemplar)
6
42
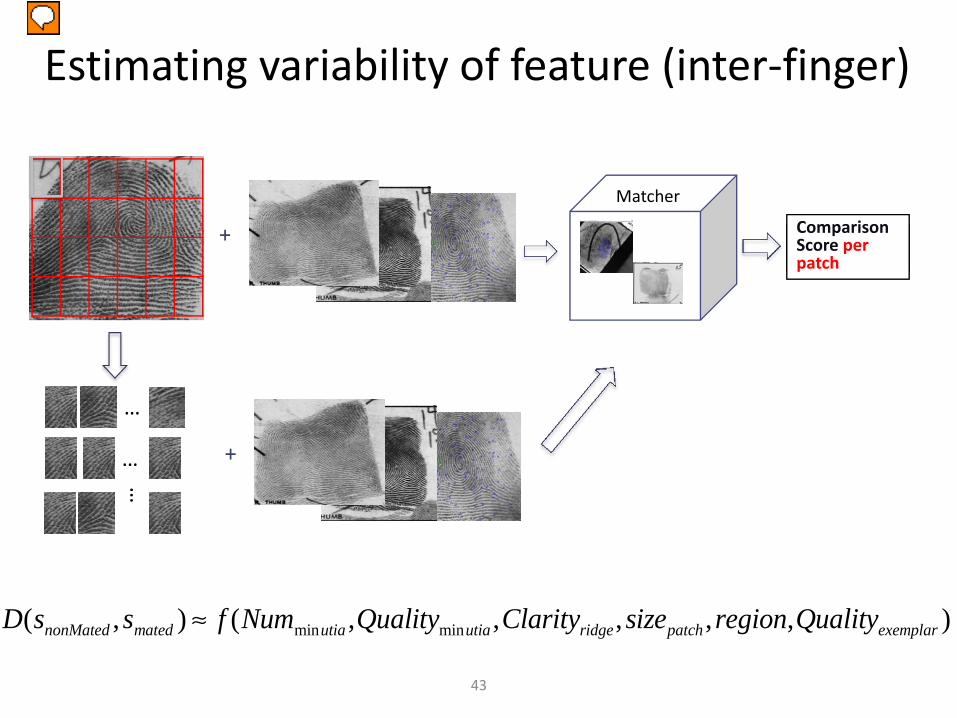
Estimating variability of feature (inter-finger)
Comparison Score
D(snonMated ,smated ) ≈ f (Numminutia ,Qualityminutia ,Clarityridge,sizepatch ,region,Qualityexemplar )
Comparison Score per patch
Matcher
…
…
…
+
+
7
43
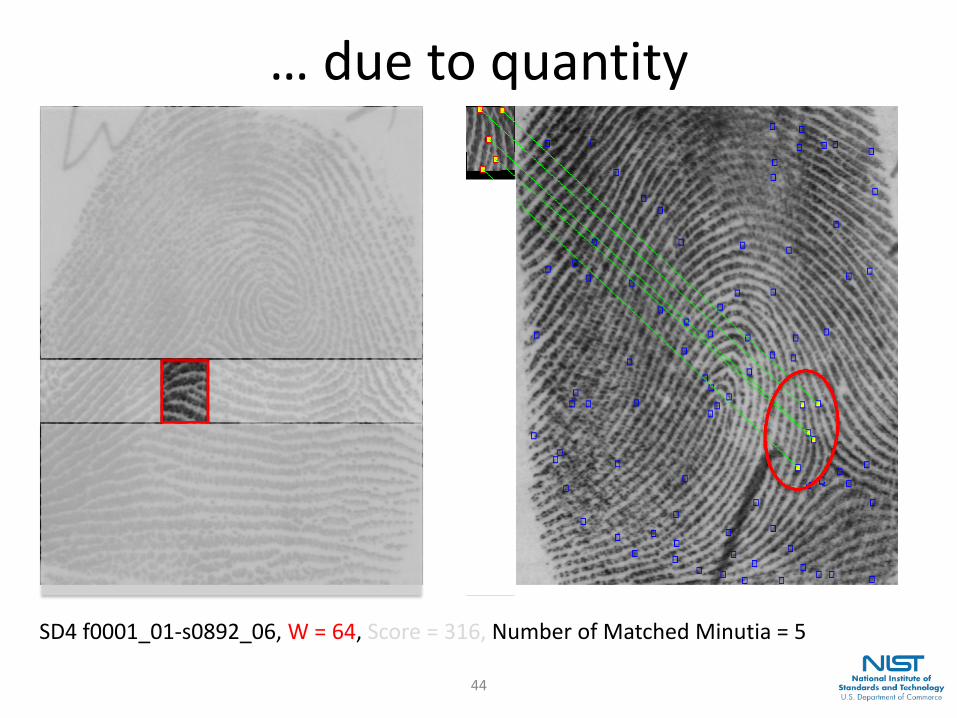
… due to quantity
SD4 f0001_01-s0892_06, W = 64, Score = 316, Number of Matched Minutia = 5
8
44
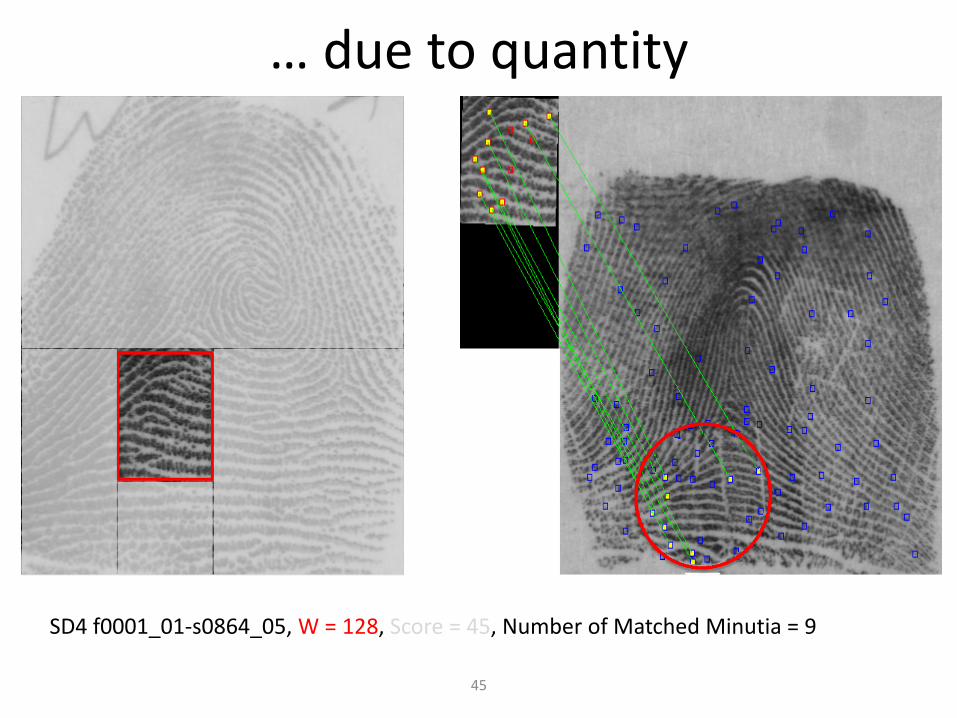
… due to quantity
SD4 f0001_01-s0864_05, W = 128, Score = 45, Number of Matched Minutia = 9
9
45
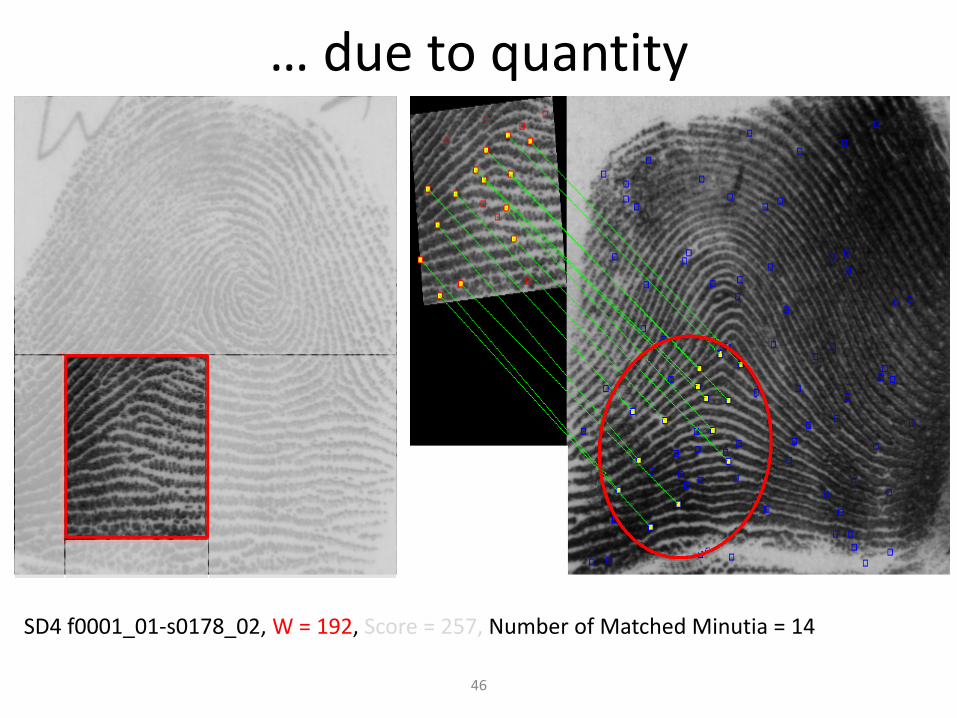
… due to quantity
SD4 f0001_01-s0178_02, W = 192, Score = 257, Number of Matched Minutia = 14
10
46
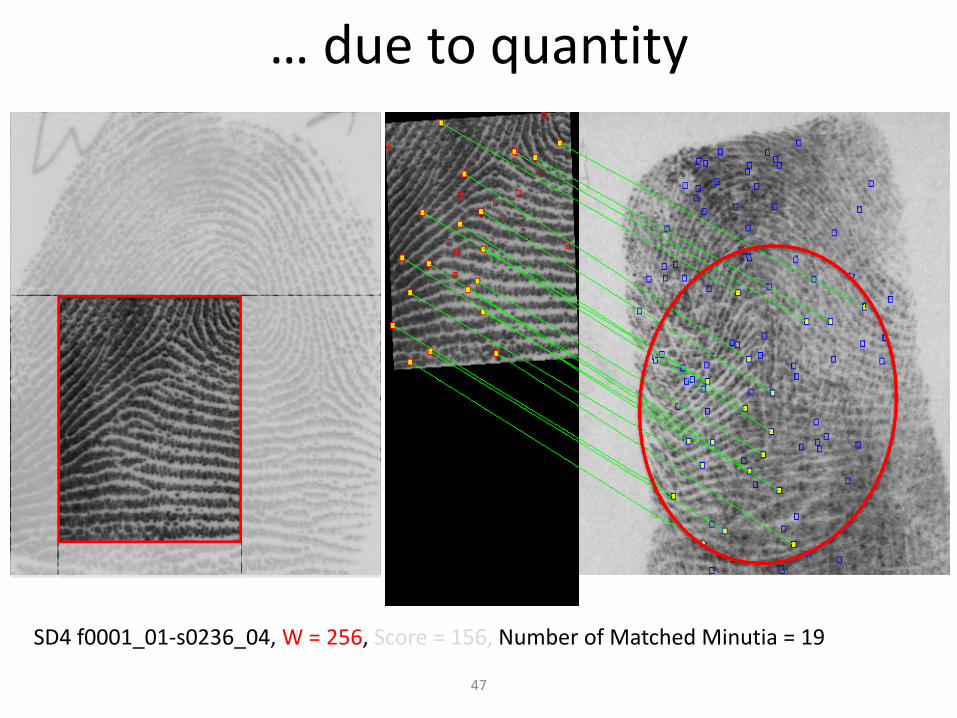
… due to quantity
SD4 f0001_01-s0236_04, W = 256, Score = 156, Number of Matched Minutia = 19
11
47
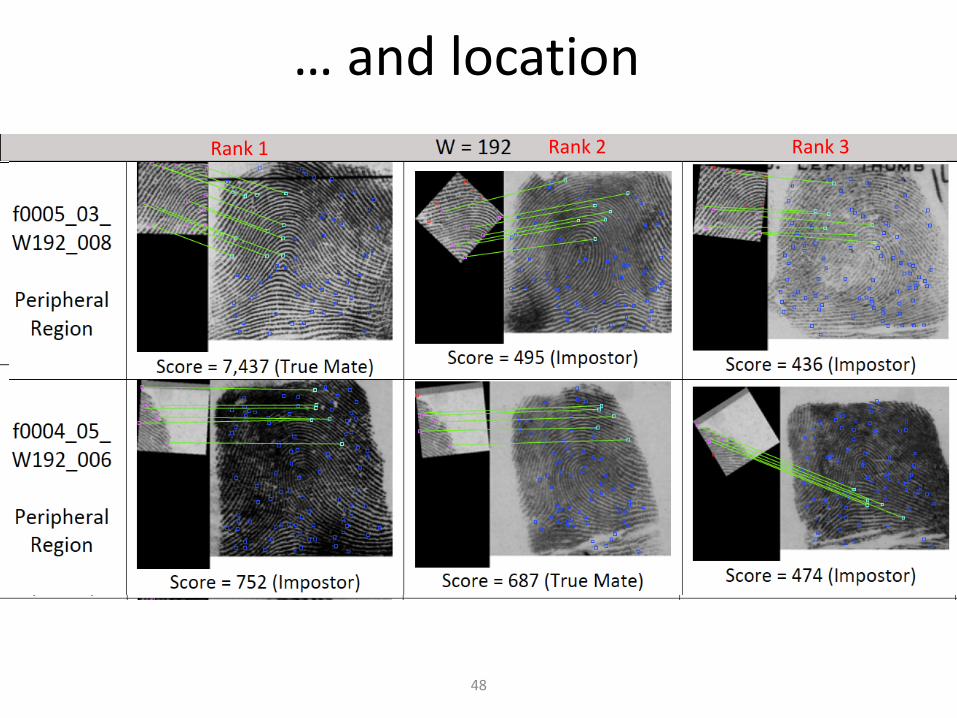
… and locationRank 1 Rank 2 Rank 3
12
48
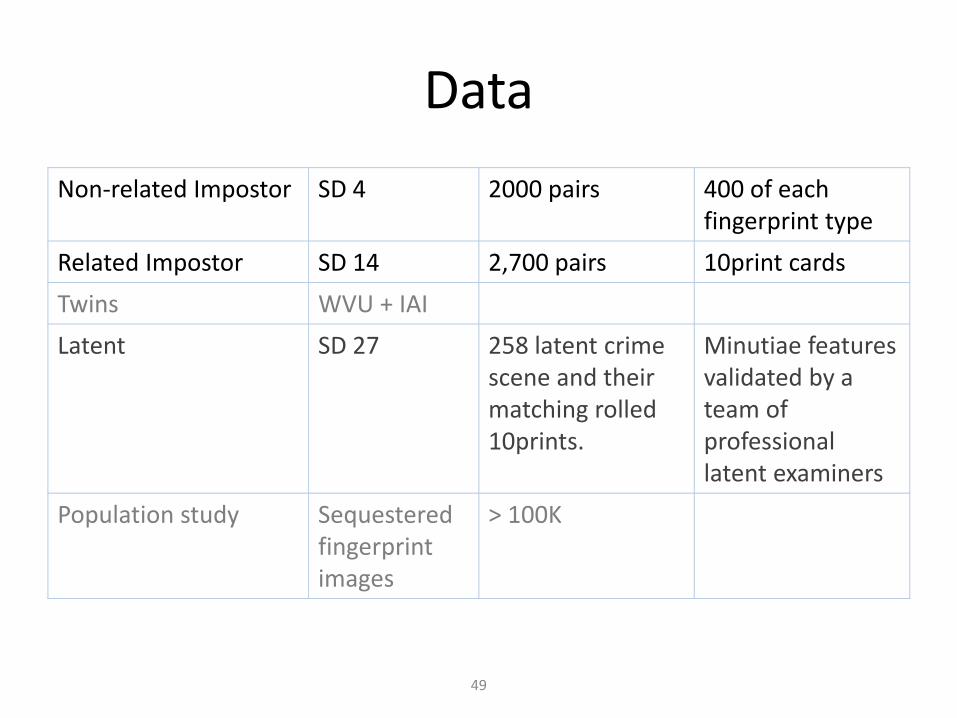
DataNon-related Impostor SD 4 2000 pairs 400 of each
fingerprint typeRelated Impostor SD 14 2,700 pairs 10print cardsTwins WVU + IAILatent SD 27 258 latent crime
scene and their matching rolled 10prints.
Minutiae features validated by a team of professional latent examiners
Population study Sequestered fingerprint images
> 100K
13
49
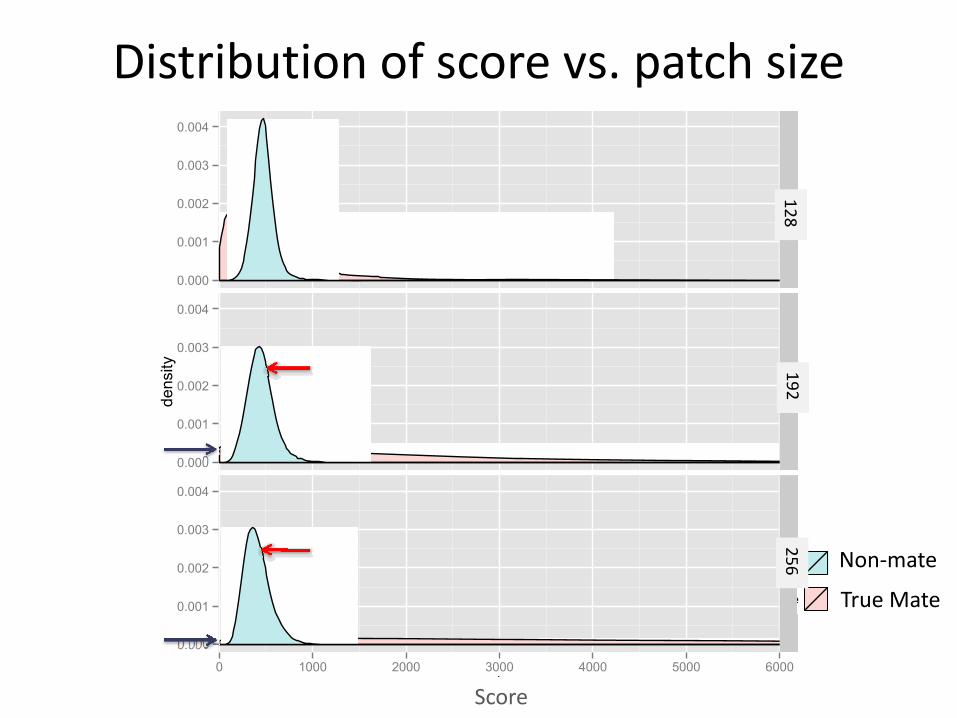
Distribution of score vs. patch size
0.000
0.001
0.002
0.003
0.004
0.000
0.001
0.002
0.003
0.004
0.000
0.001
0.002
0.003
0.004
128192
256
0 1000 2000 3000 4000 5000 6000l
dens
ity
Score
e maximp
e genscore
Non-mate
True Mate
14
128256
192
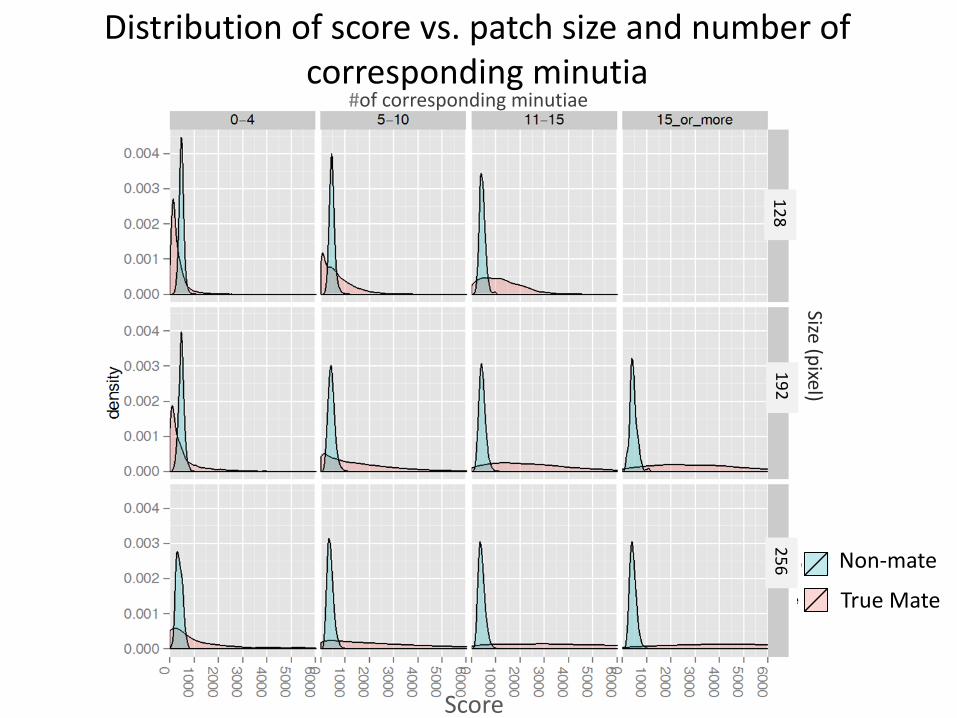
Distribution of score vs. patch size and number of corresponding minutia
Score
maximp
e genscore
Size (pixel)
#of corresponding minutiae
e maximp
e genscore
Non-mate
True Mate
15
128256
192
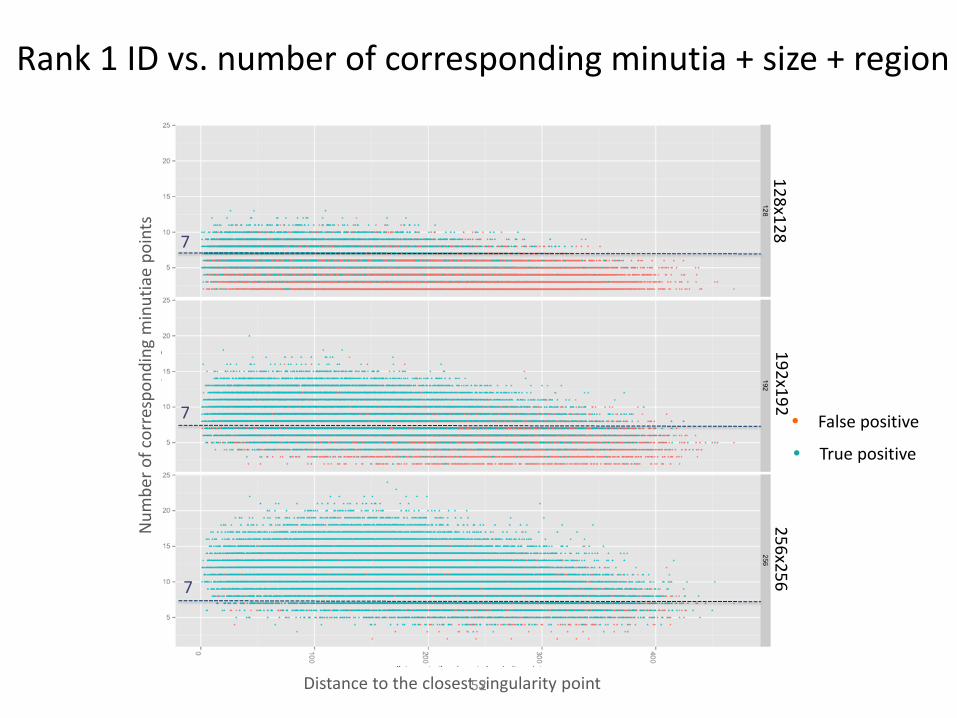
Rank 1 ID vs. number of corresponding minutia + size + region
False positive
True positive
Distance to the closest singularity point
Num
ber o
f cor
resp
ondi
ng m
inut
iae
poin
ts
7
7
7
16
128x128256x256
192x192
52
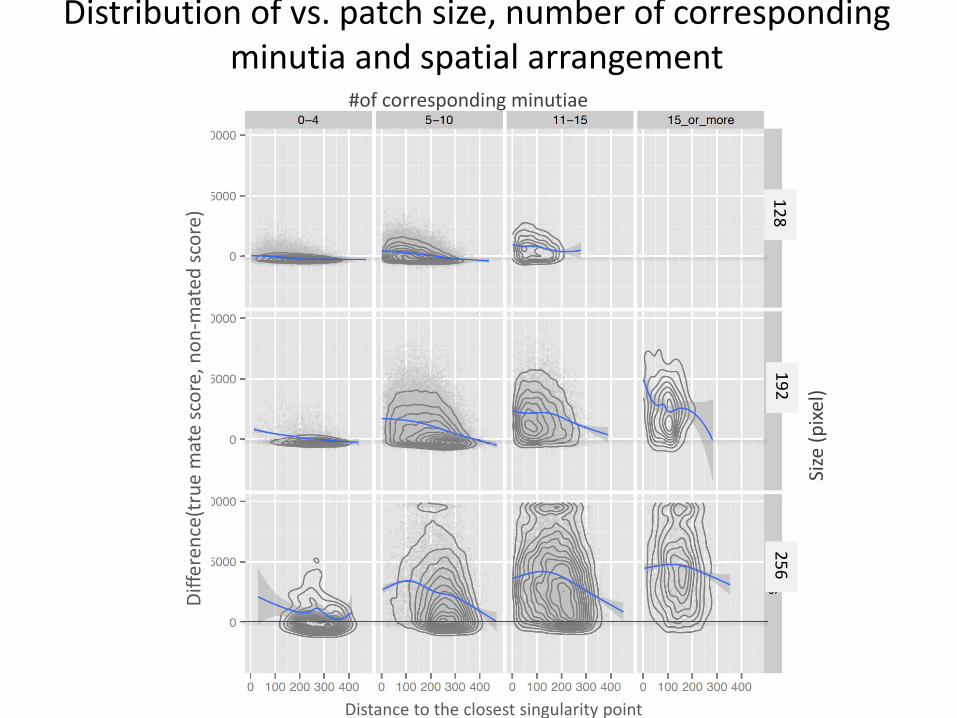
Distribution of vs. patch size, number of corresponding minutia and spatial arrangement
Distance to the closest singularity point
Diffe
renc
e(tr
ue m
ate
scor
e,no
n-m
ated
scor
e)
Size
(pix
el)
#of corresponding minutiae
17
128256
192
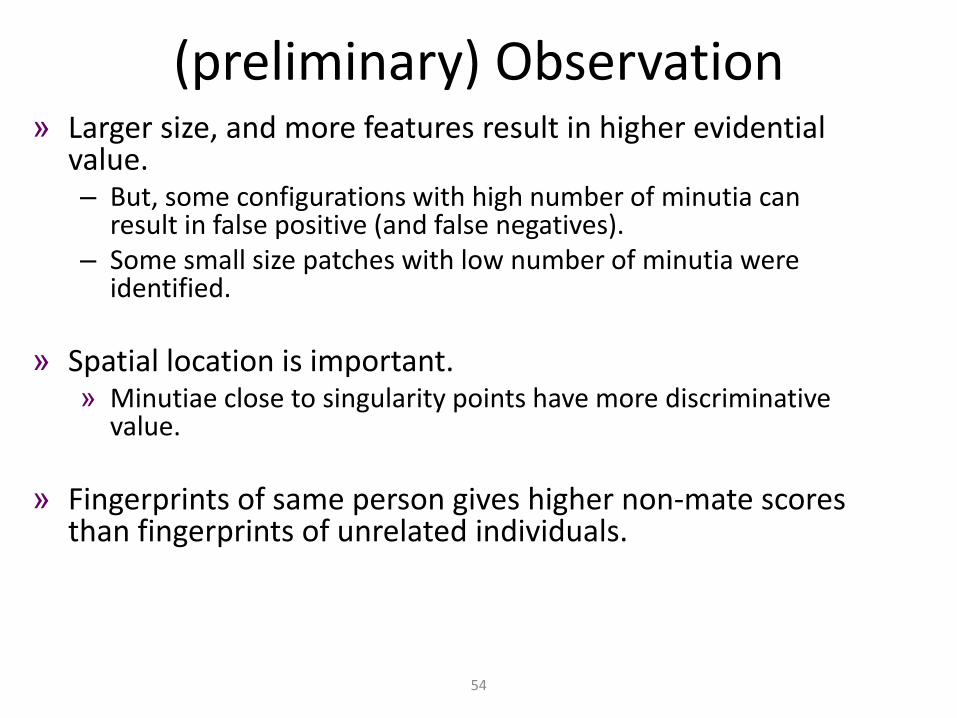
(preliminary) Observation» Larger size, and more features result in higher evidential
value.– But, some configurations with high number of minutia can
result in false positive (and false negatives).– Some small size patches with low number of minutia were
identified.
» Spatial location is important. » Minutiae close to singularity points have more discriminative
value.
» Fingerprints of same person gives higher non-mate scores than fingerprints of unrelated individuals.
18
54
Underway + Future work» Include quality of the exemplar in the model.
− Explore/investigate the existence of biometric zoo.
» Include quality of features in the model.» Develop algorithm to measure discriminating value of the various
ridge formations and clusters of ridge formations- Minutia quality, ridge quality- Rarity of features.
» Use larger dataset, other matching algorithms.» …
19
55
Outcome and ImpactO
UTC
OM
E
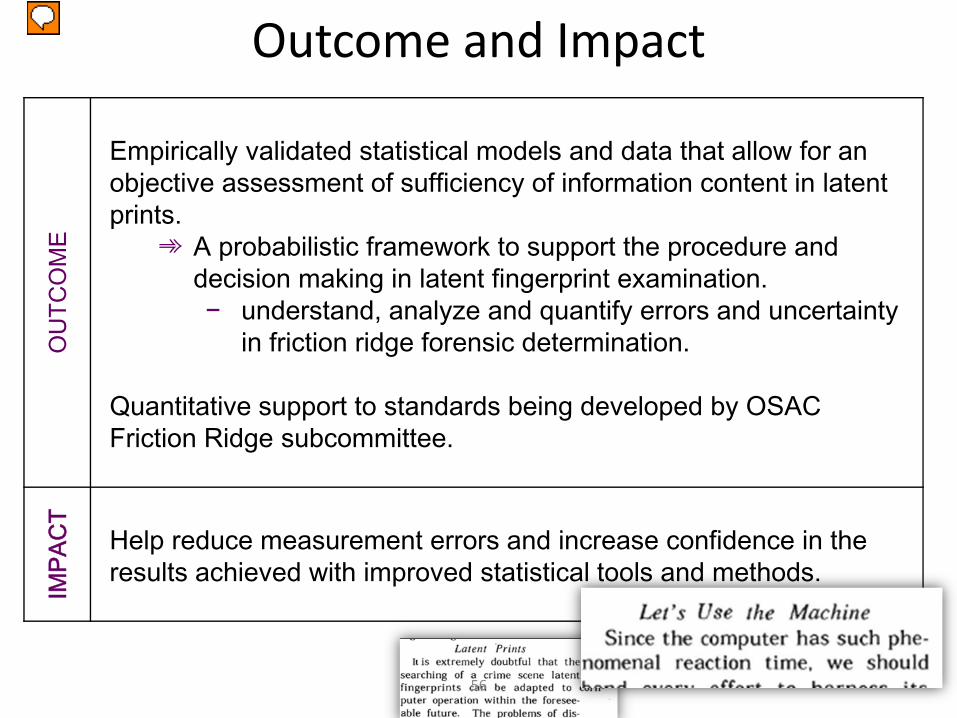
Empirically validated statistical models and data that allow for an objective assessment of sufficiency of information content in latent prints.
➾ A probabilistic framework to support the procedure and decision making in latent fingerprint examination.− understand, analyze and quantify errors and uncertainty
in friction ridge forensic determination.
Quantitative support to standards being developed by OSAC Friction Ridge subcommittee.
IMPA
CT
Help reduce measurement errors and increase confidence in the results achieved with improved statistical tools and methods.
20
56

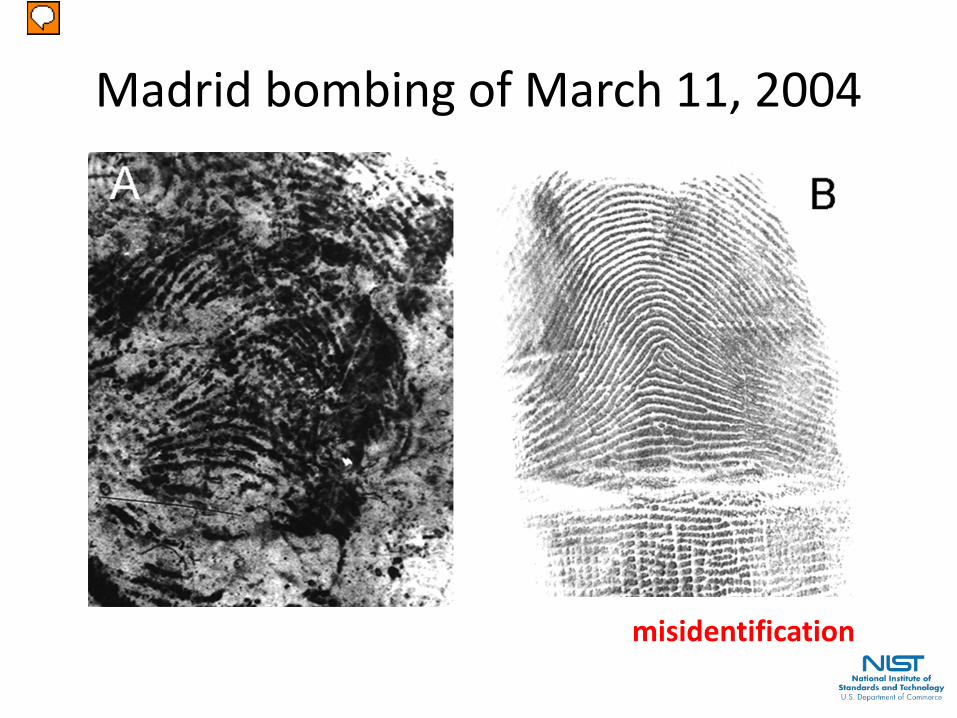
Madrid bombing of March 11, 2004
misidentification
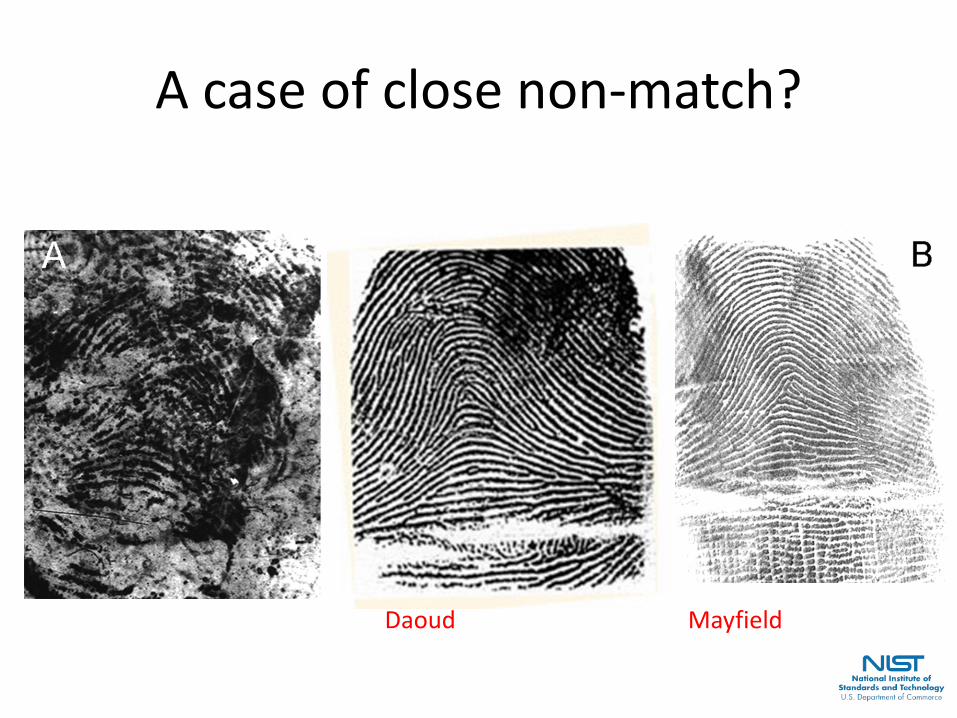
MayfieldDaoud
A case of close non-match?
Sim
on A
. Col
e, M
ore
than
zero
: Acc
ount
ing
for e
rror
in la
tent
fin
gerp
rint i
dent
ifica
tion;
The
jour
nal o
f crim
inal
law
&
crim
inol
ogy,
Vol.
95, N
o. 3
, 200
4.
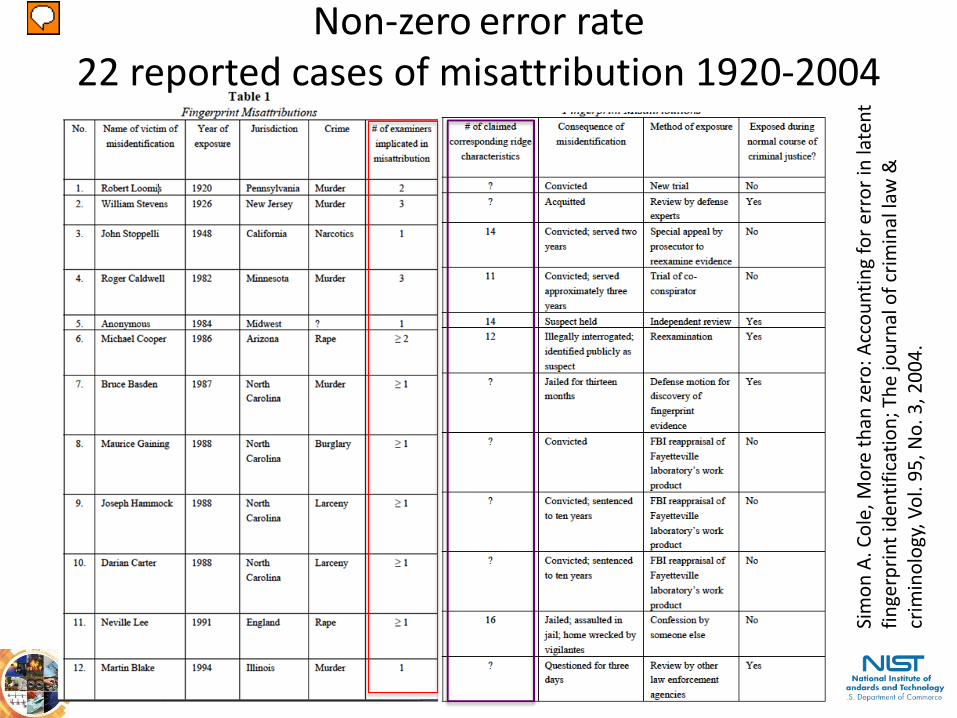
Non-zero error rate 22 reported cases of misattribution 1920-2004
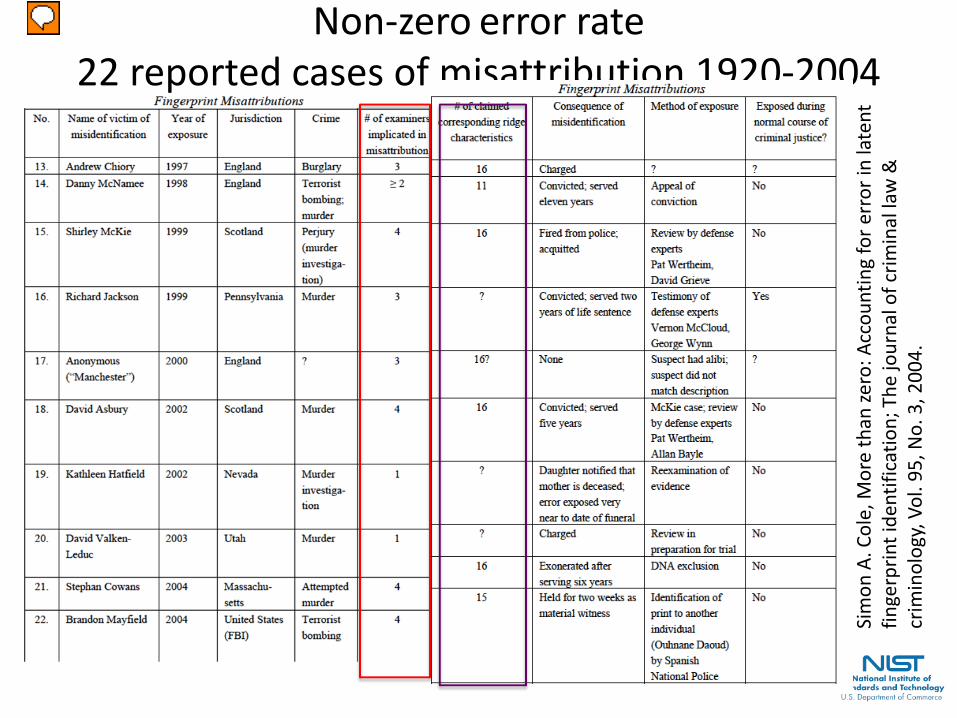
Sim
on A
. Col
e, M
ore
than
zero
: Acc
ount
ing
for e
rror
in la
tent
fin
gerp
rint i
dent
ifica
tion;
The
jour
nal o
f crim
inal
law
&
crim
inol
ogy,
Vol.
95, N
o. 3
, 200
4.
Non-zero error rate 22 reported cases of misattribution 1920-2004