frequency response workgroup consultation v1.0 · frequency response - workgroup consultation 18...
TRANSCRIPT
Frequency Response -
Workgroup Consultation
18 September 2012
Version 1.0
Page 1 of 87
Frequency Response - Workgroup Consultation This workgroup consultation aims to inform parties of the work that the Frequency Response Workgroup has completed and seeks views on the proposals identified by the Workgroup. This is not a Workgroup Report but the content and views provided by parties in response to this consultation will be captured in the Workgroup Report that will be submitted to the Grid Code Review Panel (GCRP).
Published on: 18 September 2012
Length of Consultation: 30 Business Days
Responses by: 30 October 2012
High Impact:
New generators and interconnectors required to provide frequency
response, System Operator
Medium Impact:
Suppliers
Low Impact:
None identified
Workgroup Consultation
Grid Code
Frequency Response -
Workgroup Consultation
18 September 2012
Version 1.0
Page 2 of 87
Contents
Executive Summary................................................................................... 5
Purpose & Scope of Workgroup............................................................... 6
1. Background .............................................................................................6
2. Scope......................................................................................................6
3. Timescales ..............................................................................................7
4. Frequency Response Workgroup ............................................................7
5. Frequency Response Technical Subgroup ..............................................7
Frequency Response Technical Requirements ...................................... 8
2. Background .............................................................................................8
3. Initial Discussion......................................................................................9
4. Conclusions...........................................................................................11
5. Recommendations.................................................................................14
Frequency Response Commercial Arrangements................................ 16
1. Current Frequency Response Services .................................................16
2. Workgroup Discussions.........................................................................20
3. Option A - Minimum capability obligation which is tradable with other
providers ...............................................................................................22
4. Option B - Grid Code Obligation with the Ability to Share Obligation On-
site ........................................................................................................25
5. Option C - Minimum capability obligation which is based on company
portfolio .................................................................................................27
6. Option D - Minimum capability obligation which is based on generating
technology.............................................................................................28
7. Option E - Minimum capability obligation which is supported with
incentives ..............................................................................................29
8. Option F - System Operator provides response.....................................30
9. Option G - Day Ahead Auction ..............................................................32
10. Option H - Minimum obligation for Supplier............................................36
11. European Network Codes......................................................................37
Consultation Responses & Next Steps.................................................. 39
1. Consultation Responses........................................................................39
2. Next Steps.............................................................................................41
Any Questions?
Contact:
Thomas Derry
Code Administrator
Thomas.Derry
@nationalgrid.com
01926 654 208
Proposer:
Frequency Response
Workgroup
Frequency Response -
Workgroup Consultation
18 September 2012
Version 1.0
Page 3 of 87
Annex 1 - FR Workgroup Terms of Reference ...................................... 42
Annex 2 - Future Frequency Response Services.................................. 45
Annex 3 - FR Technical Subgroup Terms of Reference ....................... 60
Annex 4 - Frequency Response Technical Subgroup Report.............. 61
1. Background ...........................................................................................61
2. Initial Discussion....................................................................................61
3. Generation and Demand Scenarios.......................................................64
4. System Models to assess Frequency Response Requirements.............66
5. Evaluating Primary Response Requirements.........................................67
6. Sensitivity to Primary Response Assumptions .......................................68
7. Frequency Response Erosion ...............................................................69
8. Response Requirements .......................................................................70
9. High Frequency Response Requirements .............................................75
10. Impact of Varying Primary Response Timescales..................................76
11. Manufacturer Feedback.........................................................................77
12. Conclusions...........................................................................................78
13. Recommendations.................................................................................80
Annex 5 - Controller Descriptions.......................................................... 82
Annex 6 - Generation Scenarios............................................................. 85
Annex 7 - Draft legal text for Fast Frequency Response...................... 86

Frequency Response -
Workgroup Consultation
18 September 2012
Version 1.0
Page 4 of 87
About this document
This document contains a summary of the discussions and findings of the
Frequency Response Workgroup. It also seeks industry views on the proposals
that have been developed to date.
Following the conclusion of this consultation, the Workgroup will review the
responses along with finalising a report which will be submitted to the Grid Code
Review Panel to take account of in formulating the next steps in this area.
The Workgroup would also like to invite interested parties to join the Frequency
Response Workgroup to support further discussion and analysis. If you are
interested in joining the Workgroup please contact:
Thomas Derry
Document Control
Version Date Author Change Reference
0.1 23 February 2012 National Grid Draft Workgroup
Consultation
0.2 01 March 2012 National Grid Draft Workgroup
Consultation incorporating
Workgroup comments
0.3 05 April 2012 National Grid Draft Workgroup
Consultation incorporating
Workgroup comments
0.4 09 May 2012 National Grid Draft Workgroup
Consultation incorporating
Workgroup comments
0.5 07 June 2012 National Grid Draft Workgroup
Consultation incorporating
Workgroup comments
1.0 18 September 2012 National Grid Final Workgroup
Consultation
Frequency Response -
Workgroup Consultation
18 September 2012
Version 1.0
Page 5 of 87
Executive Summary
1.1 The Frequency Response Workgroup was established to examine and make recommendations for the future provision of frequency response, taking account of system security requirements and with the aim of delivering an efficient solution for the industry as a whole.
1.2 Since the Workgroup was established in 2008, there have been 21 Workgroup meetings up to the publication of this document. Over that time a number of commercial arrangements and technical requirements have been discussed and analysed by the Workgroup.
1.3 To assess issues associated with meeting the requirements for frequency response arising from significant changes to the generation background, a Frequency Response Technical Subgroup (FRTSG) was established in November 2010. The aim of the FRTSG which was to complement and extend the technical work initiated by Frequency Response Workgroup (a joint BSSG and GCRP Workgroup), and in particular investigate issues such as the ability of variable speed wind turbines to contribute to system inertia against a likely future generation background.
1.4 Alongside the work undertaken by the FRTSG, the Frequency Response Workgroup developed a number of commercial arrangements which aim to improve the provision of frequency response services.
1.5 This consultation document has been published by the Frequency Response Workgroup to highlight the discussions had to date and to seek industry views on the technical and commercial options developed.
1.6 If you would like to make a response to this Workgroup Consultation please use the proforma and return your response to [email protected] by 30 October 2012. Further information is available under the section ‘Consultation Responses’ contained within this report.
1.7 A copy of the consultation proforma can be found at:
http://www.nationalgrid.com/uk/Electricity/Codes/gridcode/consultationpape
rs/
Frequency Response -
Workgroup Consultation
18 September 2012
Version 1.0
Page 6 of 87
Purpose & Scope of Workgroup
1. Background
1.1 At the May 2008 Grid Code Review Panel (GCRP), National Grid presented paper pp08/20 which proposed that a Workgroup was established to examine and make recommendations for arrangements for the provision of frequency response, taking account of system needs and overall efficiency.
1.2 The GCRP agreed that a joint CUSC and Grid Code Workgroup should be established and, following the first Workgroup meeting on 22 October 2008, the Terms of Reference were approved by the GCRP. It was agreed that the Workgroup would report to the Balancing Services Standing Group (BSSG), a standing group under the CUSC.
1.3 The joint BSSG/Grid Code Workgroup would be tasked with reviewing the technical requirements and commercial mechanisms applicable to the provision of frequency response, given the current generation mix and the anticipated changes in generation technologies.
1.4 A copy of the Terms of Reference is available in Annex 1.
2. Scope
2.1 The Terms of Reference underwent a number of alterations over the time, agreed by the GCRP, that the Workgroup has been established. The current scope of the Workgroup is:
(i) examine the appropriateness of the existing Grid Code obligations and commercial mechanism for frequency response to the current and predicted future generation mix – including offshore generation;
(ii) identify feasible options that will maintain the security of the National Electricity Transmission System following frequency deviations (inclusive of islanding scenarios), taking account of the characteristics of the current and next generation of power stations e.g. nuclear, supercritical coal, wind etc and the potential for demand management;
(iii) identify and quantify the advantages and disadvantages of each option;
(iv) identify all the impacts of each option on the Grid Code, CUSC and any other associated documents within the framework;
(v) agree and recommend a preferred option;
(vi) draft any text modifications necessary to implement the recommendation;
(vii) monitor the progress of the National Electricity Transmission System SQSS review and take into account any impact on the frequency reserve holding requirement arising from its recommendations.
(viii) consider frequency response provisions of any other comparable electricity networks worldwide
(Ix) Consider the interaction with the ongoing development of the European Network Codes.
Frequency Response -
Workgroup Consultation
18 September 2012
Version 1.0
Page 7 of 87
3. Timescales
3.1 It was originally agreed that the Workgroup would report its findings and recommendations to the November 2009 GCRP. As the issues around frequency response were investigated and studies conducted the original timeframe has been reviewed and agreed to allow further work to be undertaken.
3.2 It was agreed at the January 2012 GCRP that the Workgroup would report back to the November 2012 GCRP. This revised timescale was agreed to allow the Workgroup to conduct an industry consultation on the discussions and findings of the Workgroup to date.
4. Frequency Response Workgroup
4.1 Following agreement from the GCRP to establish the Frequency Response Workgroup in May 2008, the first Workgroup meeting was held on 22 October 2008.
4.2 Since the Workgroup was established in 2008, there have been 21 Workgroup meetings up to the publication of this document. Over that time a number of commercial arrangements and technical requirements have been discussed and analysed by the Workgroup.
4.3 Due to the wide ranging discussions that have taken place, the technical requirements and commercial arrangements each have their own chapter within this consultation.
5. Frequency Response Technical Subgroup
5.1 In September 2010, National Grid presented paper pp10/21 to the Grid Code Review Panel (GCRP) entitled “Future Frequency Response Services”. This paper summarised the issues associated with meeting the requirements for frequency response arising from significant changes to the generation background. A copy of this paper can be found in Annex 2.
5.2 In October 2010, the Frequency Response Workgroup discussed the establishment of a Frequency Response Technical Subgroup (FRTSG) which would develop recommendations to address the issues discussed in paper pp10/21 submitted to the GCRP.
5.3 In November 2010, the FRTSG was established to complement and extend the technical work initiated by Frequency Response Workgroup, and in particular investigate issues such as the ability of variable speed wind turbines to contribute to system inertia against a likely future generation background. The Terms of Reference for the FRTSG can be found in Annex 3.
5.4 The FRTSG had 7 meetings and during that time the Frequency Response Workgroup held limited meetings until the publication of the Technical Subgroup conclusions.
5.5 The FRTSG published their conclusions in December 2011. A copy of the Technical Subgroup conclusions can be found in Annex 4.
Timeline
Frequency Response
Workgroup Meetings
M1 - 22 October 2008
M2 - 29 January 2009
M3 - 30 March 2009
M4 - 03 July 2009
M5 - 01 September 2009
M6 - 27 October 2009
M7 - 02 December 2009
M8 - 15 February 2010
M9 - 28 April 2010
M10 - 01 June 2010
M11 - 08 July 2010
M12 - 13 August 2010
M13 - 10 September 2010
M14 - 14 October 2010
M15 - 20 December 2010
M16 - 04 March 2011
M17 - 12 September 2011
M18 - 13 January 2012
M19 - 01 March 2012
M20 - 05 April 2012
M21 - 09 May 2012
Frequency Response
Technical Subgroup
Meetings
M1 - 15 November 2010
M2 - 03 December 2010
M3 - 13 January 2011
M4 - 28 March 2011
M5 - 05 August 2011
M6 - 13 October 2011
M7 - 07 November 2011
Frequency Response -
Workgroup Consultation
18 September 2012
Version 1.0
Page 8 of 87
Frequency Response Technical Requirements
1.1 This chapter contains a summary of the discussion, analysis and conclusions of the FRTSG.
1.2 The Terms of Reference for the FRTSG can be found in Annex 3 and copy of the Technical Subgroup Report can be found in Annex 4.
2. Background
2.1 A major element of this study work is to establish the effect on system frequency of the increasing volume of variable speed wind turbines and HVDC Converter technology. Whilst these issues are now well known, and set out in the ‘Future Frequency Response Requirements’ paper (Annex 2), it is worth briefly summarising the potential concerns.
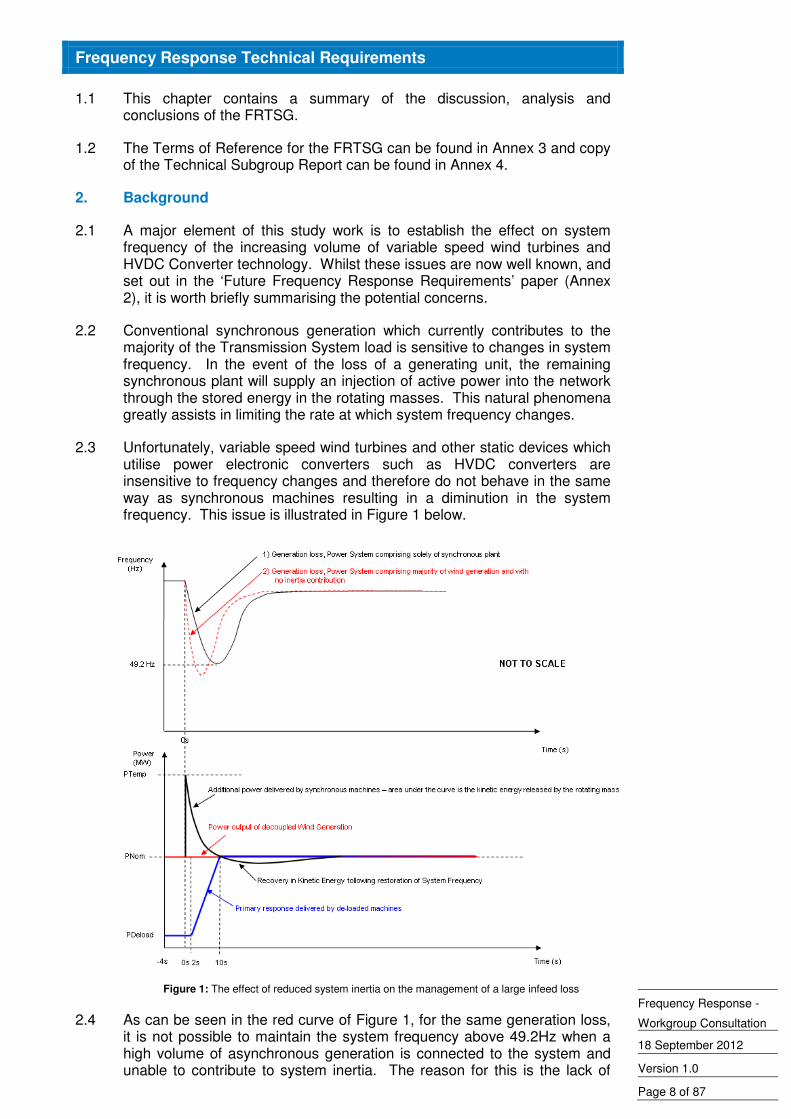
2.2 Conventional synchronous generation which currently contributes to the majority of the Transmission System load is sensitive to changes in system frequency. In the event of the loss of a generating unit, the remaining synchronous plant will supply an injection of active power into the network through the stored energy in the rotating masses. This natural phenomena greatly assists in limiting the rate at which system frequency changes.
2.3 Unfortunately, variable speed wind turbines and other static devices which utilise power electronic converters such as HVDC converters are insensitive to frequency changes and therefore do not behave in the same way as synchronous machines resulting in a diminution in the system frequency. This issue is illustrated in Figure 1 below.
Figure 1: The effect of reduced system inertia on the management of a large infeed loss
2.4 As can be seen in the red curve of Figure 1, for the same generation loss, it is not possible to maintain the system frequency above 49.2Hz when a high volume of asynchronous generation is connected to the system and unable to contribute to system inertia. The reason for this is the lack of
Frequency Response -
Workgroup Consultation
18 September 2012
Version 1.0
Page 9 of 87
Active Power (shown by the red line) injected from the asynchronous generation as shown in the lower of the two graphs in Figure 1.
3. Initial Discussion
3.1 The discussions focussed on two approaches to managing large frequency deviations on systems where a lack of 'natural' inertia means that the system frequency may not be contained within statutory and technical limits.
3.2 The first approach considered was to investigate the option of equipping variable speed wind turbines and other asynchronous sources with a ‘synthetic inertia’ capability. This capability has the potential to improve frequency control without needing to curtail the power output of the wind turbine generating units prefault. This option was investigated at length and detailed discussions were held with a number of the major wind turbine manufacturers.
3.3 A number of manufacturers have indicated an ability to provide a synthetic inertia capability and have published papers and information on their capabilities - see references [1] – [4] in Annex 5. These controllers aim to inject power to the network in a similar way to that of a synchronous machine, but through controlled action.
3.4 As part of an effective control strategy, it is important to ensure sufficient active power is injected into the network to balance the loss of generation. Clearly too much active power injected into the network could result in temporary over frequencies occurring before governor action provides adequate downward regulation. For example, with a loss of generation of less than 300MW, only a small amount of active power would be required where as a larger injection would be required for the maximum loss of 1,800MW.
3.5 A good measure of the required level of active power injection can be obtained from a measure of the rate of change of system frequency (df/dt) (ie the smaller the value of df/dt the lower the initial injection of active power required).
3.6 National Grid modelled two controllers both using df/dt functionality. One was based on an initial injection and fixed decay based on the rate of change of system frequency. The second was based on a continuously acting df/dt controller which would operate throughout the entire disturbance, and in doing so regulating the active power injection to the network continuously. Based on the results, both controllers were able to inject sufficient active power to the network to ensure the maintenance of system frequency above Security and Quality of Supply Standards (SQSS) limits. These are described in more detail in Annex 5.
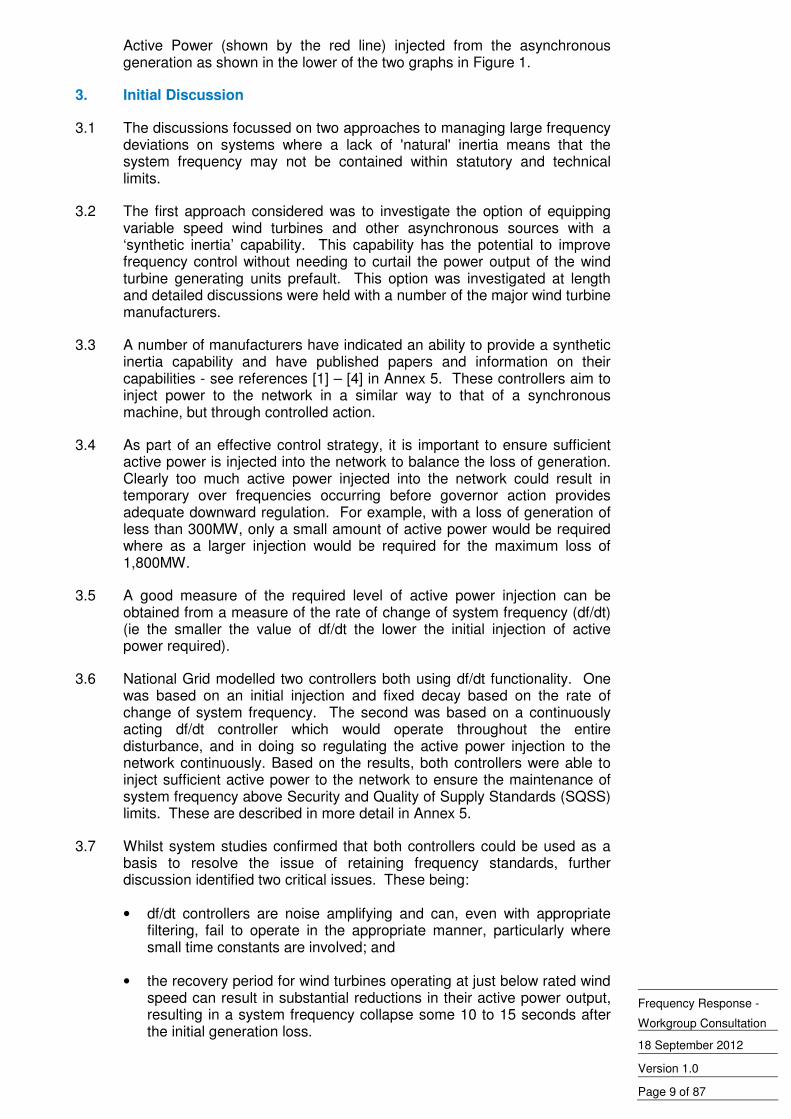
3.7 Whilst system studies confirmed that both controllers could be used as a basis to resolve the issue of retaining frequency standards, further discussion identified two critical issues. These being:
• df/dt controllers are noise amplifying and can, even with appropriate filtering, fail to operate in the appropriate manner, particularly where small time constants are involved; and
• the recovery period for wind turbines operating at just below rated wind speed can result in substantial reductions in their active power output, resulting in a system frequency collapse some 10 to 15 seconds after the initial generation loss.
Frequency Response -
Workgroup Consultation
18 September 2012
Version 1.0
Page 10 of 87
3.8 With regard to the df/dt issue, National Grid held extensive discussions with manufactures to examine the df/dt controller and how it could be improved. National Grid amended their own models and identified that even with slower response times the controller could still aid frequency containment.
3.9 It was also suggested that the controller should not only rely on a df/dt input but should also incorporate a frequency trigger. Consideration was also given to a simple 'one-shot' control which would deliver a fixed volume of energy with a defined ramp and decay period when frequency reached a pre-defined setting.
3.10 A benefit of the 'one-shot' control is that it is less complex than a df/dt trigger. However, it wouldn’t adapt to a specific frequency event after the initial frequency disturbance, potentially resulting in an uncontrolled response.
3.11 With regard to recovery periods, concerns were raised relating to the potential reduction in power output from wind turbines following the provision of increased active power output in response to a frequency fall.
3.12 A variable speed wind turbine relies on operating at the optimum power output for a given wind speed to extract the maximum available power from the wind. This is a complex non linear function and becomes a significant issue when the wind turbine is operating just below rated wind speed. In the event that the wind turbines are operating at just below their rated wind speed and activation of the synthetic inertia control is required, then once the additional active power has been injected into the network, the recovery period can result in a drop in power output of up to 30% of its pre fault output, resulting in a frequency collapse after the event.
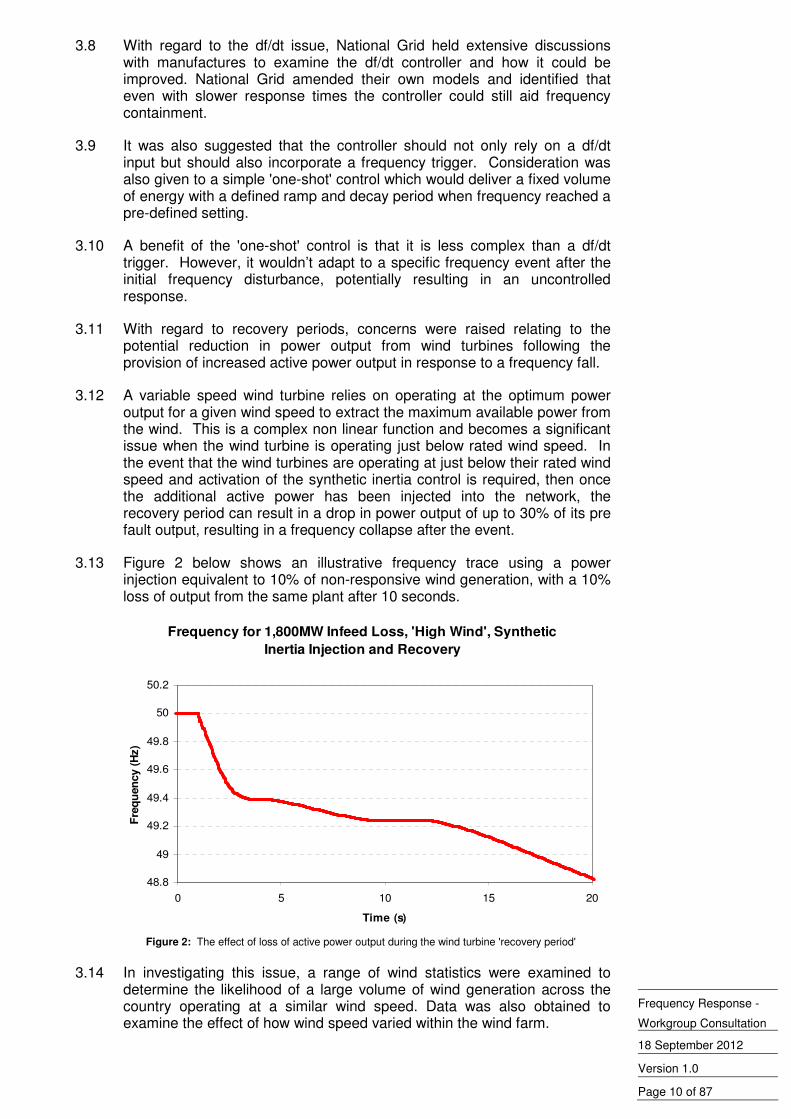
3.13 Figure 2 below shows an illustrative frequency trace using a power injection equivalent to 10% of non-responsive wind generation, with a 10% loss of output from the same plant after 10 seconds.
Frequency for 1,800MW Infeed Loss, 'High Wind', Synthetic
Inertia Injection and Recovery
48.8
49
49.2
49.4
49.6
49.8
50
50.2
0 5 10 15 20
Time (s)
Fre
qu
en
cy (
Hz)
Figure 2: The effect of loss of active power output during the wind turbine 'recovery period'
3.14 In investigating this issue, a range of wind statistics were examined to determine the likelihood of a large volume of wind generation across the country operating at a similar wind speed. Data was also obtained to examine the effect of how wind speed varied within the wind farm.
Frequency Response -
Workgroup Consultation
18 September 2012
Version 1.0
Page 11 of 87
3.15 The results of this analysis demonstrated that there was potentially a serious risk that a significant volume of geographically dispersed generation could be operating at a similar wind speed. The only guaranteed solution to this would be for the wind generation to be curtailed pre-fault, reducing the rate at which emission savings can be delivered.
3.16 An alternative approach to a synthetic inertia requirement would be to consider a method of rapidly injecting active power into the system following the loss of a generating unit by adopting a conventional proportional governor control.
3.17 This second approach was investigated using a response characteristic on frequency responsive wind generation that provided full primary frequency response within 5 seconds, being sustained for a further 25 seconds, rather than the current Grid Code requirement of delivery in 10 seconds and sustainable for a further 20 seconds.
3.18 The results of these studies demonstrated that the system frequency deviations could also be contained when ‘Fast Frequency Response’ was installed and that significant reductions in response requirements could also be achieved.
3.19 Discussions also highlighted concerns over the ability to deliver a synthetic inertia capability and conventional Primary Response from the same machines at the same time. It is therefore necessary to consider the likely generation patterns more carefully to check whether there is a sufficient amount of synthetic inertia capable plant which isn’t already required to manage system frequency in Primary and Secondary response timescales.
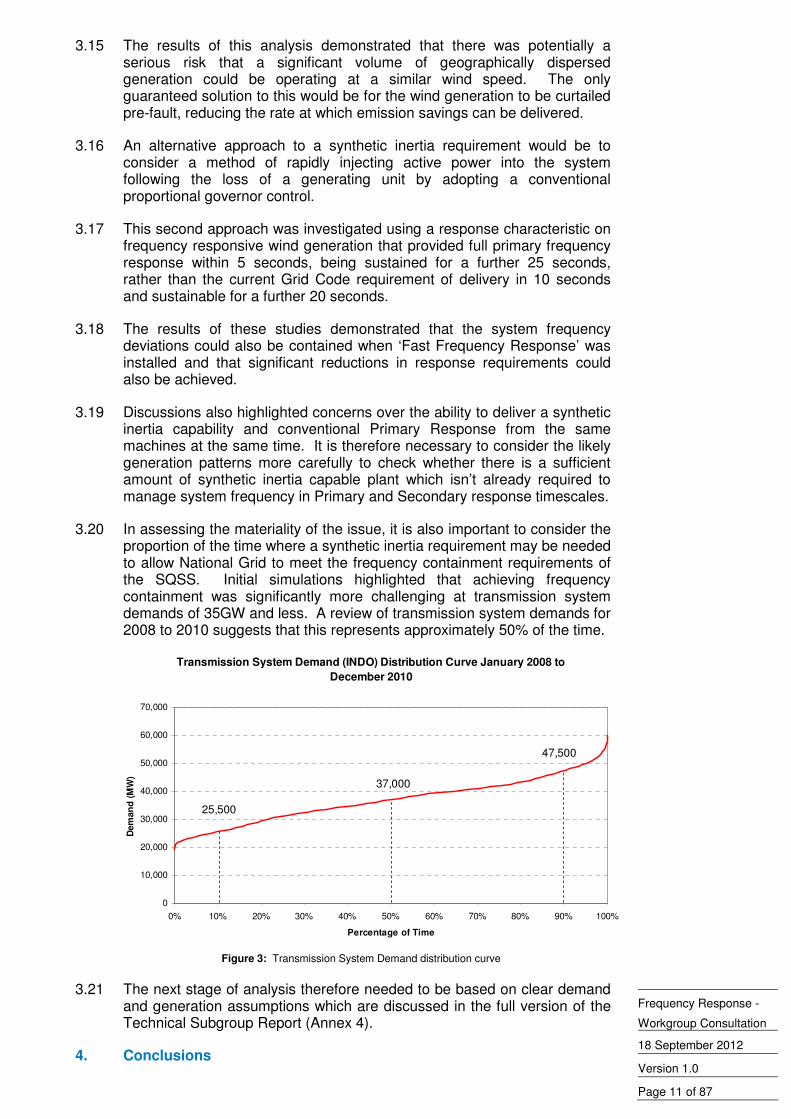
3.20 In assessing the materiality of the issue, it is also important to consider the proportion of the time where a synthetic inertia requirement may be needed to allow National Grid to meet the frequency containment requirements of the SQSS. Initial simulations highlighted that achieving frequency containment was significantly more challenging at transmission system demands of 35GW and less. A review of transmission system demands for 2008 to 2010 suggests that this represents approximately 50% of the time.
Transmission System Demand (INDO) Distribution Curve January 2008 to
December 2010
47,500
37,000
25,500
0
10,000
20,000
30,000
40,000
50,000
60,000
70,000
0% 10% 20% 30% 40% 50% 60% 70% 80% 90% 100%
Percentage of Time
Dem
an
d (
MW
)
Figure 3: Transmission System Demand distribution curve
3.21 The next stage of analysis therefore needed to be based on clear demand and generation assumptions which are discussed in the full version of the Technical Subgroup Report (Annex 4).
4. Conclusions
Frequency Response -
Workgroup Consultation
18 September 2012
Version 1.0
Page 12 of 87
4.1 In order to manage the Transmission System in the future and ensure system frequency can be managed to the criteria set out in the SQSS, there will be a requirement to mitigate the reduced contribution to system inertia from decoupled generation plants such as variable speed wind turbines and other static plant such as HVDC Converters.
4.2 The following conclusions were drawn from National Grid's simulations based on a 'Gone Green' generation scenario for the year 2020:
• A supplementary frequency control facility can deliver significant benefits in managing the 1,800MW and 1,320MW infeed risk at system demand levels of 35GW and below under all but "Low Wind" conditions.
• The measures needed to ensure compliance with the SQSS, and avoid impacting on system security, become more severe and more significant in volume as system demand, and the capacity of any synchronous generation meeting it, decreases;
• Additional low frequency relay triggered demand response was required as well as supplementary frequency control capability to achieve frequency containment at system demands of 20GW under 'High Wind' conditions;
• These factors suggest that both a supplementary frequency control capability and alternative actions will be required to ensure frequency containment can be achieved at demands of less than 25GW. Further alternative actions include:
(1) Curtailment of the largest infeed loss; and
(2) Additional balancing actions, such as:
(2a) curtailment of interconnectors or inflexible plant;
(2b) displacement using plant with additional response capability;
(2c) fast acting low frequency relay triggered response; and
(2d) addition of inertia, by 'low load operation' on synchronous generation for example.
4.3 It should be noted that the simulations were based on an interconnector position of 'float' (ie no import/export) and that any net interconnector import has the effect of displacing synchronous plant. There is currently 3.5 GW of interconnector capacity on the transmission system, a variability of 7GW. It should however be noted that the volume of interconnections to Great Britain may increase in the future.
4.4 A number of supplementary frequency control capability options were investigated, including a pure 'df/dt' driven fast acting control on un-curtailed asynchronous plant which is intended to mimic the inertia capability of a synchronous machine. This form of control provides an ideal solution, as it helps solve the frequency control problem without the need to curtail wind. However, there are a number of issues associated with it:
• any control system will incorporate a processing delay which needs to be limited to ensure the desired effect is achieved;
Frequency Response -
Workgroup Consultation
18 September 2012
Version 1.0
Page 13 of 87
• Rate of Change of Frequency (RoCoF) as an input parameter is inherently noise amplifying leading to unpredictability of response;
• care needs to be taken not to extract too much energy from wind turbines as this can lead to an extended and detrimental recovery period, particularly at specific points on the wind turbine operating curve. This leads to some uncertainty over the volume and timescales of energy available; and
• discussions suggest that wind based Power Park Modules will find it difficult to deliver both a 'df/dt' driven fast acting control and Primary Response consecutively with the volumes required. This issue is critical as work to date suggests that both are required under most of the relevant system scenarios.
4.5 Alternative synthetic inertia controllers based on Rate of Change of Frequency, using fixed and variable volumes were investigated. It was demonstrated that these options provided a potential solution to the frequency containment problem, provided that the correct volumes and characteristics could be specified. These would need to be validated for the full range of possible future system conditions.
4.6 Finally, the option of using faster acting proportional frequency control was investigated by taking a conventional Primary Response characteristic and adapting it to deliver response within 5 seconds rather than 10. This characteristic was applied to wind generation which was already curtailed in order to provide conventional Primary Response within the simulations described in the Technical Subgroup Report.
4.7 This faster acting capability had the effect of reducing the Primary Response requirement and hence the need to curtail renewable generation significantly. A benefit of between 400MW and 950MW was observed in the simulations presented in the Technical Subgroup Report. If one assumes that this benefit applies for 10% of the year at an average of 500MW and response price of 30 £/MW/h, a benefit of £13m per year in balancing cost could be attributed to this capability. There would be an additional carbon benefit for the wind curtailment avoided.
4.8 Based on the analysis conducted, it has been concluded by the Technical Subgroup that the single change to response provision that would yield the most significant benefit is through the introduction of a fast primary frequency response capability applicable to all decoupled generation sources which do not naturally provide an inertial contribution.
4.9 Such generating plant should have the capability to provide 10% or more of its registered capacity as primary frequency response which should be delivered linearly over a 5 second period from the inception of the generation loss or load change and an initial delay of no more than 1 second from the inception of the frequency change.
4.10 It is recognised that this specification may present a challenge to technology providers and manufacturers. However, it is believed that this specification is more achievable, at an earlier implementation date, than the df/dt triggered control option discussed above.
4.11 Simulations also showed a high degree of sensitivity to the ramp rate assumptions for Primary Response. It is recommended that these are specified explicitly within the Grid Code by setting out a maximum response delay of 1 second and specifying that response should be delivered linearly up to 10 seconds or 5 seconds as appropriate.
Frequency Response -
Workgroup Consultation
18 September 2012
Version 1.0
Page 14 of 87
4.12 Whilst it is acknowledged that these proposals could resolve the issue for Plant in excess of 50MW, some consideration will still be required as to how this issue will be addressed in respect of Small Embedded Power Stations as this segment of the market is expected to grow in the future.
4.13 The studies have also demonstrated the effect on rate of change of system frequency against a credible set of future generating scenarios. As a conclusion it is seen that this will impact on Embedded Generation, in particular the effect on protection settings. It is therefore suggested that the Technical Subgroup Report is highlighted to the Distribution Code Review Panel for further consideration in respect of Embedded Generation.
4.14 A final point to note is the extent of reliance on wind generation to deliver frequency control in the analysis performed in the Technical Subgroup Report. Operators have little experience of this to date and it may be necessary to revisit the technical and commercial arrangements for the provisions of frequency response for asynchronous generators as more experience is gained.
4.15 Annex 7 contains text which sets out the very high level principles in addressing the need for a fast frequency response in order to address the issue of a diminishing contribution to system inertia from generating plants which are insensitive to changes in system frequency. The text has been drafted in the style of Grid Code change for illustrative purposes only.
5. Recommendations
Faster Frequency Response
5.1 Faster frequency response capability for asynchronous plant delivered within 5 seconds, for low and high frequencies, on users bound by the provisions of the Grid Code allows frequency response volumes to be reduced significantly in the situations analysed in the Frequency Response Technical Subgroup Report.
(a) The value of faster frequency response should be assessed by Frequency Response Workgroup, taking into consideration the costs of implementation and the benefits in reduced curtailment of generation from renewable sources and other balancing costs; and
(b) Subject to this assessment, proposals should be developed for the appropriate obligations and/or market arrangements to ensure sufficient frequency response capability is available to maintain system security for anticipated future generation and demand patterns.
Clearer Primary Response Requirements
5.2 The simulations conducted by the Frequency Response Technical Subgroup have demonstrated the sensitivity of frequency response requirements to the ramping capability of responsive generation. The Grid Code requirements for frequency response should be reviewed with the aim of clarifying the ramping capability required from responsive generation in terms of:
(a) adequacy of information provided on performance; and
(b) the need to stipulate minimum delay times and ramping capability for new providers.
Frequency Response -
Workgroup Consultation
18 September 2012
Version 1.0
Page 15 of 87
Rate of Change of Frequency
5.3 The simulations performed by the Frequency Response Technical Subgroup give some indication to the potential change in the maximum Rate of Change of Frequency settings which needs to be considered in the context of the loss of mains protection deployed on embedded generation.
5.4 Consultation Question 1: Do you agree with the recommendations of the Frequency Response Technical Subgroup?
• Requirement for Faster Frequency Response on asynchronous plant?
• Clearer Primary Response Requirements for synchronous plant?
5.5 Consultation Question 2: Are there any impacts for generator owners that you would like to identify in relation to the recommendations? (e.g. costs, timescales, feasibility)
5.6 Consultation Question 3: Are there any impacts for HVDC Converter owners that you would like to identify in relation to the recommendations? (e.g. costs, timescales, feasibility)
5.7 Consultation Question 4: Are there any impacts for manufacturers that you would like to identify in relation to the recommendations? (e.g. costs, timescales, feasibility)
5.8 Consultation Question 5: Are there any additional comments you would like to make in relation to the frequency response technical requirements section of the consultation?
Frequency Response -
Workgroup Consultation
18 September 2012
Version 1.0
Page 16 of 87
Frequency Response Commercial Arrangements
1. Current Frequency Response Services
1.1 The Workgroup began their examination of the frequency response commercial arrangements by considering the current obligations. These obligations can be found in:
• Statutory obligations1;
• Security and Quality of Supply Standards (SQSS) obligations2;
• Grid Code obligations3; and
• National Grid’s Operational Standards.
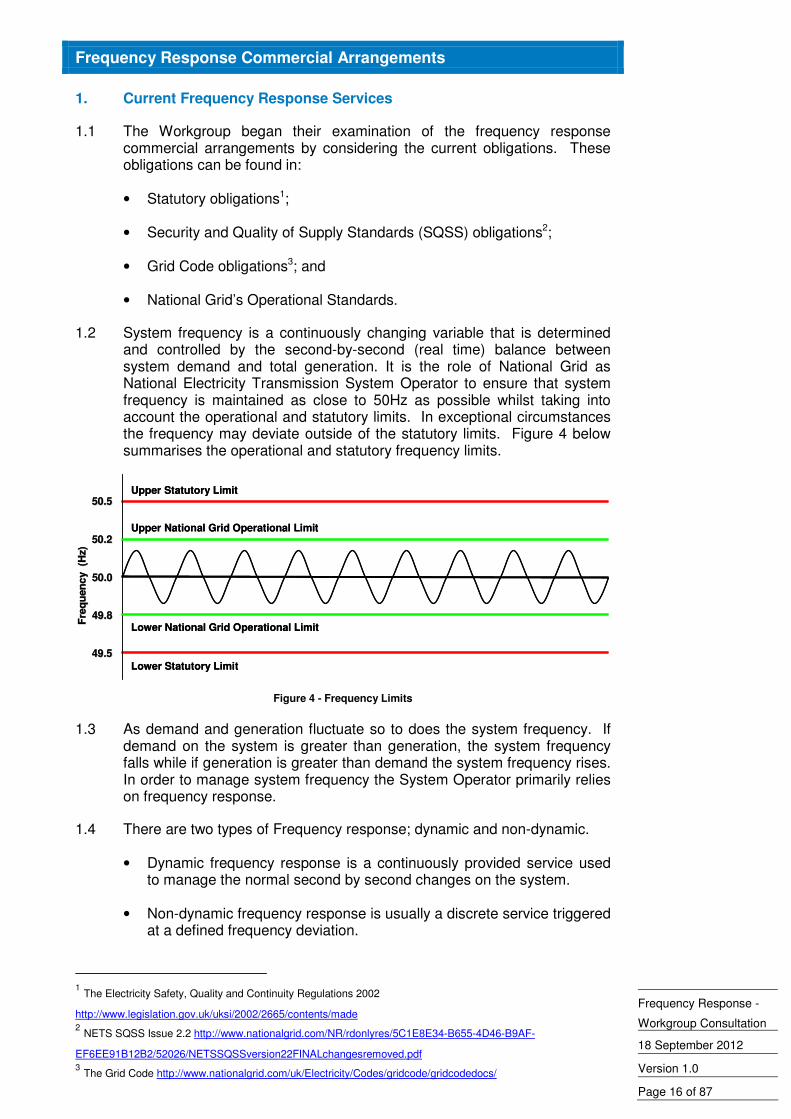
1.2 System frequency is a continuously changing variable that is determined and controlled by the second-by-second (real time) balance between system demand and total generation. It is the role of National Grid as National Electricity Transmission System Operator to ensure that system frequency is maintained as close to 50Hz as possible whilst taking into account the operational and statutory limits. In exceptional circumstances the frequency may deviate outside of the statutory limits. Figure 4 below summarises the operational and statutory frequency limits.
Fre
qu
en
cy
(Hz)
Fre
qu
en
cy
(Hz)
Lower Statutory Limit
Upper Statutory Limit
49.549.5
50.050.0
49.849.8
50.250.2
50.550.5
Upper National Grid Operational Limit
Lower National Grid Operational Limit
Fre
qu
en
cy
(Hz)
Fre
qu
en
cy
(Hz)
Lower Statutory Limit
Upper Statutory Limit
49.549.5
50.050.0
49.849.8
50.250.2
50.550.5
Upper National Grid Operational Limit
Lower National Grid Operational Limit
Figure 4 - Frequency Limits
1.3 As demand and generation fluctuate so to does the system frequency. If demand on the system is greater than generation, the system frequency falls while if generation is greater than demand the system frequency rises. In order to manage system frequency the System Operator primarily relies on frequency response.
1.4 There are two types of Frequency response; dynamic and non-dynamic.
• Dynamic frequency response is a continuously provided service used to manage the normal second by second changes on the system.
• Non-dynamic frequency response is usually a discrete service triggered at a defined frequency deviation.
1 The Electricity Safety, Quality and Continuity Regulations 2002
http://www.legislation.gov.uk/uksi/2002/2665/contents/made 2 NETS SQSS Issue 2.2 http://www.nationalgrid.com/NR/rdonlyres/5C1E8E34-B655-4D46-B9AF-
EF6EE91B12B2/52026/NETSSQSSversion22FINALchangesremoved.pdf 3 The Grid Code http://www.nationalgrid.com/uk/Electricity/Codes/gridcode/gridcodedocs/
Frequency Response -
Workgroup Consultation
18 September 2012
Version 1.0
Page 17 of 87
1.5 Frequency response is procured by National Grid through one of three contract forms:
• Mandatory Frequency Response (MFR);
• Firm Frequency Response (FFR);
• Frequency Control by Demand Management (FCDM).
Mandatory Frequency Response (MFR)
1.6 MFR is an automatic change in active power output in dynamic response to a frequency change and it is an obligation for all generators that meet the requirements of the Grid Code (CC.6.3.7, CC Appendix 3) to have the capability to provide MFR. Having the ‘capability’ to provide frequency response refers to the ability to provide frequency response without the physical delivery of energy whereas ‘delivery’ is the physical delivery of energy on to the National Electricity Transmission System (NETS) used for frequency response.
1.7 The capability to provide MFR is a condition of connection for generators connecting to the NETS. MFR is not applicable for non-Balancing Mechanism Unit (BMU) or demand providers.
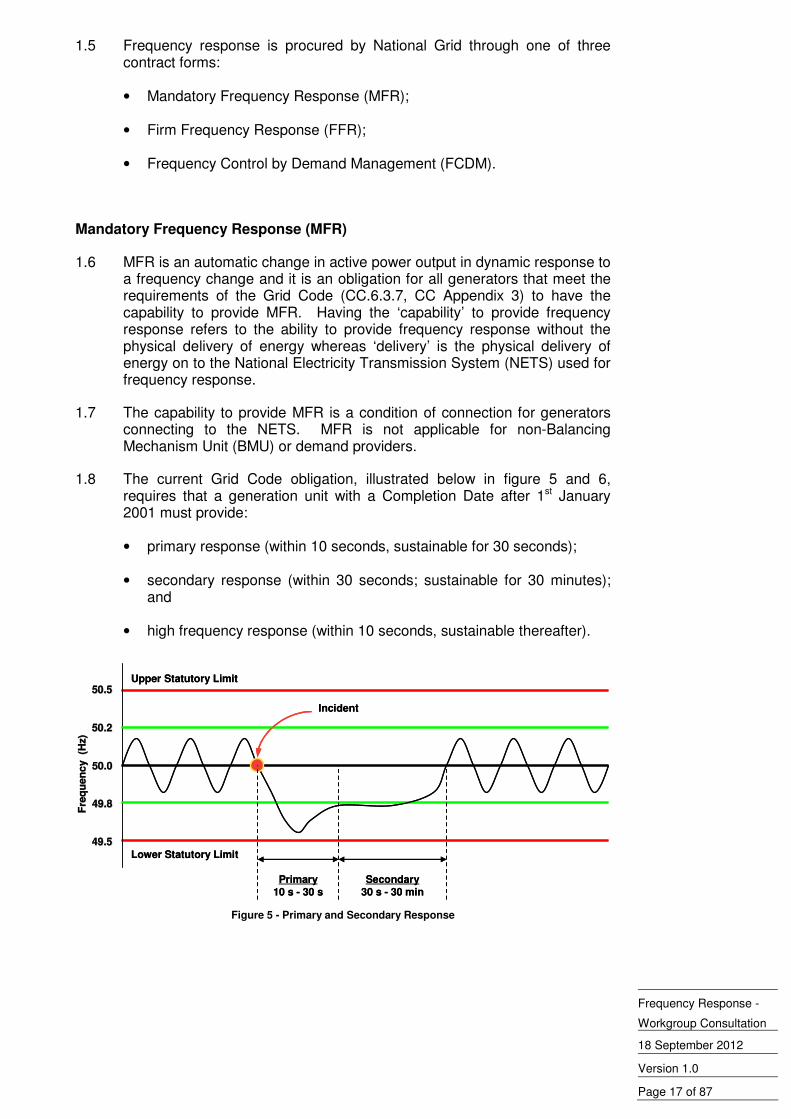
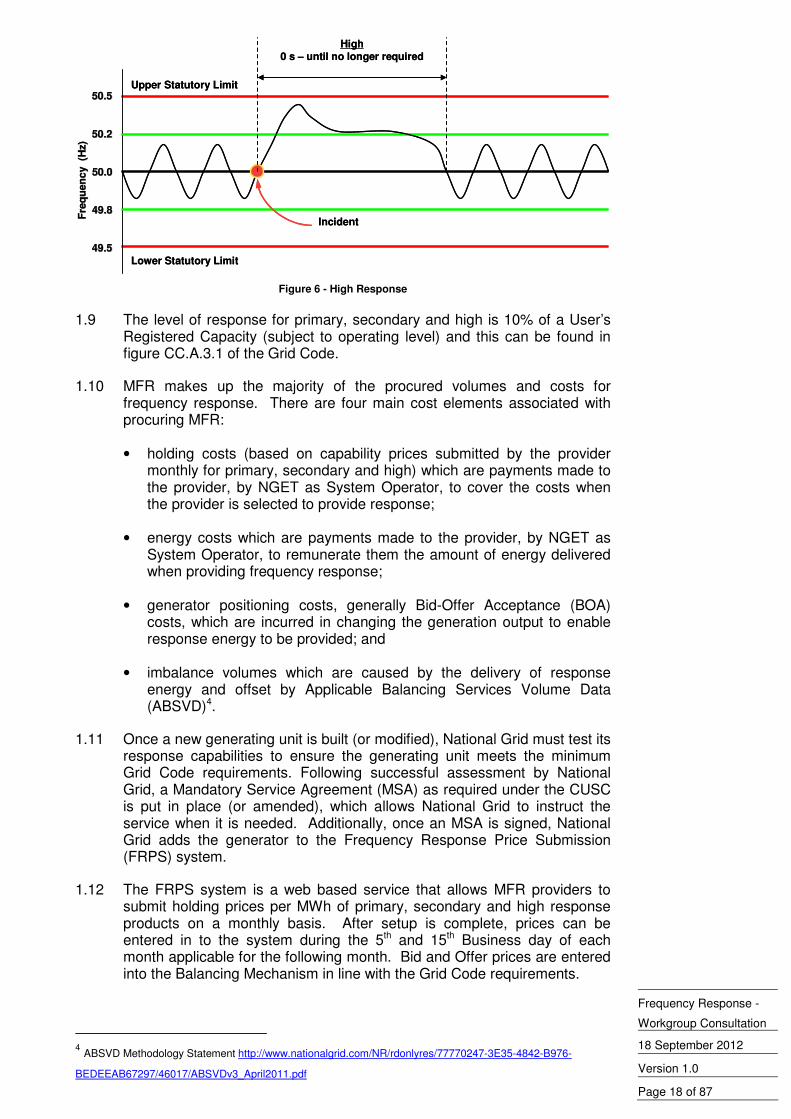
1.8 The current Grid Code obligation, illustrated below in figure 5 and 6, requires that a generation unit with a Completion Date after 1st January 2001 must provide:
• primary response (within 10 seconds, sustainable for 30 seconds);
• secondary response (within 30 seconds; sustainable for 30 minutes); and
• high frequency response (within 10 seconds, sustainable thereafter).
Fre
qu
en
cy
(Hz)
Fre
qu
en
cy
(Hz)
Lower Statutory Limit
Upper Statutory Limit
49.549.5
50.050.0
49.849.8
50.250.2
50.550.5
Incident
Primary
10 s - 30 s
Secondary
30 s - 30 min
Fre
qu
en
cy
(Hz)
Fre
qu
en
cy
(Hz)
Lower Statutory Limit
Upper Statutory Limit
49.549.5
50.050.0
49.849.8
50.250.2
50.550.5
Incident
Primary
10 s - 30 s
Secondary
30 s - 30 min Figure 5 - Primary and Secondary Response
Frequency Response -
Workgroup Consultation
18 September 2012
Version 1.0
Page 18 of 87
Fre
qu
en
cy
(Hz)
Fre
qu
en
cy
(Hz)
Lower Statutory Limit
Upper Statutory Limit
49.549.5
50.050.0
49.849.8
50.250.2
50.550.5
Incident
High
0 s – until no longer required
Fre
qu
en
cy
(Hz)
Fre
qu
en
cy
(Hz)
Lower Statutory Limit
Upper Statutory Limit
49.549.5
50.050.0
49.849.8
50.250.2
50.550.5
Incident
High
0 s – until no longer required
Figure 6 - High Response
1.9 The level of response for primary, secondary and high is 10% of a User’s Registered Capacity (subject to operating level) and this can be found in figure CC.A.3.1 of the Grid Code.
1.10 MFR makes up the majority of the procured volumes and costs for frequency response. There are four main cost elements associated with procuring MFR:
• holding costs (based on capability prices submitted by the provider monthly for primary, secondary and high) which are payments made to the provider, by NGET as System Operator, to cover the costs when the provider is selected to provide response;
• energy costs which are payments made to the provider, by NGET as System Operator, to remunerate them the amount of energy delivered when providing frequency response;
• generator positioning costs, generally Bid-Offer Acceptance (BOA) costs, which are incurred in changing the generation output to enable response energy to be provided; and
• imbalance volumes which are caused by the delivery of response energy and offset by Applicable Balancing Services Volume Data (ABSVD)4.
1.11 Once a new generating unit is built (or modified), National Grid must test its response capabilities to ensure the generating unit meets the minimum Grid Code requirements. Following successful assessment by National Grid, a Mandatory Service Agreement (MSA) as required under the CUSC is put in place (or amended), which allows National Grid to instruct the service when it is needed. Additionally, once an MSA is signed, National Grid adds the generator to the Frequency Response Price Submission (FRPS) system.
1.12 The FRPS system is a web based service that allows MFR providers to submit holding prices per MWh of primary, secondary and high response products on a monthly basis. After setup is complete, prices can be entered in to the system during the 5th and 15th Business day of each month applicable for the following month. Bid and Offer prices are entered into the Balancing Mechanism in line with the Grid Code requirements.
4 ABSVD Methodology Statement http://www.nationalgrid.com/NR/rdonlyres/77770247-3E35-4842-B976-
BEDEEAB67297/46017/ABSVDv3_April2011.pdf
Frequency Response -
Workgroup Consultation
18 September 2012
Version 1.0
Page 19 of 87
Firm Frequency Response (FFR)
1.13 FFR is a form of commercial frequency response that is designed to compliment other sources of frequency response and delivers firm provision of Dynamic or Non-Dynamic Response to changes in Frequency.
1.14 National Grid procures FFR to manage the same incidents as MFR but unlike MFR, FFR is open to BMU and non-BMU providers, existing MFR providers and new providers alike.
1.15 The FFR service creates a route to market for providers whose services may otherwise be inaccessible whilst giving both National Grid and service providers a degree of stability against price uncertainty under the MSAs.
1.16 National Grid procures FFR through a monthly tender process. Once service providers successfully complete a pre-qualification assessment and sign onto a framework agreement, they can participate in the tender process. They can tender in for a single month or multi-months. Having considered the quality, quantity and the nature of the services, National Grid will accept the most economical tender. A successful tender then becomes contractually binding.
Frequency Control by Demand Management (FCDM)
1.17 FCDM provides non-dynamic frequency response through interruption of demand customers. The electricity demand is automatically interrupted when the system frequency transgresses the low frequency relay setting on site. The demand customers who provide the service are prepared for their demand to be interrupted for 30 minutes. Interruptions are likely to occur between approximately ten to thirty times per annum depending on the frequency set point.
1.18 FCDM is required to manage large deviations in frequency which can be caused by, for example, the loss of significantly large generation. The service is a route to market for demand-side providers, and compliments other non-dynamic service provisions.
1.19 Due to the bespoke nature of service provision, this service is provided through bilateral negotiations with providers. National Grid provides FCDM computer equipment, tests and commissions once the provider has installed the Tripping Relay Equipment and Communication Router. Once testing has been completed, a provider can join the scheme subject to signing the FCDM Ancillary Service Agreement.
1.20 Once a provider has agreed terms they are required to declare availability for each Settlement Period on a weekly basis. National Grid then will determine whether to accept this availability.
1.21 For each site where availability has been accepted by National Grid in a Settlement Period, an Availability Fee (£/MW/h) is paid against the Metered Demand in the Settlement Period of the site specified in the Agreement.
Frequency Response -
Workgroup Consultation
18 September 2012
Version 1.0
Page 20 of 87
2. Workgroup Discussions
2.1 The Workgroup noted the work undertaken by the Frequency Response Technical Subgroup and their recommendations. It was agreed that appropriate commercial arrangements should be put in place to facilitate the provision of frequency response in the context of the technical conclusions.
2.2 The Frequency Response Workgroup concentrated discussion on the MFR provision and how this could be altered to facilitate improved frequency response in the future.
2.3 The Workgroup agreed that any arrangements would need to give suitable investment signals far enough in advance in order to be effective. It was also agreed that the obligations around frequency response, be they increased, maintained, reduced or removed, need to be clearly stated and defined within the Grid Code to give manufacturers clear requirements and Users confidence in the arrangements.
2.4 As the current MFR requirement is for Generators to have the capability, rather than the delivery, it is conceivable that a Generator will never be called upon for the physical delivery of energy if the System Operator can find the necessary response required at a more cost effective price.
2.5 Workgroup Members highlighted that the current MFR requirement for Generators may not be the most efficient method for ensuring the appropriate amount of frequency response is available to the System Operator and could lead to inefficient investment in capability.
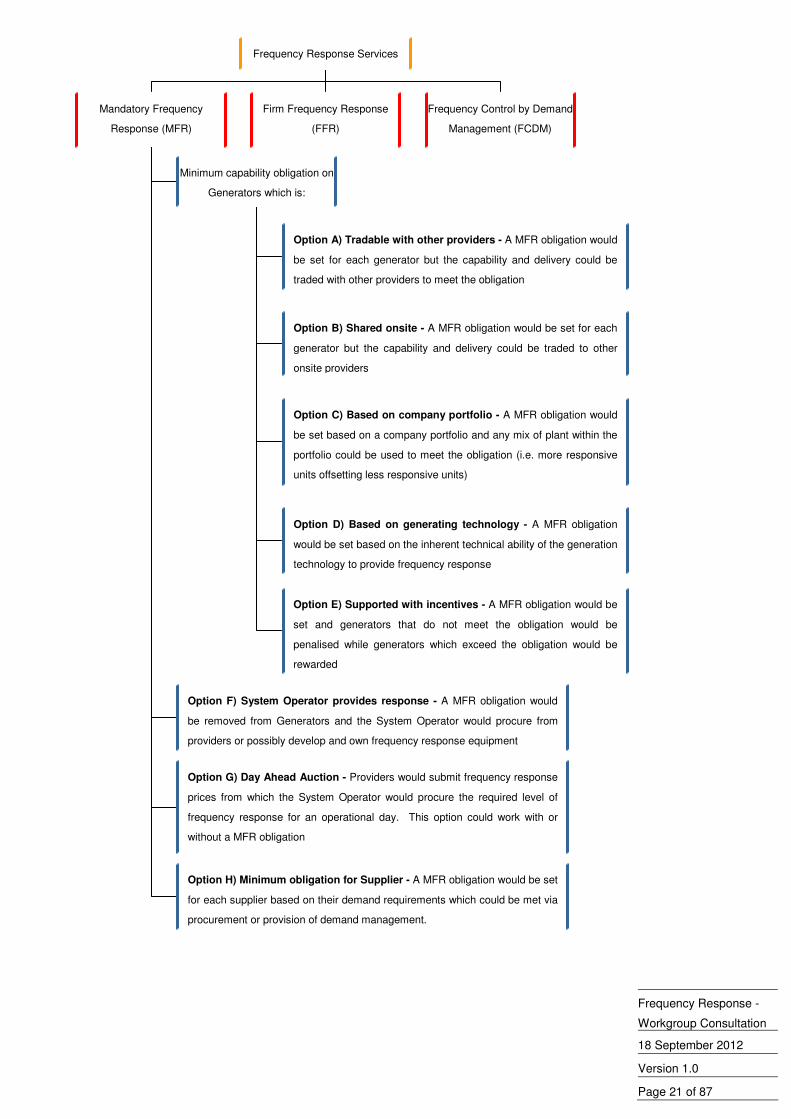
2.6 Following the examination of existing frequency response obligations, the Workgroup discussed a number of high level options which have been summarised diagrammatically on the next page.
2.7 The Workgroup considered each option at a high level before determining if there was merit in giving it further consideration. Although not all of the options have progressed passed initial discussions, Sections 3 to 10 of this Workgroup Report describe each of the eight options and contain any additional analysis that the Workgroup undertook.
2.8 The Workgroup has not drawn out the status quo as an option above as these are presented as potential alternatives to the current arrangements. If an alternative is not developed the current arrangements will remain in place.
Frequency Response -
Workgroup Consultation
18 September 2012
Version 1.0
Page 21 of 87
Frequency Response Services
Mandatory Frequency
Response (MFR)
Firm Frequency Response
(FFR)
Frequency Control by Demand
Management (FCDM)
Minimum capability obligation on
Generators which is:
Option F) System Operator provides response - A MFR obligation would
be removed from Generators and the System Operator would procure from
providers or possibly develop and own frequency response equipment
Option G) Day Ahead Auction - Providers would submit frequency response
prices from which the System Operator would procure the required level of
frequency response for an operational day. This option could work with or
without a MFR obligation
Option H) Minimum obligation for Supplier - A MFR obligation would be set
for each supplier based on their demand requirements which could be met via
procurement or provision of demand management.
Option A) Tradable with other providers - A MFR obligation would
be set for each generator but the capability and delivery could be
traded with other providers to meet the obligation
Option B) Shared onsite - A MFR obligation would be set for each
generator but the capability and delivery could be traded to other
onsite providers
Option C) Based on company portfolio - A MFR obligation would
be set based on a company portfolio and any mix of plant within the
portfolio could be used to meet the obligation (i.e. more responsive
units offsetting less responsive units)
Option D) Based on generating technology - A MFR obligation
would be set based on the inherent technical ability of the generation
technology to provide frequency response
Option E) Supported with incentives - A MFR obligation would be
set and generators that do not meet the obligation would be
penalised while generators which exceed the obligation would be
rewarded
Frequency Response -
Workgroup Consultation
18 September 2012
Version 1.0
Page 22 of 87
3. Option A - Minimum capability obligation which is tradable with other providers
3.1 This option proposes to retain a minimum Grid Code obligation on a generator to provide frequency response capability but a generator would be able to trade away provision of that capability to other plant (which would still need to be capable of providing its own MFR requirement in addition). For example:
• Generator X, a new non-compliant generator, has a Registered Capacity of 100MW and can provide 6% of primary response in 10 seconds (current requirement is for 10% in 10 seconds)
• Generator Y, a fully complaint generator, also has a Registered Capacity of 100MW but can provide 14% of primary response in 10 seconds
• Under Option A, Generator X can contract with Generator Y for their additional 4% of primary response and both generators would be able to meet their primary response obligation.
3.2 This option would not preclude contracting with other providers of frequency response (e.g. demand providers) and would allow a generator to contract with other providers located across the National Electricity Transmission System (NETS) to provide additional response.
3.3 The Workgroup noted the following aspects that would need to be considered as part of Option A:
• all generators and their contracted providers would need to be tested;
• all generators and providers would need to have adequate metering installed to be able to monitor response energy delivery;
• all providers would need to be able to be selected to provide response at any time;
• arrangements would need to ensure that there was capability contract price discovery to enable efficient generator investment decisions to be made; and
• the point at which National Grid steps in to manage frequency response if a contracted provider does not deliver.
3.4 It was recognised that existing plant would have to meet the requirements of the Grid Code of their day and would not be required to meet requirements subsequently introduced into the Grid Code. The Workgroup also noted that under this option, generators that cannot meet their frequency response obligations could meet their obligation through contracting and should therefore not require a derogation.
3.5 The Workgroup agreed that Option A merited further discussion and consideration.
Impact on Operational Costs
3.6 The implementation of the arrangements as outlined above could have a number of impacts on operational costs. The outcome will depend on the contracting strategy of each generating unit, the generation technology that
Frequency Response -
Workgroup Consultation
18 September 2012
Version 1.0
Page 23 of 87
is providing the additional response and the operational period (i.e. level of demand).
3.7 There could be a situation in which less-responsive generation is running that cannot meet the overall response requirements. Therefore, a reduction in less-responsive generation (generation not compliant with the Grid Code) would be required to provide room for a corresponding increase in more-responsive generation and would lead to higher operational costs.
3.8 Alternatively, there could be a situation in which more-responsive generation is running that can meet more than the overall response requirements. Therefore, a reduction in less-responsive generation is not required to make room for more-responsive generation and would likely lead to lower operational costs.
3.9 Providers of additional response may have additional MW that they could provide to the energy market when the primary unit they have contracted with is not running. This could help providers to recover the cost of investment in a shorter period of time.
3.10 If each unit which does not or cannot meet the current mandatory requirement contracts with alternative technology, then it is likely that costs will be maintained or slightly increase. It is generally believed that the cost of new technology will be higher than the current costs of response. Therefore, if a generator is contracting with new technology, it is anticipated that this will be more expensive than the current cost levels. Although it is recognised that over time it may become cheaper to contract with alternative technology as it becomes more established.
3.11 It also needs to be noted that if the scenario materialises where the contracted unit fails to deliver the required response on behalf of the non-complaint generator it could lead to increased operational costs. The Workgroup assumes that the commercial ramifications that materialise from failure to deliver would be managed appropriately through the bilateral agreement between the generator and their provider of additional response.
Impact on Generation Investment Costs
3.12 It is anticipated with the ability to trade capability that generation investment costs could decrease as generators would not be required to invest in being able to provide frequency response capability themselves where it was less efficient to do so. Generators could contract with a provider who could provide the generators frequency response requirement more efficiently and at a lower cost.
3.13 These lower investment costs could be reflected in lower power prices although it should be noted that these requirements are forward looking and depending on the obligation, generation investment costs would vary.
Potential Cost Benefit
3.14 It would be anticipated that more efficient generation investment would lead to a decrease in the price of power. Quantifying this is difficult to do and relies on an understanding of how the market will operate with large amounts of variable generation, market behaviour and management of large portfolios.
3.15 Depending on the factors highlighted above, lower or higher operational costs could result in a corresponding change in Balancing Services Use of System (BSUoS) costs. Currently all BSUoS costs are socialised across all system users during each half hour. The Workgroup is aware of the
Frequency Response -
Workgroup Consultation
18 September 2012
Version 1.0
Page 24 of 87
recent approval of CMP202 which has removed BSUoS charges for lead parties of Interconnector BM Units5 and the ongoing CMP201 which seeks to remove BSUoS charges from Generation6.
3.16 If BSUoS costs increased it is difficult to know if they would be offset by lower power prices through efficient generation investment. Although, increases in BSUoS costs would provide some incentive on system users to provide response during periods of high costs (high costs caused by response provision).
3.17 Alternatively, if BSUoS costs decreased and lower power prices were seen through efficient generation investment an overall cost reduction could be seen which could translate into lower prices for consumers.
3.18 It also needs to be noted that if the scenario materialises where the contracted unit fails to deliver the required response it could lead to increased operational and BSUoS costs.
Benefits of Option A
3.19 There are a number of benefits that can be identified:
• promotes development of and facilitates access for alternative generation technologies that may not be able to meet current Grid Code requirements;
• maintains system security risk to current levels;
• provides flexibility in the provision of response volumes for mandatory providers;
• potential for lower power prices, and lower operational and BSUoS costs;
• additional frequency response and MW available when alternative response provider is running and main plant is not; and
• if the market size increases, existing sites may add on-site technology to increase their frequency response ability to contract out.
Disadvantages of Option A
3.20 There are a number of disadvantages that can be identified:
• any outage on the additional response provider technology would mean primary generator could not meets its obligation;
• operating and BSUoS costs could increase;
• additional testing and approving of alternative technologies would be required;
• need to improve metering of response volumes provided;
• increased optimisation complexity;
5CMP202 Decision Letter - http://www.nationalgrid.com/NR/rdonlyres/6030B915-F3E0-4418-BF08-
CA6B1CC5C4BD/55635/CMP202D.pdf 6 CMP201 Code Administrator Consultation - http://www.nationalgrid.com/NR/rdonlyres/DDF09C57-F559-4F3D-
91D6-11070D3DDF93/55346/CMP201CodeAdministratorConsultation.pdf
Frequency Response -
Workgroup Consultation
18 September 2012
Version 1.0
Page 25 of 87
• increased interaction with the energy market;
• increased monitoring of contracts and publication of contract information; and
• depending on the plant providing the additional response, investment savings could translate into operational costs.
3.21 Consultation Question 6: Do you believe that Option A merits further investigation by the Workgroup? Please include your rationale.
3.22 Consultation Question 7: Is there anything additional you wish to note regarding Option A?
4. Option B - Grid Code Obligation with the Ability to Share Obligation On-site
4.1 This option proposes to retain a minimum Grid Code obligation on a generator to provide frequency response capability but they would be able meet any shortfall in response capability through the use of on-site alternative technologies such as batteries or flywheels. For example:
• Generator X, a new non-compliant generator, has a Registered Capacity of 100MW and can provide 6% of primary response in 10 seconds (current requirement is for 10% in 10 seconds)
• To address the 4% primary response deficit, Generator X develops additional on-site technology that can produce at least 4% primary frequency response.
4.2 The Workgroup did not believe that having the alterative technology based on-site would preclude another party from owning and operating it.
4.3 The Workgroup agreed that Option B merited further discussion and consideration.
Impact on Operational Costs
4.4 As all generators will be compliant with the Grid Code (via self provision or alternative on-site response technology), costs should be similar to current levels (dependent on the cost of new technologies in providing the additional response volumes).
4.5 As the additional on-site technologies may also be available to provide response when the corresponding generation is not available, costs could decrease as there could be more response volume available to the System Operator.
4.6 A scenario could occur in which the primary plant is not running but enough additional on-site response is available that it would prevent the need to deload less-responsive generators elsewhere on the system.
4.7 Another scenario could materialise where the contracted alternative on-site response unit fails to deliver the required response on behalf of the non-compliant generator which could lead to increased operational costs.
Impact on Generation Investment Costs
4.8 Option B allows a generator to determine the most cost effective manner in determining how they meet their Grid Code frequency response obligations i.e. rather than invest in generation, the investment may be more efficiently provided via alternative technology.
Frequency Response -
Workgroup Consultation
18 September 2012
Version 1.0
Page 26 of 87
4.9 However, there could be increased investment required from a generator to install alternative technologies in addition to their primary unit. There could also be costs associated with gaining the necessary experience depending on the technology employed.
4.10 These costs may be offset by the savings in not having to ensure their primary unit is able to provide their entire obligation.
4.11 Alternative on-site technology could increase the entry capacity required for the site and the additional on-site unit could provide MW to the energy market rather than solely provide frequency response. Whilst a higher entry capacity might result in different Grid Code obligations that need to be met, additional MW available for the energy market may hasten the return on investment. The generator would have to determine the best deployment of MW which is the same as the current arrangements when operating at peak load.
4.12 There is the potential that it is more expensive to provide the additional response technology on-site rather than at other sites.
Potential Cost Benefit
4.13 Initial discussions indicate that there could be lower operational and generation costs which could translate into lower costs passed on to the consumer.
4.14 Arguably a generator will determine the most cost effective way to meet their Grid Code response obligations which could result in lower operational costs compared to the current arrangements. Additional on-site capacity could also result in more MW available in the energy market leading to lower power prices.
4.15 The Workgroup also recognised that if the additional on-site response was a storage based technology it could be used to smooth out intermittent generation which could reduce BSUoS costs.
Benefits of Option B
4.16 There are a number of benefits that can be identified:
• promotes development of and facilitates access for alternative generation technologies that may not be able to meet current Grid Code requirements;
• maintains system security risk to current levels;
• provides flexibility in the provision of response volumes for mandatory providers;
• potential for lower power prices, and lower operational and BSUoS costs;
• unlike Option A there is no requirement to provide additional metering as the provision of response is provided at the generation site;
• unlike Option A there would not need to be additional monitoring of response volumes;
• optimisation would be of a similar complexity to current arrangements;
• unlike Option A there would likely be lower interaction with the energy markets and no need to monitor and publish response contracts; and
Frequency Response -
Workgroup Consultation
18 September 2012
Version 1.0
Page 27 of 87
• additional frequency response and MW available when additional response unit is running and main plant is not,
Disadvantages of Option B
4.17 There are a number of disadvantages that can be identified:
• any outage on the alternative technology would mean generator could not meets its obligation;
• increased generation investment costs;
• reliability risks associated with new technology;
• limits the technologies that would be available to provide response (i.e. demand side providers would not be able to provide on-site response);
• saturation of the market by having sites meeting the frequency response requirements;
• likely to be most effective capital solution but not necessarily most overall effective solution; and
• it could be more expensive to provide the technology on-site rather than at other sites.
4.18 Consultation Question 8: Do you believe that Option B merits further investigation by the Workgroup? Please include your rationale.
4.19 Consultation Question 9: Is there anything additional you wish to note regarding Option B?
5. Option C - Minimum capability obligation which is based on company portfolio
5.1 This option proposes to retain a minimum Grid Code obligation on a generator to provide frequency response capability but the requirement would be set based on the company portfolio. The generator would then choose how to meet their obligation with units from the portfolio. For example:
• A generator has two power stations within their portfolio, Station X and Station Y. Using the current primary response obligations, the portfolio has to be able to deliver 10% of Registered Capacity in 10 seconds.
• Station X, a new non-compliant station, has a Registered Capacity of 100MW and can provide 6% of primary response in 10 seconds
• Station Y, a fully complaint generator, also has a Registered Capacity of 100MW but can provide 14% of primary response in 10 seconds
• Under Option C, the generator can use the additional 4% of primary response from Station Y to offset Station X which would meet the primary response obligations placed on the portfolio.
5.2 As the obligation would be set on the company portfolio it would allow a generator to determine the most efficient way to meet their obligations using the plant within their portfolio. This flexibility would allow a generator to have more responsive plant offset less responsive plant rather than having each generator meet a minimum requirement. It was thought that by allowing the obligation to be met across a portfolio it would save on capital costs for future projects.
Frequency Response -
Workgroup Consultation
18 September 2012
Version 1.0
Page 28 of 87
5.3 The Workgroup agreed that a portfolio could contain one unit or a number of units but noted that when a company acquires new units their frequency response requirements would alter. A frequency response obligation that fluctuates based on a company portfolio would likely be difficult and costly to monitor whilst causing operational uncertainty for the System Operator.
5.4 It was also recognised that while Option C might afford more flexibility to those generators with large portfolios, it would not permit any additional flexibility for generators with a single station that are required to provide frequency response. The Workgroup agreed that any option would need to give equal flexibility to all generators and not just those with large portfolios.
5.5 The Workgroup recognised the parallels that Option C had with other options, namely A and B, and agreed that there was no discernable benefit to Option C over other options. The Workgroup therefore determined that Option C should not be progressed any further.
5.6 Consultation Question 10: Do you believe that Option C merits further investigation by the Workgroup? Please include your rationale.
5.7 Consultation Question 11: Is there anything additional you wish to note regarding Option C?
6. Option D - Minimum capability obligation which is based on generating technology
6.1 This option proposes to retain a minimum Grid Code obligation on a generator to provide frequency response capability but the requirement would be set based on the technology utilised. For example:
• Generator X, a Combined Cycle Gas Turbine (CCGT), has a Registered Capacity of 100MW and, based on the inherent technical ability of the this generating technology, can provide 6% of primary response in 10 seconds (current requirement is for 10% in 10 seconds)
• Generator Y, a Pumped Storage Hydro facility, also has a Registered Capacity of 100MW and, based on the inherent technical ability of the this generating technology, can provide 14% of primary response in 10 seconds
• Under Option D, the combination of Generator X and Generator Y results in the System Operator having the required amount of primary frequency response (based on the existing requirement)
6.2 It was recognised that allowing each technology to provide a level of frequency response best suited to it might be the most cost effective option as it would not put expensive and uneconomical requirements on generators. This could result in significant capital cost savings for generators which could lead to lower power prices.
6.3 It was also understood that whilst Option D could lead to lower capital costs there could be an increase in BSUoS costs. If the mix of generation on the system put the System Operator short of the required level of frequency response for the operational day, it could mean that less economic actions need to be taken to account for the shortfall in available frequency response.
6.4 It was also questioned how each generating technology would be assessed to determine a minimum level of response. The Workgroup believed that this would come from manufacturers or testing as part of the compliance process.
Frequency Response -
Workgroup Consultation
18 September 2012
Version 1.0
Page 29 of 87
6.5 The Workgroup agreed that whilst Option D could be the most cost effective option in terms of the provision of frequency response by generators, there are a number of concerns regarding system security and whether the future mix of generation would be appropriate to meet system requirements.
6.6 The Workgroup determined that Option D should not be progressed any further.
6.7 Consultation Question 12: Do you believe that Option D merits further investigation by the Workgroup? Please include your rationale.
6.8 Consultation Question 13: Is there anything additional you wish to note regarding Option D?
7. Option E - Minimum capability obligation which is supported with incentives
7.1 This option proposes to retain a minimum Grid Code obligation on a generator to provide frequency response capability but rewards or penalises based on installed capacity. For example:
• Generator X, a new non-compliant generator, has a Registered Capacity of 100MW and can provide 6% of primary response in 10 seconds (current requirement is for 10% in 10 seconds)
• Generator Y, a fully complaint generator, also has a Registered Capacity of 100MW but can provide 14% of primary response in 10 seconds
• Under Option E, Generator Y would receive additional income from providing primary frequency response above the minimum requirement whilst Generator X would be exposed to additional cost for not being able to meet the minimum requirement.
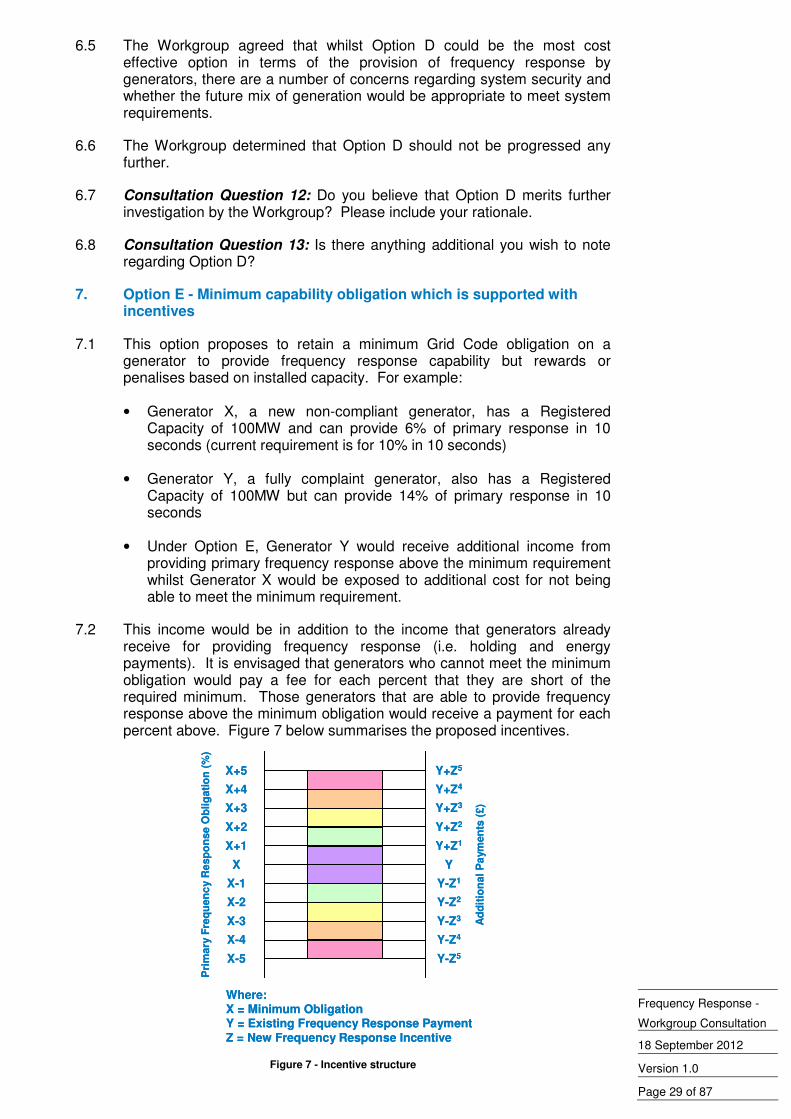
7.2 This income would be in addition to the income that generators already receive for providing frequency response (i.e. holding and energy payments). It is envisaged that generators who cannot meet the minimum obligation would pay a fee for each percent that they are short of the required minimum. Those generators that are able to provide frequency response above the minimum obligation would receive a payment for each percent above. Figure 7 below summarises the proposed incentives.
X
Pri
mary
Fre
qu
en
cy R
esp
on
se O
bli
gati
on
(%
)
X+1
X+2
X+3
X+4
X+5
X-5
X-4
X-3
X-2
X-1
Y
Y+Z1
Y+Z2
Y+Z3
Y+Z4
Y+Z5
Y-Z5
Y-Z4
Y-Z3
Y-Z2
Y-Z1
Ad
dit
ion
al
Pa
ym
en
ts (
£)
Where:X = Minimum ObligationY = Existing Frequency Response PaymentZ = New Frequency Response Incentive
X
Pri
mary
Fre
qu
en
cy R
esp
on
se O
bli
gati
on
(%
)
X+1
X+2
X+3
X+4
X+5
X-5
X-4
X-3
X-2
X-1
Y
Y+Z1
Y+Z2
Y+Z3
Y+Z4
Y+Z5
Y-Z5
Y-Z4
Y-Z3
Y-Z2
Y-Z1
Ad
dit
ion
al
Pa
ym
en
ts (
£)
Where:X = Minimum ObligationY = Existing Frequency Response PaymentZ = New Frequency Response Incentive
Figure 7 - Incentive structure
Frequency Response -
Workgroup Consultation
18 September 2012
Version 1.0
Page 30 of 87
7.3 The Workgroup noted that this would penalise generation technology that finds it inherently difficult to provide frequency response for technical reasons but agreed that it is not expected that the costs for under provision would dissuade a generator from a particular choice of generation technology.
7.4 The Workgroup also believed that it could prove more economical for some generators to pay an additional cost for not being able to meet the minimum requirements rather than incurring the capital cost that would be required to allow the minimum obligations to be met.
7.5 The Workgroup have not developed this option any further than initial discussions but note that this option may have some merit worth investigating further.
7.6 Consultation Question 14: Do you believe that Option E merits further investigation by the Workgroup? Please include your rationale.
7.7 Consultation Question 15: Is there anything additional you wish to note regarding Option E?
8. Option F - System Operator provides response
8.1 This option proposes to reduce or remove the minimum Grid Code obligation on a generator to provide frequency response capability and instead have the System Operator procure the necessary frequency response volumes on a bilateral basis. For example:
• Generator X, a new generator, has a Registered Capacity of 100MW and can provide 6% of primary response in 10 seconds (frequency response requirement removed)
• Generator Y, a new generator, has a Registered Capacity of 100MW and can provide 14% of primary response in 10 seconds
• Under Option F, National Grid would approach Generator X and Generator Y to discuss procurement of frequency response and agree terms on a bilateral basis. The amount of frequency response procured by National Grid would be based on plant outage, unavailability and system security. Both generators are compliant in this example as the obligation has been removed.
8.2 Payments would be generator specific and could be based on existing holding and response energy payment mechanisms. Alternatively, for new or life-extension generation, the payment could reflect an agreed amount of capital contribution to deliver the capability or a combination of the two. Payments for long term contracts could be index linked. Enhanced capability, either quantity or speed of response, would attract higher payment.
8.3 Contracts would be required for the service provision once a provider was appointed to ensure appropriate terms and conditions and to cover items such as term, payment and non-delivery. Plant would have to be tested to demonstrate it can achieve its capability profile. Compliance process would apply and National Grid could have option to re-negotiate price if capability no longer meets contracted position.
8.4 The Workgroup also discussed a scenario in which National Grid developed and owned frequency response equipment to meet system requirements. Whilst initially discussed it was considered unlikely to be an option going forward due to licensing restrictions and regulatory issues.
Frequency Response -
Workgroup Consultation
18 September 2012
Version 1.0
Page 31 of 87
Impact on Operational Costs
8.5 Increased System Operator costs in terms of resourcing and running the procurement exercise.
8.6 The onus for the provision of frequency response would move from the generators to the System Operator and the Workgroup questioned if the System Operator is best placed to get the best provision. Arguably operational costs would increase if the System Operator is not best placed to get the best provision.
8.7 The System Operator would be exposed to fuel price risk if the capability procured through the tender process meant that the majority of frequency response came from units utilising a particular fuel source.
Impact on Generation Investment Costs
8.8 Lower investment costs could be seen for generators as not all generators would have to provide frequency response capability.
8.9 If providers were identified through a tender, this could show longer investment signals which could lead to more efficient and certain investment.
8.10 Price risk moved to System Operator with long term contracts which could be indexed linked by fuel but it would provide an incentive on generators to reduce operational costs to maximise margin.
Potential Cost Benefit
8.11 It is unclear if the increased System Operator costs to run a procurement process and any loss in efficiency with the System Operator not obtaining the best provision would be offset by potentially lower generator investment costs which could materialise in lower power prices.
8.12 Arguably the System Operator is not best placed to be making decisions that could expose them to fuel price risk and it adds additional complexity to the System Operator role which would likely materialise as increased operating costs.
Benefits of Option F
8.13 There are a number of benefits that can be identified:
• more options for providers to determine how and if they wish to provide frequency response;
• more options for National Grid to pick more economic and efficient frequency response solution;
• prevents consumer being exposed to cost of capability provided but unutilised frequency response cost;
• lower investment costs for generators;
• flexibility around contract duration and pricing structure; and
• actually procure based on the frequency response requirements.
Frequency Response -
Workgroup Consultation
18 September 2012
Version 1.0
Page 32 of 87
Disadvantages of Option F
8.14 There are a number of disadvantages that can be identified:
• cost for development and implementation of appropriate IS systems;
• system security risk may not be maintained to current levels;
• increased complexity and additional process;
• increased System Operator costs;
• over procurement would be necessary to ensure enough frequency response available on the day;
• having one central buyer is arguably not the most efficient way to address the issue;
• not a very competitive solution or responsive to market signals; and
• long term contracts do not promote innovation and blocks new entrants.
8.15 The Workgroup agreed that whilst Option F had some benefits it did not seem that having a single procurer would encourage the most efficient solution. There was also concern that this option would not facilitate future innovation and could block new entrants from participating if long term contracts are agreed.
8.16 The Workgroup determined that Option F should not be progressed any further.
8.17 Consultation Question 16: Do you believe that Option F merits further investigation by the Workgroup? Please include your rationale.
8.18 Consultation Question 17: Is there anything additional you wish to note regarding Option F?
9. Option G - Day Ahead Auction
9.1 This option proposes to reduce or remove a minimum Grid Code obligation on a generator to provide frequency response capability and replace it with a day ahead auction.
9.2 To ensure that a mix of plant capable of securing the system is generating on any particular day, it is envisaged that at the day-ahead stage, the auction process would be initiated. The concept is similar to that of the Firm Frequency Response (FFR) tender but carried out on a daily basis rather than monthly. The Workgroup also recognised that a week ahead auction could be an alternative option if the timescales for a day-ahead auction proved too challenging or as an interim step between current arrangements and progressing to a day-ahead model.
9.3 To participate in the auction, which would be open to generation or demand-side providers, it would be necessary to be confident in the bidders’ ability to deliver the agreed levels of response. Thus there may be a requirement for some pre-qualification process. It is likely the requirements for the Day Ahead Auction participants would be similar to that of FFR participants which are:
• have suitable operational metering;
Frequency Response -
Workgroup Consultation
18 September 2012
Version 1.0
Page 33 of 87
• pass the FFR Pre-Qualification Assessment;
• deliver a minimum 10MW Response Energy;
• operate at their tendered level of demand/generation when instructed (in order to achieve the tendered frequency response capability);
• have the capability to operate (when instructed) in a Frequency Sensitive Mode for dynamic response or change their MW level via automatic relay for non-dynamic response;
• communicate via an Automatic Logging Device; and
• be able to instruct and receive via a single point of contact and control where a single FFR unit comprises of two or more sites located at the same premises.
9.4 For simplicity, it is expected at this time that the existing services of Primary, Secondary and High would remain although it is feasible that other products could be defined in the future. It is also assumed that the auction would be Balancing Mechanism Unit (BMU) specific, but a generic product could be developed.
9.5 Assuming that the frequency response auctions were to take place after submission of indicative Physical Notifications (PNs), a number of parameters would need to be submitted for assessment as part of the auction. The list below may not be exhaustive, but is a likely minimum requirement.
• MW of response offered - Primary, Secondary and High;
• required MW loading or de-loading to achieve the response offered;
It is possible that this volume could be treated as equivalent to a bid or offer such that further energy trading would not be required, thus removing the price risk of not being able to cover a resulting physical position at the expected price.
• the positional price (£/h) for delivering the capability to the system;
This would cover the cost of de-loading or loading to the appropriate level.
• an energy price for delivered energy resulting from frequency changes; and
• an initiation price.
This would be particularly relevant for plant not expected to be running to cover start-up costs and would allow submission of bids for all periods during the day giving assurance that contiguous periods would be bought.
9.6 With the indicative PNs and submissions from potential response providers, whether expected to be running or not, the System Operator would assess the bids in order to determine the most efficient way of meeting the frequency response requirements for the following day.
9.7 Accepted bids would be expected to deliver as bid and non-delivery would need to be priced appropriately. It is likely that an appropriate monitoring process for delivery would be developed in parallel.
Frequency Response -
Workgroup Consultation
18 September 2012
Version 1.0
Page 34 of 87
9.8 It is envisaged that within-day changes to the despatch decisions should be possible, and the BM would remain a mechanism to make such changes.
9.9 The Workgroup noted that Option G would not have to be based on the FFR framework but this was used as a starting point for discussion. Options could include:
• an FFR based mechanism with a mandatory obligation;
• an FFR based mechanism with a reduced obligation;
• an FFR based mechanism with no obligation;
• an alternative mechanism with a mandatory obligation;
• an alternative mechanism with a reduced obligation;
• an alternative mechanism with no obligation;
9.10 The Workgroup agreed that Option G merited further discussion and consideration.
Impact on Operational Costs
9.11 The Workgroup noted that with this option there would a potential systems impact to provide a day-ahead auction platform. It was recognised that the closer a process gets to real time the level of automation required increases and a day-ahead auction platform would require a large amount of automation which would likely have a large cost associated with it.
9.12 Along with the development of an appropriate platform there is the ongoing maintenance and resource cost that would be required. It was highlighted that this could have an impact on Electricity National Control Centre resources.
9.13 It was also noted that there would likely be interaction with other ancillary services and that operational systems would need to optimise the frequency response service with these other services.
9.14 If the system supported a single cost of response that could be submitted and if it takes away bid/offer analysis that is currently undertaken, it will provide better optimisation.
9.15 Prices could be more volatile at the day-ahead stage and could be higher compared to the week/month ahead.
9.16 It was highlighted that for demand side providers the certainty of their response capability increases closer to real time as demand becomes more certain.
Impact on Generation Investment Costs
9.17 The Workgroup suggested that the only reduction in generation investment costs would likely correspond with a reduction in obligation over time.
Potential Cost Benefit
9.18 A large capital expenditure would likely be required to establish a day-ahead auction platform and ongoing operational expenditure would be required to maintain and operate the system.
Frequency Response -
Workgroup Consultation
18 September 2012
Version 1.0
Page 35 of 87
9.19 There are potential efficiencies in providing a day-ahead auction solution as it facilitates wider participation and enables all providers to be more certain of aspects such as fuel prices and system demand which could translate into lower operational costs for them. Providers would optimise their plant and provide response in the most efficient means possible.
9.20 There was concern expressed that if there is no obligation to provide response capability it could lead to higher BSUoS costs and put the system at greater risk.
Benefits of Option G
9.21 There are a number of benefits that can be identified:
• an auction for frequency response should ensure that the System Operator is able to procure a suitable mix of plant at the day-ahead stage such that sufficient frequency response is available for the anticipated requirement;
• all available plant should be able to participate as it would not be constrained by long NDZs etc which should result in greater price competition than within-day actions;
• plant scheduled to run would be able to provide best prices and therefore an efficient outcome should result giving the optimal mix of plant on the day;
• efficiency is gained by optimising both the energy and response decisions at the same time;
• encouraging other technologies and providing a platform for participation;
• could be a more gradual implementation compared to other commercial arrangements as it is similar to existing mechanisms;
• obligations could remain the same and if successful could be reduced over time;
• if the market size increases, existing sites may add on-site technology to increase their frequency response ability to participate;
• unlike the month ahead FFR market, the risk to providers with exposure to fuel / power price diminishes closer to real time.
Disadvantages of Option G
9.22 There are a number of disadvantages that can be identified:
• a day-ahead frequency response market would add a level of complexity and additional process;
• within day changes would still need to be managed by National Grid and plant failures would need to be managed through appropriate non-delivery charges and within-day despatch;
• likely to be expensive to develop and ongoing operational costs would depend on the type of system developed;
• providers may opt to participate in the energy market rather than the frequency response auctions which could put the system at unacceptable risk.
Frequency Response -
Workgroup Consultation
18 September 2012
Version 1.0
Page 36 of 87
9.23 Consultation Question 18: Do you believe that Option G merits further investigation by the Workgroup? Please include your rationale.
9.24 Consultation Question 19: Is there anything additional you wish to note regarding Option G?
10. Option H - Minimum obligation for Supplier
10.1 This option proposes to introduce a minimum Grid Code obligation on a supplier to procure or provide frequency response capability based on the level of demand they are forecasting for a particular day. For example:
• Supplier A, has forecasted demand of 200MW for a particular day
• Generator X, has a Registered Capacity of 150MW and can provide 10% of primary response in 10 seconds (current requirement is for 10% in 10 seconds)
• Generator Y, has a Registered Capacity of 150MW and can provide 10% of primary response in 10 seconds
• Under Option H, the supplier would contract with Generator X and Generator Y to provide the necessary frequency response based on their forecasted demand
10.2 The Workgroup identified that there seemed to be some benefit in placing the obligation on Suppliers to procure frequency response in proportion to the amount of generation they needed to meet their expected demand. This would allow the correct amount of frequency response to be available for any given level of demand, as well as helping Suppliers to understand the benefits associated with services such as frequency response.
10.3 The Workgroup also commented that demand is a useful and flexible way to respond to a frequency situation but in the past Suppliers have not been able to actively participate to frequency response due to technological limitations.
10.4 The Workgroup agreed that whilst there could be some benefits associated with this option it would be a complex solution that would require significant changes in requirements and utilisation of technology such as smart meters.
10.5 It was also recognised that if the supplier was expected to provide frequency response rather than procure it from other sources, it could be challenging to provide adequate frequency response in times of low demand.
10.6 Overall, the Workgroup did not view this as a viable option due the infrastructure (ie smart meters) required which is not available at this time but noted that, once the infrastructure is in place, it could be an option in the future.
10.7 Consultation Question 20: Do you believe that Option H merits further investigation by the Workgroup? Please include your rationale.
10.8 Consultation Question 21: Is there anything additional you wish to note regarding Option H?
Frequency Response -
Workgroup Consultation
18 September 2012
Version 1.0
Page 37 of 87
11. European Network Codes
11.1 The Workgroup recognise the work that is ongoing on the European Network Codes (ENCs), specifically within the Network Code for Requirements for Grid Connection applicable to all Generators (RfG).
11.2 The development of the Network Code for Requirements for Grid Connection applicable to all Generators entered its formal phase after ENTSO-E received an invitation from the European Commission on 29 July 2011. The Commission officially requested ENTSO-E to draft this network code in line with Regulation (EC) 714/2009 and based on the Framework Guidelines on Electricity Grid Connection, published by ACER on 20 July 2011.
11.3 ENTSO-E launched a public consultation on the Network Code for Requirements for Grid Connection applicable to all Generators on 24 January 2012, which closed on 20 March 2012 ENTSO-E received over 6000 comments on the draft Network Code RfG.
11.4 On 13 July 2012, ENTSO submitted the Network Code on Requirements for Grid Connection Applicable to all Generators (RfG) to the Agency for the Cooperation of Energy Regulators (ACER).
11.5 At the time of writing, the final Network Code RfG, as well as its supporting documentation, is now subject to a three month evaluation period by ACER as prescribed in Regulation (EC) 714/2009.
11.6 Within GB, the current generator requirements are based on the following categories:
• Small (NGET <50MW, SPT <30MW, SHETL <10MW);
• Medium (NGET 50MW - 100MW, SPT N/A, SHETL N/A); and
• Large (NGET >100MW, SPT >30MW, SHETL >10MW).
11.7 Under the ENCs generator requirements are based on the following categories:
• A (800W - 1MW connected below 110kV);
• B (1MW - 10MW connected below 110kV);
• C (10MW - 30MW connected below 110kV); and
• D (>30MW or connected at 110kV or above).
11.8 Under the RfG, parameters for frequency response performance are specified by the Transmission System Operator (TSO) in accordance with Article 10 (2) (c) but in general these are similar to that required by the GB Grid Code. The TSO must define the parameters for minimum frequency response capability as a percentage of Registered Capacity (Pmax) which is between 1.5 – 10%, the Initial delay time shall be less than 2 seconds (which is not covered in the Grid Code) and full delivery of Active Power shall be achieved as specified by the TSO but shall be less than 30 seconds. Generating Units are to be capable of providing full Active Power frequency response (to be specified) for a period of between 15 minutes
Frequency Response -
Workgroup Consultation
18 September 2012
Version 1.0
Page 38 of 87
and 30 minutes and Generators must operate between their maximum and minimum headroom7.
11.9 The above requirements only apply to categories C and D under RfG. The Workgroup were not aware of any elements of the ENCs that would prohibit the implementation of the any of the commercial arrangements discussed.
11.10 Consultation Question 22: Are you aware of any element of the ENCs that would prevent the progression of the any of the technical requirements?
11.11 Consultation Question 23: Are you aware of any element of the ENCs that would prevent the progression of the any of the commercial arrangements?
7 See Article 10 (2) (c) -
https://www.entsoe.eu/fileadmin/user_upload/_library/consultations/Network_Code_RfG/120626_final_Network_C
ode_on_Requirements_for_Grid_Connection_applicable_to_all_Generators.pdf
Frequency Response -
Workgroup Consultation
18 September 2012
Version 1.0
Page 39 of 87
Consultation Responses & Next Steps
1. Consultation Responses
1.1 If you wish to make a representation on this Workgroup Consultation, please use the response proforma which can be found under Frequency Response at the following link:
http://www.nationalgrid.com/uk/Electricity/Codes/gridcode/consultationpape
rs/
1.2 Responses are invited to the following questions:
Consultation Question 1: Do you agree with the recommendations of the Frequency Response Technical Subgroup?
• Requirement for Faster Frequency Response on asynchronous plant?
• Clearer Primary Response Requirements for synchronous plant?
Consultation Question 2: Are there any impacts for generator owners that you would like to identify in relation to the recommendations? (e.g. costs, timescales, feasibility)
Consultation Question 3: Are there any impacts for HVDC Converter owners that you would like to identify in relation to the recommendations? (e.g. costs, timescales, feasibility)
Consultation Question 4: Are there any impacts for manufacturers that you would like to identify in relation to the recommendations? (e.g. costs, timescales, feasibility)
Consultation Question 5: Are there any additional comments you would like to make in relation to the frequency response technical requirements section of the consultation?
Consultation Question 6: Do you believe that Option A merits further investigation by the Workgroup? Please include your rationale.
Consultation Question 7: Is there anything additional you wish to note regarding Option A?
Consultation Question 8: Do you believe that Option B merits further investigation by the Workgroup? Please include your rationale.
Consultation Question 9: Is there anything additional you wish to note regarding Option B?
Consultation Question 10: Do you believe that Option C merits further investigation by the Workgroup? Please include your rationale.
Consultation Question 11: Is there anything additional you wish to note regarding Option C?
Consultation Question 12: Do you believe that Option D merits further investigation by the Workgroup? Please include your rationale.
Frequency Response -
Workgroup Consultation
18 September 2012
Version 1.0
Page 40 of 87
Consultation Question 13: Is there anything additional you wish to note regarding Option D?
Consultation Question 14: Do you believe that Option E merits further investigation by the Workgroup? Please include your rationale.
Consultation Question 15: Is there anything additional you wish to note regarding Option E?
Consultation Question 16: Do you believe that Option F merits further investigation by the Workgroup? Please include your rationale.
Consultation Question 17: Is there anything additional you wish to note regarding Option F?
Consultation Question 18: Do you believe that Option G merits further investigation by the Workgroup? Please include your rationale.
Consultation Question 19: Is there anything additional you wish to note regarding Option G?
Consultation Question 20: Do you believe that Option H merits further investigation by the Workgroup? Please include your rationale.
Consultation Question 21: Is there anything additional you wish to note regarding Option H?
Consultation Question 22: Are you aware of any element of the ENCs that would prevent the progression of the any of the technical requirements?
Consultation Question 23: Are you aware of any element of the ENCs that would prevent the progression of the any of the commercial arrangements?
1.3 Views are invited upon the proposals outlined in this consultation, which should be received by 30 October 2012. Your formal responses may be emailed to:
1.4 If you wish to submit a confidential response please note the following:
• Information provided in response to this consultation will be published on National Grid’s website unless the response is clearly marked “Private & Confidential”, we will contact you to establish the extent of the confidentiality. A response marked “Private and Confidential” will be disclosed to the Authority in full but, unless agreed otherwise, will not be shared with the Grid Code Review Panel or the industry and may therefore not influence the debate to the same extent as a non confidential response.
• Please note an automatic confidentiality disclaimer generated by your IT System will not in itself, mean that your response is treated as if it had been marked “Private and Confidential”.

Frequency Response -
Workgroup Consultation
18 September 2012
Version 1.0
Page 41 of 87
2. Next Steps
2.1 Following the conclusion of the Workgroup Consultation, the responses received will be considered by the Workgroup and included in the Workgroup Report that will be submitted to the Grid Code Review Panel.
2.2 The Workgroup, while considering consultation responses, will determine which of commercial arrangements should be progressed to a more detailed assessment. The Workgroup will also consider industry views on the proposed technical requirements and conclusions of the Frequency Response Technical Subgroup.
2.3 The Workgroup would also like to invite interested parties to join the Frequency Response Workgroup to support further discussion and analysis. If you are interested in joining the Workgroup please contact:
Thomas Derry
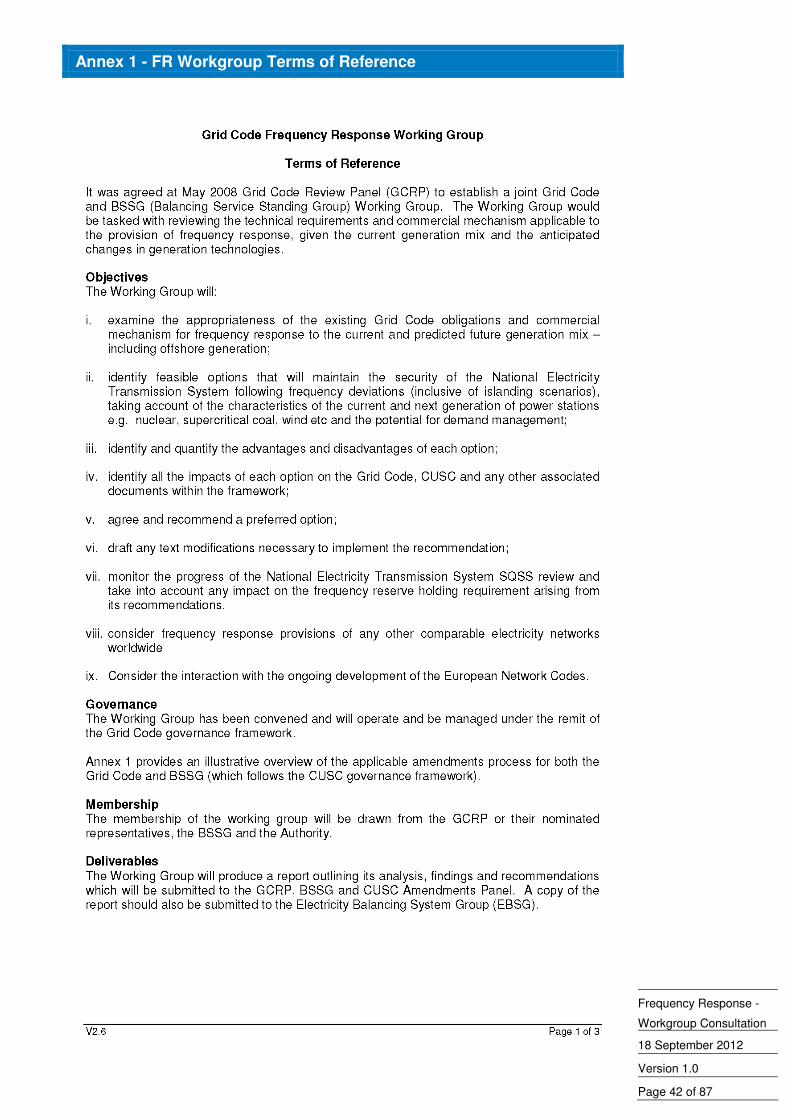
Frequency Response -
Workgroup Consultation
18 September 2012
Version 1.0
Page 42 of 87
Annex 1 - FR Workgroup Terms of Reference

Frequency Response -
Workgroup Consultation
18 September 2012
Version 1.0
Page 43 of 87
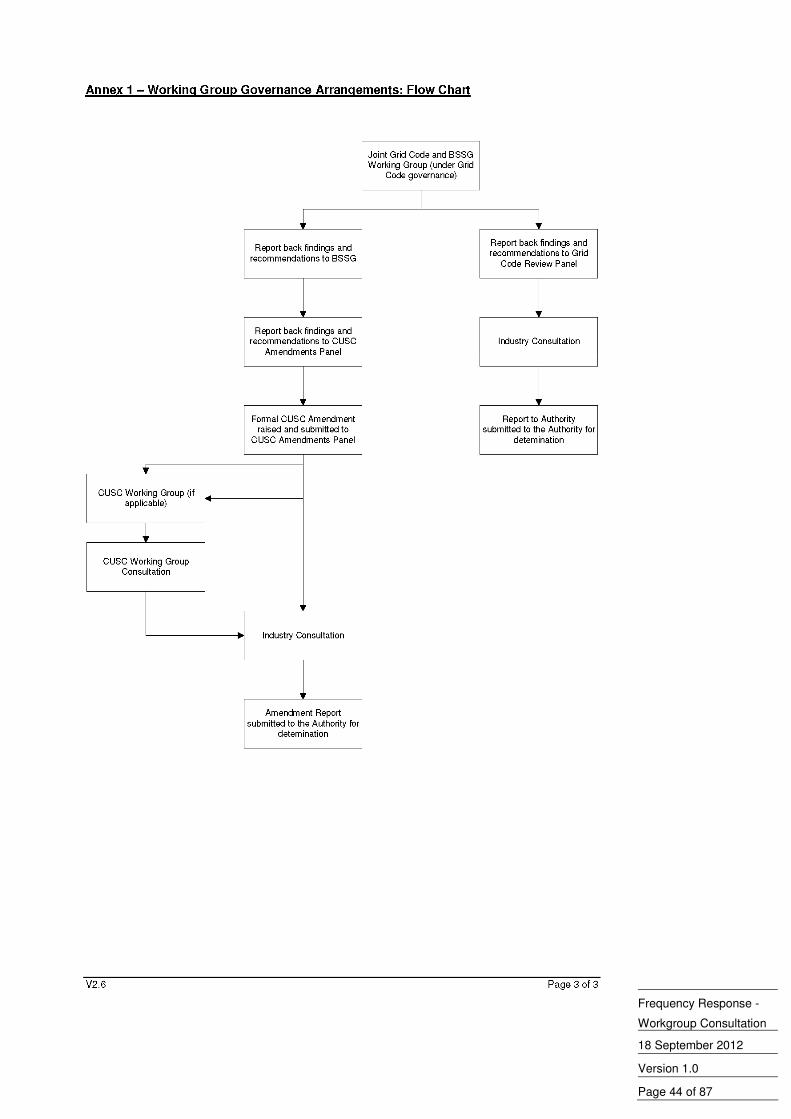
Frequency Response -
Workgroup Consultation
18 September 2012
Version 1.0
Page 44 of 87
Frequency Response -
Workgroup Consultation
18 September 2012
Version 1.0
Page 45 of 87
Annex 2 - Future Frequency Response Services
Frequency Response -
Workgroup Consultation
18 September 2012
Version 1.0
Page 46 of 87
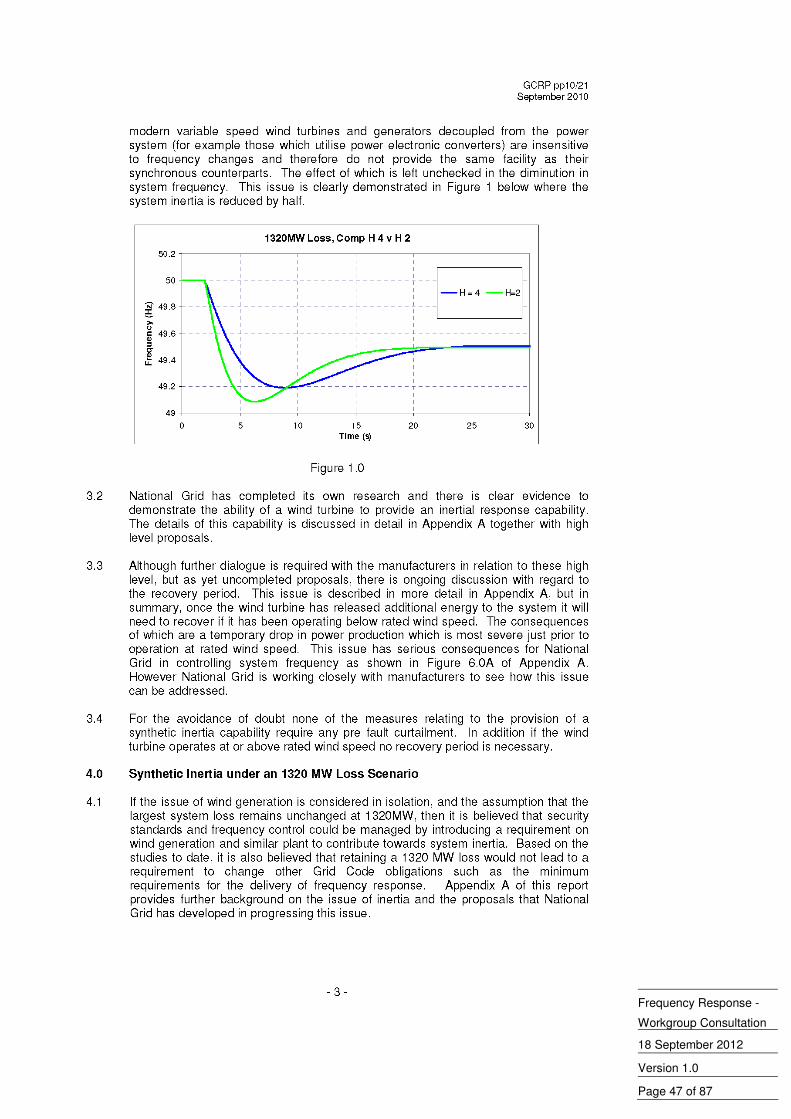
Frequency Response -
Workgroup Consultation
18 September 2012
Version 1.0
Page 47 of 87
Frequency Response -
Workgroup Consultation
18 September 2012
Version 1.0
Page 48 of 87
Frequency Response -
Workgroup Consultation
18 September 2012
Version 1.0
Page 49 of 87
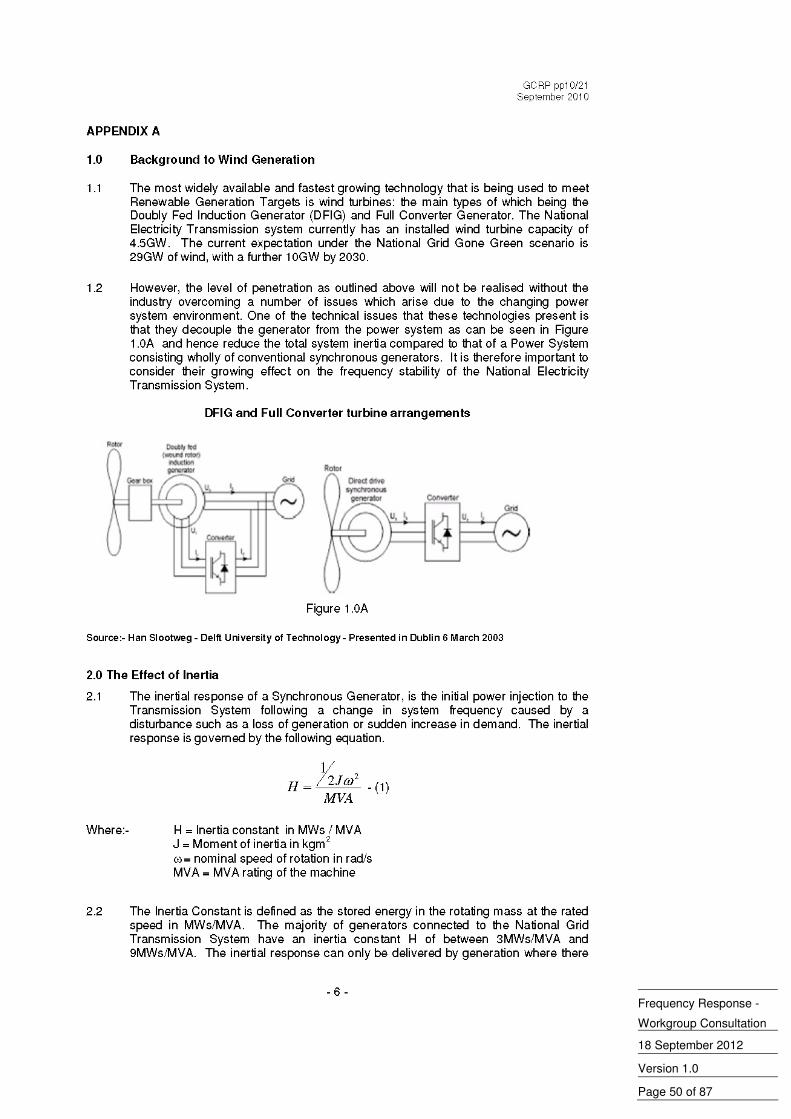
Frequency Response -
Workgroup Consultation
18 September 2012
Version 1.0
Page 50 of 87

Frequency Response -
Workgroup Consultation
18 September 2012
Version 1.0
Page 51 of 87
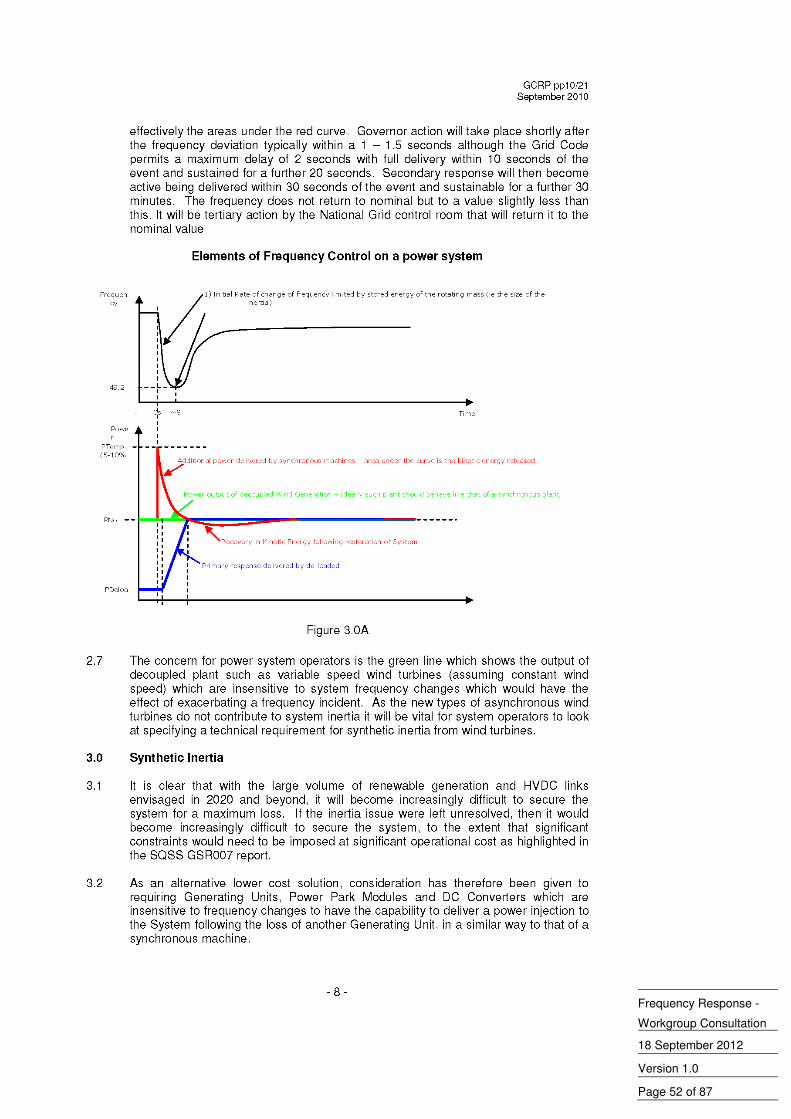
Frequency Response -
Workgroup Consultation
18 September 2012
Version 1.0
Page 52 of 87
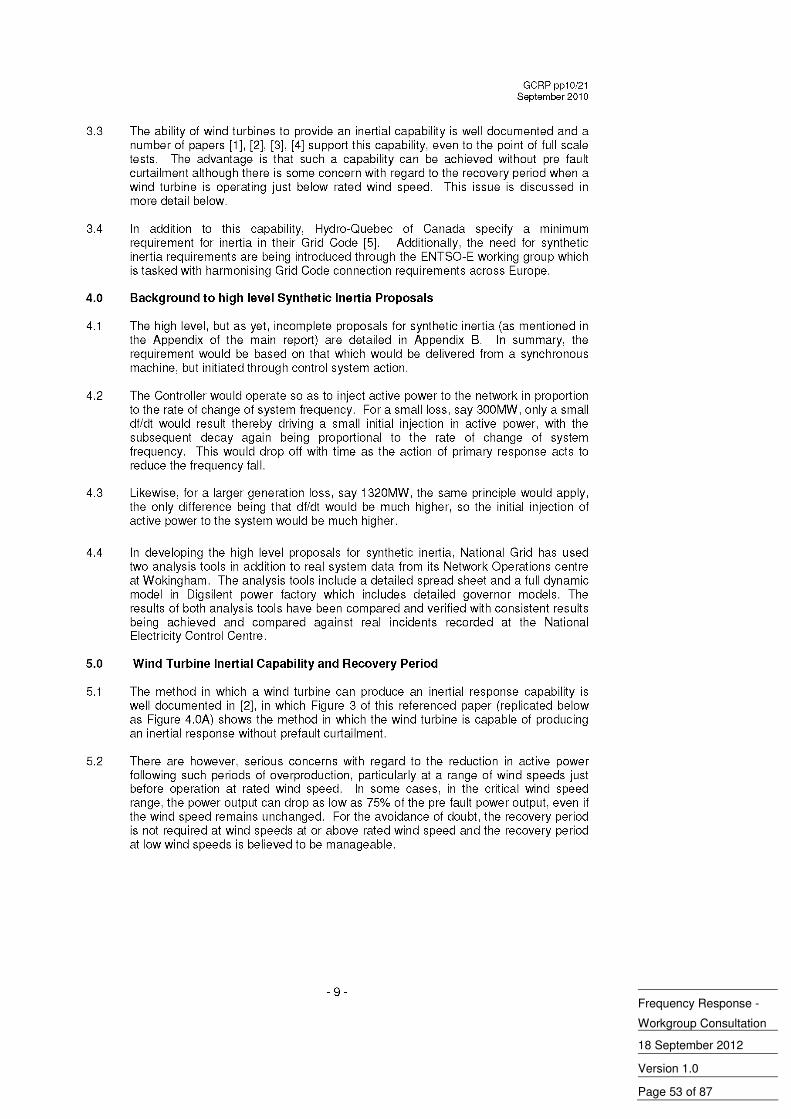
Frequency Response -
Workgroup Consultation
18 September 2012
Version 1.0
Page 53 of 87
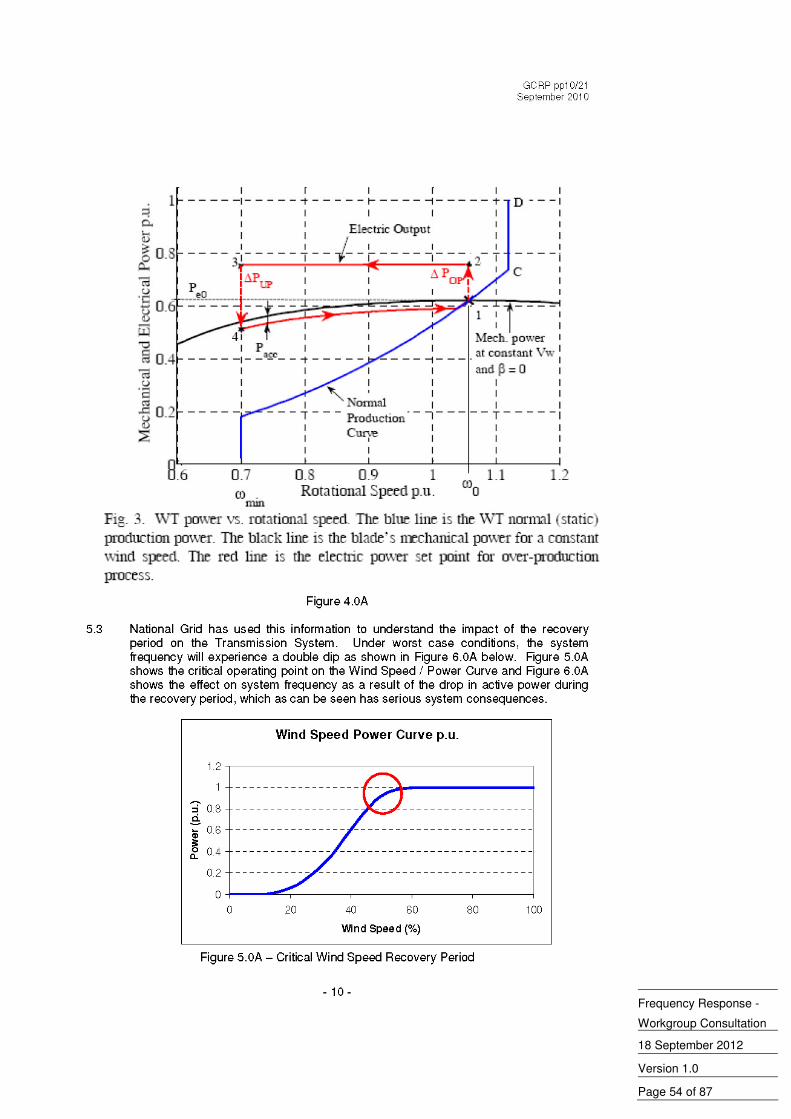
Frequency Response -
Workgroup Consultation
18 September 2012
Version 1.0
Page 54 of 87
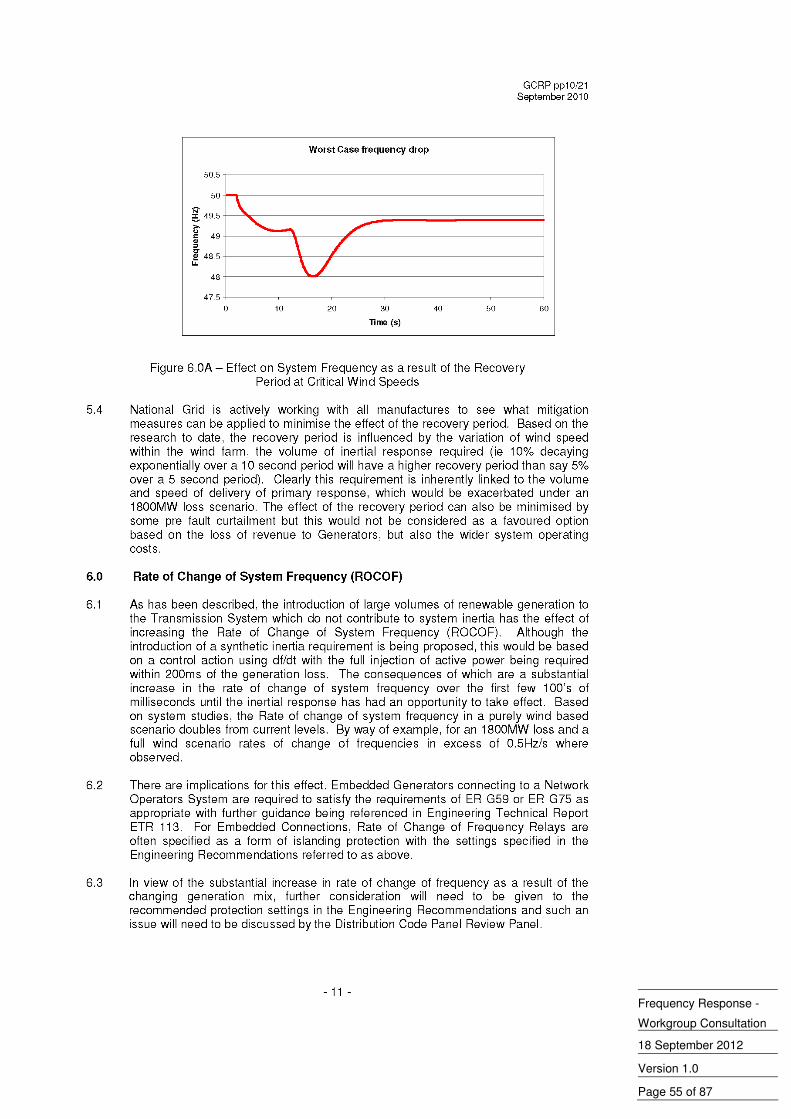
Frequency Response -
Workgroup Consultation
18 September 2012
Version 1.0
Page 55 of 87

Frequency Response -
Workgroup Consultation
18 September 2012
Version 1.0
Page 56 of 87
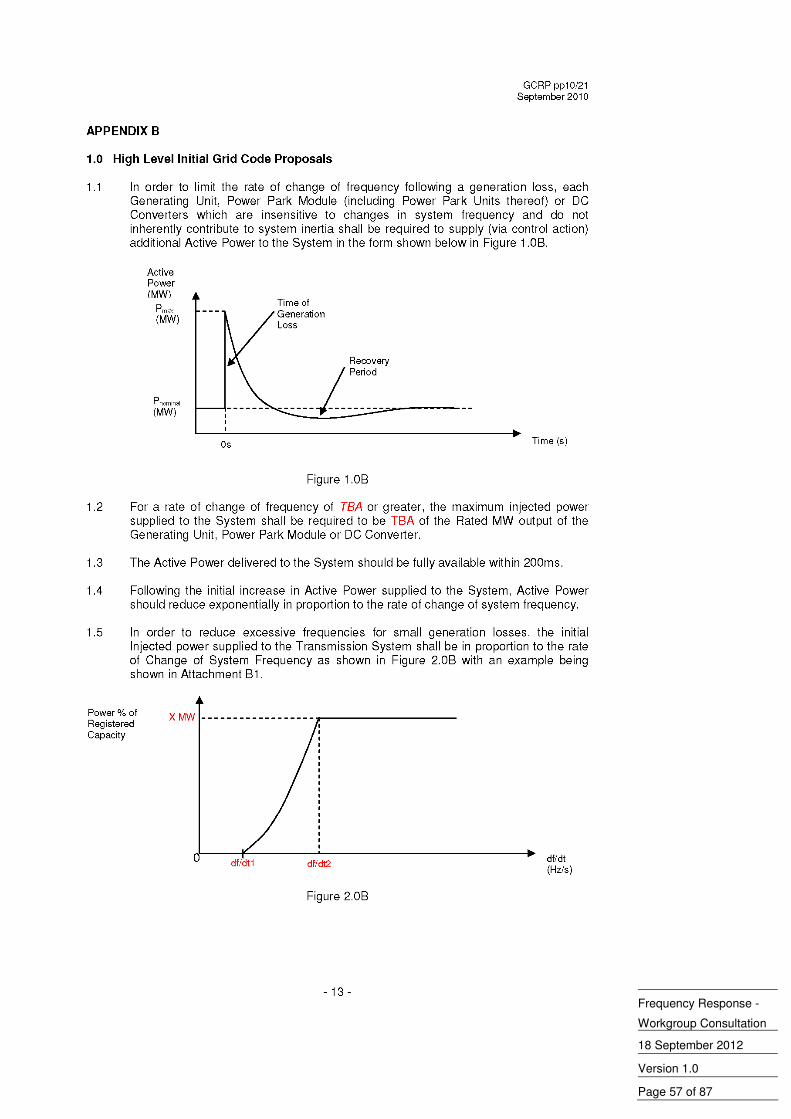
Frequency Response -
Workgroup Consultation
18 September 2012
Version 1.0
Page 57 of 87

Frequency Response -
Workgroup Consultation
18 September 2012
Version 1.0
Page 58 of 87
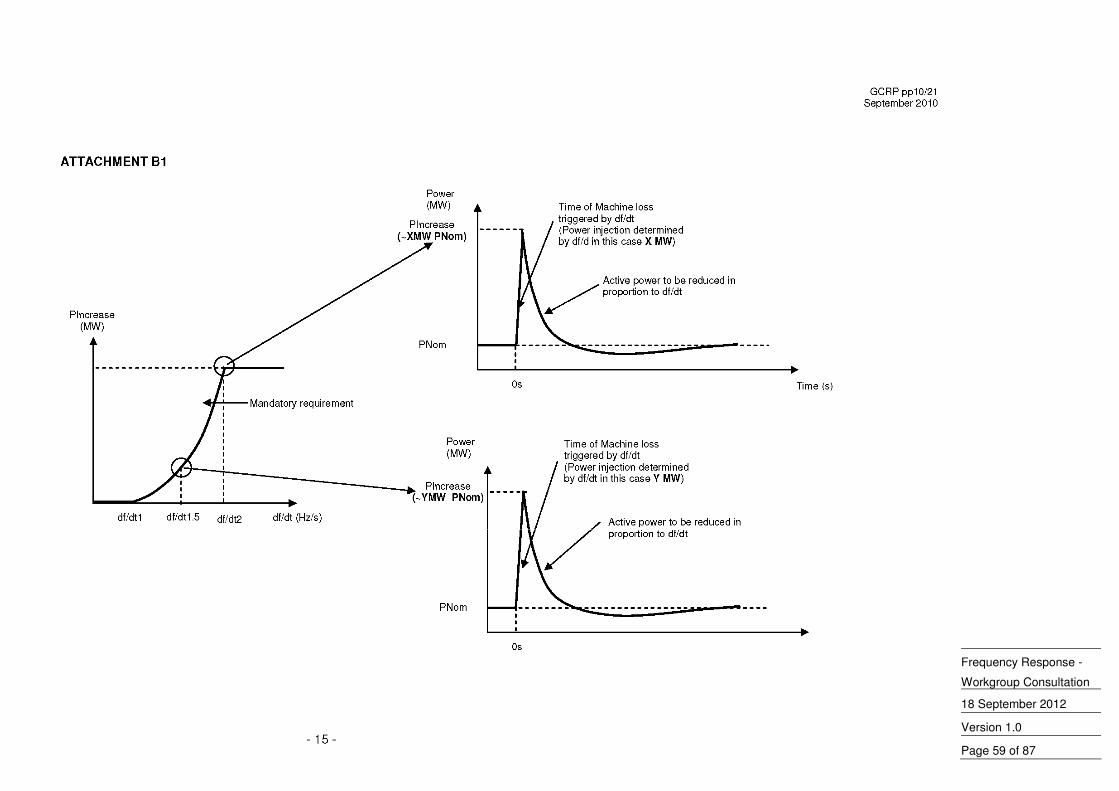
Frequency Response -
Workgroup Consultation
18 September 2012
Version 1.0
Page 59 of 87

Frequency Response -
Workgroup Consultation
18 September 2012
Version 1.0
Page 60 of 87
Annex 3 - FR Technical Subgroup Terms of Reference
Grid Code Frequency Response Technical Sub Group
Terms of Reference – dated November 2010
It was agreed at the 14th Frequency Response Working Group meeting to establish a Technical Sub Group. The Technical Sub Group would be tasked with assessing the volume of Frequency Response and inertial requirement for the transmission network.
Objectives
The Technical Sub Group will:
(i) determine the total volume of Transmission System Frequency Response and Synthetic Inertial requirements;
(ii) consider a largest secured loss of both 1320MW and 1800MW for the scenarios described in i) above; and
(iii) work on the initial assumption is that obligations are mandatory and equal.
Membership
Membership will be invited from relevant manufacturers, National Grid, Generators and a representative will be requested from the DCRP
Deliverables and timescales
Three meetings are anticipated. The Technical Sub Group will produce a technical report outlining its analysis, findings and recommendations which will be submitted to the Frequency Response Working Group by the end of February 2011. This will allow the Frequency Response Working Group to report to the September 2011 meeting.
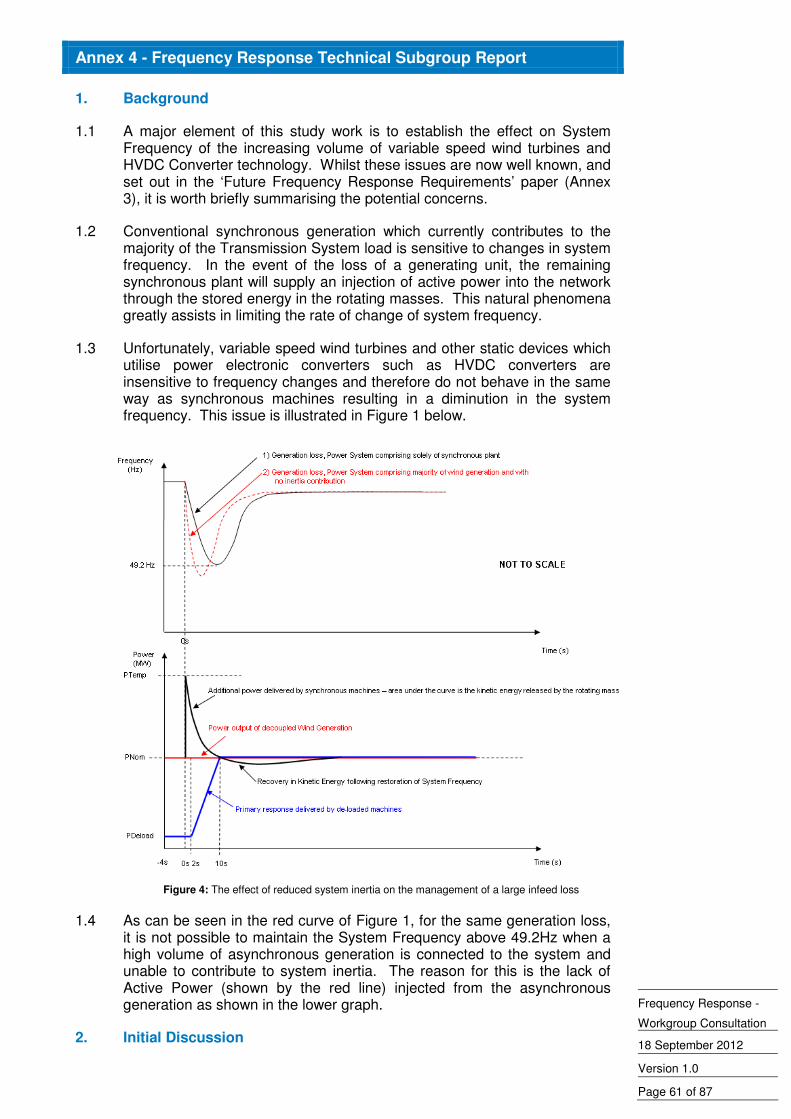
Frequency Response -
Workgroup Consultation
18 September 2012
Version 1.0
Page 61 of 87
Annex 4 - Frequency Response Technical Subgroup Report
1. Background
1.1 A major element of this study work is to establish the effect on System Frequency of the increasing volume of variable speed wind turbines and HVDC Converter technology. Whilst these issues are now well known, and set out in the ‘Future Frequency Response Requirements’ paper (Annex 3), it is worth briefly summarising the potential concerns.
1.2 Conventional synchronous generation which currently contributes to the majority of the Transmission System load is sensitive to changes in system frequency. In the event of the loss of a generating unit, the remaining synchronous plant will supply an injection of active power into the network through the stored energy in the rotating masses. This natural phenomena greatly assists in limiting the rate of change of system frequency.
1.3 Unfortunately, variable speed wind turbines and other static devices which utilise power electronic converters such as HVDC converters are insensitive to frequency changes and therefore do not behave in the same way as synchronous machines resulting in a diminution in the system frequency. This issue is illustrated in Figure 1 below.
Figure 4: The effect of reduced system inertia on the management of a large infeed loss
1.4 As can be seen in the red curve of Figure 1, for the same generation loss, it is not possible to maintain the System Frequency above 49.2Hz when a high volume of asynchronous generation is connected to the system and unable to contribute to system inertia. The reason for this is the lack of Active Power (shown by the red line) injected from the asynchronous generation as shown in the lower graph.
2. Initial Discussion
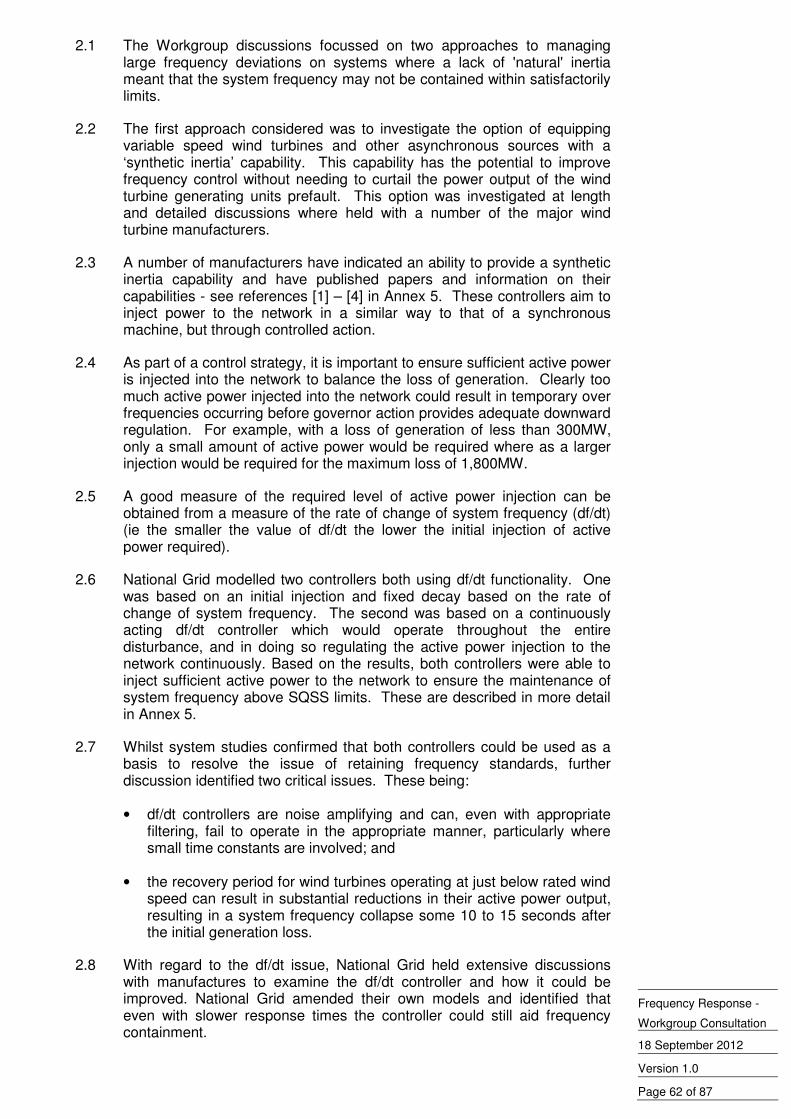
Frequency Response -
Workgroup Consultation
18 September 2012
Version 1.0
Page 62 of 87
2.1 The Workgroup discussions focussed on two approaches to managing large frequency deviations on systems where a lack of 'natural' inertia meant that the system frequency may not be contained within satisfactorily limits.
2.2 The first approach considered was to investigate the option of equipping variable speed wind turbines and other asynchronous sources with a ‘synthetic inertia’ capability. This capability has the potential to improve frequency control without needing to curtail the power output of the wind turbine generating units prefault. This option was investigated at length and detailed discussions where held with a number of the major wind turbine manufacturers.
2.3 A number of manufacturers have indicated an ability to provide a synthetic inertia capability and have published papers and information on their capabilities - see references [1] – [4] in Annex 5. These controllers aim to inject power to the network in a similar way to that of a synchronous machine, but through controlled action.
2.4 As part of a control strategy, it is important to ensure sufficient active power is injected into the network to balance the loss of generation. Clearly too much active power injected into the network could result in temporary over frequencies occurring before governor action provides adequate downward regulation. For example, with a loss of generation of less than 300MW, only a small amount of active power would be required where as a larger injection would be required for the maximum loss of 1,800MW.
2.5 A good measure of the required level of active power injection can be obtained from a measure of the rate of change of system frequency (df/dt) (ie the smaller the value of df/dt the lower the initial injection of active power required).
2.6 National Grid modelled two controllers both using df/dt functionality. One was based on an initial injection and fixed decay based on the rate of change of system frequency. The second was based on a continuously acting df/dt controller which would operate throughout the entire disturbance, and in doing so regulating the active power injection to the network continuously. Based on the results, both controllers were able to inject sufficient active power to the network to ensure the maintenance of system frequency above SQSS limits. These are described in more detail in Annex 5.
2.7 Whilst system studies confirmed that both controllers could be used as a basis to resolve the issue of retaining frequency standards, further discussion identified two critical issues. These being:
• df/dt controllers are noise amplifying and can, even with appropriate filtering, fail to operate in the appropriate manner, particularly where small time constants are involved; and
• the recovery period for wind turbines operating at just below rated wind speed can result in substantial reductions in their active power output, resulting in a system frequency collapse some 10 to 15 seconds after the initial generation loss.
2.8 With regard to the df/dt issue, National Grid held extensive discussions with manufactures to examine the df/dt controller and how it could be improved. National Grid amended their own models and identified that even with slower response times the controller could still aid frequency containment.
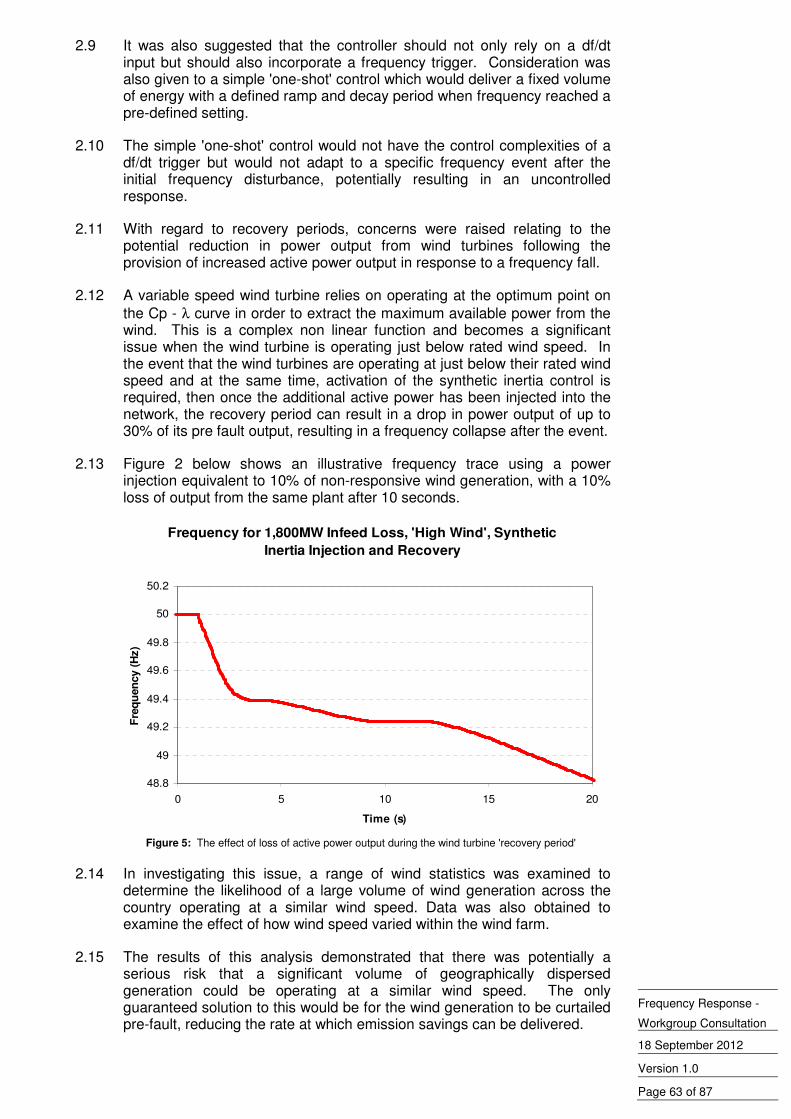
Frequency Response -
Workgroup Consultation
18 September 2012
Version 1.0
Page 63 of 87
2.9 It was also suggested that the controller should not only rely on a df/dt input but should also incorporate a frequency trigger. Consideration was also given to a simple 'one-shot' control which would deliver a fixed volume of energy with a defined ramp and decay period when frequency reached a pre-defined setting.
2.10 The simple 'one-shot' control would not have the control complexities of a df/dt trigger but would not adapt to a specific frequency event after the initial frequency disturbance, potentially resulting in an uncontrolled response.
2.11 With regard to recovery periods, concerns were raised relating to the potential reduction in power output from wind turbines following the provision of increased active power output in response to a frequency fall.
2.12 A variable speed wind turbine relies on operating at the optimum point on
the Cp - λ curve in order to extract the maximum available power from the wind. This is a complex non linear function and becomes a significant issue when the wind turbine is operating just below rated wind speed. In the event that the wind turbines are operating at just below their rated wind speed and at the same time, activation of the synthetic inertia control is required, then once the additional active power has been injected into the network, the recovery period can result in a drop in power output of up to 30% of its pre fault output, resulting in a frequency collapse after the event.
2.13 Figure 2 below shows an illustrative frequency trace using a power injection equivalent to 10% of non-responsive wind generation, with a 10% loss of output from the same plant after 10 seconds.
Frequency for 1,800MW Infeed Loss, 'High Wind', Synthetic
Inertia Injection and Recovery
48.8
49
49.2
49.4
49.6
49.8
50
50.2
0 5 10 15 20
Time (s)
Fre
qu
en
cy (
Hz)
Figure 5: The effect of loss of active power output during the wind turbine 'recovery period'
2.14 In investigating this issue, a range of wind statistics was examined to determine the likelihood of a large volume of wind generation across the country operating at a similar wind speed. Data was also obtained to examine the effect of how wind speed varied within the wind farm.
2.15 The results of this analysis demonstrated that there was potentially a serious risk that a significant volume of geographically dispersed generation could be operating at a similar wind speed. The only guaranteed solution to this would be for the wind generation to be curtailed pre-fault, reducing the rate at which emission savings can be delivered.
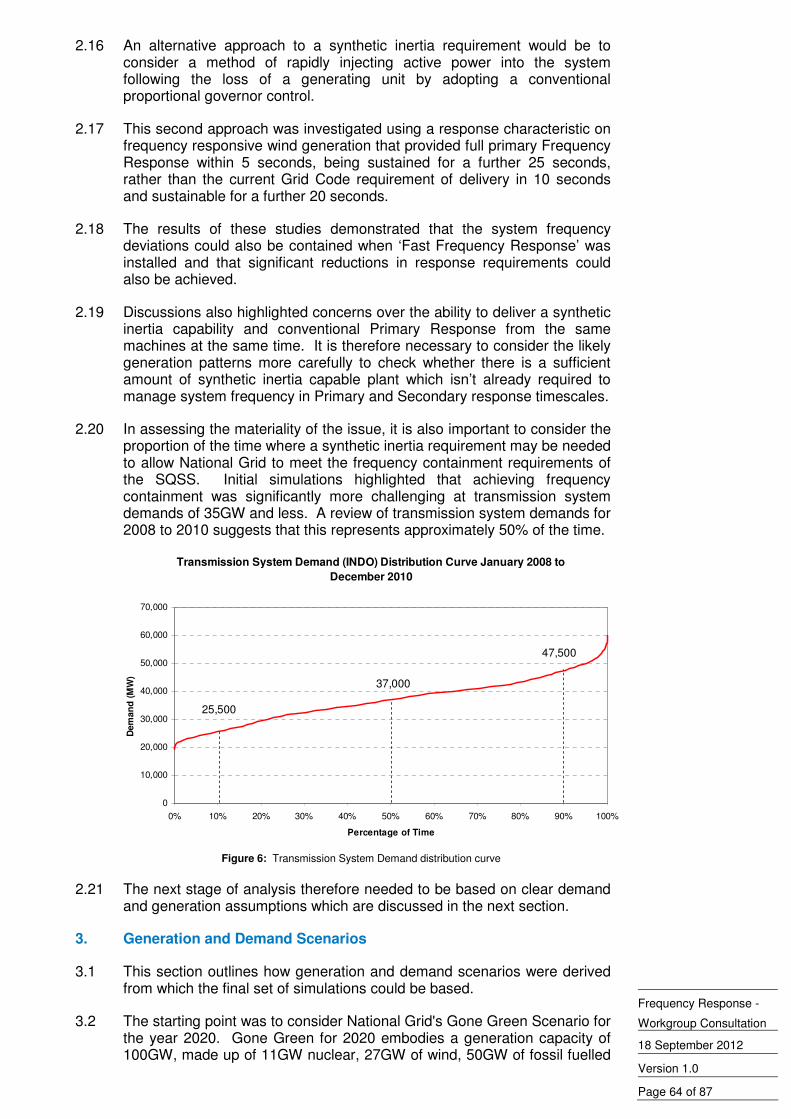
Frequency Response -
Workgroup Consultation
18 September 2012
Version 1.0
Page 64 of 87
2.16 An alternative approach to a synthetic inertia requirement would be to consider a method of rapidly injecting active power into the system following the loss of a generating unit by adopting a conventional proportional governor control.
2.17 This second approach was investigated using a response characteristic on frequency responsive wind generation that provided full primary Frequency Response within 5 seconds, being sustained for a further 25 seconds, rather than the current Grid Code requirement of delivery in 10 seconds and sustainable for a further 20 seconds.
2.18 The results of these studies demonstrated that the system frequency deviations could also be contained when ‘Fast Frequency Response’ was installed and that significant reductions in response requirements could also be achieved.
2.19 Discussions also highlighted concerns over the ability to deliver a synthetic inertia capability and conventional Primary Response from the same machines at the same time. It is therefore necessary to consider the likely generation patterns more carefully to check whether there is a sufficient amount of synthetic inertia capable plant which isn’t already required to manage system frequency in Primary and Secondary response timescales.
2.20 In assessing the materiality of the issue, it is also important to consider the proportion of the time where a synthetic inertia requirement may be needed to allow National Grid to meet the frequency containment requirements of the SQSS. Initial simulations highlighted that achieving frequency containment was significantly more challenging at transmission system demands of 35GW and less. A review of transmission system demands for 2008 to 2010 suggests that this represents approximately 50% of the time.
Transmission System Demand (INDO) Distribution Curve January 2008 to
December 2010
47,500
37,000
25,500
0
10,000
20,000
30,000
40,000
50,000
60,000
70,000
0% 10% 20% 30% 40% 50% 60% 70% 80% 90% 100%
Percentage of Time
Dem
an
d (
MW
)
Figure 6: Transmission System Demand distribution curve
2.21 The next stage of analysis therefore needed to be based on clear demand and generation assumptions which are discussed in the next section.
3. Generation and Demand Scenarios
3.1 This section outlines how generation and demand scenarios were derived from which the final set of simulations could be based.
3.2 The starting point was to consider National Grid's Gone Green Scenario for the year 2020. Gone Green for 2020 embodies a generation capacity of 100GW, made up of 11GW nuclear, 27GW of wind, 50GW of fossil fuelled
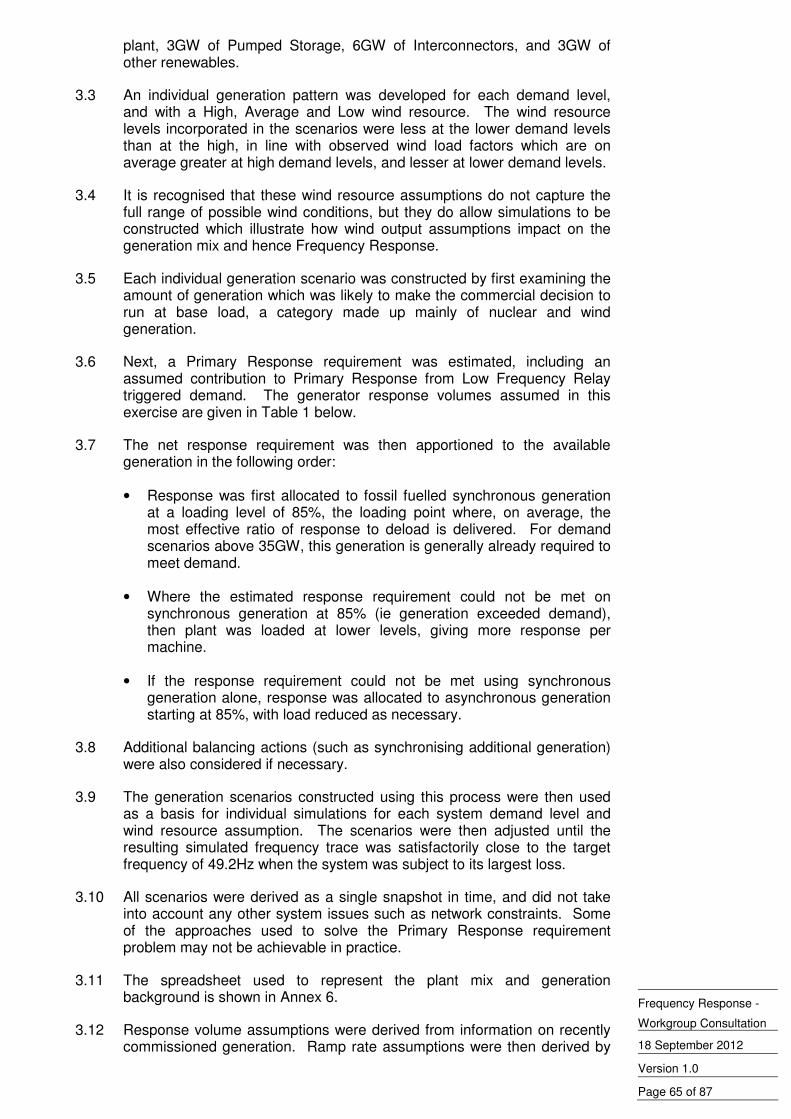
Frequency Response -
Workgroup Consultation
18 September 2012
Version 1.0
Page 65 of 87
plant, 3GW of Pumped Storage, 6GW of Interconnectors, and 3GW of other renewables.
3.3 An individual generation pattern was developed for each demand level, and with a High, Average and Low wind resource. The wind resource levels incorporated in the scenarios were less at the lower demand levels than at the high, in line with observed wind load factors which are on average greater at high demand levels, and lesser at lower demand levels.
3.4 It is recognised that these wind resource assumptions do not capture the full range of possible wind conditions, but they do allow simulations to be constructed which illustrate how wind output assumptions impact on the generation mix and hence Frequency Response.
3.5 Each individual generation scenario was constructed by first examining the amount of generation which was likely to make the commercial decision to run at base load, a category made up mainly of nuclear and wind generation.
3.6 Next, a Primary Response requirement was estimated, including an assumed contribution to Primary Response from Low Frequency Relay triggered demand. The generator response volumes assumed in this exercise are given in Table 1 below.
3.7 The net response requirement was then apportioned to the available generation in the following order:
• Response was first allocated to fossil fuelled synchronous generation at a loading level of 85%, the loading point where, on average, the most effective ratio of response to deload is delivered. For demand scenarios above 35GW, this generation is generally already required to meet demand.
• Where the estimated response requirement could not be met on synchronous generation at 85% (ie generation exceeded demand), then plant was loaded at lower levels, giving more response per machine.
• If the response requirement could not be met using synchronous generation alone, response was allocated to asynchronous generation starting at 85%, with load reduced as necessary.
3.8 Additional balancing actions (such as synchronising additional generation) were also considered if necessary.
3.9 The generation scenarios constructed using this process were then used as a basis for individual simulations for each system demand level and wind resource assumption. The scenarios were then adjusted until the resulting simulated frequency trace was satisfactorily close to the target frequency of 49.2Hz when the system was subject to its largest loss.
3.10 All scenarios were derived as a single snapshot in time, and did not take into account any other system issues such as network constraints. Some of the approaches used to solve the Primary Response requirement problem may not be achievable in practice.
3.11 The spreadsheet used to represent the plant mix and generation background is shown in Annex 6.
3.12 Response volume assumptions were derived from information on recently commissioned generation. Ramp rate assumptions were then derived by
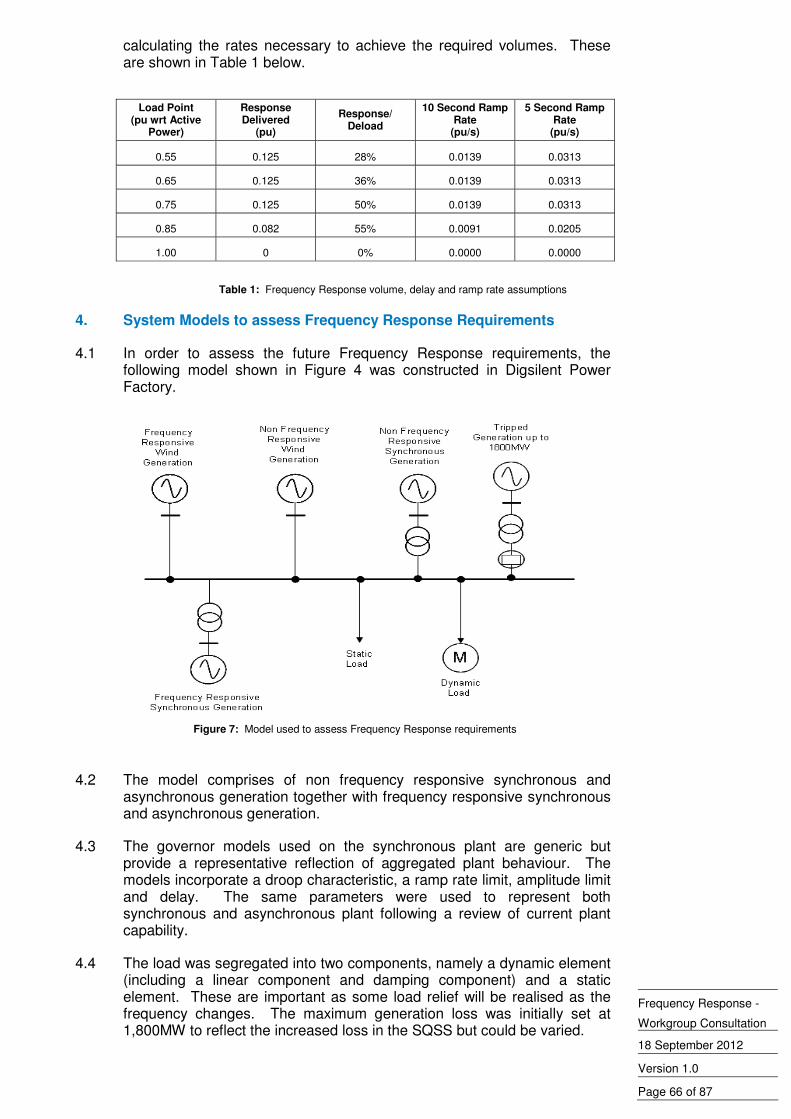
Frequency Response -
Workgroup Consultation
18 September 2012
Version 1.0
Page 66 of 87
calculating the rates necessary to achieve the required volumes. These are shown in Table 1 below.
4. System Models to assess Frequency Response Requirements
4.1 In order to assess the future Frequency Response requirements, the following model shown in Figure 4 was constructed in Digsilent Power Factory.
Figure 7: Model used to assess Frequency Response requirements
4.2 The model comprises of non frequency responsive synchronous and asynchronous generation together with frequency responsive synchronous and asynchronous generation.
4.3 The governor models used on the synchronous plant are generic but provide a representative reflection of aggregated plant behaviour. The models incorporate a droop characteristic, a ramp rate limit, amplitude limit and delay. The same parameters were used to represent both synchronous and asynchronous plant following a review of current plant capability.
4.4 The load was segregated into two components, namely a dynamic element (including a linear component and damping component) and a static element. These are important as some load relief will be realised as the frequency changes. The maximum generation loss was initially set at 1,800MW to reflect the increased loss in the SQSS but could be varied.
Load Point (pu wrt Active
Power)
Response Delivered
(pu)
Response/ Deload
10 Second Ramp Rate
(pu/s)
5 Second Ramp Rate
(pu/s)
0.55 0.125 28% 0.0139 0.0313
0.65 0.125 36% 0.0139 0.0313
0.75 0.125 50% 0.0139 0.0313
0.85 0.082 55% 0.0091 0.0205
1.00 0 0% 0.0000 0.0000
Table 1: Frequency Response volume, delay and ramp rate assumptions
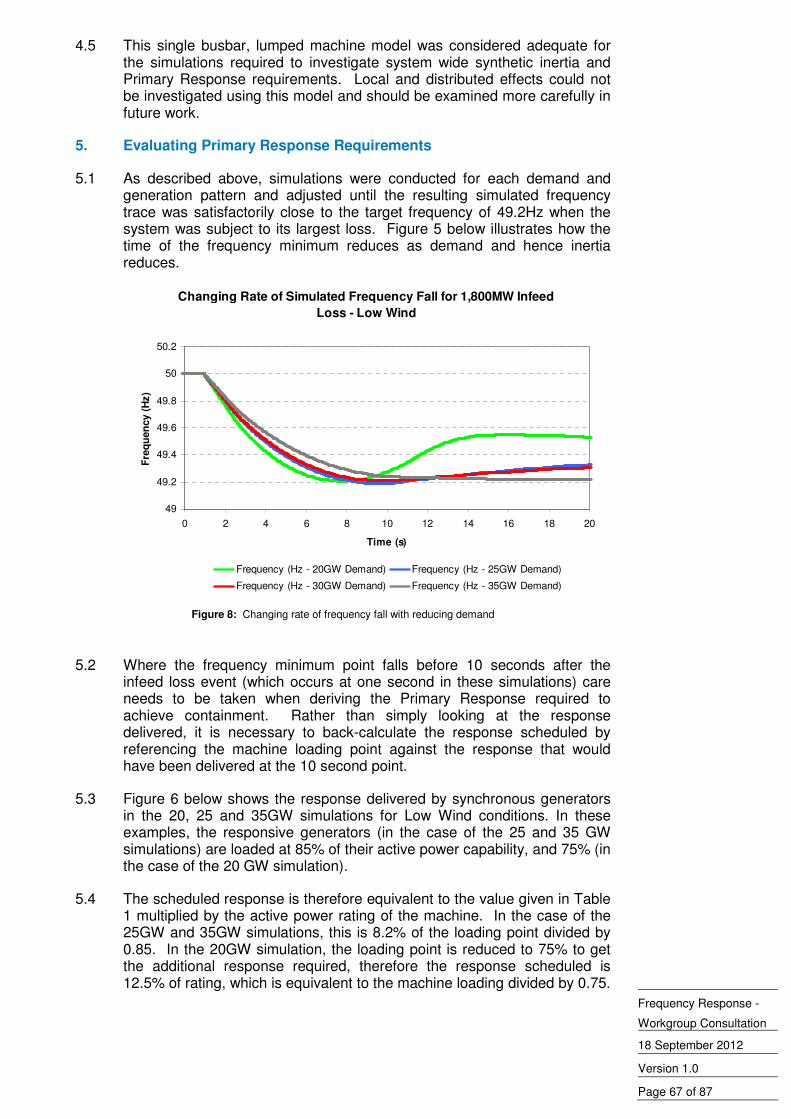
Frequency Response -
Workgroup Consultation
18 September 2012
Version 1.0
Page 67 of 87
4.5 This single busbar, lumped machine model was considered adequate for the simulations required to investigate system wide synthetic inertia and Primary Response requirements. Local and distributed effects could not be investigated using this model and should be examined more carefully in future work.
5. Evaluating Primary Response Requirements
5.1 As described above, simulations were conducted for each demand and generation pattern and adjusted until the resulting simulated frequency trace was satisfactorily close to the target frequency of 49.2Hz when the system was subject to its largest loss. Figure 5 below illustrates how the time of the frequency minimum reduces as demand and hence inertia reduces.
Changing Rate of Simulated Frequency Fall for 1,800MW Infeed
Loss - Low Wind
49
49.2
49.4
49.6
49.8
50
50.2
0 2 4 6 8 10 12 14 16 18 20
Time (s)
Fre
qu
en
cy (
Hz)
Frequency (Hz - 20GW Demand) Frequency (Hz - 25GW Demand)
Frequency (Hz - 30GW Demand) Frequency (Hz - 35GW Demand)
Figure 8: Changing rate of frequency fall with reducing demand
5.2 Where the frequency minimum point falls before 10 seconds after the infeed loss event (which occurs at one second in these simulations) care needs to be taken when deriving the Primary Response required to achieve containment. Rather than simply looking at the response delivered, it is necessary to back-calculate the response scheduled by referencing the machine loading point against the response that would have been delivered at the 10 second point.
5.3 Figure 6 below shows the response delivered by synchronous generators in the 20, 25 and 35GW simulations for Low Wind conditions. In these examples, the responsive generators (in the case of the 25 and 35 GW simulations) are loaded at 85% of their active power capability, and 75% (in the case of the 20 GW simulation).
5.4 The scheduled response is therefore equivalent to the value given in Table 1 multiplied by the active power rating of the machine. In the case of the 25GW and 35GW simulations, this is 8.2% of the loading point divided by 0.85. In the 20GW simulation, the loading point is reduced to 75% to get the additional response required, therefore the response scheduled is 12.5% of rating, which is equivalent to the machine loading divided by 0.75.
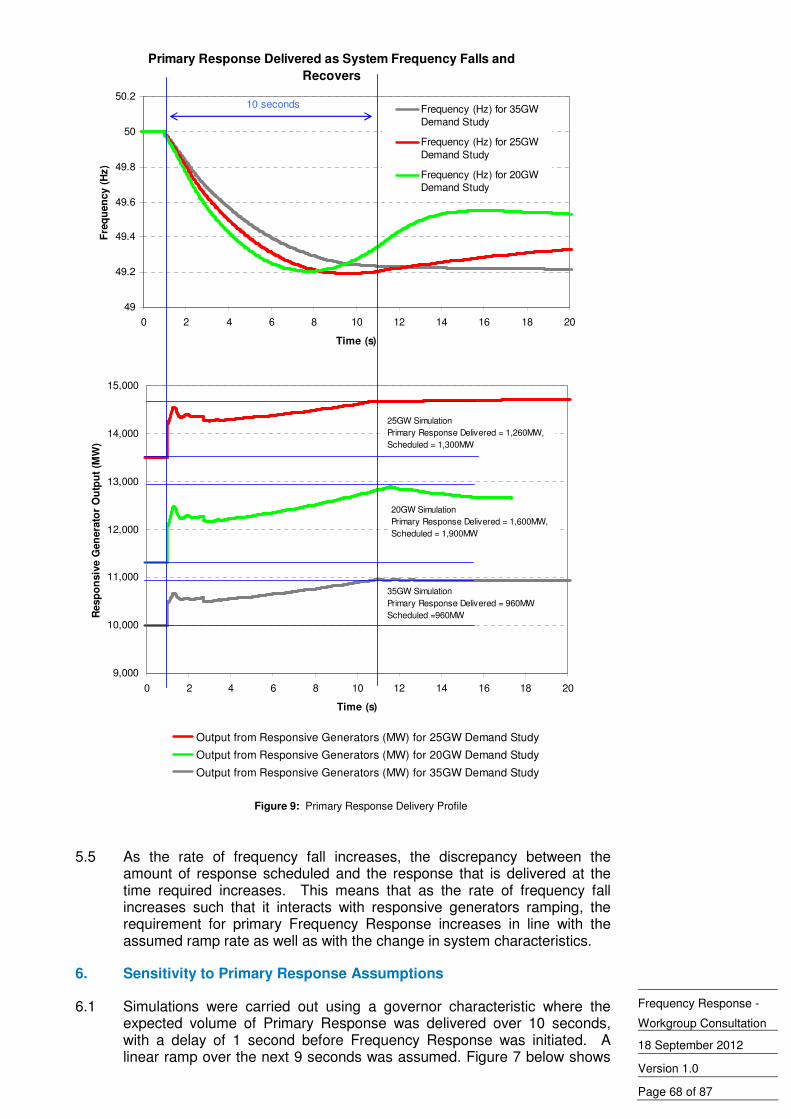
Frequency Response -
Workgroup Consultation
18 September 2012
Version 1.0
Page 68 of 87
Primary Response Delivered as System Frequency Falls and
Recovers
49
49.2
49.4
49.6
49.8
50
50.2
0 2 4 6 8 10 12 14 16 18 20
Time (s)
Fre
qu
en
cy (
Hz)
Frequency (Hz) for 35GW
Demand Study
Frequency (Hz) for 25GW
Demand Study
Frequency (Hz) for 20GW
Demand Study
9,000
10,000
11,000
12,000
13,000
14,000
15,000
0 2 4 6 8 10 12 14 16 18 20
Time (s)
Resp
on
siv
e G
en
era
tor
Ou
tpu
t (M
W)
Output from Responsive Generators (MW) for 25GW Demand Study
Output from Responsive Generators (MW) for 20GW Demand Study
Output from Responsive Generators (MW) for 35GW Demand Study
25GW Simulation
Primary Response Delivered = 1,260MW,
Scheduled = 1,300MW
35GW Simulation
Primary Response Delivered = 960MW
Scheduled =960MW
20GW Simulation
Primary Response Delivered = 1,600MW,
Scheduled = 1,900MW
10 seconds
Figure 9: Primary Response Delivery Profile
5.5 As the rate of frequency fall increases, the discrepancy between the amount of response scheduled and the response that is delivered at the time required increases. This means that as the rate of frequency fall increases such that it interacts with responsive generators ramping, the requirement for primary Frequency Response increases in line with the assumed ramp rate as well as with the change in system characteristics.
6. Sensitivity to Primary Response Assumptions
6.1 Simulations were carried out using a governor characteristic where the expected volume of Primary Response was delivered over 10 seconds, with a delay of 1 second before Frequency Response was initiated. A linear ramp over the next 9 seconds was assumed. Figure 7 below shows
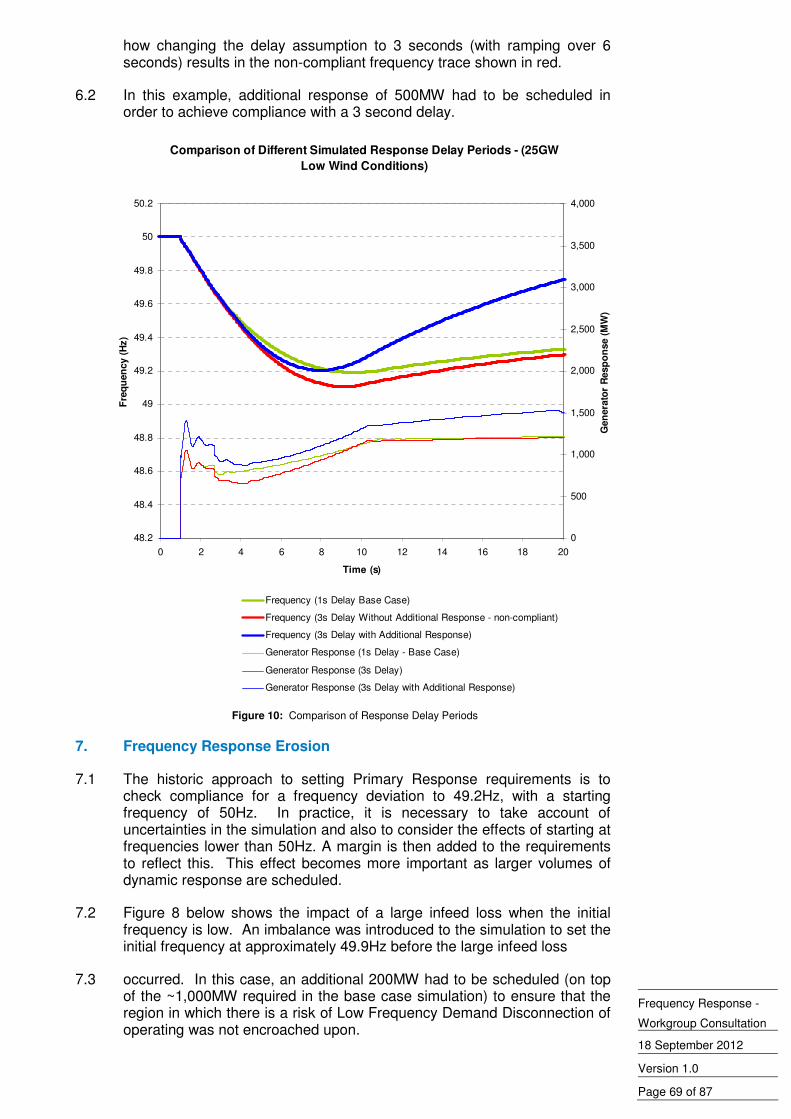
Frequency Response -
Workgroup Consultation
18 September 2012
Version 1.0
Page 69 of 87
how changing the delay assumption to 3 seconds (with ramping over 6 seconds) results in the non-compliant frequency trace shown in red.
6.2 In this example, additional response of 500MW had to be scheduled in order to achieve compliance with a 3 second delay.
Comparison of Different Simulated Response Delay Periods - (25GW
Low Wind Conditions)
48.2
48.4
48.6
48.8
49
49.2
49.4
49.6
49.8
50
50.2
0 2 4 6 8 10 12 14 16 18 20
Time (s)
Fre
qu
en
cy (
Hz)
0
500
1,000
1,500
2,000
2,500
3,000
3,500
4,000
Gen
era
tor
Resp
on
se (
MW
)Frequency (1s Delay Base Case)
Frequency (3s Delay Without Additional Response - non-compliant)
Frequency (3s Delay with Additional Response)
Generator Response (1s Delay - Base Case)
Generator Response (3s Delay)
Generator Response (3s Delay with Additional Response)
Figure 10: Comparison of Response Delay Periods
7. Frequency Response Erosion
7.1 The historic approach to setting Primary Response requirements is to check compliance for a frequency deviation to 49.2Hz, with a starting frequency of 50Hz. In practice, it is necessary to take account of uncertainties in the simulation and also to consider the effects of starting at frequencies lower than 50Hz. A margin is then added to the requirements to reflect this. This effect becomes more important as larger volumes of dynamic response are scheduled.
7.2 Figure 8 below shows the impact of a large infeed loss when the initial frequency is low. An imbalance was introduced to the simulation to set the initial frequency at approximately 49.9Hz before the large infeed loss
7.3 occurred. In this case, an additional 200MW had to be scheduled (on top of the ~1,000MW required in the base case simulation) to ensure that the region in which there is a risk of Low Frequency Demand Disconnection of operating was not encroached upon.
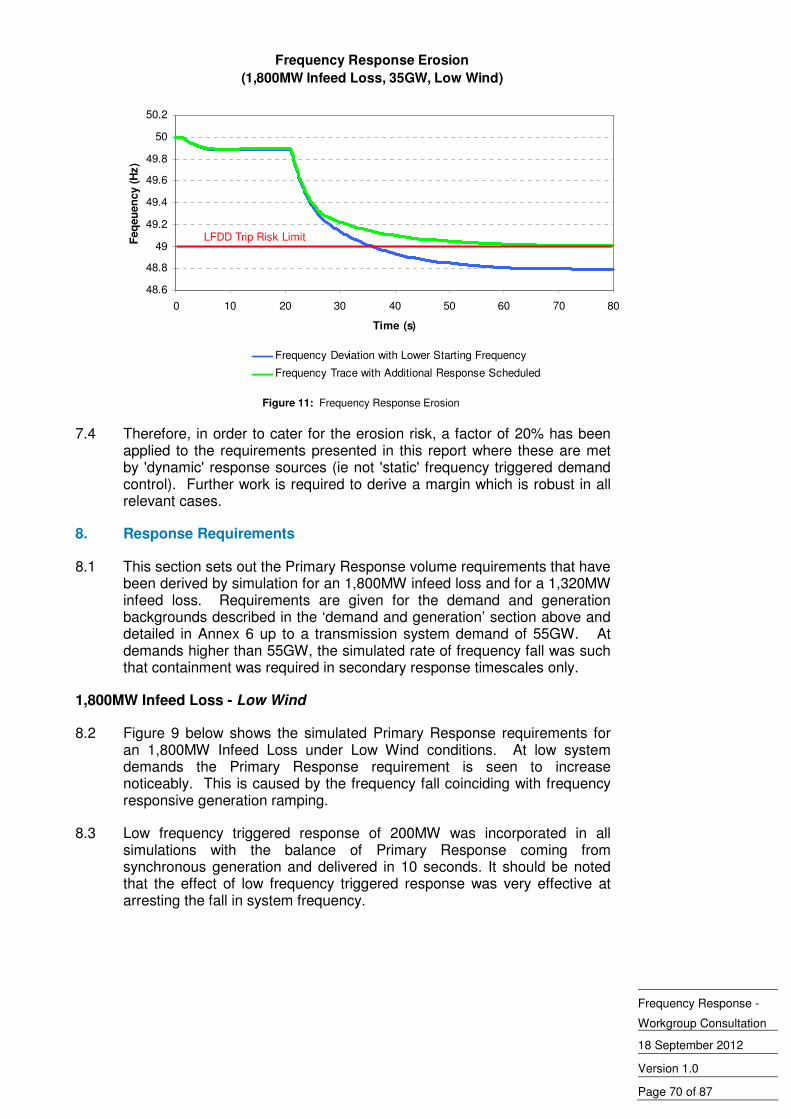
Frequency Response -
Workgroup Consultation
18 September 2012
Version 1.0
Page 70 of 87
Frequency Response Erosion
(1,800MW Infeed Loss, 35GW, Low Wind)
48.6
48.8
49
49.2
49.4
49.6
49.8
50
50.2
0 10 20 30 40 50 60 70 80
Time (s)
Feq
eu
en
cy (
Hz)
Frequency Deviation with Lower Starting Frequency
Frequency Trace with Additional Response Scheduled
LFDD Trip Risk Limit
Figure 11: Frequency Response Erosion
7.4 Therefore, in order to cater for the erosion risk, a factor of 20% has been applied to the requirements presented in this report where these are met by 'dynamic' response sources (ie not 'static' frequency triggered demand control). Further work is required to derive a margin which is robust in all relevant cases.
8. Response Requirements
8.1 This section sets out the Primary Response volume requirements that have been derived by simulation for an 1,800MW infeed loss and for a 1,320MW infeed loss. Requirements are given for the demand and generation backgrounds described in the ‘demand and generation’ section above and detailed in Annex 6 up to a transmission system demand of 55GW. At demands higher than 55GW, the simulated rate of frequency fall was such that containment was required in secondary response timescales only.
1,800MW Infeed Loss - Low Wind
8.2 Figure 9 below shows the simulated Primary Response requirements for an 1,800MW Infeed Loss under Low Wind conditions. At low system demands the Primary Response requirement is seen to increase noticeably. This is caused by the frequency fall coinciding with frequency responsive generation ramping.
8.3 Low frequency triggered response of 200MW was incorporated in all simulations with the balance of Primary Response coming from synchronous generation and delivered in 10 seconds. It should be noted that the effect of low frequency triggered response was very effective at arresting the fall in system frequency.
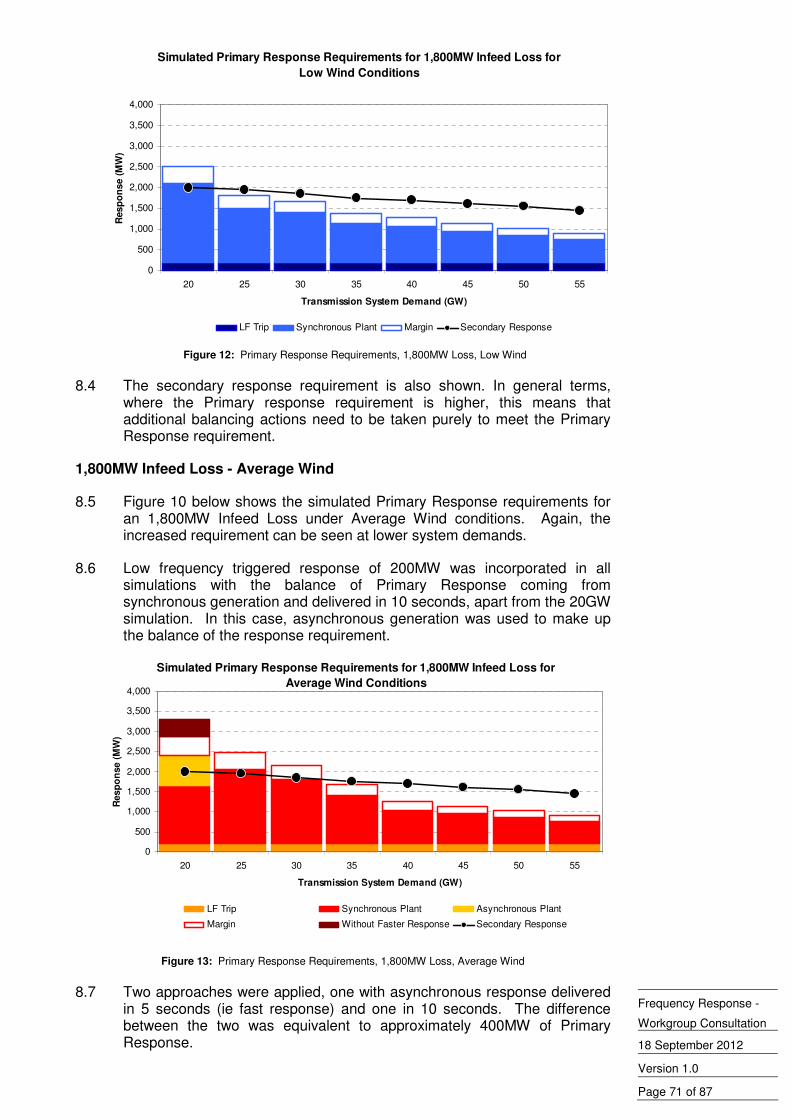
Frequency Response -
Workgroup Consultation
18 September 2012
Version 1.0
Page 71 of 87
Simulated Primary Response Requirements for 1,800MW Infeed Loss for
Low Wind Conditions
0
500
1,000
1,500
2,000
2,500
3,000
3,500
4,000
20 25 30 35 40 45 50 55
Transmission System Demand (GW)
Resp
on
se (
MW
)
LF Trip Synchronous Plant Margin Secondary Response
Figure 12: Primary Response Requirements, 1,800MW Loss, Low Wind
8.4 The secondary response requirement is also shown. In general terms, where the Primary response requirement is higher, this means that additional balancing actions need to be taken purely to meet the Primary Response requirement.
1,800MW Infeed Loss - Average Wind
8.5 Figure 10 below shows the simulated Primary Response requirements for an 1,800MW Infeed Loss under Average Wind conditions. Again, the increased requirement can be seen at lower system demands.
8.6 Low frequency triggered response of 200MW was incorporated in all simulations with the balance of Primary Response coming from synchronous generation and delivered in 10 seconds, apart from the 20GW simulation. In this case, asynchronous generation was used to make up the balance of the response requirement.
Simulated Primary Response Requirements for 1,800MW Infeed Loss for
Average Wind Conditions
0
500
1,000
1,500
2,000
2,500
3,000
3,500
4,000
20 25 30 35 40 45 50 55
Transmission System Demand (GW)
Res
po
nse (
MW
)
LF Trip Synchronous Plant Asynchronous Plant
Margin Without Faster Response Secondary Response
Figure 13: Primary Response Requirements, 1,800MW Loss, Average Wind
8.7 Two approaches were applied, one with asynchronous response delivered in 5 seconds (ie fast response) and one in 10 seconds. The difference between the two was equivalent to approximately 400MW of Primary Response.
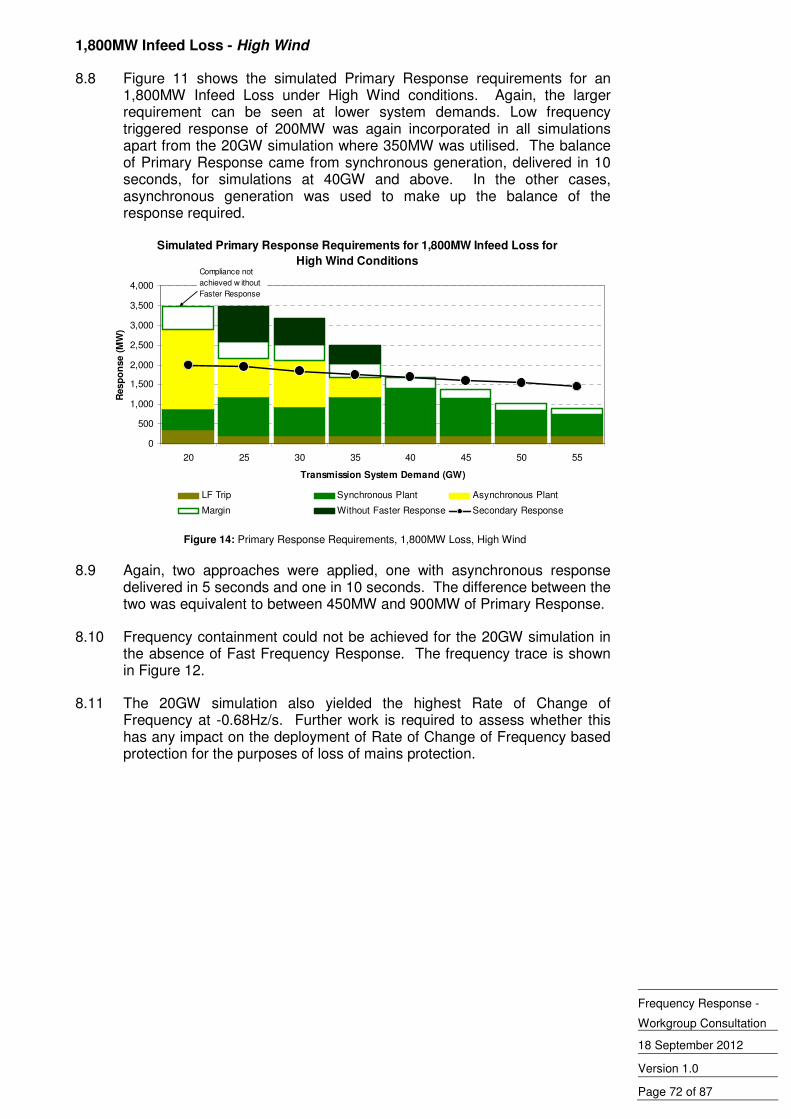
Frequency Response -
Workgroup Consultation
18 September 2012
Version 1.0
Page 72 of 87
1,800MW Infeed Loss - High Wind
8.8 Figure 11 shows the simulated Primary Response requirements for an 1,800MW Infeed Loss under High Wind conditions. Again, the larger requirement can be seen at lower system demands. Low frequency triggered response of 200MW was again incorporated in all simulations apart from the 20GW simulation where 350MW was utilised. The balance of Primary Response came from synchronous generation, delivered in 10 seconds, for simulations at 40GW and above. In the other cases, asynchronous generation was used to make up the balance of the response required.
Simulated Primary Response Requirements for 1,800MW Infeed Loss for
High Wind Conditions
0
500
1,000
1,500
2,000
2,500
3,000
3,500
4,000
20 25 30 35 40 45 50 55
Transmission System Demand (GW)
Resp
on
se (
MW
)
LF Trip Synchronous Plant Asynchronous Plant
Margin Without Faster Response Secondary Response
Compliance not
achieved w ithout
Faster Response
Figure 14: Primary Response Requirements, 1,800MW Loss, High Wind
8.9 Again, two approaches were applied, one with asynchronous response delivered in 5 seconds and one in 10 seconds. The difference between the two was equivalent to between 450MW and 900MW of Primary Response.
8.10 Frequency containment could not be achieved for the 20GW simulation in the absence of Fast Frequency Response. The frequency trace is shown in Figure 12.
8.11 The 20GW simulation also yielded the highest Rate of Change of Frequency at -0.68Hz/s. Further work is required to assess whether this has any impact on the deployment of Rate of Change of Frequency based protection for the purposes of loss of mains protection.
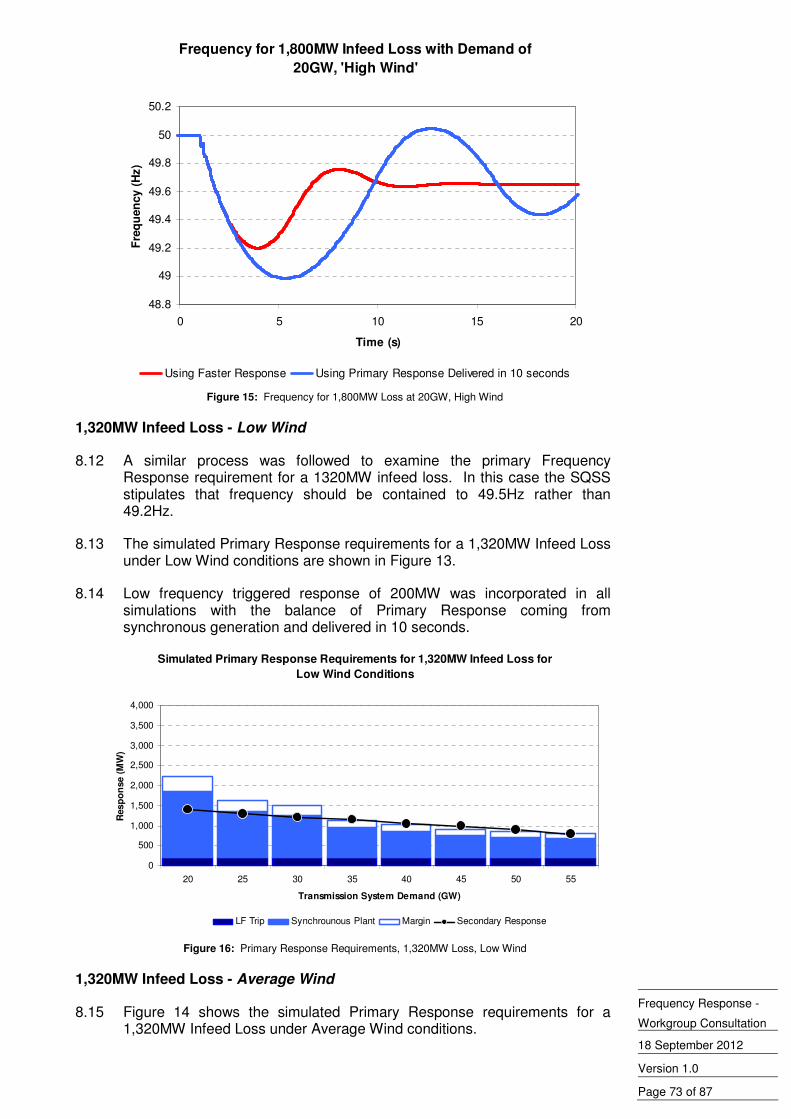
Frequency Response -
Workgroup Consultation
18 September 2012
Version 1.0
Page 73 of 87
Frequency for 1,800MW Infeed Loss with Demand of
20GW, 'High Wind'
48.8
49
49.2
49.4
49.6
49.8
50
50.2
0 5 10 15 20
Time (s)
Fre
qu
en
cy (
Hz)
Using Faster Response Using Primary Response Delivered in 10 seconds Figure 15: Frequency for 1,800MW Loss at 20GW, High Wind
1,320MW Infeed Loss - Low Wind
8.12 A similar process was followed to examine the primary Frequency Response requirement for a 1320MW infeed loss. In this case the SQSS stipulates that frequency should be contained to 49.5Hz rather than 49.2Hz.
8.13 The simulated Primary Response requirements for a 1,320MW Infeed Loss under Low Wind conditions are shown in Figure 13.
8.14 Low frequency triggered response of 200MW was incorporated in all simulations with the balance of Primary Response coming from synchronous generation and delivered in 10 seconds.
Simulated Primary Response Requirements for 1,320MW Infeed Loss for
Low Wind Conditions
0
500
1,000
1,500
2,000
2,500
3,000
3,500
4,000
20 25 30 35 40 45 50 55
Transmission System Demand (GW)
Resp
on
se (
MW
)
LF Trip Synchrounous Plant Margin Secondary Response
Figure 16: Primary Response Requirements, 1,320MW Loss, Low Wind
1,320MW Infeed Loss - Average Wind
8.15 Figure 14 shows the simulated Primary Response requirements for a 1,320MW Infeed Loss under Average Wind conditions.
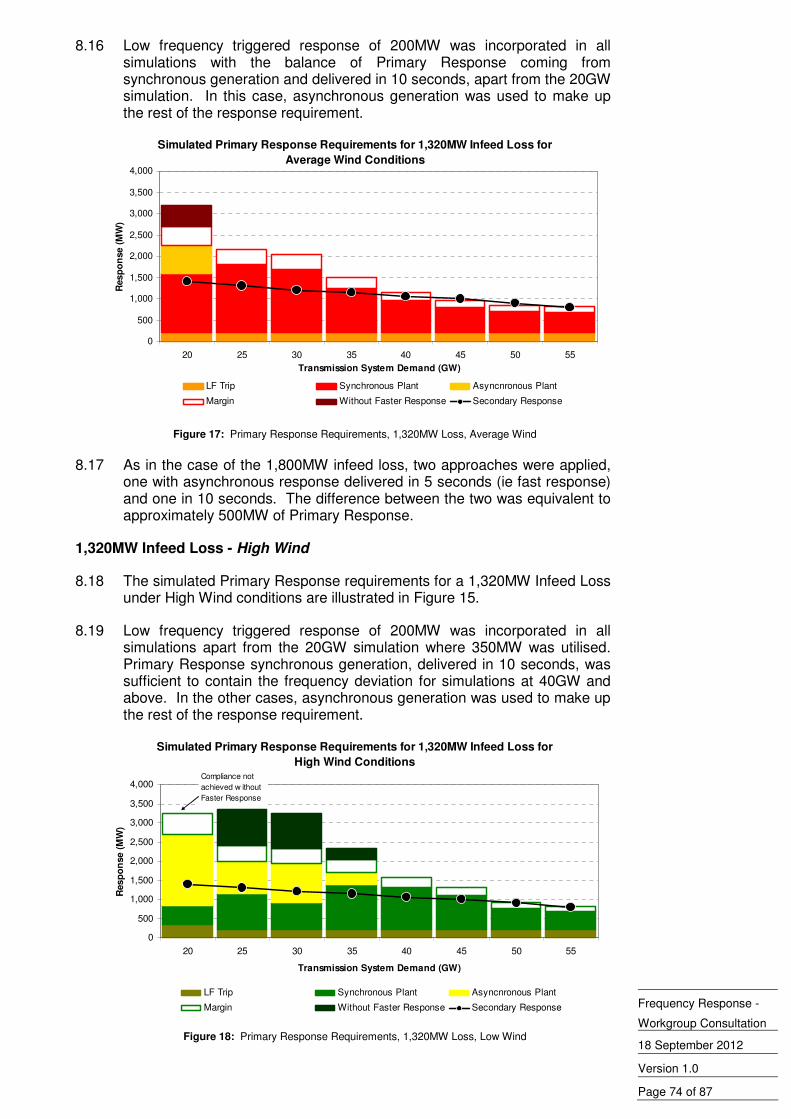
Frequency Response -
Workgroup Consultation
18 September 2012
Version 1.0
Page 74 of 87
8.16 Low frequency triggered response of 200MW was incorporated in all simulations with the balance of Primary Response coming from synchronous generation and delivered in 10 seconds, apart from the 20GW simulation. In this case, asynchronous generation was used to make up the rest of the response requirement.
Simulated Primary Response Requirements for 1,320MW Infeed Loss for
Average Wind Conditions
0
500
1,000
1,500
2,000
2,500
3,000
3,500
4,000
20 25 30 35 40 45 50 55
Transmission System Demand (GW)
Resp
on
se (
MW
)
LF Trip Synchronous Plant Asyncnronous Plant
Margin Without Faster Response Secondary Response
Figure 17: Primary Response Requirements, 1,320MW Loss, Average Wind
8.17 As in the case of the 1,800MW infeed loss, two approaches were applied, one with asynchronous response delivered in 5 seconds (ie fast response) and one in 10 seconds. The difference between the two was equivalent to approximately 500MW of Primary Response.
1,320MW Infeed Loss - High Wind
8.18 The simulated Primary Response requirements for a 1,320MW Infeed Loss under High Wind conditions are illustrated in Figure 15.
8.19 Low frequency triggered response of 200MW was incorporated in all simulations apart from the 20GW simulation where 350MW was utilised. Primary Response synchronous generation, delivered in 10 seconds, was sufficient to contain the frequency deviation for simulations at 40GW and above. In the other cases, asynchronous generation was used to make up the rest of the response requirement.
Simulated Primary Response Requirements for 1,320MW Infeed Loss for
High Wind Conditions
0
500
1,000
1,500
2,000
2,500
3,000
3,500
4,000
20 25 30 35 40 45 50 55
Transmission System Demand (GW)
Resp
on
se (
MW
)
LF Trip Synchronous Plant Asyncnronous Plant
Margin Without Faster Response Secondary Response
Compliance not
achieved w ithout
Faster Response
Figure 18: Primary Response Requirements, 1,320MW Loss, Low Wind
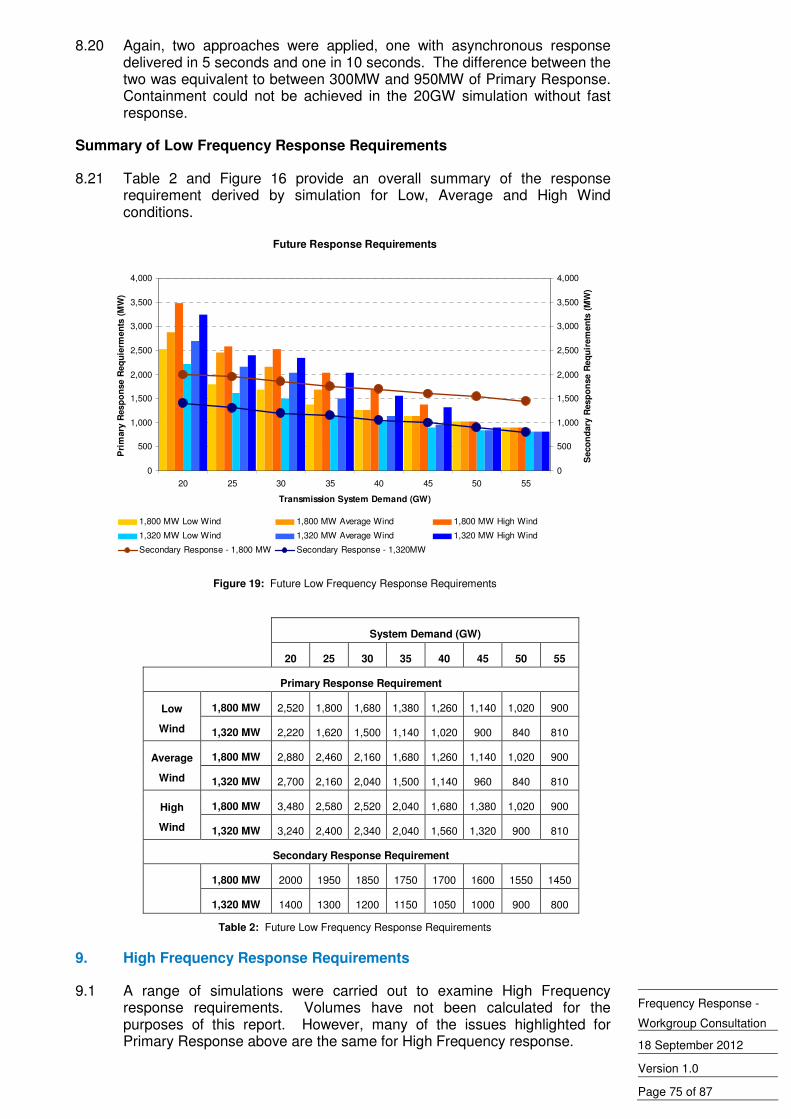
Frequency Response -
Workgroup Consultation
18 September 2012
Version 1.0
Page 75 of 87
8.20 Again, two approaches were applied, one with asynchronous response delivered in 5 seconds and one in 10 seconds. The difference between the two was equivalent to between 300MW and 950MW of Primary Response. Containment could not be achieved in the 20GW simulation without fast response.
Summary of Low Frequency Response Requirements
8.21 Table 2 and Figure 16 provide an overall summary of the response requirement derived by simulation for Low, Average and High Wind conditions.
Future Response Requirements
0
500
1,000
1,500
2,000
2,500
3,000
3,500
4,000
20 25 30 35 40 45 50 55
Transmission System Demand (GW)
Pri
mary
Resp
on
se R
eq
uie
rmen
ts (
MW
)
0
500
1,000
1,500
2,000
2,500
3,000
3,500
4,000
Seco
nd
ary
Resp
on
se R
eq
uir
em
en
ts (
MW
)
1,800 MW Low Wind 1,800 MW Average Wind 1,800 MW High Wind
1,320 MW Low Wind 1,320 MW Average Wind 1,320 MW High Wind
Secondary Response - 1,800 MW Secondary Response - 1,320MW
Figure 19: Future Low Frequency Response Requirements
System Demand (GW)
20 25 30 35 40 45 50 55
Primary Response Requirement
1,800 MW 2,520 1,800 1,680 1,380 1,260 1,140 1,020 900 Low
Wind 1,320 MW 2,220 1,620 1,500 1,140 1,020 900 840 810
1,800 MW 2,880 2,460 2,160 1,680 1,260 1,140 1,020 900 Average
Wind 1,320 MW 2,700 2,160 2,040 1,500 1,140 960 840 810
1,800 MW 3,480 2,580 2,520 2,040 1,680 1,380 1,020 900 High
Wind 1,320 MW 3,240 2,400 2,340 2,040 1,560 1,320 900 810
Secondary Response Requirement
1,800 MW 2000 1950 1850 1750 1700 1600 1550 1450
1,320 MW 1400 1300 1200 1150 1050 1000 900 800
Table 2: Future Low Frequency Response Requirements
9. High Frequency Response Requirements
9.1 A range of simulations were carried out to examine High Frequency response requirements. Volumes have not been calculated for the purposes of this report. However, many of the issues highlighted for Primary Response above are the same for High Frequency response.
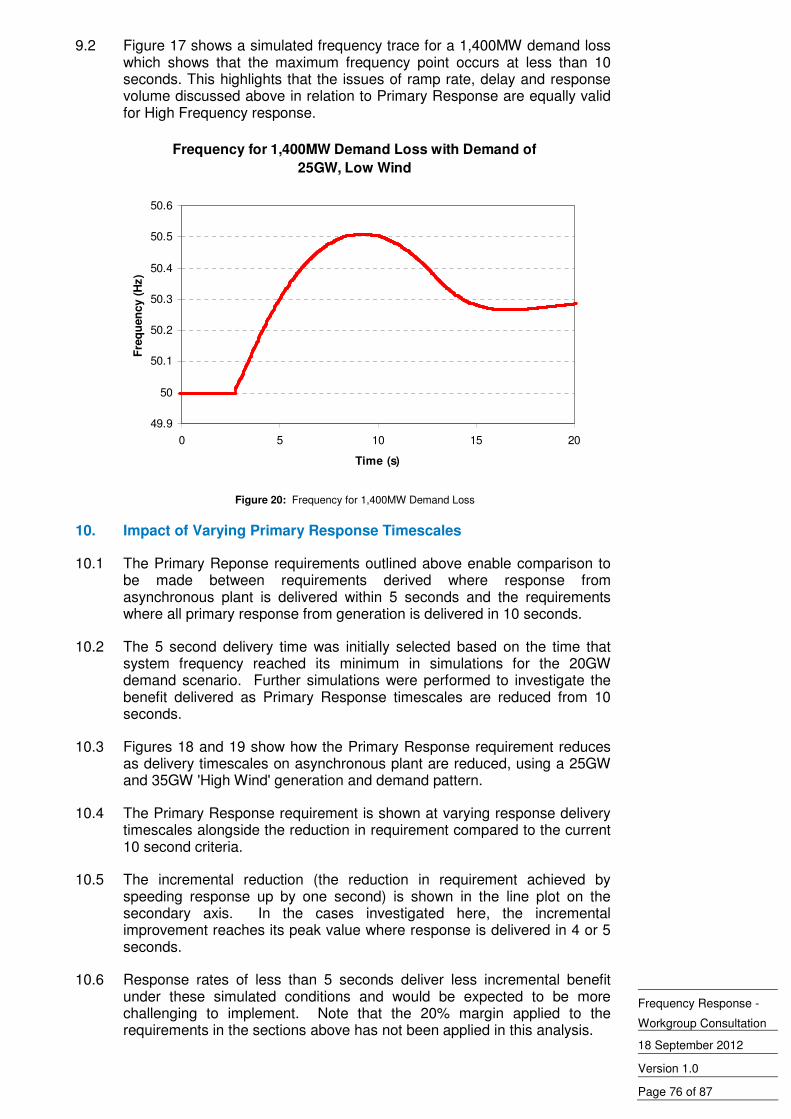
Frequency Response -
Workgroup Consultation
18 September 2012
Version 1.0
Page 76 of 87
9.2 Figure 17 shows a simulated frequency trace for a 1,400MW demand loss which shows that the maximum frequency point occurs at less than 10 seconds. This highlights that the issues of ramp rate, delay and response volume discussed above in relation to Primary Response are equally valid for High Frequency response.
Frequency for 1,400MW Demand Loss with Demand of
25GW, Low Wind
49.9
50
50.1
50.2
50.3
50.4
50.5
50.6
0 5 10 15 20
Time (s)
Fre
qu
en
cy (
Hz)
Figure 20: Frequency for 1,400MW Demand Loss
10. Impact of Varying Primary Response Timescales
10.1 The Primary Reponse requirements outlined above enable comparison to be made between requirements derived where response from asynchronous plant is delivered within 5 seconds and the requirements where all primary response from generation is delivered in 10 seconds.
10.2 The 5 second delivery time was initially selected based on the time that system frequency reached its minimum in simulations for the 20GW demand scenario. Further simulations were performed to investigate the benefit delivered as Primary Response timescales are reduced from 10 seconds.
10.3 Figures 18 and 19 show how the Primary Response requirement reduces as delivery timescales on asynchronous plant are reduced, using a 25GW and 35GW 'High Wind' generation and demand pattern.
10.4 The Primary Response requirement is shown at varying response delivery timescales alongside the reduction in requirement compared to the current 10 second criteria.
10.5 The incremental reduction (the reduction in requirement achieved by speeding response up by one second) is shown in the line plot on the secondary axis. In the cases investigated here, the incremental improvement reaches its peak value where response is delivered in 4 or 5 seconds.
10.6 Response rates of less than 5 seconds deliver less incremental benefit under these simulated conditions and would be expected to be more challenging to implement. Note that the 20% margin applied to the requirements in the sections above has not been applied in this analysis.
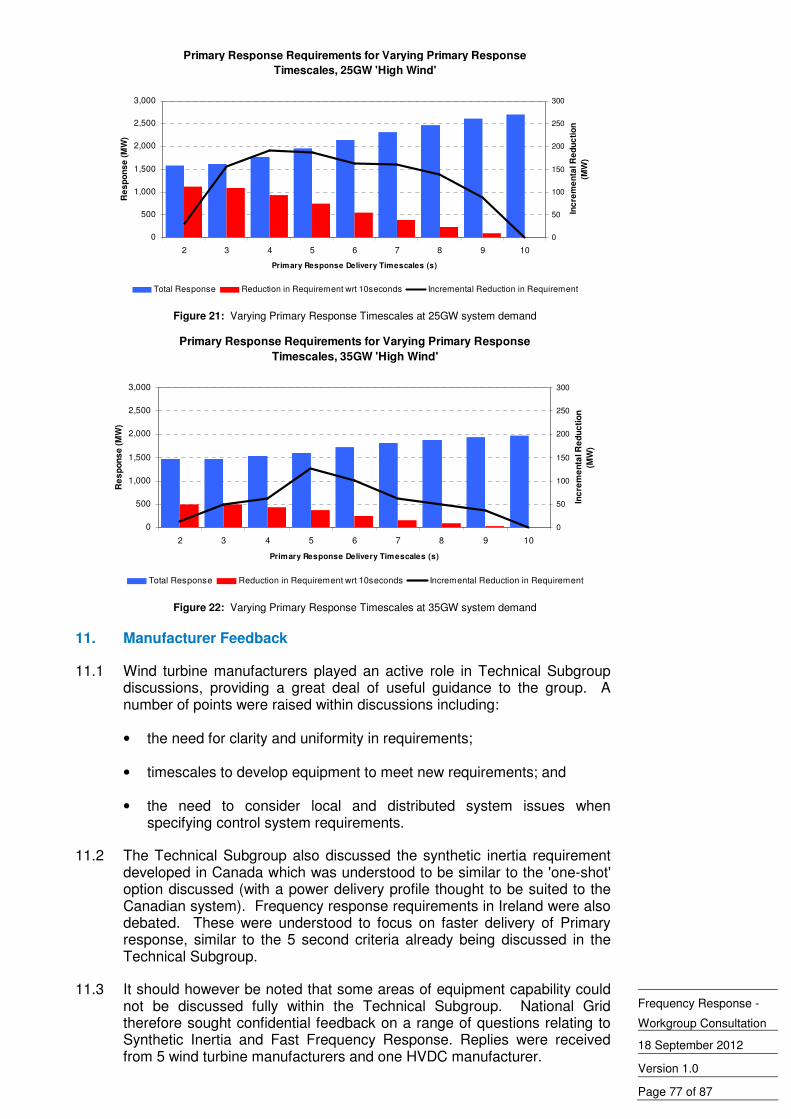
Frequency Response -
Workgroup Consultation
18 September 2012
Version 1.0
Page 77 of 87
Primary Response Requirements for Varying Primary Response
Timescales, 25GW 'High Wind'
0
500
1,000
1,500
2,000
2,500
3,000
2 3 4 5 6 7 8 9 10
Primary Response Delivery Timescales (s)
Re
sp
on
se
(M
W)
0
50
100
150
200
250
300
Inc
rem
en
tal R
ed
uc
tio
n
(MW
)
Total Response Reduction in Requirement wrt 10seconds Incremental Reduction in Requirement
Figure 21: Varying Primary Response Timescales at 25GW system demand
Primary Response Requirements for Varying Primary Response
Timescales, 35GW 'High Wind'
0
500
1,000
1,500
2,000
2,500
3,000
2 3 4 5 6 7 8 9 10
Primary Response Delivery Timescales (s)
Re
sp
on
se
(M
W)
0
50
100
150
200
250
300
Inc
rem
en
tal R
ed
uc
tio
n
(MW
)Total Response Reduction in Requirement wrt 10seconds Incremental Reduction in Requirement
Figure 22: Varying Primary Response Timescales at 35GW system demand
11. Manufacturer Feedback
11.1 Wind turbine manufacturers played an active role in Technical Subgroup discussions, providing a great deal of useful guidance to the group. A number of points were raised within discussions including:
• the need for clarity and uniformity in requirements;
• timescales to develop equipment to meet new requirements; and
• the need to consider local and distributed system issues when specifying control system requirements.
11.2 The Technical Subgroup also discussed the synthetic inertia requirement developed in Canada which was understood to be similar to the 'one-shot' option discussed (with a power delivery profile thought to be suited to the Canadian system). Frequency response requirements in Ireland were also debated. These were understood to focus on faster delivery of Primary response, similar to the 5 second criteria already being discussed in the Technical Subgroup.
11.3 It should however be noted that some areas of equipment capability could not be discussed fully within the Technical Subgroup. National Grid therefore sought confidential feedback on a range of questions relating to Synthetic Inertia and Fast Frequency Response. Replies were received from 5 wind turbine manufacturers and one HVDC manufacturer.
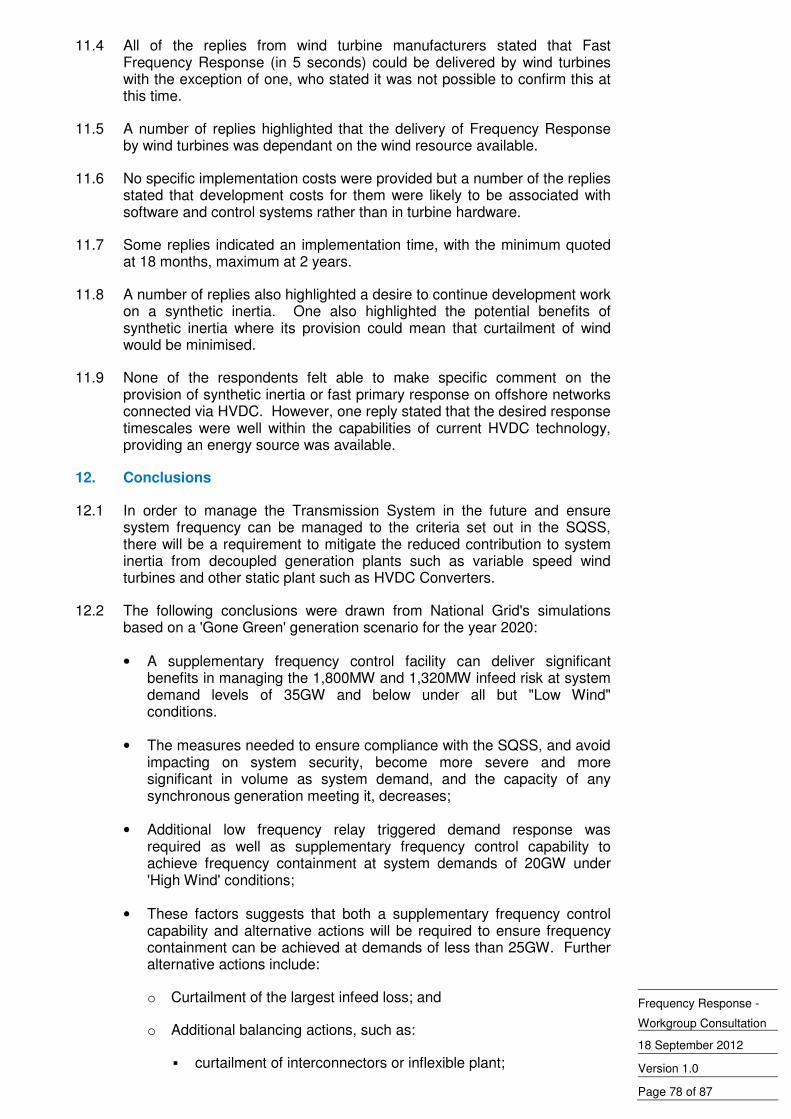
Frequency Response -
Workgroup Consultation
18 September 2012
Version 1.0
Page 78 of 87
11.4 All of the replies from wind turbine manufacturers stated that Fast Frequency Response (in 5 seconds) could be delivered by wind turbines with the exception of one, who stated it was not possible to confirm this at this time.
11.5 A number of replies highlighted that the delivery of Frequency Response by wind turbines was dependant on the wind resource available.
11.6 No specific implementation costs were provided but a number of the replies stated that development costs for them were likely to be associated with software and control systems rather than in turbine hardware.
11.7 Some replies indicated an implementation time, with the minimum quoted at 18 months, maximum at 2 years.
11.8 A number of replies also highlighted a desire to continue development work on a synthetic inertia. One also highlighted the potential benefits of synthetic inertia where its provision could mean that curtailment of wind would be minimised.
11.9 None of the respondents felt able to make specific comment on the provision of synthetic inertia or fast primary response on offshore networks connected via HVDC. However, one reply stated that the desired response timescales were well within the capabilities of current HVDC technology, providing an energy source was available.
12. Conclusions
12.1 In order to manage the Transmission System in the future and ensure system frequency can be managed to the criteria set out in the SQSS, there will be a requirement to mitigate the reduced contribution to system inertia from decoupled generation plants such as variable speed wind turbines and other static plant such as HVDC Converters.
12.2 The following conclusions were drawn from National Grid's simulations based on a 'Gone Green' generation scenario for the year 2020:
• A supplementary frequency control facility can deliver significant benefits in managing the 1,800MW and 1,320MW infeed risk at system demand levels of 35GW and below under all but "Low Wind" conditions.
• The measures needed to ensure compliance with the SQSS, and avoid impacting on system security, become more severe and more significant in volume as system demand, and the capacity of any synchronous generation meeting it, decreases;
• Additional low frequency relay triggered demand response was required as well as supplementary frequency control capability to achieve frequency containment at system demands of 20GW under 'High Wind' conditions;
• These factors suggests that both a supplementary frequency control capability and alternative actions will be required to ensure frequency containment can be achieved at demands of less than 25GW. Further alternative actions include:
o Curtailment of the largest infeed loss; and
o Additional balancing actions, such as:
▪ curtailment of interconnectors or inflexible plant;
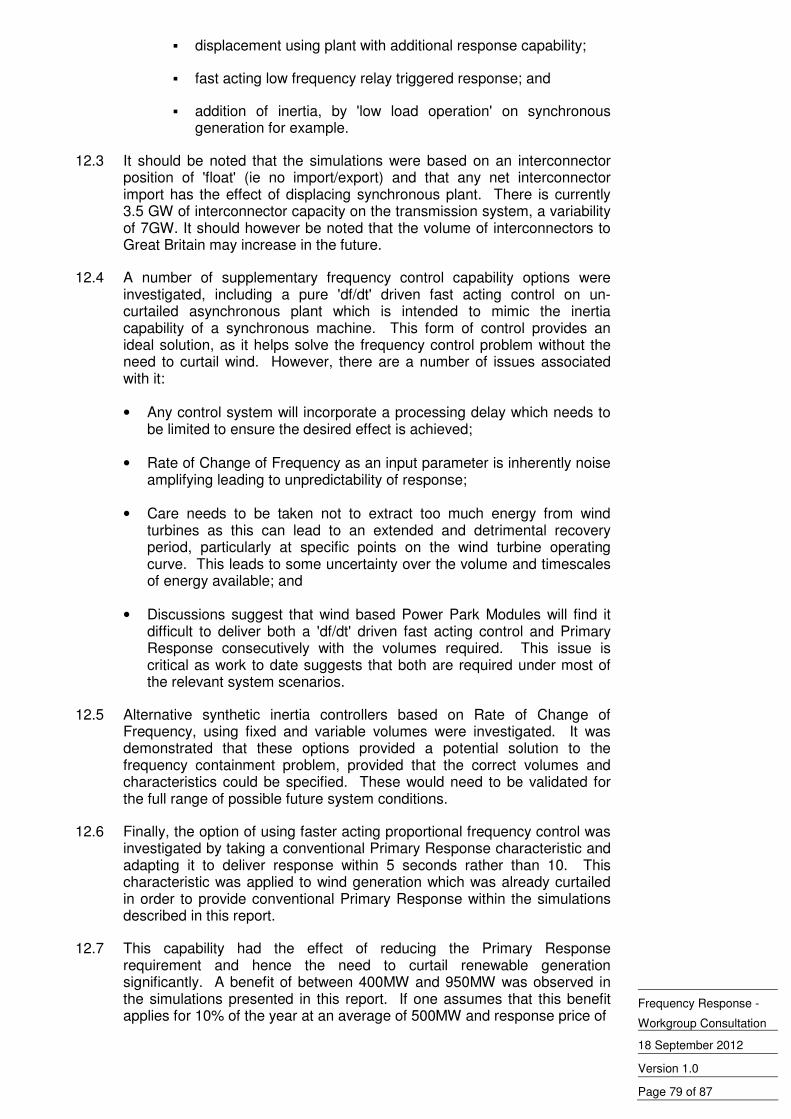
Frequency Response -
Workgroup Consultation
18 September 2012
Version 1.0
Page 79 of 87
▪ displacement using plant with additional response capability;
▪ fast acting low frequency relay triggered response; and
▪ addition of inertia, by 'low load operation' on synchronous generation for example.
12.3 It should be noted that the simulations were based on an interconnector position of 'float' (ie no import/export) and that any net interconnector import has the effect of displacing synchronous plant. There is currently 3.5 GW of interconnector capacity on the transmission system, a variability of 7GW. It should however be noted that the volume of interconnectors to Great Britain may increase in the future.
12.4 A number of supplementary frequency control capability options were investigated, including a pure 'df/dt' driven fast acting control on un-curtailed asynchronous plant which is intended to mimic the inertia capability of a synchronous machine. This form of control provides an ideal solution, as it helps solve the frequency control problem without the need to curtail wind. However, there are a number of issues associated with it:
• Any control system will incorporate a processing delay which needs to be limited to ensure the desired effect is achieved;
• Rate of Change of Frequency as an input parameter is inherently noise amplifying leading to unpredictability of response;
• Care needs to be taken not to extract too much energy from wind turbines as this can lead to an extended and detrimental recovery period, particularly at specific points on the wind turbine operating curve. This leads to some uncertainty over the volume and timescales of energy available; and
• Discussions suggest that wind based Power Park Modules will find it difficult to deliver both a 'df/dt' driven fast acting control and Primary Response consecutively with the volumes required. This issue is critical as work to date suggests that both are required under most of the relevant system scenarios.
12.5 Alternative synthetic inertia controllers based on Rate of Change of Frequency, using fixed and variable volumes were investigated. It was demonstrated that these options provided a potential solution to the frequency containment problem, provided that the correct volumes and characteristics could be specified. These would need to be validated for the full range of possible future system conditions.
12.6 Finally, the option of using faster acting proportional frequency control was investigated by taking a conventional Primary Response characteristic and adapting it to deliver response within 5 seconds rather than 10. This characteristic was applied to wind generation which was already curtailed in order to provide conventional Primary Response within the simulations described in this report.
12.7 This capability had the effect of reducing the Primary Response requirement and hence the need to curtail renewable generation significantly. A benefit of between 400MW and 950MW was observed in the simulations presented in this report. If one assumes that this benefit applies for 10% of the year at an average of 500MW and response price of
Frequency Response -
Workgroup Consultation
18 September 2012
Version 1.0
Page 80 of 87
12.8 30 £/MW/h, a benefit of £13m per year in balancing cost could be attributed to this capability. There would be an additional carbon benefit for the wind curtailment avoided.
12.9 Based on the analysis conducted, it has been concluded that the single change to response provision that would yield the most significant benefit is through the introduction of a fast primary Frequency Response capability applicable to all decoupled generation sources which do not naturally provide an inertial contribution.
12.10 Such generating plant should have the capability to provide 10% or more of its registered capacity as primary Frequency Response which should be delivered linearly over a 5 second period from the inception of the generation loss or load change and an initial delay of no more than 1 second from the inception of the frequency change.
12.11 It is recognised that this specification may present a challenge to technology providers and manufacturers. However, it is believed that this specification is more achievable, at an earlier implementation date, than the df/dt triggered control option discussed above.
12.12 Simulations also showed a high degree of sensitivity to the ramp rate assumptions for Primary Response. It is recommended that these are specified explicitly within the Grid Code by setting out a maximum response delay of 1 second and specifying that response should be delivered linearly up to 10 seconds or 5 seconds as appropriate.
12.13 Whilst it is acknowledged that these proposals could resolve the issue for Plant in excess of 50MW, some consideration will still be required as to how this issue will be addressed in respect of Small Embedded Power Stations as this segment of the market is expected to grow in the future.
12.14 The studies have also demonstrated the effect on rate of change of system frequency against a credible set of future generating scenarios. As a conclusion it is seen that this will impact on Embedded Generation, in particular the effect on protection settings. It is therefore suggested that this report is highlighted to the Distribution Code Review Panel for further consideration in respect of Embedded Generation.
12.15 A final point to note is the extent of reliance on wind generation to deliver frequency control in the analysis performed in this report. Operators have little experience of this to date and it may be necessary to revisit the technical and commercial arrangements for the provisions of Frequency Response for asynchronous generators as more experience is gained.
12.16 Annex 7 contains text which sets out the very high level principles in addressing the need for a fast frequency response in order to address the issue of a diminishing contribution to system inertia from generating plants which are insensitive to changes in system frequency. The text has been drafted in the style of Grid Code change for illustrative purposes only.
13. Recommendations
Faster Frequency Response
13.1 Faster Frequency Response capability delivered within 5 seconds, for low and high frequencies, on users bound by the provisions of the Grid Code allows Frequency Response volumes to be reduced significantly in the situations analysed in this report.
(a) The value of faster Frequency Response should be assessed, taking into consideration the costs of implementation and the benefits in
Frequency Response -
Workgroup Consultation
18 September 2012
Version 1.0
Page 81 of 87
reduced curtailment of generation from renewable sources and other balancing costs; and
(b) Subject to this assessment, proposals should be developed for the appropriate obligations and/or market arrangements to ensure sufficient Frequency Response capability is available to maintain system security for anticipated future generation and demand patterns.
Clearer Primary Response Requirements
13.2 The simulations conducted by the Technical Subgroup have demonstrated the sensitivity of Frequency Response requirements to the ramping capability of responsive generation. The Grid Code requirements for Frequency Response should be reviewed with the aim of clarifying the ramping capability required from responsive generation in terms of:
(a) Adequacy of information provided on performance; and
(b) The need to stipulate minimum delay times and ramping capability for new providers.
Rate of Change of Frequency
13.3 The simulations performed by the Technical Subgroup give some indication to the potential change in the maximum Rate of Change of Frequency settings which needs to be considered in the context of the loss of mains protection deployed on embedded generation.
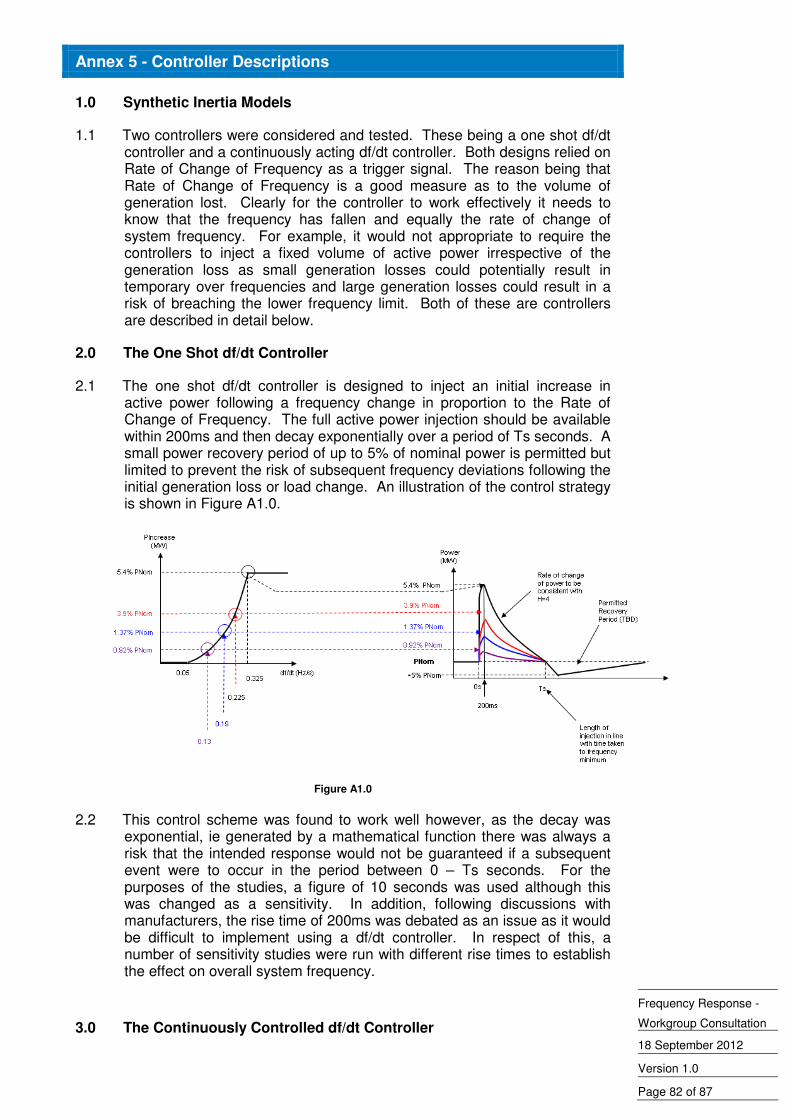
Frequency Response -
Workgroup Consultation
18 September 2012
Version 1.0
Page 82 of 87
Annex 5 - Controller Descriptions
1.0 Synthetic Inertia Models
1.1 Two controllers were considered and tested. These being a one shot df/dt controller and a continuously acting df/dt controller. Both designs relied on Rate of Change of Frequency as a trigger signal. The reason being that Rate of Change of Frequency is a good measure as to the volume of generation lost. Clearly for the controller to work effectively it needs to know that the frequency has fallen and equally the rate of change of system frequency. For example, it would not appropriate to require the controllers to inject a fixed volume of active power irrespective of the generation loss as small generation losses could potentially result in temporary over frequencies and large generation losses could result in a risk of breaching the lower frequency limit. Both of these are controllers are described in detail below.
2.0 The One Shot df/dt Controller
2.1 The one shot df/dt controller is designed to inject an initial increase in active power following a frequency change in proportion to the Rate of Change of Frequency. The full active power injection should be available within 200ms and then decay exponentially over a period of Ts seconds. A small power recovery period of up to 5% of nominal power is permitted but limited to prevent the risk of subsequent frequency deviations following the initial generation loss or load change. An illustration of the control strategy is shown in Figure A1.0.
Figure A1.0
2.2 This control scheme was found to work well however, as the decay was exponential, ie generated by a mathematical function there was always a risk that the intended response would not be guaranteed if a subsequent event were to occur in the period between 0 – Ts seconds. For the purposes of the studies, a figure of 10 seconds was used although this was changed as a sensitivity. In addition, following discussions with manufacturers, the rise time of 200ms was debated as an issue as it would be difficult to implement using a df/dt controller. In respect of this, a number of sensitivity studies were run with different rise times to establish the effect on overall system frequency.
3.0 The Continuously Controlled df/dt Controller
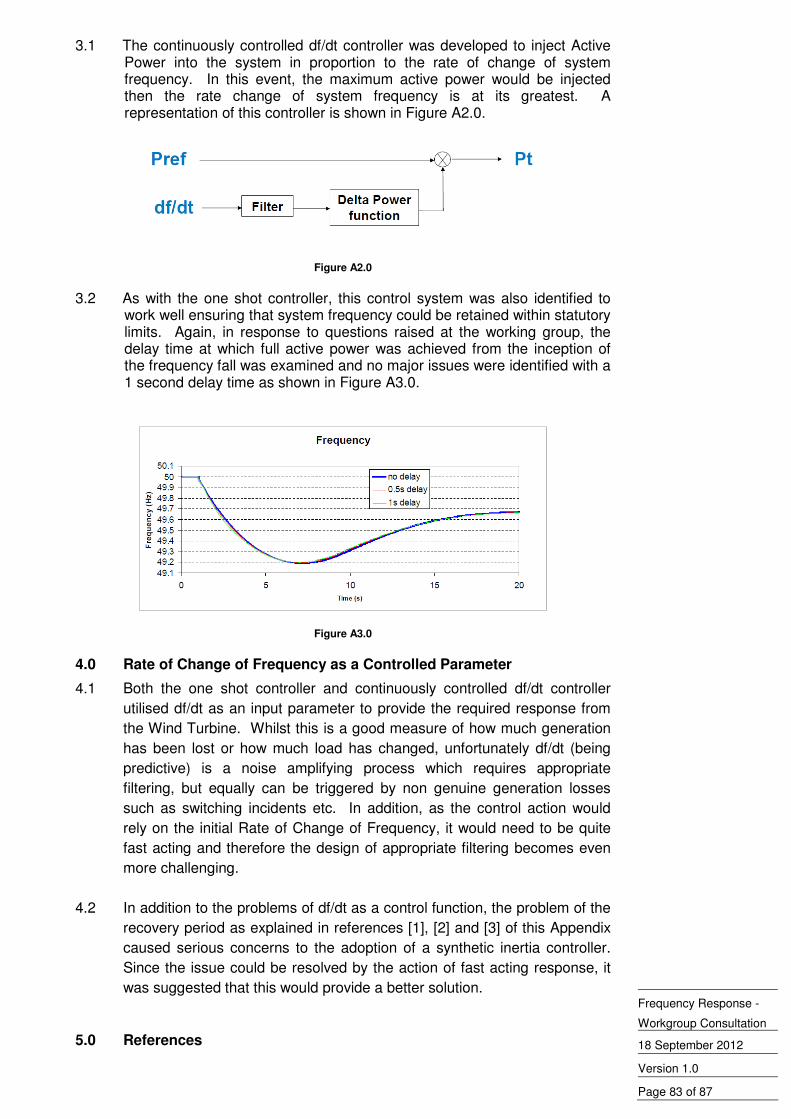
Frequency Response -
Workgroup Consultation
18 September 2012
Version 1.0
Page 83 of 87
3.1 The continuously controlled df/dt controller was developed to inject Active Power into the system in proportion to the rate of change of system frequency. In this event, the maximum active power would be injected then the rate change of system frequency is at its greatest. A representation of this controller is shown in Figure A2.0.
Figure A2.0
3.2 As with the one shot controller, this control system was also identified to work well ensuring that system frequency could be retained within statutory limits. Again, in response to questions raised at the working group, the delay time at which full active power was achieved from the inception of the frequency fall was examined and no major issues were identified with a 1 second delay time as shown in Figure A3.0.
Figure A3.0
4.0 Rate of Change of Frequency as a Controlled Parameter
4.1 Both the one shot controller and continuously controlled df/dt controller
utilised df/dt as an input parameter to provide the required response from
the Wind Turbine. Whilst this is a good measure of how much generation
has been lost or how much load has changed, unfortunately df/dt (being
predictive) is a noise amplifying process which requires appropriate
filtering, but equally can be triggered by non genuine generation losses
such as switching incidents etc. In addition, as the control action would
rely on the initial Rate of Change of Frequency, it would need to be quite
fast acting and therefore the design of appropriate filtering becomes even
more challenging.
4.2 In addition to the problems of df/dt as a control function, the problem of the
recovery period as explained in references [1], [2] and [3] of this Appendix
caused serious concerns to the adoption of a synthetic inertia controller.
Since the issue could be resolved by the action of fast acting response, it
was suggested that this would provide a better solution.
5.0 References

Frequency Response -
Workgroup Consultation
18 September 2012
Version 1.0
Page 84 of 87
[1] Grid Code Review Panel Paper Reference pp10/21, Future Frequency
Response requirements, dated September 2010.
[2] Contribution of Wind Energy Converters with Inertia Emulation to frequency
control and frequency stability in Power Systems – Stephan Wachtel and
Alfred Beekmann – Enercon – Presented at the 8th International Workshop
on Large Scale Integration of Wind Power into Power Systems as well as
on Offshore Wind Farms, Bremen Germany, 14 – 15 October 2009.
[3] Variable Speed Wind Turbines Capability for Temporary Over-Production –
German Claudio Tarnowski, Philip Carne Kjaer, Poul E Sorensen and
Jacob Ostergaard
[4] Study on Variable Speed Wind Turbine Capability for Frequency Response
- German Claudio Tarnowski, Philip Carne Kjaer, Poul E Sorensen and
Jacob Ostergaard
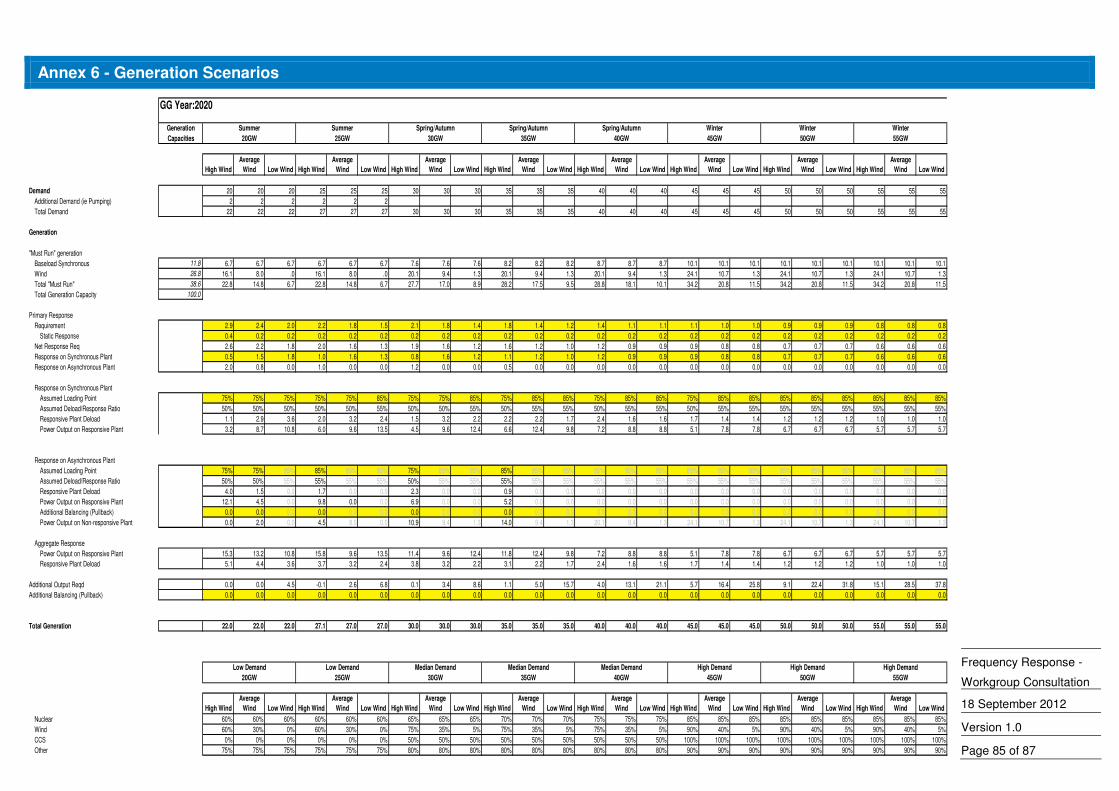
Frequency Response -
Workgroup Consultation
18 September 2012
Version 1.0
Page 85 of 87
Annex 6 - Generation Scenarios
GG Year:2020
Generation Summer Summer Spring/Autumn Spring/Autumn Spring/Autumn Winter Winter Winter
Capacities 20GW 25GW 30GW 35GW 40GW 45GW 50GW 55GW
High Wind
Average
Wind Low Wind High Wind
Average
Wind Low Wind High Wind
Average
Wind Low Wind High Wind
Average
Wind Low Wind High Wind
Average
Wind Low Wind High Wind
Average
Wind Low Wind High Wind
Average
Wind Low Wind High Wind
Average
Wind Low Wind
Demand 20 20 20 25 25 25 30 30 30 35 35 35 40 40 40 45 45 45 50 50 50 55 55 55
Additional Demand (ie Pumping) 2 2 2 2 2 2
Total Demand 22 22 22 27 27 27 30 30 30 35 35 35 40 40 40 45 45 45 50 50 50 55 55 55
Generation
"Must Run" generation
Baseload Synchronous 11.8 6.7 6.7 6.7 6.7 6.7 6.7 7.6 7.6 7.6 8.2 8.2 8.2 8.7 8.7 8.7 10.1 10.1 10.1 10.1 10.1 10.1 10.1 10.1 10.1
Wind 26.8 16.1 8.0 .0 16.1 8.0 .0 20.1 9.4 1.3 20.1 9.4 1.3 20.1 9.4 1.3 24.1 10.7 1.3 24.1 10.7 1.3 24.1 10.7 1.3
Total "Must Run" 38.6 22.8 14.8 6.7 22.8 14.8 6.7 27.7 17.0 8.9 28.2 17.5 9.5 28.8 18.1 10.1 34.2 20.8 11.5 34.2 20.8 11.5 34.2 20.8 11.5
Total Generation Capacity 100.0
Primary Response
Requirement 2.9 2.4 2.0 2.2 1.8 1.5 2.1 1.8 1.4 1.8 1.4 1.2 1.4 1.1 1.1 1.1 1.0 1.0 0.9 0.9 0.9 0.8 0.8 0.8
Static Response 0.4 0.2 0.2 0.2 0.2 0.2 0.2 0.2 0.2 0.2 0.2 0.2 0.2 0.2 0.2 0.2 0.2 0.2 0.2 0.2 0.2 0.2 0.2 0.2
Net Response Req 2.6 2.2 1.8 2.0 1.6 1.3 1.9 1.6 1.2 1.6 1.2 1.0 1.2 0.9 0.9 0.9 0.8 0.8 0.7 0.7 0.7 0.6 0.6 0.6
Response on Synchronous Plant 0.5 1.5 1.8 1.0 1.6 1.3 0.8 1.6 1.2 1.1 1.2 1.0 1.2 0.9 0.9 0.9 0.8 0.8 0.7 0.7 0.7 0.6 0.6 0.6
Response on Asynchronous Plant 2.0 0.8 0.0 1.0 0.0 0.0 1.2 0.0 0.0 0.5 0.0 0.0 0.0 0.0 0.0 0.0 0.0 0.0 0.0 0.0 0.0 0.0 0.0 0.0
Response on Synchronous Plant
Assumed Loading Point 75% 75% 75% 75% 75% 85% 75% 75% 85% 75% 85% 85% 75% 85% 85% 75% 85% 85% 85% 85% 85% 85% 85% 85%
Assumed Deload/Response Ratio 50% 50% 50% 50% 50% 55% 50% 50% 55% 50% 55% 55% 50% 55% 55% 50% 55% 55% 55% 55% 55% 55% 55% 55%
Responsive Plant Deload 1.1 2.9 3.6 2.0 3.2 2.4 1.5 3.2 2.2 2.2 2.2 1.7 2.4 1.6 1.6 1.7 1.4 1.4 1.2 1.2 1.2 1.0 1.0 1.0
Power Output on Responsive Plant 3.2 8.7 10.8 6.0 9.6 13.5 4.5 9.6 12.4 6.6 12.4 9.8 7.2 8.8 8.8 5.1 7.8 7.8 6.7 6.7 6.7 5.7 5.7 5.7
Response on Asynchronous Plant
Assumed Loading Point 75% 75% 85% 85% 85% 85% 75% 85% 85% 85% 85% 85% 85% 85% 85% 85% 85% 85% 85% 85% 85% 85% 85% 85%
Assumed Deload/Response Ratio 50% 50% 55% 55% 55% 55% 50% 55% 55% 55% 55% 55% 55% 55% 55% 55% 55% 55% 55% 55% 55% 55% 55% 55%
Responsive Plant Deload 4.0 1.5 0.0 1.7 0.0 0.0 2.3 0.0 0.0 0.9 0.0 0.0 0.0 0.0 0.0 0.0 0.0 0.0 0.0 0.0 0.0 0.0 0.0 0.0
Power Output on Responsive Plant 12.1 4.5 0.0 9.8 0.0 0.0 6.9 0.0 0.0 5.2 0.0 0.0 0.0 0.0 0.0 0.0 0.0 0.0 0.0 0.0 0.0 0.0 0.0 0.0
Additional Balancing (Pullback) 0.0 0.0 0.0 0.0 0.0 0.0 0.0 0.0 0.0 0.0 0.0 0.0 0.0 0.0 0.0 0.0 0.0 0.0 0.0 0.0 0.0 0.0 0.0 0.0
Power Output on Non-responsive Plant 0.0 2.0 0.0 4.5 8.0 0.0 10.9 9.4 1.3 14.0 9.4 1.3 20.1 9.4 1.3 24.1 10.7 1.3 24.1 10.7 1.3 24.1 10.7 1.3
Aggregate Response
Power Output on Responsive Plant 15.3 13.2 10.8 15.8 9.6 13.5 11.4 9.6 12.4 11.8 12.4 9.8 7.2 8.8 8.8 5.1 7.8 7.8 6.7 6.7 6.7 5.7 5.7 5.7
Responsive Plant Deload 5.1 4.4 3.6 3.7 3.2 2.4 3.8 3.2 2.2 3.1 2.2 1.7 2.4 1.6 1.6 1.7 1.4 1.4 1.2 1.2 1.2 1.0 1.0 1.0
Additional Output Reqd 0.0 0.0 4.5 -0.1 2.6 6.8 0.1 3.4 8.6 1.1 5.0 15.7 4.0 13.1 21.1 5.7 16.4 25.8 9.1 22.4 31.8 15.1 28.5 37.8
Additional Balancing (Pullback) 0.0 0.0 0.0 0.0 0.0 0.0 0.0 0.0 0.0 0.0 0.0 0.0 0.0 0.0 0.0 0.0 0.0 0.0 0.0 0.0 0.0 0.0 0.0 0.0
Total Generation 22.0 22.0 22.0 27.1 27.0 27.0 30.0 30.0 30.0 35.0 35.0 35.0 40.0 40.0 40.0 45.0 45.0 45.0 50.0 50.0 50.0 55.0 55.0 55.0
Low Demand Low Demand Median Demand Median Demand Median Demand High Demand High Demand High Demand
20GW 25GW 30GW 35GW 40GW 45GW 50GW 55GW
High Wind
Average
Wind Low Wind High Wind
Average
Wind Low Wind High Wind
Average
Wind Low Wind High Wind
Average
Wind Low Wind High Wind
Average
Wind Low Wind High Wind
Average
Wind Low Wind High Wind
Average
Wind Low Wind High Wind
Average
Wind Low Wind
Nuclear 60% 60% 60% 60% 60% 60% 65% 65% 65% 70% 70% 70% 75% 75% 75% 85% 85% 85% 85% 85% 85% 85% 85% 85%
Wind 60% 30% 0% 60% 30% 0% 75% 35% 5% 75% 35% 5% 75% 35% 5% 90% 40% 5% 90% 40% 5% 90% 40% 5%
CCS 0% 0% 0% 0% 0% 0% 50% 50% 50% 50% 50% 50% 50% 50% 50% 100% 100% 100% 100% 100% 100% 100% 100% 100%
Other 75% 75% 75% 75% 75% 75% 80% 80% 80% 80% 80% 80% 80% 80% 80% 90% 90% 90% 90% 90% 90% 90% 90% 90%
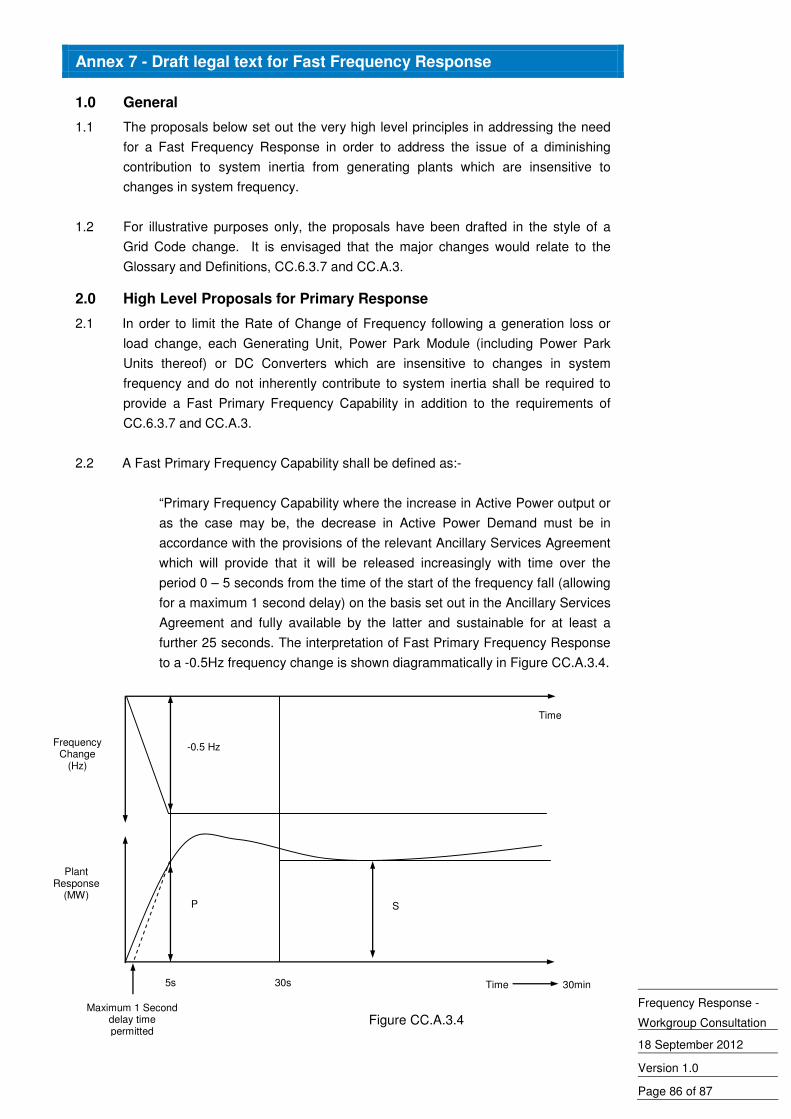
Frequency Response -
Workgroup Consultation
18 September 2012
Version 1.0
Page 86 of 87
Annex 7 - Draft legal text for Fast Frequency Response
1.0 General
1.1 The proposals below set out the very high level principles in addressing the need
for a Fast Frequency Response in order to address the issue of a diminishing
contribution to system inertia from generating plants which are insensitive to
changes in system frequency.
1.2 For illustrative purposes only, the proposals have been drafted in the style of a
Grid Code change. It is envisaged that the major changes would relate to the
Glossary and Definitions, CC.6.3.7 and CC.A.3.
2.0 High Level Proposals for Primary Response
2.1 In order to limit the Rate of Change of Frequency following a generation loss or
load change, each Generating Unit, Power Park Module (including Power Park
Units thereof) or DC Converters which are insensitive to changes in system
frequency and do not inherently contribute to system inertia shall be required to
provide a Fast Primary Frequency Capability in addition to the requirements of
CC.6.3.7 and CC.A.3.
2.2 A Fast Primary Frequency Capability shall be defined as:-
“Primary Frequency Capability where the increase in Active Power output or
as the case may be, the decrease in Active Power Demand must be in
accordance with the provisions of the relevant Ancillary Services Agreement
which will provide that it will be released increasingly with time over the
period 0 – 5 seconds from the time of the start of the frequency fall (allowing
for a maximum 1 second delay) on the basis set out in the Ancillary Services
Agreement and fully available by the latter and sustainable for at least a
further 25 seconds. The interpretation of Fast Primary Frequency Response
to a -0.5Hz frequency change is shown diagrammatically in Figure CC.A.3.4.
Time 30min
Time
30s 5s
-0.5 Hz
P
Plant Response
(MW)
Frequency Change
(Hz)
S
Maximum 1 Second delay time permitted
Figure CC.A.3.4
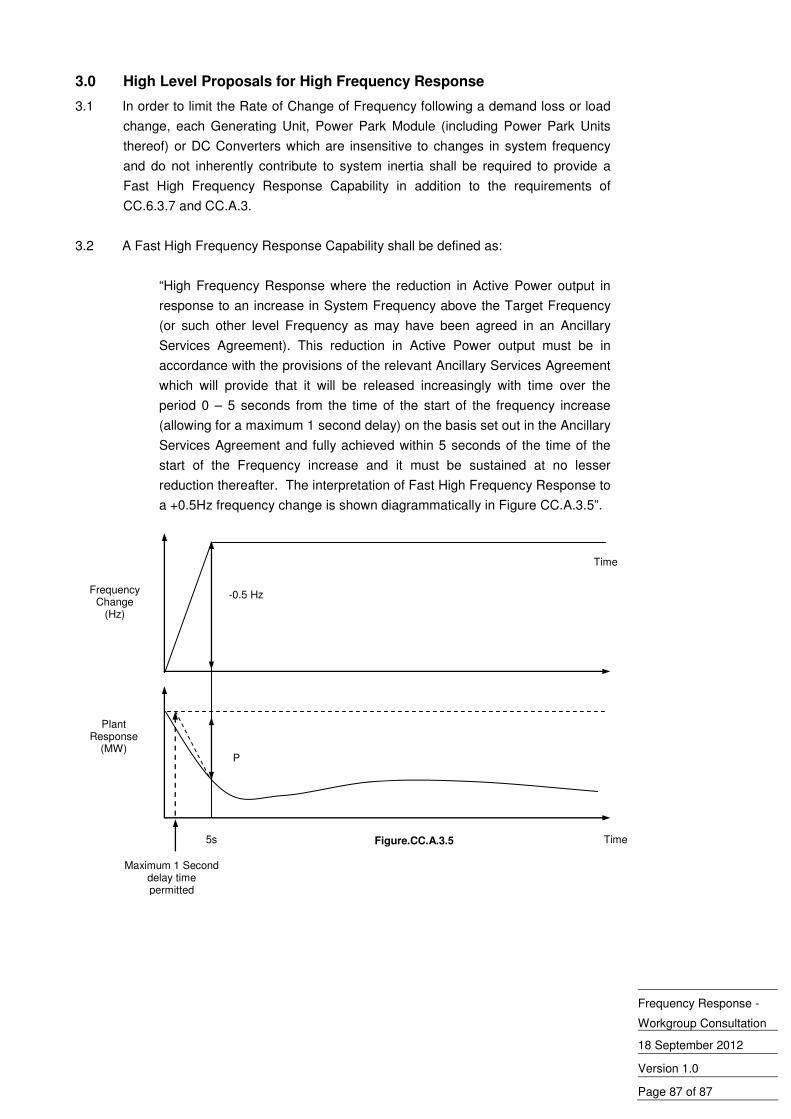
Frequency Response -
Workgroup Consultation
18 September 2012
Version 1.0
Page 87 of 87
3.0 High Level Proposals for High Frequency Response
3.1 In order to limit the Rate of Change of Frequency following a demand loss or load
change, each Generating Unit, Power Park Module (including Power Park Units
thereof) or DC Converters which are insensitive to changes in system frequency
and do not inherently contribute to system inertia shall be required to provide a
Fast High Frequency Response Capability in addition to the requirements of
CC.6.3.7 and CC.A.3.
3.2 A Fast High Frequency Response Capability shall be defined as:
“High Frequency Response where the reduction in Active Power output in
response to an increase in System Frequency above the Target Frequency
(or such other level Frequency as may have been agreed in an Ancillary
Services Agreement). This reduction in Active Power output must be in
accordance with the provisions of the relevant Ancillary Services Agreement
which will provide that it will be released increasingly with time over the
period 0 – 5 seconds from the time of the start of the frequency increase
(allowing for a maximum 1 second delay) on the basis set out in the Ancillary
Services Agreement and fully achieved within 5 seconds of the time of the
start of the Frequency increase and it must be sustained at no lesser
reduction thereafter. The interpretation of Fast High Frequency Response to
a +0.5Hz frequency change is shown diagrammatically in Figure CC.A.3.5”.
Time
Time
5s
-0.5 Hz
P
Plant Response
(MW)
Frequency Change
(Hz)
Maximum 1 Second delay time permitted
Figure.CC.A.3.5