frequency measurement guidelines for oscillators smart timing choice 1 sit-an10033 rev 1.0 december...
TRANSCRIPT

The Smart Timing Choice™ 1 SiT-AN10033 Rev 1.0
December 2013
Frequency Measurement Guidelines for Oscillators
1 Introduction .......................................................................................................................... 2
2 Common Frequency Measurement Issues .......................................................................... 2
2.1 Measurements made with different frequency counters do not match .......................... 2
2.2 Frequency displayed by the frequency counter is much higher than expected ............. 3
2.3 Frequency counter measurements with different gate times do not match ................... 3
2.4 Oscilloscope frequency measurement shows large spread .......................................... 3
3 Frequency Reference Selection ........................................................................................... 4
4 Measurement Using a Frequency Counter .......................................................................... 4
5 Measurement Using a Digital Oscilloscope .......................................................................... 7
5.1 Oscilloscope stamping accuracy and quantization noise .............................................. 7
5.2 Single period measurement ......................................................................................... 8
5.3 Gate time and time base limitations ............................................................................. 8
6 Probing the Signal ............................................................................................................... 8
7 References .........................................................................................................................11
Appendix A. Digital Gate Frequency Measurement Method ......................................................12

The Smart Timing Choice™ 2 SiT-AN10033 Rev 1.0
Frequency Measurement Guidelines for Oscillators
1 Introduction
Every digital electronic device requires a reference clock and oscillators are widely used to serve that purpose. Verifying frequency characteristics of high performance devices requires accurate frequency measurement. This document contains an overview of various frequency measurement methods and instruments and is intended to help the users of SiTime MEMS oscillators take accurate frequency measurements.
2 Common Frequency Measurement Issues
2.1 Measurements made with different frequency counters do not match
A discrepancy between measurements results made with different frequency counters may be caused by one or more of the following reasons.
1) Two instruments use different frequency references. Base models of frequency counters are usually equipped with inexpensive TCXO-based frequency references with 1 to 5 ppm frequency stability and a few ppm/year aging rate. An error introduced by the frequency reference will add an error to the measurement results. Figure 1 illustrates how measurement results of a frequency counter may differ when using an internal TCXO reference compared to an external high-precision rubidium reference. Refer to section 3 for frequency reference selection guidelines.
Figure 1: Frequency measurement results of a SiT8208 25 MHz oscillator using an Agilent 53132A frequency counter synchronized to an internal TCXO reference and to an external rubidium
reference. Gate time 1s. The difference between the measurement results is 4.6 ppm.
2) Gate times or instrument specifications are different. Different measurement results may appear when using the same frequency reference if instruments are using different gate times. Moreover if gate times and references are the same, but instrument resolutions are different, the results may not match at low gate times. Refer to section 4 for details.
25000070.7
24999954.6
24999850
24999900
24999950
25000000
25000050
25000100
Freq
uen
cy (
Hz)
Rubidium Reference Internal TCXO Reference
The Smart Timing Choice™ 3 SiT-AN10033 Rev 1.0
Frequency Measurement Guidelines for Oscillators
2.2 Frequency displayed by the frequency counter is much higher than expected
Poor signal integrity may inadvertently increase or even double the frequency measured by the frequency counter. This is often encountered in probing schemes where the instrument input is configured to a high impedance mode (for example, 1 MΩ). Section 6 discusses signal integrity impact on frequency measurement and provides probing recommendations.
2.3 Frequency counter measurements with different gate times do not match
The frequency measurement error of a frequency counter is inversely proportional to the gate time. As illustrated in Figure 4, the shorter the gate time, the larger the error. Refer to section 4 for details about frequency counters.
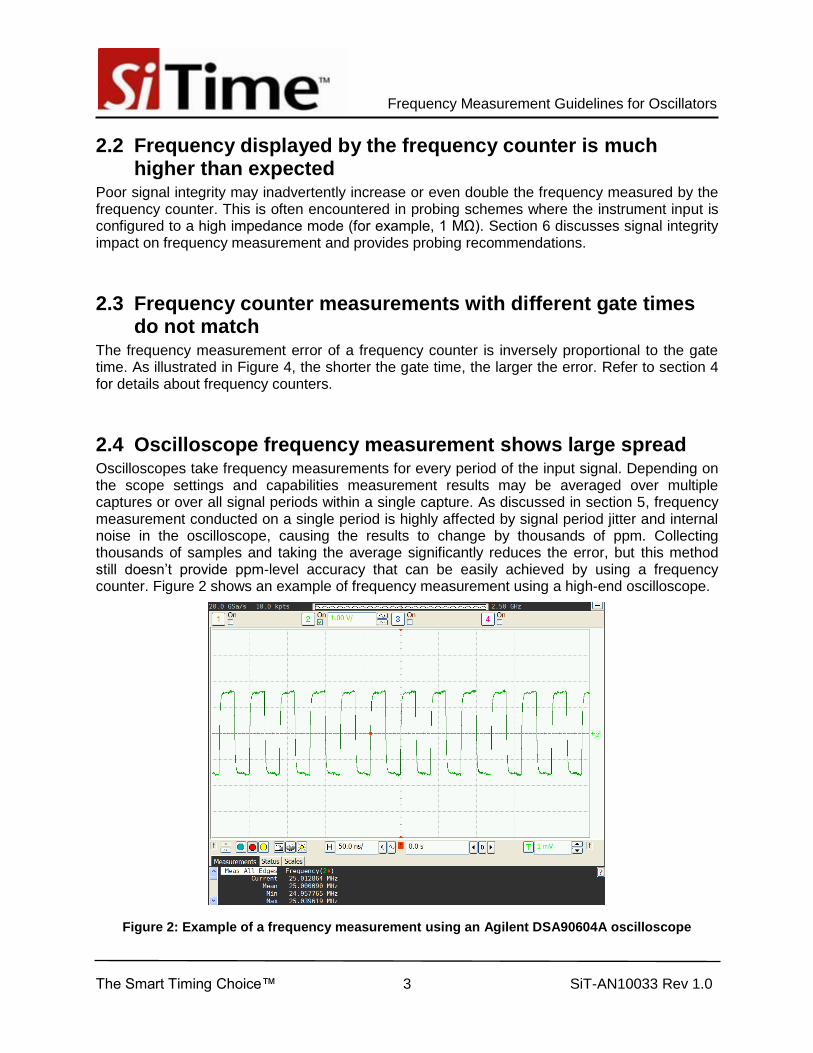
2.4 Oscilloscope frequency measurement shows large spread Oscilloscopes take frequency measurements for every period of the input signal. Depending on the scope settings and capabilities measurement results may be averaged over multiple captures or over all signal periods within a single capture. As discussed in section 5, frequency measurement conducted on a single period is highly affected by signal period jitter and internal noise in the oscilloscope, causing the results to change by thousands of ppm. Collecting thousands of samples and taking the average significantly reduces the error, but this method still doesn’t provide ppm-level accuracy that can be easily achieved by using a frequency counter. Figure 2 shows an example of frequency measurement using a high-end oscilloscope.
Figure 2: Example of a frequency measurement using an Agilent DSA90604A oscilloscope
The Smart Timing Choice™ 4 SiT-AN10033 Rev 1.0
Frequency Measurement Guidelines for Oscillators
3 Frequency Reference Selection
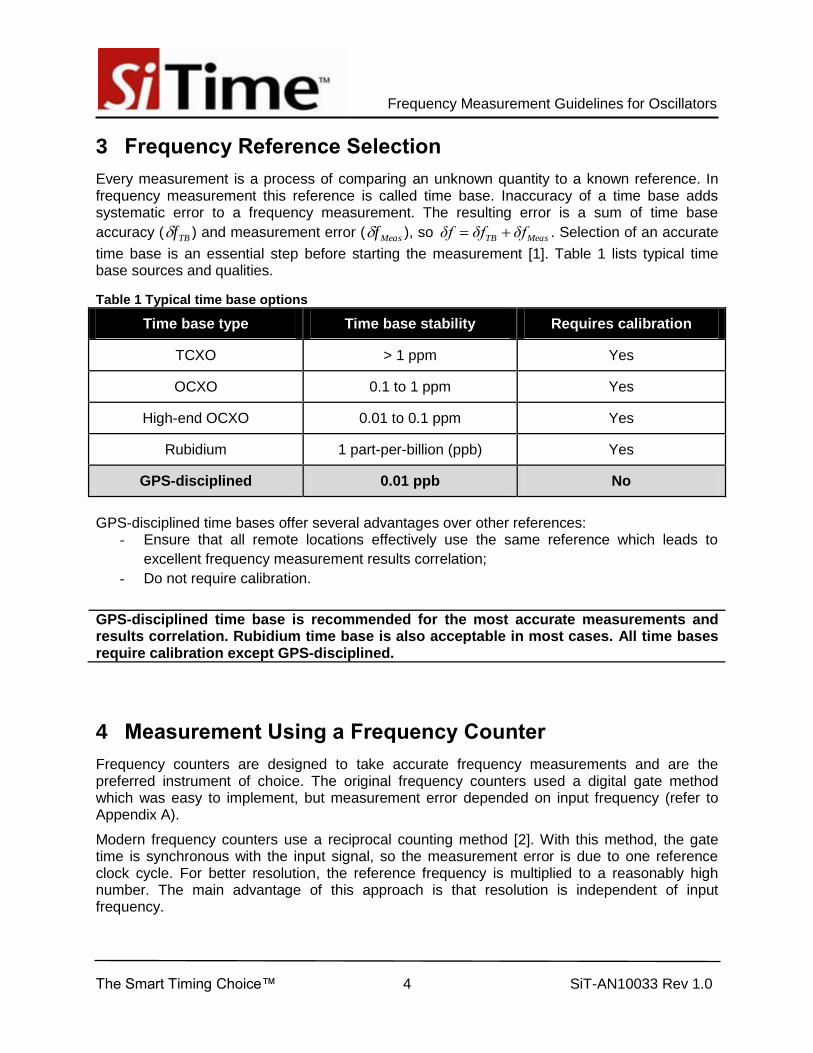
Every measurement is a process of comparing an unknown quantity to a known reference. In frequency measurement this reference is called time base. Inaccuracy of a time base adds systematic error to a frequency measurement. The resulting error is a sum of time base
accuracy ( TBf ) and measurement error ( Measf ), so MeasTB δfδfδf . Selection of an accurate
time base is an essential step before starting the measurement [1]. Table 1 lists typical time base sources and qualities.
Table 1 Typical time base options
Time base type Time base stability Requires calibration
TCXO > 1 ppm Yes
OCXO 0.1 to 1 ppm Yes
High-end OCXO 0.01 to 0.1 ppm Yes
Rubidium 1 part-per-billion (ppb) Yes
GPS-disciplined 0.01 ppb No
GPS-disciplined time bases offer several advantages over other references:
- Ensure that all remote locations effectively use the same reference which leads to
excellent frequency measurement results correlation;
- Do not require calibration.
GPS-disciplined time base is recommended for the most accurate measurements and results correlation. Rubidium time base is also acceptable in most cases. All time bases require calibration except GPS-disciplined.
4 Measurement Using a Frequency Counter
Frequency counters are designed to take accurate frequency measurements and are the preferred instrument of choice. The original frequency counters used a digital gate method which was easy to implement, but measurement error depended on input frequency (refer to Appendix A).
Modern frequency counters use a reciprocal counting method [2]. With this method, the gate time is synchronous with the input signal, so the measurement error is due to one reference clock cycle. For better resolution, the reference frequency is multiplied to a reasonably high number. The main advantage of this approach is that resolution is independent of input frequency.

The Smart Timing Choice™ 5 SiT-AN10033 Rev 1.0
Frequency Measurement Guidelines for Oscillators
There are methods that further increase measurement resolution by time stamping start and stop input signal edges. This makes it possible to determine when those events have occurred within the reference clock cycle (Figure 3). Modern frequency counters achieve 20 ps resolution or better [3].
Input
signal
Reference
clock
TClk
tA tB
...
...
Figure 3: Reciprocal frequency measurement with time stamping capability
Relative frequency measurement error fff / can be expressed as GateIntTB TTff / ,
where TBf is a time base accuracy and IntT is a time interval error which is due to inaccuracy
in time stamping start and stop signal edges. The term GateInt TT / represents relative error due
to time stamping inaccuracy. The error is constant across the wide range of input signal frequencies, but it increases as gate time gets shorter [1]. Figure 4 illustrates how frequency measurement error changes with gate time for two frequency counters with different time interval measurement accuracy. The time base error is not taken into account in this figure and will add an offset to the plot.

The Smart Timing Choice™ 6 SiT-AN10033 Rev 1.0
Frequency Measurement Guidelines for Oscillators
Figure 4: Frequency measurement error (ppb) versus gate time. Two time interval measurement accuracies represent different frequency counters. The plot assumes perfect time base.
Figure 5: Frequency measurement results for various gate times; 50 samples per gate time. The input signal is a 20-MHz sine wave from an Agilent 33250A function generator; the frequency counter is an Agilent 53132A synchronized to a rubidium reference.
Figure 5 represents measurement data that illustrate how reducing the gate time from 100 ms to 10 ms limits the resolution to 5 ppb (0.1 Hz) for a 20 MHz input signal.
Note: Some frequency counters may take additional measurements within the gate time and use this information to improve measurement accuracy. Examples of such counters are Agilent
0.1
1
10
100
1 10 100
Mea
sure
me
nt
erro
r (p
pb
)
Gate time (ms)
ΔTInt = 100 ps ΔTInt = 20 ps
19999911.7
19999911.8
19999911.9
19999912.0
19999912.1
19999912.2
19999912.3
19999912.4
0 10 20 30 40 50
Fre
qu
en
cy (
Hz)
Measurement number
100 ms gate time
10 ms gate time

The Smart Timing Choice™ 7 SiT-AN10033 Rev 1.0
Frequency Measurement Guidelines for Oscillators
53132A and 53230A. Therefore representation of measurement error relation to gate time with
GateInt TT / may not be accurate for all counters.
Frequency measurement error is dominated by two factors:
1. Time base accuracy and stability
2. The frequency counter’s time interval measurement error relative to the gate time
Selecting a higher resolution frequency counter and increasing gate time leads to improved measurement accuracy provided that an accurate time base is used. SiTime recommends using at least 100 ms gate time and a GPS-disciplined or rubidium time base. Refer to your instrument manual for detailed information on your frequency counter accuracy and resolution.
Note: Refer to the FAQ section on www.sitime.com for additional recommendations on frequency measurement techniques for 32 kHz oscillators.
5 Measurement Using a Digital Oscilloscope
Oscilloscopes are widely used for measuring parameters of a clock signal. This section discusses the limitations of digital oscilloscopes that restrict their effectiveness in frequency measurement.
5.1 Oscilloscope stamping accuracy and quantization noise A digital oscilloscope converts an analog input signal to a digital signal by acquiring a set of readings from an analog-to-digital converter that are equally spaced in time. To measure frequency, an oscilloscope detects time instances of signal transitions using a threshold which is usually 50% from the signal amplitude. Oscilloscope software uses interpolation between two points. One point is just before the signal crosses the threshold and the second point is right after crossing the threshold (see Figure 6). The accuracy of measuring the time instance at which the signal has crossed the threshold depends on the oscilloscope time stamping accuracy and quantization noise. The time stamping accuracy defines the errors of t1 and t2 and the quantization noise defines the errors of V1 and V2. Refer to section 4 of SiTime application note AN10007 Clock Jitter and Measurement [4] for more information about the impact of oscilloscope quantization noise on timing measurements.

The Smart Timing Choice™ 8 SiT-AN10033 Rev 1.0
Frequency Measurement Guidelines for Oscillators
Time stamping accuracy
Quantization error
Interpolated threshold
crossing point
t1 t2 t3 t4 t5 t6 t7
t1t2tx
V1
V2
Vth
Vth
Perfect
waveform
Scope
samples
Figure 6: Impact of the oscilloscope quantization noise on timing measurements
5.2 Single period measurement Many oscilloscopes are capable of measuring only one clock period per waveform capture. The relative error of such measurement is fairly high and increases with input signal frequency. High frequency period jitter that is intrinsically present in the signal also adds significant error. Running multiple captures and averaging the data reduces the error to a certain instrument measurement limit. This, however, is time consuming and still doesn’t provide ppm-level accuracy.
5.3 Gate time and time base limitations Modern high-performance digital oscilloscopes are capable of running built-in measurements on all adjacent signal cycles that are acquired within a single capture. They also have very good time-stamping accuracy. Unfortunately due to limited memory, a very small time frame of a signal (typically up to 1 ms) can be captured with a maximum sampling rate. This effectively limits the maximum measurement gate time and as a result, limits the measurement accuracy.
The primary objective for the oscilloscope time base is low jitter, therefore it doesn’t have very good frequency stability. This can be corrected by using an external reference.
6 Probing the Signal
Signal integrity may impact frequency measurement even if it is averaged over multiple periods. The number of cycles registered may be artificially higher if signal integrity issues cause the

The Smart Timing Choice™ 9 SiT-AN10033 Rev 1.0
Frequency Measurement Guidelines for Oscillators
signal to cross the measurement threshold in addition to when rise/fall time events occur (Figure 7). This phenomenon is often called double triggering. When double triggering occurs, the measured frequency is higher than the actual signal frequency.
Trigger
thresholdTrigger
threshold
a b
Figure 7: Two types of signal integrity issues that may cause double triggering: a) excessive ringing, over- and undershoots; b) reflection at the rising and/or falling edge of the waveform.
Figure 8 illustrates how the non-terminated long wires connected to a high impedance probe can cause signal integrity issues. The ringing on the screen capture is significant enough to cause double triggering.
Figure 8: Long wires connected to a 10 MΩ passive probe used for accessing signal under test. Oscilloscope screen capture made with a Tektronix DPO7104.
Improper probing affects signal integrity and may cause double triggering. This condition causes the frequency measured by the instrument to be higher than expected and variation between measurements may be high.

The Smart Timing Choice™ 10 SiT-AN10033 Rev 1.0
Frequency Measurement Guidelines for Oscillators
To ensure good signal integrity, the impedance of the source, load and transmission line should match. For this purpose, source or load termination techniques should be used. The following examples illustrate signal probing using a 50-Ω coaxial cable and various termination options.
Figure 9 shows a signal waveform captured with source termination and 1 MΩ instrument termination. In this example, the output impedance of the DUT is 25 to 30 Ω so a 20-Ω resistor has been added in series with the output to match the 50-Ω cable impedance. The wave which is travelling across the transmission line reflects from the instrument’s high impedance input. The reflection is reduced by source termination, but the waveform still contains over- and undershoots. This method is not recommended because reflections are difficult to eliminate.
DUT
3.3 V
20 ΩOUT
VddOE
GND Z = 50 ΩCoaxial cable
Frequency counter
1 MΩ
Figure 9: Waveform observed at the instrument side when the coaxial cable is connected to 1 MΩ instrument input and only the source termination at the DUT side is present
The preferred way to connect a signal under test to a frequency counter is shown in Figure 10. Instrument input terminated with 50Ω ensures good signal integrity and a 1 kΩ resistor isolates the DUT from the external load. This probing scheme has a 21:1 attenuation factor.
Refer to SiTime application note Probing Oscillator Output [5] for more information on probing techniques.
DUT
3.3 V
1 kΩOUT
VddOE
GND Z = 50 ΩCoaxial cable
Frequency counter
50 Ω
Figure 10: Recommended probing configuration for frequency measurement to ensure good signal integrity and only 1 kΩ signal under test loading

The Smart Timing Choice™ 11 SiT-AN10033 Rev 1.0
Frequency Measurement Guidelines for Oscillators
7 References
[1] Agilent Technologies. Application note, “10 Hints for Getting the Most from Your Frequency Counter” (http://cp.literature.agilent.com/litweb/pdf/5989-8431EN.pdf) (2008).
[2] Agilent Technologies. Application note 200, “Fundamentals of the Electronic Counters” (http://cp.literature.agilent.com/litweb/pdf/5965-7660E.pdf) (1997).
[3] Agilent Technologies. Product datasheet 5990-6283EN, “Agilent 53200A Series RF/Universal Frequency Counter/Timers” (http://cp.literature.agilent.com/litweb/pdf/5990-6283EN.pdf) (2013).
[4] SiTime Corp. Application note 10007, “Clock Jitter and Measurement” (http://www.sitime.com/support2/documents/AN10007-Jitter-and-measurement.pdf) (2013).
[5] SiTime Corp. Application note 10028, “Probing Oscillator Output” (http://www.sitime.com/support2/documents/AN10028-Probing-Oscillator-Output-Rev1.0.pdf) (2013).

The Smart Timing Choice™ 12 SiT-AN10033 Rev 1.0
Frequency Measurement Guidelines for Oscillators
Appendix A. Digital Gate Frequency Measurement Method
Figure A.1 illustrates a block diagram of a direct digital gate frequency measurement method. A preconditioned input signal is applied to one of the inputs of a digital AND gate. The second input to the gate is generated from the time base oscillator by the use of a configurable divider
network. This provides a positive pulse of a required duration called the gate time ( GateT ). While
the pulse is in a high state the input signal passes through the AND gate and the number of its rising edges is counted by the counting register. Thus the number of cycles N of the input signal
that fits within know predefined period of time GateT is obtained. The input signal frequency is
then calculated as GateTNF / .
Counting
RegisterGate
Input signal
Time Base
Divider
Network
TGate
N cycles
Input
signal
Gate
signal
Figure A.1: Simplified block diagram of a direct digital gate frequency counter
The gate time is asynchronous to the input signal and opening and closing of the gate may occur anywhere within the cycle. Absolute error of this method is one cycle of the input signal
over the gate time GateTF /1 , since N can take only integer numbers. Relative frequency
measurement error expressed in ppm is 61/ eFFF , where F is the actual input signal
frequency. Figure A.2 illustrates how the resolution of this method depends on gate time and frequency of an input signal.
As an example, we calculate frequency measurement error of 25 MHz input signal measured using a digital gate method provided that time base stability is 0.1 ppm and gate time is 100 ms.
Frequency measurement error of the method is GateTF /1 1/0.1 = 10 Hz and the error
expressed in ppm is F 10/25e6 1e6 = 0.4 ppm. Total measurement error is a combination of
the time base error and the method error, and is equal to 0.1 ppm + 0.4 ppm = 0.5 ppm.
Figure A.2: Measurement resolution over input signal frequency for different gate times
0.01
0.1
1
10
100
1000
10000
0.01 0.1 1 10 100
Re
solu
tio
n (
pp
m)
Input signal frequency (MHz)
10 ms100 ms1 sec

The Smart Timing Choice™ 13 SiT-AN10033 Rev 1.0
Frequency Measurement Guidelines for Oscillators
SiTime Corporation
990 Almanor Avenue
Sunnyvale, CA 94085
USA
Phone: 408-328-4400
http://www.sitime.com
© SiTime Corporation, 2008-2013. The information contained herein is subject to change at any time without notice. SiTime assumes no responsibility or liability for any loss, damage or defect of a Product which is caused in whole or in part by (i) use of any circuitry other than circuitry embodied in a SiTime product, (ii) misuse or abuse including static discharge, neglect or accident, (iii) unauthorized modification or repairs which have been soldered or altered during assembly and are not capable of being tested by SiTime under its normal test conditions, or (iv) improper installation, storage, handling, warehousing or transportation, or (v) being subjected to unusual physical, thermal, or electrical stress.
Disclaimer: SiTime makes no warranty of any kind, express or implied, with regard to this material, and specifically disclaims any and all express or implied warranties, either in fact or by operation of law, statutory or otherwise, including the implied warranties of merchantability and fitness for use or a particular purpose, and any implied warranty arising from course of dealing or usage of trade, as well as any common-law duties relating to accuracy or lack of negligence, with respect to this material, any SiTime product and any product documentation. Products sold by SiTime are not suitable or intended to be used in a life support application or component, to operate nuclear facilities, or in other mission critical applications where human life may be involved or at stake.