french ipo returns and subsequent security offerings
TRANSCRIPT
1
French IPO returns and subsequent security offerings: Signaling hypothesis versus market feedback hypothesis
Anne-Marie Faugeron-Crouzeta, Edith Ginglingerb*,
Vasumathi Vijayraghavanb
a University Aix-Marseille III, b DRM-Cereg, University Paris-Dauphine
Janvier 2003
Abstract
In this article, we look at two competing hypotheses to explain IPO underpricing in France when a seasoned offering follows the IPO. The first hypothesis assumes that the initial underpricing is a signal from a high quality firm in the anticipation of a subsequent equity issue at a higher price. The second competing hypothesis assumes that the market transmits to managers their valuation of the company. Our database examines two types of subsequent risky issuances: on the one hand, stocks and on the other hand, hybrid issuances (such as convertible bonds, bonds with attached warrants, and stocks with attached warrants). Further, in the French market, firms may be introduced through different mechanisms, which are not equally compatible with both hypotheses. We show that the initial underpricing is greater if a stock issuance rather than other security offerings of a convertible nature subsequently follow the IPO. We find evidence in favor of the signaling hypothesis in the case of fixed price IPOs. For the auction-like procedures, we show that the initial investors' demand, rather than post-IPO performance, determines the type of security that is issued, but has no effect on the financing decision itself. The market feedback hypothesis is therefore only weakly supported: a poor market message does not keep managers from expanding, but rather encourages them to use stage financing rather than straight equity. Key words: IPOs, seasoned equity offerings, convertible bond issues, signaling hypothesis, market-feedback hypothesis
JEL classification: G32
The authors thank Sudi Sudarsanam, Georges Gallais-Hamonno and participants at the European Financial Management 2000 meeting, at the Multinational Finance Association 2001 meeting, at the Northern Finance Association 2001 meeting and at the French Finance Association 2000 december meeting. * Corresponding author. CEREG, University Paris-Dauphine, place du Maréchal de Lattre, 75775-Paris cedex 16. Email: [email protected]
brought to you by COREView metadata, citation and similar papers at core.ac.uk
provided by Research Papers in Economics
2
I. Introduction
It is well documented that initial public offerings (IPOs) of common stock in most
countries are undervalued†. Various explanations have been offered to account for the
phenomenon, one of them being the signaling hypothesis. According to Allen and Faulhaber
(1989), Grinblatt and Hwang (1989), Welch (1989) and Chemmanur (1993), managers use the
offering price as a signal given a situation of asymmetric information. The initial owners of the
issuing firm are supposed to be better informed than other investors. They signal positive
information through the underpricing of the stock in the IPO. Signaling is costly because it
results in a wealth transfer from initial owners to new investors. The signaling cost is
compensated for by the fact that the subsequent capital issue will be made at a higher share price.
The companies could issue an IPO by proposing to investors a smaller fraction of their capital
initially, with a subsequent issue completely satisfying their total capital needs. In this context
lesser quality firms will not be able to compete with higher quality firms. The former firms,
given that there would be the risk that their lower quality would be revealed before the capital
issue, would prefer to issue the stock initially at their true price for the exact amount of capital
desired. The signaling models explicitly take the future equity offerings into account in the IPO's
pricing decision.
The second sustained hypothesis would be the market feedback hypothesis, as
suggested by Jegadeesh, Weinstein and Welch (1993), and modeled by Van Bommel (2002).
According to these authors, market participants are better informed about the true value of the
firm than the initial shareholders. This information would be revealed to them by the evolution
of the stocks' price after the IPO. If this information were of a positive nature, the managers
would be encouraged to invest in the firm and issue more stocks subsequently.
These hypotheses are in total contradiction. In the signaling hypothesis, the managers
know the true value of the firm better than the market, and transmit their information through an
† See Ibbotson and Ritter (1995) for an international comparison of the degree of initial underpricing.
3
initial underpricing. In the market feedback hypothesis, the market participants are better
informed than managers are and their aggregate demand will reveal their information to the firm.
In this paper, we examine the impact of two IPO-related choices of the firm. One is the IPO
procedure chosen. The other is the post-IPO financing of the companies, which we examine by
including stock issues but also convertible bond issues, as well as bonds and stocks with attached
warrants (all potential shares). Most of the empirical work to date has looked at the first
seasoned equity issue following the IPO without taking into account other kind of security issues
following the IPO.‡
Our results show that the initial underpricing varies strongly according to the type of
securities first issued within a four-year period after the IPO. We find an average initial return of
24.31 % for the firms who issue security in the four-year period following the IPO but of 31.36%
for the firms who issue shares after the IPO and of 12.76% for those who issue convertible bonds
or security with attached warrants. Firms with low initial returns issue equity very scarcely, but
prefer to issue future equity in the form of convertibles or warrants. 32% of the firms with very
large initial returns carry out a seasoned equity offering, while this proportion is only of 6% for
the low initial returns IPOs. This result shows that managers take into account the assessment of
the market in their choice of subsequent security issues.
However, these results vary according to the chosen IPO procedure. For the fixed price
procedure, the initial return is significantly larger for the firms who return to the market within a
four-year period, whatever security is issued, compared to firms who do not return to the market.
The initial returns do not differ according to the type of security that is offered. For the
auction-like procedures (direct quote or reservation price method), the initial underpricing is not
different whether the firm returns to the market or not. These results may partially validate the
signaling hypothesis. We observe that there is a link between underpricing and subsequent
security offerings only for the fixed price IPOs. This link disappears for the auction-like
procedures. For the firms introduced by auction-like methods that return to the market, the initial
return is significantly higher for the equity issuers than for the convertible bonds or warrants ‡ Michaely and Shaw (1994) examine both equity and debt offerings. Jegadeesh et al. (1993) include units in their sample of SEO's.
4
issuers. In fact, we find that the firms introduced with these procedures go back to the market
whatever the initial return, but they decide on the type of security to issue according to this
return. The market feedback hypothesis as developed in the Van Bommel's (2002) model would
imply that the firms, encouraged by the investors, expand their activities. Our findings show that
the market feedback does not keep firms from getting new financing, but that it rather determines
the type of security to issue. In addition, the auction-like procedure should exhibit a greater
sensitivity to post-IPO returns than the fixed price procedure. When the feedback is not very
good, the initial shareholders decide to postpone the capital dilution by issuing either convertible
bonds or bonds or equity with attached warrants rather than straight common stock. This kind of
stage financing allows an initial IPO-related financing combined with a subsequent rounding out
of financing needs in the form of warrants or conversion of convertibles. Our results are
therefore less favorable to the market feedback hypothesis than those of Van Bommel and
Vermaelen (2002).
We examine further the post-IPO abnormal performances for several periods. The post-
IPO performances do not help to explain the decision to go back to the market. Whatever the
post IPO performances considered, the initial underpricing better explains the decision to issue
security during a four-year period following the IPO. Overall, our results tend to validate the
signaling hypothesis for the fixed-price IPOs, which are probably run by managers who know
better than the market the value of the firm. For auction-like procedures, the immediate market
feedback, measured by underpricing, seems to help to predict the type of subsequent security
offering, but not the financing itself. The managers listen only partially to the market: when the
message is unfavorable, rather than deciding not to invest at all, they prefer to use stage
financing.
The paper is organized as follows. In Section 2, we discuss the two competing
hypotheses: signaling hypothesis versus market feedback. In Section 3 we present the data. In
Section 4, we discuss the empirical results. A summary and conclusion are presented in the last
section.
5
II. Signaling hypothesis versus market feedback.
In this paper, we confront two competing hypotheses of IPO undervaluation: the
signaling and market feedback hypothesis. We believe the specifics of the French market are
very conducive to examining this question-for we have a neat split between fixed price and
auction-like procedures. In addition, we have a decomposition of the typology of subsequent
capital financing needs. We propose that the fixed price method, followed by a subsequent return
to the capital market in the form of stock issues will provide greater evidence for the signaling
hypothesis. An auction-like procedure is more compatible with market feedback.
2.1. Signaling hypothesis
We propose to further elaborate on the substantial body of empirical results that have
examined the signaling hypothesis.§ Though not necessarily formally, the IPO decision and the
subsequent financing decision, we suppose, are made at the same time by the initial shareholder
body. Thus the originating shareholders would accept an initial undervaluation in order to be
able to take advantage of future gains. Under this hypothesis, we should be able to prove a link
between the initial undervaluation and a subsequent return to the capital markets.
2.2. Market feedback hypothesis
In the case of the market feedback hypothesis, the market participants are better informed
than the managers are and in the aggregate will reveal their information to the firm. Here a
subsequent return to the capital markets will be a function of post-IPO abnormal returns. Thus if
post-IPO returns are favorable, they will consider returning to the market for subsequent
financing needs. The decision to return will be a positive function of the initial undervaluation as
well as post-IPO returns. One example of empirical validation of the market feedback hypothesis
§ See for instance the papers of Jegadeesh, Weinstein and Welch (1993), Garfinkel (1993), Levis (1995) and Spiess and Pettway(1997)
6
is in Van Bommel and Vermaelen (2002), who find that abnormal capital expenditures is 16.9%
greater when the market feedback is positive.
2.3. Choice of an IPO procedure.
We study the French market, which is characterized by several IPOs' procedures:** fixed-
price offer (FPO) and two auction-like mechanisms, direct quote (DQ) and reservation price
procedure (RPP).††
- Fixed price offer (FPO): the company announces a definitive and fixed price 48 hours before
the IPO. The total demand is computed. If the ratio of supply to demand is above 0.8%, the
issue is sold at the above price. If it is lower than 0.8%, the IPO is postponed and a higher
price is set. In this mechanism, there is no discretion allowed in the allocation of the shares.
In this case, investor demand has no effect on the price and quantity. Thus, the price is not a
function of the subsequent demand, but only of the strategic evaluation of the company
managers. A deliberately low price could be fixed in order to send a signal to investors. It is
for this reason that we think this procedure would be favored in the case of market signaling.
- The direct quote procedure (DQ) is a type of limited auction; the minimum price and the
quantity are determined 48 hours before the IPO and investors submit market and limit
orders. The total demand is computed. If it is large, the price is raised up to a limit of 10%,
and there is a prorata rationing between all eligible orders. If the proportion of filled orders
is less than 5%, the IPO is postponed at a fixed price procedure.
- Reservation price procedure (RPP). The initial shareholders set the quantity offered and the
minimum acceptable price five days before the IPO. The investors submit limit orders. The
total demand function is computed and the EURONEXT sets the IPO price as a function
(non-explicit) of this demand. Euronext determines as well the maximum price. Orders
greater than the maximum price are eliminated, because they are considered as not revealing
** The characteristics and description of the French market can be found in Faugeron-Crouzet and Biais (1996). †† Until 1999, the names of these mechanisms were "procédure ordinaire" for "cotation directe", "mise en vente" for "offre à prix minimal" and “offre publique de vente” for “offre à prix ferme”. Since 1994, the bookbuilding mechanism is used more and more often (see Derrien and Womack, 2002). From 1994 to 1998, half of French IPO's have used such a mechanism, quite similar to the U.S. procedure. But insofar as we need a four-year post-IPO sample, we have not included IPO's using this procedure.
7
useful information about the true value of the firm. Orders above the IPO price and below the
maximum price are allocated prorata. When the demand is too high, the IPO is postponed,
and transformed to a fixed price procedure.
Thus for the two latter procedures, the final offer price is a function of investor demand. Still,
it has to be noted that this price adjustment is only partial because the price can only partially
adjust (which leads to the initial undervaluation). Thus, we feel that these two auction-like
procedures would in no way be compatible with signaling, but rather market feedback, since the
price is in some measure influenced by investor demand. Once this information is known, the
managers of these IPO firms will decide to solicit the capital market again as a function of post-
IPO returns, as well as initial IPO undervaluation.
2.4. Choice of a subsequent type of security offering
Previous empirical work has looked at the first seasoned equity issue following the IPO
without taking into account other kind of security issues, thus firms which have issued
convertible bonds after their IPO have been considered as non-issuer firms. Furthermore, firms
are considered as belonging to the equity issuers group even when they have first issued
convertible bonds after their IPO. If the signaling hypothesis is verified, the cost of initial
underpricing is recouped through the subsequent seasoned equity offering, which is explicitly
considered at the IPO's date for the totality of the capital needs of the firm. We should thus
observe a link between initial returns and subsequent seasoned equity offering.
If the market feedback hypothesis were true, large abnormal returns at IPO issuance and
during the months following the IPO would encourage the managers to invest and to finance
these investments, without regard to the kind of securities offered to investors. We should then
observe a link between subsequent seasoned equity offerings and both the IPO undervaluation
and post-IPO returns. Should we consider now the type of subsequent securities issued in the
context of the market feedback hypothesis? We think so, since positive market feedback should
encourage managers to expand whereas negative feedback should discourage further
investments, whatever the form of financing. Convertible bonds as well as unit offerings offer
8
the possibility of stage financing.‡‡ When initial market feedback is not very positive, managers
may nevertheless envisage future investments and issue convertibles bonds. As is well known,
convertibles are hybrids, offering the immediate advantages of debt, as well as the possibility of
converting them a future positive evolution of the company stock. As for units, they allow for an
immediate financing by stocks, and a subsequent secondary future stock issuance by the exercise
of the warrant. In these two cases, this kind of stage financing represents a sort of commitment
by managers to follow closely the futur signals of the market. If these messages are positive,
convertible bonds will be converted and warrants exercised.
Summary of the above propositions
In the case of the signaling hypothesis, for which the managers are better informed than the
market, we should observe the following:
- a positive correlation between underpricing and further seasoned offering.
- the probability of a seasoned equity issue would be more closely linked to the initial returns
than to the post-IPO abnormal returns
- A lower percentage of the capital offered in the IPO
- A lower level of divestiture by the initial shareholders at the time of the IPO
For market feedback, we should observe the following:
- A subsequent financing when the market sends a positive signal in the form of positive
post-IPO returns, which also translates into a positive correlation between the probability of
IPO issuance and post-IPO returns.
- No subsequent financing if the market message is unfavorable.
III. Data presentation
Our sample consists of 288 firms that made an initial public offering on the French "second
marché" between 1983 and 1994. The "second marché" is a tier of the stock market in France
‡‡ On stage financing, see Schulz (1993) for unit offerings and Cornelli and Yosha (2002) for convertibles.
9
created in 1983 for growth firms for which the listing requirements are less stringent than for the
official list (first tier). In 1996, the French market welcomed a new tier, the "nouveau marché"
for young and technological companies, which are not included in our analysis. The data
excludes the investment certificates, “certificats d’investissement” issued by the big French
bank, Credit Agricole, as well as the IPO’s which were only transfers from the French OTC
market (“hors cote”). EURONEXT, (the French Stock Exchange), provided most of the data.
Other data was taken from the Annual Reports duly filed at the COB, (“Commission de
Operations de Bourse”, the French equivalent of the SEC). We also use the prospectuses filed by
the companies, which accompanied the IPO and the seasoned security issues. The abnormal
returns for the post-IPO periods are calculated using the data of the AFFI-EURONEXT database.
The sample includes initial stock issues by the three different procedures previously
presented: fixed price offer, direct quote and reservation price procedure. Since 1993, IPO
issuance can also take place through a bookbuilding process. In this case, the underwriter plays a
central role. He allocates the offering in a discretionary fashion. In recent years (1996-2000), a
large part of the IPO's used the bookbuilding procedure. Note that unlike in the US,
bookbuilding on the "second marché" is compulsorily accompanied, for a fraction of the shares,
by another procedure (most frequently fixed price procedure or open price procedure). We did
not include the bookbuilding IPOs in the sample due to their small number (15) during the period
(1983-1994) which we take into account.
There were 288 companies in the sample involving a total of 95 security offerings during
the four years (between 1983 and 1998) following the initial issuance. The security issues
concerned stocks in 59 cases, convertible bonds or bonds with attached warrants in 23 cases,
units of stocks and warrants in 13 cases.§§ Thus, about a third of the issuing companies were
found to go back to the market within four years of the IPO for additional capital. In our sample,
almost all the IPO's were secondary offerings, issued by original shareholders, while the
§§ We have here taken into account two types of capital emissions: on the one hand stocks, on the other convertibles and units. We characterize the latter as "hybrid", and group them into one category due to the comments made in Section 2.4. In our sample, there were no subsequent straight bond issues for any of the firms.
10
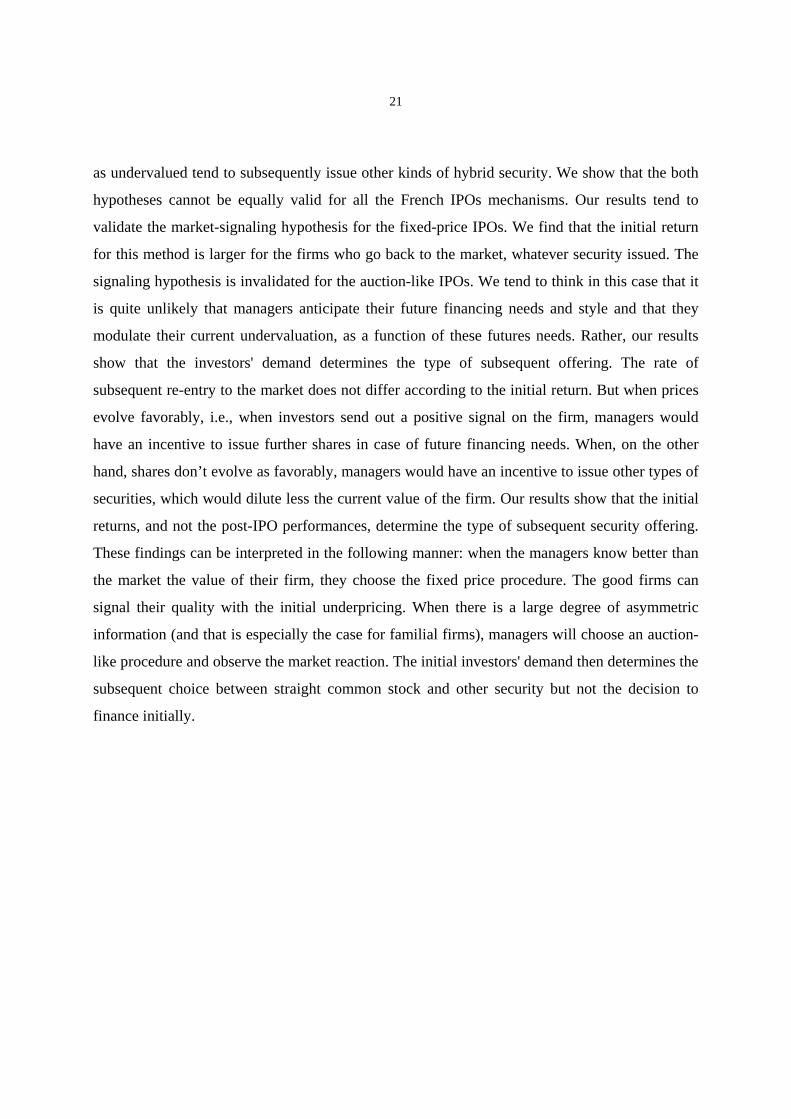
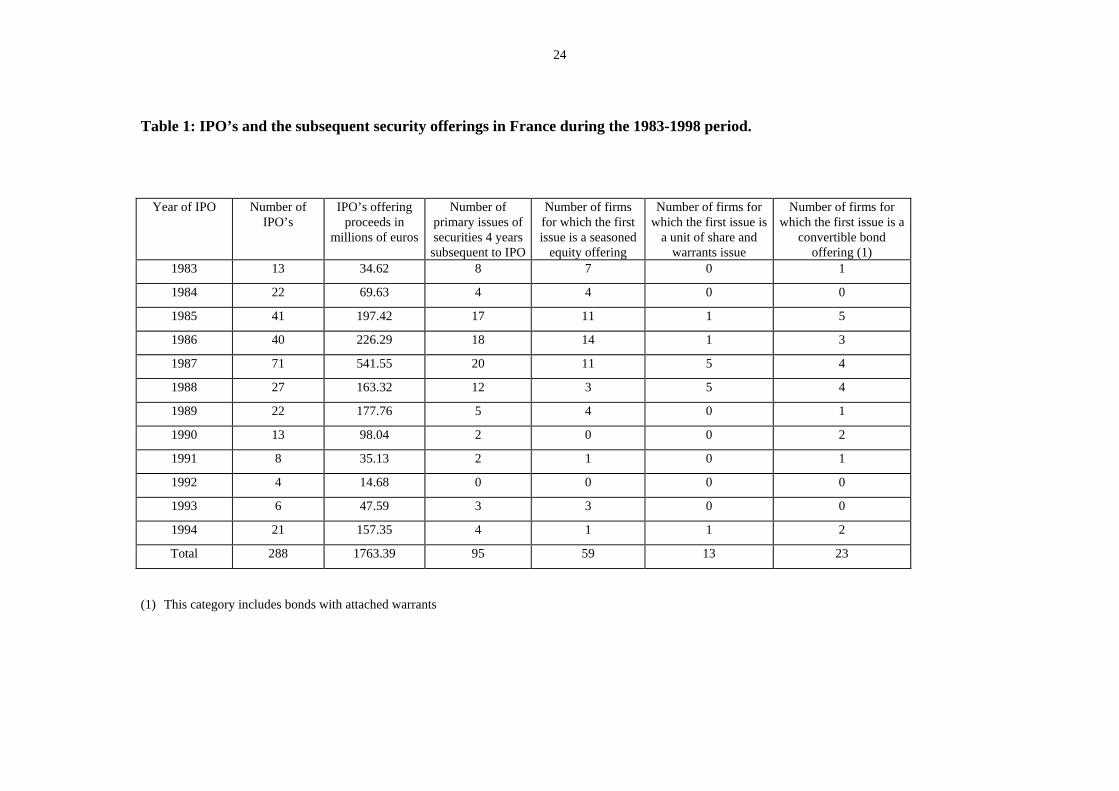
seasoned offering consists almost exclusively of primary market offerings. Table 1 presents the
different kinds of securities issued subsequent to an IPO.***
Insert table 1 here
The number of operations and the capitalization vary considerably by year. One can see that
great IPO activity and a large proportion of the firms returning to the market within the next four
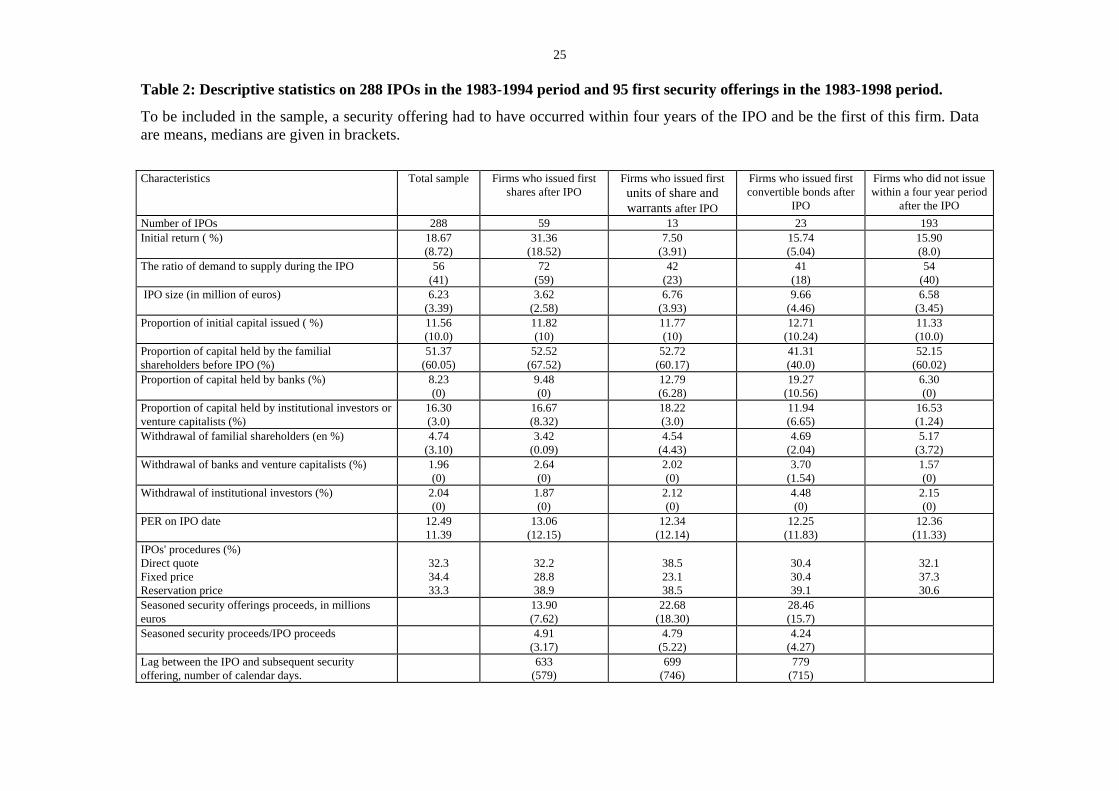
years characterize the 1985-1989 period. Table 2 sums up the characteristics of the companies
that were introduced into the stock market, as well as those who came back to the market within
a period of 4 years subsequent to the IPO.
Insert table 2 here
At the initial offering, the mean IPO size is 6.23 millions euros. The mean IPO initial
return for our sample, defined as the return from the offer price to the first market-clearing price
after the IPO, is 18.67%. The initial return is equal to 31.36% for firms who first issued common
stock after the IPO, 7.5% for firms who first issued units of stock and warrants, and 15.74% for
firms who issued convertibles bonds or bonds with warrants. This result can be compared to
Jegadeesh et al's (1993) findings that units are 14% less underpriced than common stock,
everything else being equal. Michaely and Shaw (1994) do not find any differences in initial
returns according to issuance of equity or debt.
The mean percentage of the shares proposed to investors in the IPO, 11.56%, is very close
to 10%, the minimum required percentage. French firms are mostly family held. On average,
51.37% of the shares are held by the familial shareholders, while banks hold 8.23% of the shares,
and institutional investors or venture capitalists 16.3%. During the period of our study (1983-
1994), the shares offered in IPOs were mostly secondary shares. On average, the familial
*** Between 1983 and 1994, the original shareholders sold the minimum 10% of shares and relied on subsequent seasoned issues to issue new shares. Things have changed after 1996, when 50% of IPO's on the "nouveau marche" are primary issuances.
11
shareholders sold 4.74% of the capital, banks 1.96% and institutional investors or venture
capitalists 2.04. The IPOs divided equally into the three groups of procedures.
The characteristics of the IPO-issuing firms vary widely depending on whether a subsequent
share issuance or other security issuance followed the IPO. The degree of initial underpricing,
the capitalization and the ownership structure seem quite different in the various scenarios. In
particular, firms who issue hybrid security after the IPO show a larger IPO size and a higher
proportion of capital held by banks than those who issue common stock. The mean ratio of the
seasoned security offering proceeds to the IPO proceeds is 4.91 for the firms who issue common
stock and 4.43 for the firms who issue other securitities. The mean lag between the IPO and the
first subsequent security emission is 633 days for stocks, 699 for units and 750 days for
convertible bonds (but the difference is not significant).
IV. Empirical results
We first examine the initial and post IPO performance according to whether the firm
reenters the market or not. We futher analyze if our results depend on the IPO procedure and on
the type of security the firm chooses to issue. To complete our analysis, we examine the link
between performance, IPO procedure and subsequent financing.
4.1 Performance as a function of the subsequent financing decision.
The initial underpricing is calculated as the difference between the first market clearing
price and the IPO offer price, as a percentage of the offer price (calculated on raw returns) for the
total sample. Further, we look at post IPO performance for the 90 IPOs for which the data were
available over the 1983-1994 period.††† First, we compare the cumulative abnormal returns over
several periods (10 day-period after the IPO, one-month, 3 months, 6 months, one-year) with the
secondary market index as the benchmark portfolio. The secondary market index seems more
appropriate than a more general index because it accounts for the size effect, as most IPOs are
††† There were quite a few missing data points here, especially for the earlier part of the sample.
12
small-size stocks. Several studies have shown that the initial return is a significant predicting
factor for post IPO performance, if we consider a period from three months to one year. Thus,
Affleck-Graves, Hedge and Miller (1996) show that abnormal returns three months after IPO are
positively correlated with the initial return. Considering several different classes of IPO’s,
Krigman, Shaw and Womack (1999) show that the IPO performance in the year following the
IPO issuance is also positively correlated with the initial performance, with the exception of
IPO’s who have exceptional initial performance (greater than 60%). These latter IPO’s are
shown to register the weakest post-IPO one-year performance.
Insert table 3 here
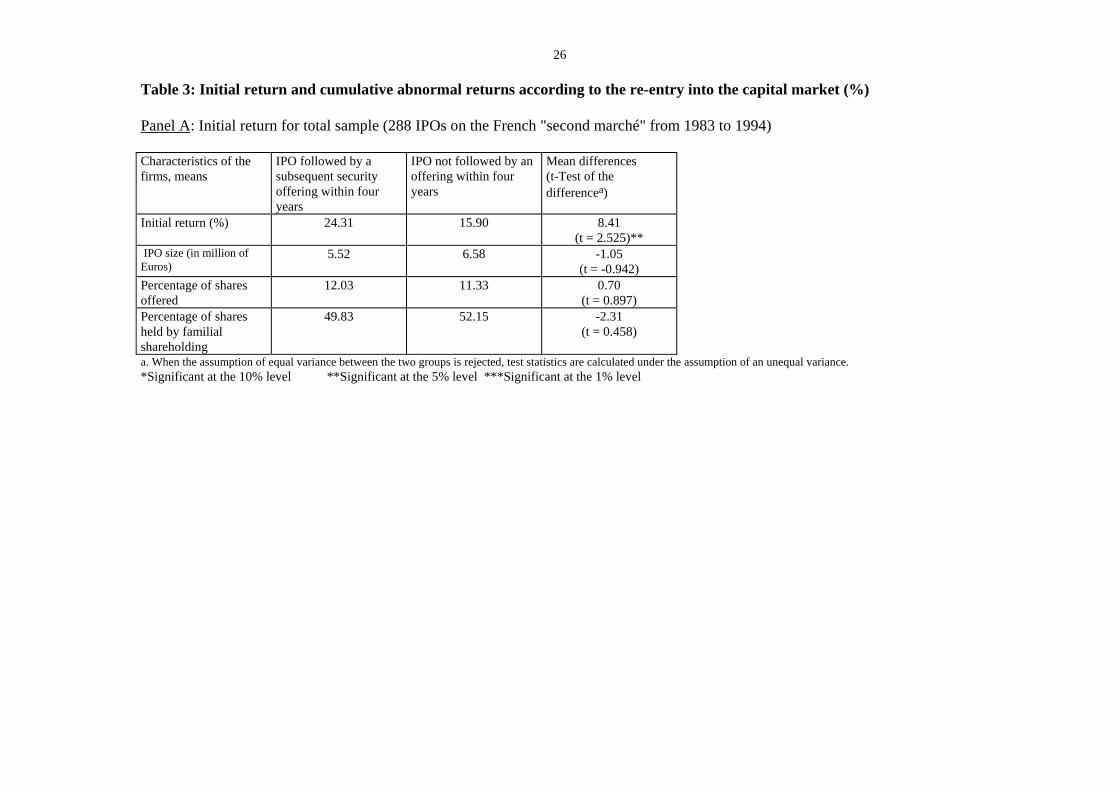
The IPOs that are followed by a subsequent financing are smaller in size (IPO size of 5.52
million euros versus 6.58 million euros, but this difference is not statistically significant).
Neither the percentage of shares offered, nor the level of familial shareholding differs according
to subsequent re-entry to the capital market. However, the IPOs followed by a subsequent
financing are significantly more undervalued than the others: the difference is of 8.41% (Table 3,
Panel A). There seems to be a positive correlation between the initial underpricing and the
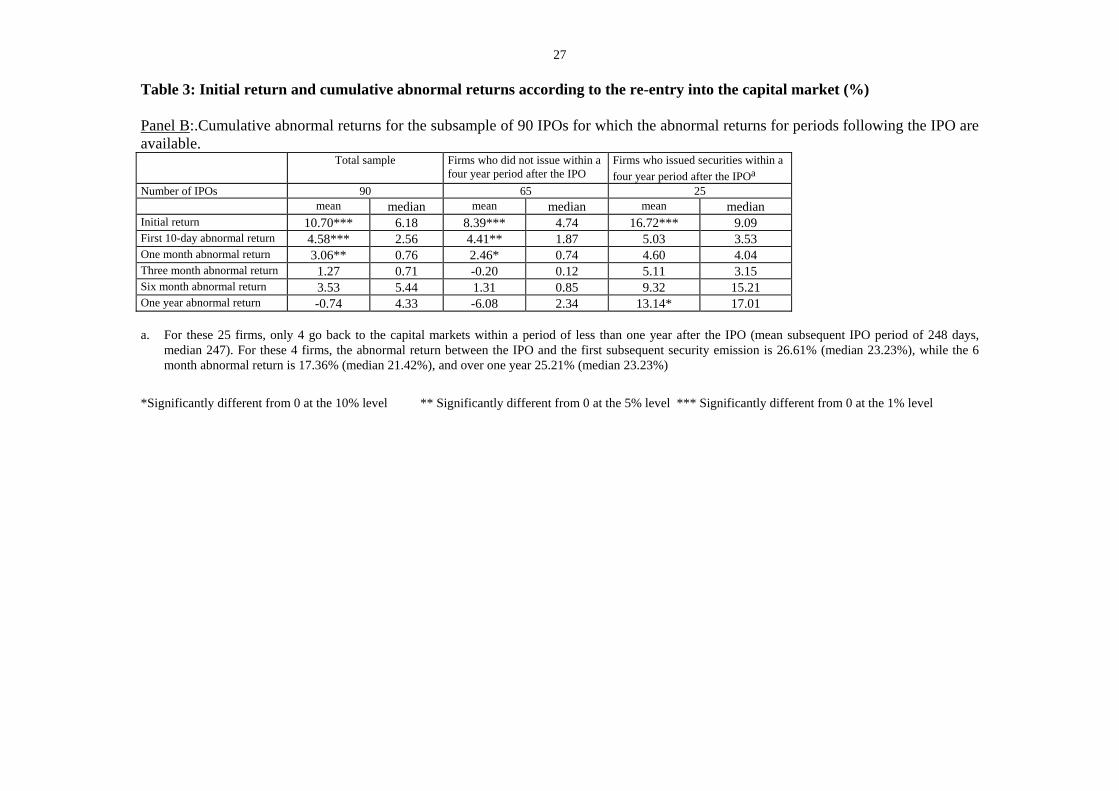
subsequent re-entry to the capital markets. We find that the abnormal returns are on average
positive and significantly different from zero for the first 10-day period and the first-month
period (Table 3, Panel B). For the following periods, the abnormal returns are generally not
significantly different from zero. We note that they are significantly larger for the firms who
return to the market after the IPO, for the one-year period only. For shorter periods, the returns
are still larger, but not significantly so.
Insert table 4 here
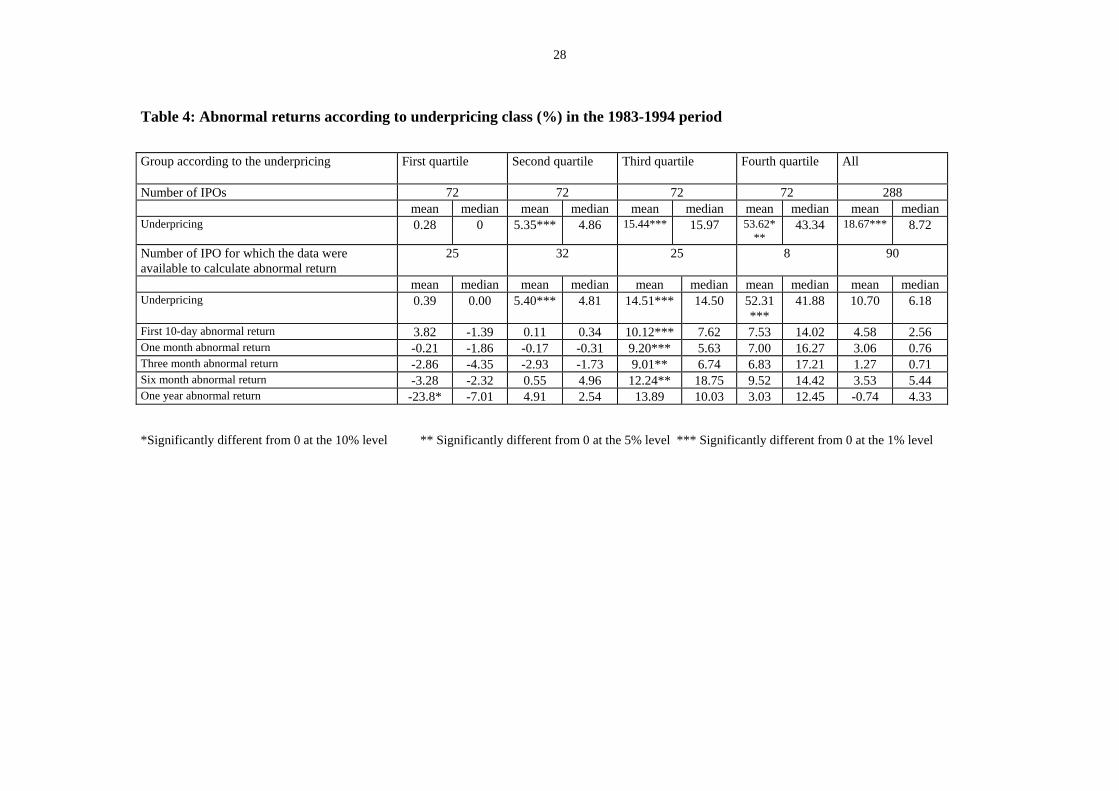
We categorize four classes of IPO's (corresponding to the quartile of underpricing) to
examine the relation between the initial undervaluation and subsequent abnormal returns for
different periods ranging from 10 days to one year by the undervaluation quartiles we have
13
defined previously (table 4). When we examine the results according to the different
underpricing classes, we note that the post-IPO performance is significantly higher for all the
periods, for the firms belonging to category 3, compared to those belonging to categories 1 and
2‡‡‡. However, there is no significant correlation between initial underpricing and the abnormal
returns for longer periods.
Further, we find that the first quartile IPOs performance declines on average in the
periods following the offering. Among the firms with no underpricing (initial return equal or less
than zero), a majority (34 out of 41) show an initial return exactly equal to zero. This is
presumably due to temporary price support from the banks as described by Ruud (1993) and
leads to price decreases after the period of price support. We have only the abnormal returns
following the IPO for 14 observations among the 34 IPO with zero initial returns. For these
IPOs, the abnormal return is on average of –1.80% (median –1.85%) for the first month period,
of –9.06% (–8.26%) for the six-month post IPO period, and of –18.70% (–13.67%) for the first
year after the IPO. Thus, we do not find a significant correlation between the initial
undervaluation and the abnormal returns but these seem to be higher for the firms with a high
initial undervaluation.
These results are compatible with our two maintained hypotheses: in the case of the
signaling hypothesis, those firms who come back to the capital markets allow their IPO's to be
undervalued in the hopes of creating a favorable impression on investors. In the other case, an
initial undervaluation and high abnormal returns would encourage managers to return to the
capital markets quite quickly. In both cases, a rationale is provided for subsequent security
issuances. But these results depend strongly on the IPO procedure and on the type of subsequent
security the firm decides to offer.
4.2. The relation between performance, IPO procedure and the type of subsequent security
issued.
‡‡‡ The number of firms included in the fourth quartile is too low to conclude.
14
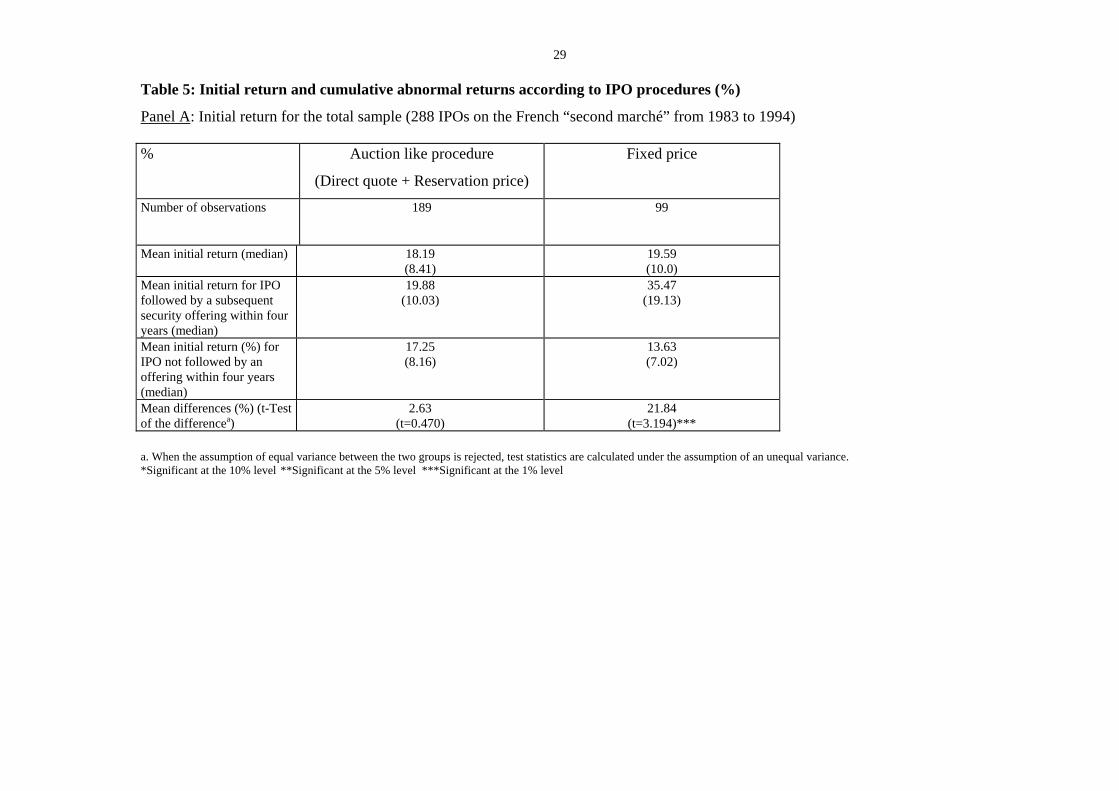
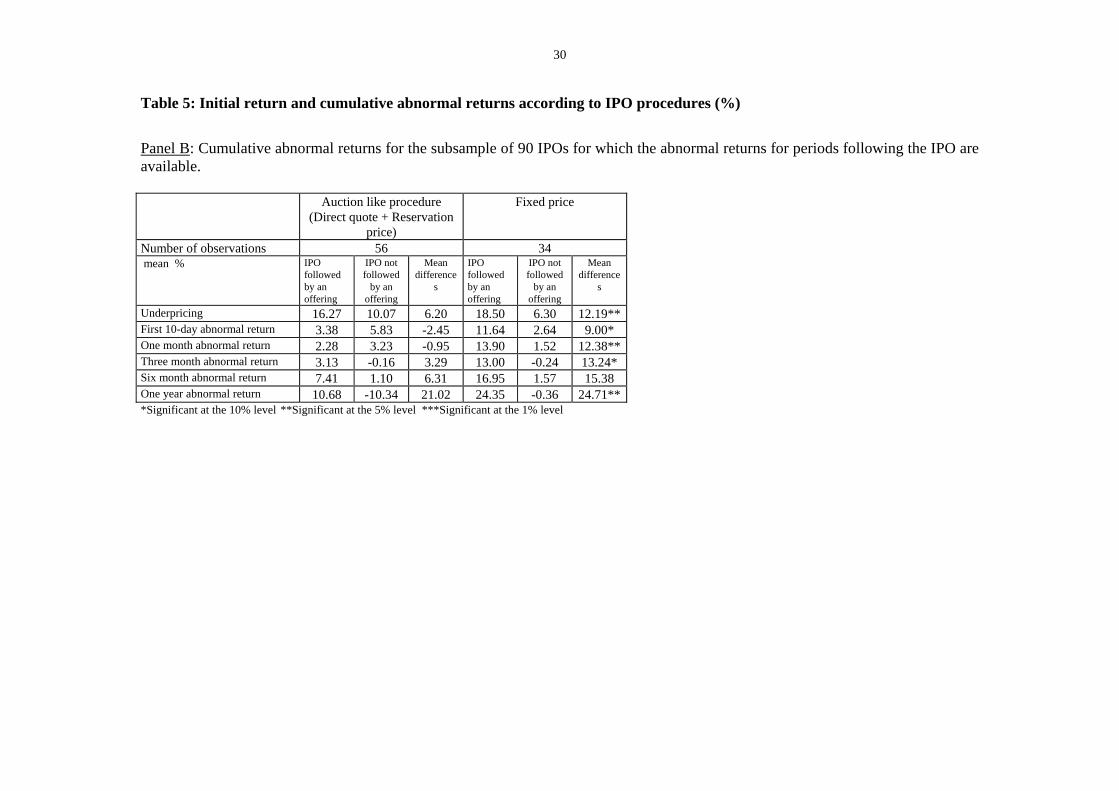
Insert table 5 here
In the case of auction-like procedures (direct quote and reservation price), the initial
return is not significantly different whether or not the firm returns to the capital market
subsequently (Table 5, Panel A). On the contrary, for the fixed price IPOs, the initial return is
21.84% larger for the firms that re-enter to the market within a four-year period. When we look
at the post-IPO abnormal performances, we find that these performances do not differ
significantly according to the IPO procedure (Table 5, Panel B). On the other hand, for fixed
price IPO's, abnormal performance is, for most of the periods, significantly higher for firms that
return to the market, while for the auction like procedures, the performances are not significantly
different for the two types of firms. Still, we note that the results depend on the type of
subsequent security the firm decides to issue.
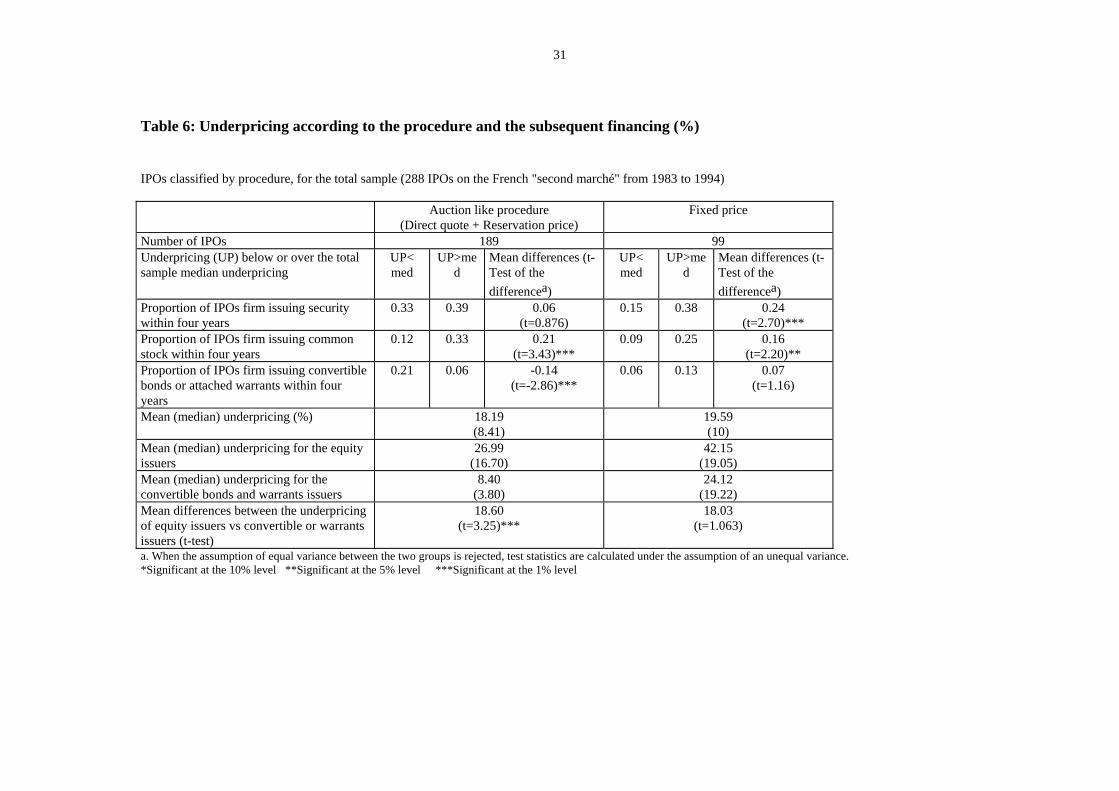
Insert table 6 here
We split the sample according to the IPOs' procedure and to whether the underpricing is
below or above the median underpricing (table 6). The rate of re-entry to the market does not
depend on the underpricing group for the auction-like procedure IPOs. However, the nature of
the issued security depends on the underpricing level: the firms belonging to the low
underpricing group tend to choose convertible bonds or warrants issue rather than common stock
whereas the group of IPOs with large underpricing tends to choose common stock. We futher
look at firms that were overpriced: the proportion of firms reentering the market was still 30%.
Our findings show that the firms that introduced with an auction-like procedure go back to
the market whatever the initial return, but they decide on the type of security to issue according
to this return. This result can hardly be explained in the light of the signaling hypothesis. This
hypothesis would imply that the initial shareholders would undervalue their shares as a function
of the securities they plan to issue subsequent to the IPO, which is unlikely. The market feedback
hypothesis as developed in the Van Bommel (2002) model would imply that the firms,
encouraged by the investors, expand their activities. Our findings show that the market feedback
15
does not keep firms from getting new financing, just that it determines the type of security to
issue. When the feedback is not very good, the initial shareholders decide to postpone the capital
dilution by issuing rather convertibles bonds or units than straight common stock. On the other
hand, the fixed price IPO firms return to the market more frequently when the underpricing is
large. They issue common shares or other securities in a very similar proportion in both classes
of underpricing. And the level of undervaluation is not significantly different between the
security categories. The above results militate strongly in favor of the signaling hypothesis for
the fixed price procedure.
4.3 Cross sectional regression results.
We close out this section by using cross sectional regression analysis. We introduce
control variables suggested by previous studies, to verify if our results hold every thing else
being equal. In particular, we examine the impact of the period of the IPO, the percent of the
capital that is introduced, and the ownership structure. We try to determine to what extent the
initial undervaluation is a function of the following variables:
Security: this variable is a binary variable equal to 1 if the firm issues securities within 4 years
subsequent to the IPO.
Equity: this variable is a binary variable equal to 1 if the first recourse to the capital markets
within 4 years subsequent to the IPO is in the form of share issue.
Potential equity: this variable is again a binary variable equal to 1 if the first recourse to the
capital markets within 4 years subsequent to the IPO is in the form of convertible bonds or units
with attached warrants.
Proceeds is the IPO size in millions of Euros
DQ is a dummy variable equal to one for direct quote procedure.
Percent: proportion of the total shares introduced to the market.
PER: ratio of IPO's offer price with respect to earnings per share in the year preceding the IPO.
Activity: this variable is equal to 1 if the IPO period is characterized by strong stock introduction
activity. We characterize a period as being one of strong activity if six months prior to the IPO,
16
the volume of listed IPO stocks belonged to the highest quartile. According to the market
feedback hypothesis, companies tend to introduce shares to the market during periods of high
share activity. During these periods, information asymmetry would be substantially diminished:
the risk to an investor of being misinformed in acquiring IPO’s being lower than during less
active periods (see Booth and Chua, 1996).
Fam: a variable indicating the fraction of capital held by a family type shareholding structure
before the IPO (%)
Period: this variable is equal to 1 if the IPO takes place in the first period (1983-1987) and zero
otherwise. The 1983-87 period is characterized by the increased importance of the secondary,
small cap markets. The 1987 crash and subsequent investor pessimism put a temporary brake to
the growth of the secondary market and also temporarily slowed down activity.
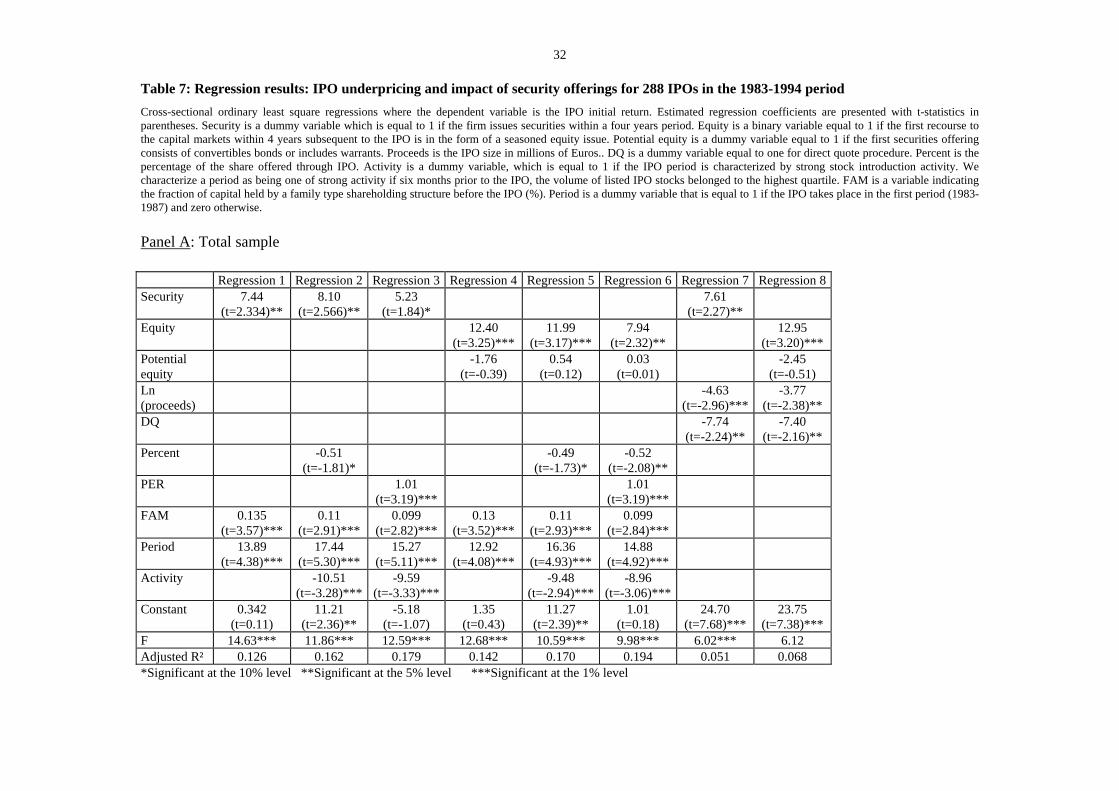
Our results are given in table 7, for the total sample in panel A, and for subsamples by
IPOs' procedures in panel B.
Insert table 7 here
We can see from the table 7, panel A, that, everything else being equal, companies who
go back to the capital markets by issuing subsequent shares are on average from 8 to 12% more
undervalued depending on the model. Firms using other security issues are not, on average, more
undervalued. For those firms who go back to the market whatever security they choose to issue,
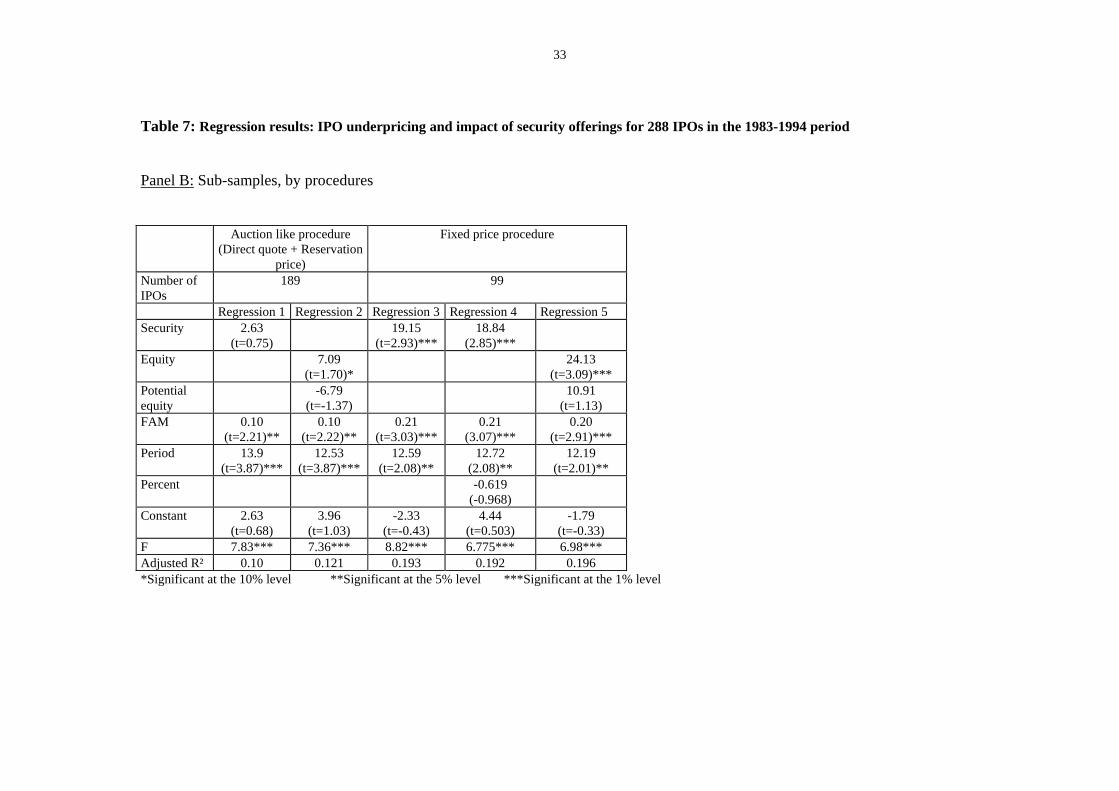
the initial return is from 5 to 8% larger. When we examine the results by IPOs' methods, the
results are different (Table 7, Panel B). The variable security has a significant positive effect
only for the fixed price IPOs. For this IPO method, firms who return by way of share issue are
more underpriced by 24%. For the auction-like procedures, the initial return does not depend on
the fact that the firm re-enters the market. The undervaluation increases when the firms issue
equity, but this result is significant at the 10% level only.
These findings tend to validate the signaling hypothesis for the fixed price IPOs. We
observe that there is a link between underpricing and subsequent security offerings only for this
17
procedure. This link disappears for the auction-like procedures. But for the firms introduced by
auction-like methods that return to the market, the initial return is significantly higher for the
equity issuers than for the convertible bonds or warrants issuers. The signaling hypothesis would
imply that the initial shareholders would undervalue their shares as a function of the securities
they plan to issue subsequent to the IPO, which is unlikely. Our findings rather tend to comfort a
different market feedback for the auction-like procedures. When the initial feedback is not very
good, the managers decide to postpone the capital dilution by convertibles bonds or equity with
attached warrants rather than straight common stock.
The undervaluation decreases with the percentage of the capital introduced on the stock
market. This result is consistent with the signaling models (Chemmanur, 1993 or Grinblatt and
Hwang, 1989): the initial shareholders have to choose between selling shares in the IPO or later.
Underpricing concerns them all the more insofar as they sell a large number of shares in the IPO.
The signaling mechanism implies that they sell few shares in the IPO at a low price, and the rest
of the shares later at a higher price. However, when we examine the results for the subsamples
by procedures (Table 7, Panel B), the variable percent is not any more significant.§§§ We have
seen that the signaling mechanism can only be valid for the fixed price IPOs. The result
concerning the percent of the capital can not be interpreted in favor of the signaling model. But
as most French IPOs over the period 1983-1994 choose a percentage very close to the minimum
required of 10%, this finding can hardly be judged as being a rejection of the signaling
hypothesis, either. The undervaluation increases in the case of companies who have high PER’s.
These companies are growth firms, for whom one would think that the information asymmetry
issue would be more relevant. More asymmetric information would lead to more undervaluation.
The initial return is significantly larger (about 14%) during the first period of activity in
the secondary market in France (1983-1987). After the 1987's crisis, the second market had real
difficulties in attracting firms and investors. The undervaluation decreases during “high activity”
periods, all else being equal. We therefore confirm that during these periods, the risk to an
§§§ This result is also confirmed for the auction-like procedure, but not reported in the Table.
18
investor of being misinformed in acquiring IPO’s would be lower than during more active
periods. We confirm the Booth and Chua's (1996) intuition. ****
The undervaluation is also more important for family firms (for whom information
asymmetry is more important than less closely held firms). We can observe that the
undervaluation is a significantly increasing function of the percentage of the capital held by
familial shareholding before the IPO. These companies are frequently smaller than average.††††
We conjecture that information asymmetry is probably larger in such a case, and thus potential
investors would require a larger initial undervaluation to be willing to subscribe to these issues.
On the other hand, these firms could also be interested in having a more diffuse ownership
structure after the IPO, and thus undervalue on purpose in order to increase the demand/supply
ratio, in the interest of limiting large blocks of competing shareholders. Thus the amount
allocated to each individual shareholder would be smaller (which is often the case when the
issuing procedure is either that of the reservation price or fixed price). According to the signaling
models (Allen and Faulhaber, 1989), firms would tend to use the underpricing as a quality signal,
whatever their shareholder structure. On the other hand, the market feedback hypothesis implies
that the more difficult it is to value a firm, the greater the degree of initial undervaluation.
Companies dominated by one family holding or by a manager are generally less easy to value
than those who have already opened up their capital to a bank or a venture capitalist.‡‡‡‡
4.4. Logit study of the probability of kind of subsequent security offering.
The following logit model is estimated: P(Y)i = ))'(exp(1
1βα iX+−+
**** During more recent periods (1992-1998) Derrien and Womack (2002) show that the market's price momentum in the three months prior to an offering is a significant ex ante predictor of the level of underpricing of French IPOs. Here our results are different. This difference may be due to the period studied or to the variable used to measure hot markets (IPO volume in our study and market momentum in the Derrien and Womack study).. †††† The average sales of family firms are on the order of euros 57 millions, as opposed to euros 119 millions for non-family firms. ‡‡‡‡ On the relationship between shareholder structure and IPO’s, see Mello and Parsons (1998), Stoughton and Zechner (1998), and Maug (1996).
19
The dependent variable is a dummy variable equal to 1 alternatively if a firm issues equity,
convertible bonds or warrants within four years of its IPO (variable issue) or if a firm issue
common stock only (variable equity). The independent variables are the following:
- the initial return
- abnormal post-IPO returns for various periods
- the logarithm of IPO size
- the rate of withdrawal of familial shareholders during the IPO (equal to the difference
between familial shareholding before the IPO and after the IPO)
- the period, a dummy variable which equals one if the IPO takes place during the 1983-1987
period.
The results are given in table 8, panel A for the total sample, and panel B for the IPOs for which
the post-IPO abnormal performances are available.
Insert table 8 here
When we look at the total sample (panel A), we find that the probability that a firm issues equity
subsequent to the IPO decreases with its size. The probability of a subsequent issue decreases
with the rate of withdrawal of the familial shareholders during the IPO. It seems that when the
current familial shareholders sell their shares during the IPO, they don't want to dilute their
holdings any more, and they prefer not to go back to the market.
Let's go back again to our two underlying hypotheses. The results here which tend to favor
the market signaling hypothesis are the following:
- The probability of coming back to the market increases with the degree of initial
undervaluation. In effect, the cost of the initial signal is recouped through subsequent
financing, the existence of the signal implying a subsequent financing.
- The probability of returning to the market is a decreasing function of rate of withdrawal of
family shareholders.
20
- The signal by undervaluation is above all useful in the presence of a strong information
asymmetry. If one considers this especially true for smaller size IPO's, our finding of an
inverse relation between size and probability of subsequent issue militates in favor of the
signaling hypothesis.
Finally, according to the market feedback hypothesis, the positive relation between post IPO
returns and subsequent financing (whatever the type) should be true for the auction-like
procedure whatever the type of subsequent financing, while we show this to be so for common
stock only.
Further, the results in Table 8, panel B, indicate that the post IPO abnormal performances do
not help to explain the decision to go back to the market. Whatever the post IPO performances
considered,§§§§ the initial underpricing better explains the decision to issue security during a
four-year period following the IPO. These findings are in contradiction with the Jegadeesh,
Weinstein and Welch (1993) results. These authors find a stronger relation between the abnormal
return in the 20-day period after the IPOs (or the following 20-day return) and the likelihood of
future seasoned offerings than between initial IPO returns and the likelihood of future seasoned
offerings. Due to the small number of observations, we could not split our sample according to
the IPOs' procedure to check if our results hold for the different IPO mechanisms. Thus "market
feedback" managers seem to use positive post IPO results to use stage financing, which they
would hope assures investor goodwill.
V. Conclusions
In this article we have examined the relationship between the initial underpricing and the
subsequent recourse to the capital markets and IPO issue procedure. There are two possible
explanations for this undervaluation: signaling and market feedback. In our paper, we used a
relatively new database, which includes not only subsequent share issues but also issues of other
securities, like convertibles bonds or units of bonds or stocks with warrants. We find that the
firms which are more undervalued tend to subsequently issue shares; those firms which are not
§§§§ We report the results with a one-month performance, but the results are similar with the other periods.
21
as undervalued tend to subsequently issue other kinds of hybrid security. We show that the both
hypotheses cannot be equally valid for all the French IPOs mechanisms. Our results tend to
validate the market-signaling hypothesis for the fixed-price IPOs. We find that the initial return
for this method is larger for the firms who go back to the market, whatever security issued. The
signaling hypothesis is invalidated for the auction-like IPOs. We tend to think in this case that it
is quite unlikely that managers anticipate their future financing needs and style and that they
modulate their current undervaluation, as a function of these futures needs. Rather, our results
show that the investors' demand determines the type of subsequent offering. The rate of
subsequent re-entry to the market does not differ according to the initial return. But when prices
evolve favorably, i.e., when investors send out a positive signal on the firm, managers would
have an incentive to issue further shares in case of future financing needs. When, on the other
hand, shares don’t evolve as favorably, managers would have an incentive to issue other types of
securities, which would dilute less the current value of the firm. Our results show that the initial
returns, and not the post-IPO performances, determine the type of subsequent security offering.
These findings can be interpreted in the following manner: when the managers know better than
the market the value of their firm, they choose the fixed price procedure. The good firms can
signal their quality with the initial underpricing. When there is a large degree of asymmetric
information (and that is especially the case for familial firms), managers will choose an auction-
like procedure and observe the market reaction. The initial investors' demand then determines the
subsequent choice between straight common stock and other security but not the decision to
finance initially.
22
References
Affleck-Graves, J., S. Hedge and R.E. Miller, 1996, Conditional price trends in the aftermarket
for initial public offerings, Financial Management, 25, 25-40.
Allen, F. and G. Faulhaber, 1989, Signaling by Underpricing in the IPO Market, Journal of
Financial Economics, 23, 303-323.
Biais, B. and A.M. Faugeron-Crouzet, 1996, Selling mechanisms, conflicts of interests and
asymmetric information: an empirical analysis of the IPO process in France, Working paper,
Université de Toulouse.
Biais, B. and A.M. Faugeron-Crouzet, 2002, IPO auctions, Journal of Financial Intermediation,
11, 9-36
Booth, J.R. and L. Chua, 1996, Ownership Dispersion, costly information and IPO underpricing,
Journal of Financial Economics, 41, 291-310.
Chemmanur, T., 1993, The Pricing of Initial Public Offerings: a Dynamic Model with
Information Production, Journal of Finance, 48, 285-304.
Cornelli, F. and O. Yosha, 2003, Stage financing and the role of convertible debt, Review of
Economic Studies, 70, 1-32.
Derrien, F. and K.L. Womack, 2003, Auctions vs bookbuilding and the control of underpricing
in hot IPO markets, Review of Financial Studies 16, 31-61..
Garfinkel, J.A., 1993, IPO underpricing, insider selling and subsequent equity offerings: is
underpricing a signal of quality? Financial Management, 22, 74-83.
Grinblatt, M. and C. Hwang, 1989, Signalling and the Pricing of New Issues, Journal of
Finance, 44, 393-420.
Ibbotson, R.G. and J.R. Ritter, 1995, Initial Public Offerings, in: R. Jarrow and al. Eds,
Handbooks in OR and MS, Elsevier Science B.V., 9, 993-1016.
Jegadeesh, N., Weinstein M. and Welch I., 1993, An empirical investigation of IPO returns and
subsequent equity offerings, Journal of Financial Economics, 34, 153-175.
Krigman, L., Shaw W. and Womack K., 1999, The persistence of IPO mispricing and the
predictive power of flipping, Journal of Finance, 54, 3, 1015-1044
23
Levis, M., 1995, Seasoned equity offerings and the short and long term performance of initial
public offerings in the UK, European Financial Management, 1, 125-146.
Maug, E., 2001, Ownership structure as a determinant of IPO underpricing: a theory of the
decision to go public for venture capital backed companies, European Finance Review, 5,
167-200
Mello, A.S. and Parsons J.E., 1998, Going public and the ownership structure of the firm,
Journal of Financial Economics, 49, 79-109.
Michaely, R. and W.H. Shaw, 1994, The pricing of initial public offerings: tests of adverse-
selection and signaling theories, The Review of Financial Studies, 7, 279-319
Ruud, J.S., 1993, Underwriter support and the IPO underpricing puzzle, Journal of Financial
Economics, 34, 135-151
Spiess, D.K. and R.H. Pettway, 1997, The IPO and the first seasoned equity sale: issue proceeds,
owner/managers’ wealth, and the underpricing signal, Journal of Banking and Finance, 21,
967-988.
Stoughton, N. and J. Zechner, 1998, IPO mechanisms, monitoring and ownership structure,
Journal of Financial Economics, 49, 45-77
Van Bommel, J., 2002,"Messages from market to management: the case of IPO's", Journal of
Corporate Finance, 8, 2,123-138
Van Bommel, J. and T.Vermaelen, 2003, Post-IPO capital expenditures and market feedback,
Journal of Banking and Finance, 27, 275-305.
Welch, I., 1989, Seasoned Offerings, Imitation Costs, and the Underpricing of Initial Public
Offerings, Journal of Finance, 44, 421-449.
24
Table 1: IPO’s and the subsequent security offerings in France during the 1983-1998 period.
Year of IPO Number of IPO’s
IPO’s offering proceeds in
millions of euros
Number of primary issues of securities 4 years subsequent to IPO
Number of firms for which the first issue is a seasoned
equity offering
Number of firms for which the first issue is
a unit of share and warrants issue
Number of firms for which the first issue is a
convertible bond offering (1)
1983 13 34.62 8 7 0 1
1984 22 69.63 4 4 0 0
1985 41 197.42 17 11 1 5
1986 40 226.29 18 14 1 3
1987 71 541.55 20 11 5 4
1988 27 163.32 12 3 5 4
1989 22 177.76 5 4 0 1
1990 13 98.04 2 0 0 2
1991 8 35.13 2 1 0 1
1992 4 14.68 0 0 0 0
1993 6 47.59 3 3 0 0
1994 21 157.35 4 1 1 2
Total 288 1763.39 95 59 13 23
(1) This category includes bonds with attached warrants
25
Table 2: Descriptive statistics on 288 IPOs in the 1983-1994 period and 95 first security offerings in the 1983-1998 period.
To be included in the sample, a security offering had to have occurred within four years of the IPO and be the first of this firm. Data are means, medians are given in brackets. Characteristics Total sample Firms who issued first
shares after IPO Firms who issued first units of share and warrants after IPO
Firms who issued first convertible bonds after
IPO
Firms who did not issue within a four year period
after the IPO Number of IPOs 288 59 13 23 193 Initial return ( %) 18.67
(8.72) 31.36
(18.52) 7.50
(3.91) 15.74 (5.04)
15.90 (8.0)
The ratio of demand to supply during the IPO
56 (41)
72 (59)
42 (23)
41 (18)
54 (40)
IPO size (in million of euros)
6.23 (3.39)
3.62 (2.58)
6.76 (3.93)
9.66 (4.46)
6.58 (3.45)
Proportion of initial capital issued ( %)
11.56 (10.0)
11.82 (10)
11.77 (10)
12.71 (10.24)
11.33 (10.0)
Proportion of capital held by the familial shareholders before IPO (%)
51.37 (60.05)
52.52 (67.52)
52.72 (60.17)
41.31 (40.0)
52.15 (60.02)
Proportion of capital held by banks (%) 8.23 (0)
9.48 (0)
12.79 (6.28)
19.27 (10.56)
6.30 (0)
Proportion of capital held by institutional investors or venture capitalists (%)
16.30 (3.0)
16.67 (8.32)
18.22 (3.0)
11.94 (6.65)
16.53 (1.24)
Withdrawal of familial shareholders (en %) 4.74 (3.10)
3.42 (0.09)
4.54 (4.43)
4.69 (2.04)
5.17 (3.72)
Withdrawal of banks and venture capitalists (%) 1.96 (0)
2.64 (0)
2.02 (0)
3.70 (1.54)
1.57 (0)
Withdrawal of institutional investors (%) 2.04 (0)
1.87 (0)
2.12 (0)
4.48 (0)
2.15 (0)
PER on IPO date
12.49 11.39
13.06 (12.15)
12.34 (12.14)
12.25 (11.83)
12.36 (11.33)
IPOs' procedures (%) Direct quote Fixed price Reservation price
32.3 34.4 33.3
32.2 28.8 38.9
38.5 23.1 38.5
30.4 30.4 39.1
32.1 37.3 30.6
Seasoned security offerings proceeds, in millions euros
13.90 (7.62)
22.68 (18.30)
28.46 (15.7)
Seasoned security proceeds/IPO proceeds 4.91 (3.17)
4.79 (5.22)
4.24 (4.27)
Lag between the IPO and subsequent security offering, number of calendar days.
633 (579)
699 (746)
779 (715)
26
Table 3: Initial return and cumulative abnormal returns according to the re-entry into the capital market (%) Panel A: Initial return for total sample (288 IPOs on the French "second marché" from 1983 to 1994) Characteristics of the firms, means
IPO followed by a subsequent security offering within four years
IPO not followed by an offering within four years
Mean differences (t-Test of the differencea)
Initial return (%) 24.31
15.90
8.41 (t = 2.525)**
IPO size (in million of Euros)
5.52
6.58
-1.05 (t = -0.942)
Percentage of shares offered
12.03
11.33
0.70 (t = 0.897)
Percentage of shares held by familial shareholding
49.83
52.15
-2.31 (t = 0.458)
a. When the assumption of equal variance between the two groups is rejected, test statistics are calculated under the assumption of an unequal variance. *Significant at the 10% level **Significant at the 5% level ***Significant at the 1% level
27
Table 3: Initial return and cumulative abnormal returns according to the re-entry into the capital market (%) Panel B:.Cumulative abnormal returns for the subsample of 90 IPOs for which the abnormal returns for periods following the IPO are available. Total sample Firms who did not issue within a
four year period after the IPO Firms who issued securities within a four year period after the IPOa
Number of IPOs 90 65 25 mean median mean median mean median Initial return 10.70*** 6.18 8.39*** 4.74 16.72*** 9.09 First 10-day abnormal return 4.58*** 2.56 4.41** 1.87 5.03 3.53 One month abnormal return 3.06** 0.76 2.46* 0.74 4.60 4.04 Three month abnormal return 1.27 0.71 -0.20 0.12 5.11 3.15 Six month abnormal return 3.53 5.44 1.31 0.85 9.32 15.21 One year abnormal return -0.74 4.33 -6.08 2.34 13.14* 17.01 a. For these 25 firms, only 4 go back to the capital markets within a period of less than one year after the IPO (mean subsequent IPO period of 248 days,
median 247). For these 4 firms, the abnormal return between the IPO and the first subsequent security emission is 26.61% (median 23.23%), while the 6 month abnormal return is 17.36% (median 21.42%), and over one year 25.21% (median 23.23%)
*Significantly different from 0 at the 10% level ** Significantly different from 0 at the 5% level *** Significantly different from 0 at the 1% level
28
Table 4: Abnormal returns according to underpricing class (%) in the 1983-1994 period
Group according to the underpricing
First quartile Second quartile Third quartile Fourth quartile All
Number of IPOs 72 72 72 72 288 mean median mean median mean median mean median mean median Underpricing 0.28 0 5.35*** 4.86 15.44*** 15.97 53.62*
** 43.34 18.67*** 8.72
Number of IPO for which the data were available to calculate abnormal return
25 32 25 8 90
mean median mean median mean median mean median mean median Underpricing 0.39 0.00 5.40*** 4.81 14.51*** 14.50 52.31
*** 41.88 10.70 6.18
First 10-day abnormal return 3.82 -1.39 0.11 0.34 10.12*** 7.62 7.53 14.02 4.58 2.56 One month abnormal return -0.21 -1.86 -0.17 -0.31 9.20*** 5.63 7.00 16.27 3.06 0.76 Three month abnormal return -2.86 -4.35 -2.93 -1.73 9.01** 6.74 6.83 17.21 1.27 0.71 Six month abnormal return -3.28 -2.32 0.55 4.96 12.24** 18.75 9.52 14.42 3.53 5.44 One year abnormal return -23.8* -7.01 4.91 2.54 13.89 10.03 3.03 12.45 -0.74 4.33 *Significantly different from 0 at the 10% level ** Significantly different from 0 at the 5% level *** Significantly different from 0 at the 1% level
29
Table 5: Initial return and cumulative abnormal returns according to IPO procedures (%)
Panel A: Initial return for the total sample (288 IPOs on the French “second marché” from 1983 to 1994) % Auction like procedure
(Direct quote + Reservation price)
Fixed price
Number of observations 189
99
Mean initial return (median) 18.19 (8.41)
19.59 (10.0)
Mean initial return for IPO followed by a subsequent security offering within four years (median)
19.88 (10.03)
35.47 (19.13)
Mean initial return (%) for IPO not followed by an offering within four years (median)
17.25 (8.16)
13.63 (7.02)
Mean differences (%) (t-Test of the differencea)
2.63 (t=0.470)
21.84 (t=3.194)***
a. When the assumption of equal variance between the two groups is rejected, test statistics are calculated under the assumption of an unequal variance. *Significant at the 10% level **Significant at the 5% level ***Significant at the 1% level
30
Table 5: Initial return and cumulative abnormal returns according to IPO procedures (%)
Panel B: Cumulative abnormal returns for the subsample of 90 IPOs for which the abnormal returns for periods following the IPO are available. Auction like procedure
(Direct quote + Reservation price)
Fixed price
Number of observations 56 34 mean % IPO
followed by an offering
IPO not followed
by an offering
Mean difference
s
IPO followed by an offering
IPO not followed
by an offering
Mean difference
s
Underpricing 16.27 10.07 6.20 18.50 6.30 12.19** First 10-day abnormal return 3.38 5.83 -2.45 11.64 2.64 9.00* One month abnormal return 2.28 3.23 -0.95 13.90 1.52 12.38** Three month abnormal return 3.13 -0.16 3.29 13.00 -0.24 13.24* Six month abnormal return 7.41 1.10 6.31 16.95 1.57 15.38 One year abnormal return 10.68 -10.34 21.02 24.35 -0.36 24.71** *Significant at the 10% level **Significant at the 5% level ***Significant at the 1% level
31
Table 6: Underpricing according to the procedure and the subsequent financing (%) IPOs classified by procedure, for the total sample (288 IPOs on the French "second marché" from 1983 to 1994) Auction like procedure
(Direct quote + Reservation price) Fixed price
Number of IPOs 189 99 Underpricing (UP) below or over the total sample median underpricing
UP< med
UP>med
Mean differences (t-Test of the differencea)
UP< med
UP>med
Mean differences (t-Test of the differencea)
Proportion of IPOs firm issuing security within four years
0.33 0.39 0.06 (t=0.876)
0.15 0.38 0.24 (t=2.70)***
Proportion of IPOs firm issuing common stock within four years
0.12 0.33 0.21 (t=3.43)***
0.09 0.25 0.16 (t=2.20)**
Proportion of IPOs firm issuing convertible bonds or attached warrants within four years
0.21 0.06 -0.14 (t=-2.86)***
0.06 0.13 0.07 (t=1.16)
Mean (median) underpricing (%) 18.19 (8.41)
19.59 (10)
Mean (median) underpricing for the equity issuers
26.99 (16.70)
42.15 (19.05)
Mean (median) underpricing for the convertible bonds and warrants issuers
8.40 (3.80)
24.12 (19.22)
Mean differences between the underpricing of equity issuers vs convertible or warrants issuers (t-test)
18.60 (t=3.25)***
18.03 (t=1.063)
a. When the assumption of equal variance between the two groups is rejected, test statistics are calculated under the assumption of an unequal variance. *Significant at the 10% level **Significant at the 5% level ***Significant at the 1% level
32
Table 7: Regression results: IPO underpricing and impact of security offerings for 288 IPOs in the 1983-1994 period Cross-sectional ordinary least square regressions where the dependent variable is the IPO initial return. Estimated regression coefficients are presented with t-statistics in parentheses. Security is a dummy variable which is equal to 1 if the firm issues securities within a four years period. Equity is a binary variable equal to 1 if the first recourse to the capital markets within 4 years subsequent to the IPO is in the form of a seasoned equity issue. Potential equity is a dummy variable equal to 1 if the first securities offering consists of convertibles bonds or includes warrants. Proceeds is the IPO size in millions of Euros.. DQ is a dummy variable equal to one for direct quote procedure. Percent is the percentage of the share offered through IPO. Activity is a dummy variable, which is equal to 1 if the IPO period is characterized by strong stock introduction activity. We characterize a period as being one of strong activity if six months prior to the IPO, the volume of listed IPO stocks belonged to the highest quartile. FAM is a variable indicating the fraction of capital held by a family type shareholding structure before the IPO (%). Period is a dummy variable that is equal to 1 if the IPO takes place in the first period (1983-1987) and zero otherwise. Panel A: Total sample Regression 1 Regression 2 Regression 3 Regression 4 Regression 5 Regression 6 Regression 7 Regression 8Security 7.44
(t=2.334)** 8.10
(t=2.566)** 5.23
(t=1.84)* 7.61
(t=2.27)**
Equity 12.40 (t=3.25)***
11.99 (t=3.17)***
7.94 (t=2.32)**
12.95 (t=3.20)***
Potential equity
-1.76 (t=-0.39)
0.54 (t=0.12)
0.03 (t=0.01)
-2.45 (t=-0.51)
Ln (proceeds)
-4.63 (t=-2.96)***
-3.77 (t=-2.38)**
DQ -7.74 (t=-2.24)**
-7.40 (t=-2.16)**
Percent -0.51 (t=-1.81)*
-0.49 (t=-1.73)*
-0.52 (t=-2.08)**
PER 1.01 (t=3.19)***
1.01 (t=3.19)***
FAM 0.135 (t=3.57)***
0.11 (t=2.91)***
0.099 (t=2.82)***
0.13 (t=3.52)***
0.11 (t=2.93)***
0.099 (t=2.84)***
Period 13.89 (t=4.38)***
17.44 (t=5.30)***
15.27 (t=5.11)***
12.92 (t=4.08)***
16.36 (t=4.93)***
14.88 (t=4.92)***
Activity -10.51 (t=-3.28)***
-9.59 (t=-3.33)***
-9.48 (t=-2.94)***
-8.96 (t=-3.06)***
Constant 0.342 (t=0.11)
11.21 (t=2.36)**
-5.18 (t=-1.07)
1.35 (t=0.43)
11.27 (t=2.39)**
1.01 (t=0.18)
24.70 (t=7.68)***
23.75 (t=7.38)***
F 14.63*** 11.86*** 12.59*** 12.68*** 10.59*** 9.98*** 6.02*** 6.12 Adjusted R² 0.126 0.162 0.179 0.142 0.170 0.194 0.051 0.068 *Significant at the 10% level **Significant at the 5% level ***Significant at the 1% level
33
Table 7: Regression results: IPO underpricing and impact of security offerings for 288 IPOs in the 1983-1994 period
Panel B: Sub-samples, by procedures
Auction like procedure (Direct quote + Reservation
price)
Fixed price procedure
Number of IPOs
189 99
Regression 1 Regression 2 Regression 3 Regression 4 Regression 5 Security 2.63
(t=0.75) 19.15
(t=2.93)*** 18.84
(2.85)***
Equity 7.09 (t=1.70)*
24.13 (t=3.09)***
Potential equity
-6.79 (t=-1.37)
10.91 (t=1.13)
FAM 0.10 (t=2.21)**
0.10 (t=2.22)**
0.21 (t=3.03)***
0.21 (3.07)***
0.20 (t=2.91)***
Period 13.9 (t=3.87)***
12.53 (t=3.87)***
12.59 (t=2.08)**
12.72 (2.08)**
12.19 (t=2.01)**
Percent -0.619 (-0.968)
Constant 2.63 (t=0.68)
3.96 (t=1.03)
-2.33 (t=-0.43)
4.44 (t=0.503)
-1.79 (t=-0.33)
F 7.83*** 7.36*** 8.82*** 6.775*** 6.98*** Adjusted R² 0.10 0.121 0.193 0.192 0.196 *Significant at the 10% level **Significant at the 5% level ***Significant at the 1% level

34
Table 8: Logit regression estimates of the relation between the probability of a subsequent security offering and the stock returns.
The following logit model is estimated: P(Y)i = ))'(exp(1
1βα iX+−+
The dependent variable is either the variable Security or Equity. Security is a dummy variable which is equal to 1 if the firm issues securities within a four years period. Equity is a binary variable equal to 1 if the first recourse to the capital markets within 4 years subsequent to the IPO is in the form of a seasoned equity issue. The independent variables are the initial return, abnormal returns for post-IPO periods, the logarithm of IPO size, the rate of withdrawal of familial shareholders during the IPO (equal to the difference between familial shareholding before the IPO and after the IPO), and the period, a dummy variable which is equal to 1 if the IPO takes place in the 1983-1987 period. The beta coefficients are given and the Wald statistics are reported in parentheses. Panel A: Total sample and initial return only (288 IPOs) Variables Model 1 Model 2 Model 3 Model 4 Model 5 Model 6 Model 7 Model 8 Total sample Total sample Total sample Total sample Fixed price Fixed price Auction like Auction like Number of IPOs 288 288 288 288 99 99 189 189 Dependant variable
Security Equity Security Equity Security Equity Security Equity
Underpricing 0.0094 (3.0018)*
0.0135 (4.66)**
0.0118 (5.34)**
0.0183 (10.29)***
0.0242 (5.4411)**
0.0198 (3.446)*
0.0036 (0.593)
0.0146 (4.09)**
Ln(proceeds) -0.1635 (1.5479)
-0.51 (9.26)***
-0.1737 (0.6115)
-0.572 (4.08)**
Withdrawal -0.053 (3.77)*
-0.0849 (5.596)**
-0.0445 (2.932)*
-0.0596 (3.30)*
-0.0609 (3.56)*
-0.094 (5.11)**
Period 0.3151 (1.12)
0.6768 (2.96)*
Auction like 0.5084 (3.20)*
0.4068 (1.43)
Constant -0.6447 (3.94)**
-1.21 (8.86)***
-1.04 (15.20)***
-1.76 (30.18)***
-1.226 (7.30)***
-1.35 (7.36)***
-0.311 (1.57)
-1.146 (16.43)***
Chi-square 12.29** 30.03*** 11.63*** 16.15*** 9.75*** 12.63*** 4.07 9.71*** Cox et Snell R² 0.046 0.109 0.043 0.059 0.096 0.122 0.024 0.056 *Significant at the 10% level **Significant at the 5% level ***Significant at the 1% level
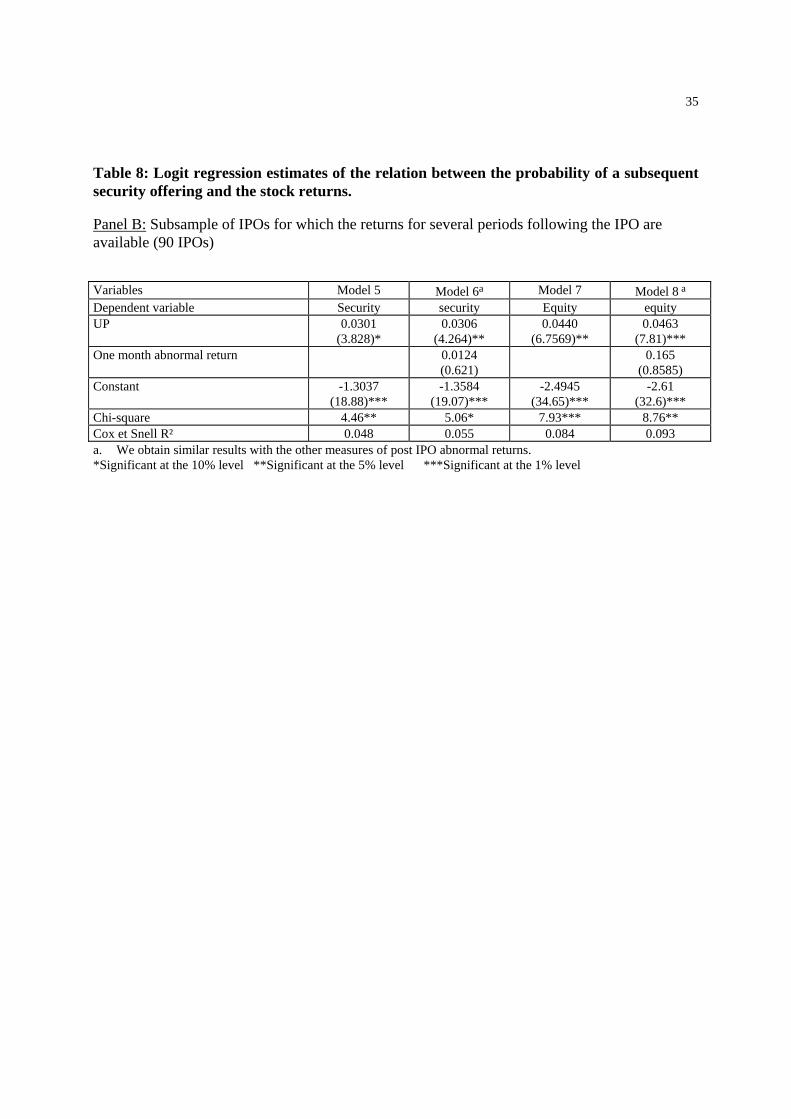
35
Table 8: Logit regression estimates of the relation between the probability of a subsequent security offering and the stock returns. Panel B: Subsample of IPOs for which the returns for several periods following the IPO are available (90 IPOs) Variables Model 5 Model 6a Model 7 Model 8 a Dependent variable Security security Equity equity UP 0.0301
(3.828)* 0.0306
(4.264)** 0.0440
(6.7569)** 0.0463
(7.81)*** One month abnormal return 0.0124
(0.621) 0.165
(0.8585) Constant -1.3037
(18.88)*** -1.3584
(19.07)*** -2.4945
(34.65)*** -2.61
(32.6)*** Chi-square 4.46** 5.06* 7.93*** 8.76** Cox et Snell R² 0.048 0.055 0.084 0.093 a. We obtain similar results with the other measures of post IPO abnormal returns. *Significant at the 10% level **Significant at the 5% level ***Significant at the 1% level