frankfurt am main 28 november 2006 - nordex · projects to review customer layout supporting...
TRANSCRIPT
Nordex AGEigenkapitalforum
Frankfurt am Main28 November 2006

Page 2
Content
Market Development 2
Business Performance in 20063
4 Outlook
5 Appendix
Company Profile 1
Page 3
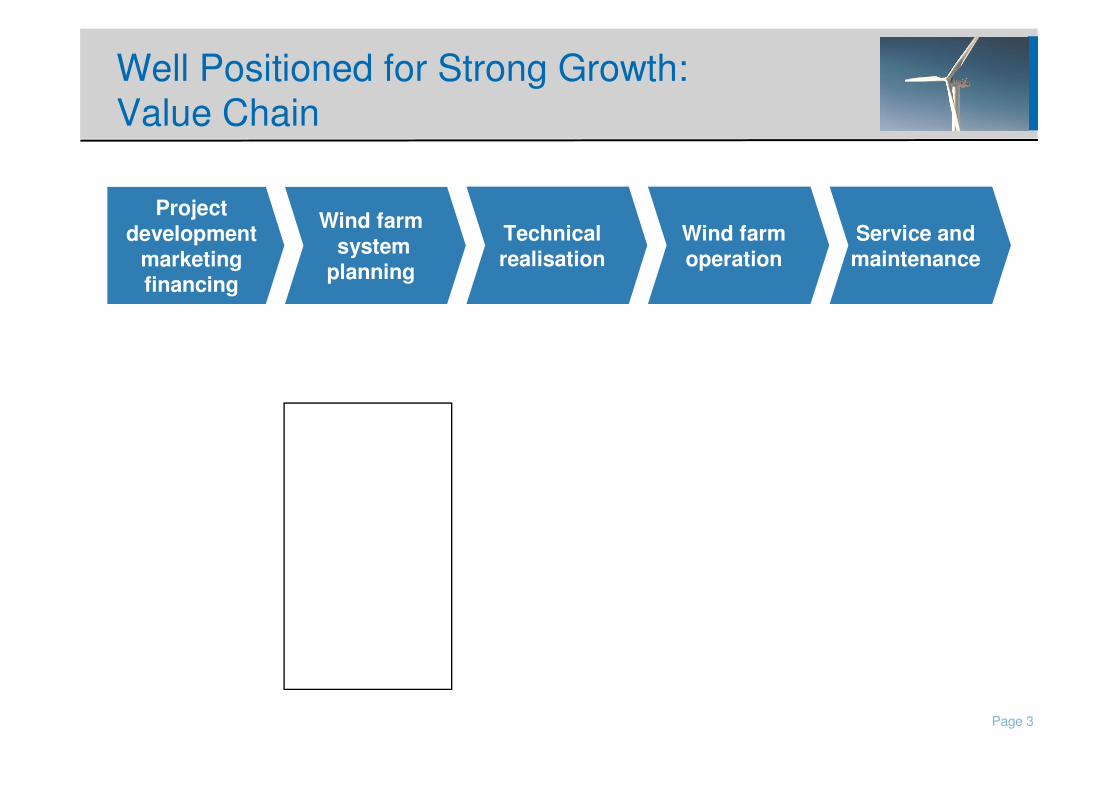
Well Positioned for Strong Growth: Value Chain
Wind farmsystem
planning
Technical realisation
Wind farm operation
Service and maintenance
Project development
marketing financing
� Micrositing of 100% of signed projects to review customer layout
� Supporting customers (co-development) to receive necessary approvals and to optimize the park layout
� Core business: WTG assembly, production of selected components, installation on site, initial operation
� 2200 turbines are currently under Nordex service
� Full service contract offering up to 9+3 years duration
� Market leader in France (high margin potential)
� Development of first commercially financed project in China
� Additional service offering: increasing demand due to new wind farm investors, which are only interested in stable cash flow
Page 4
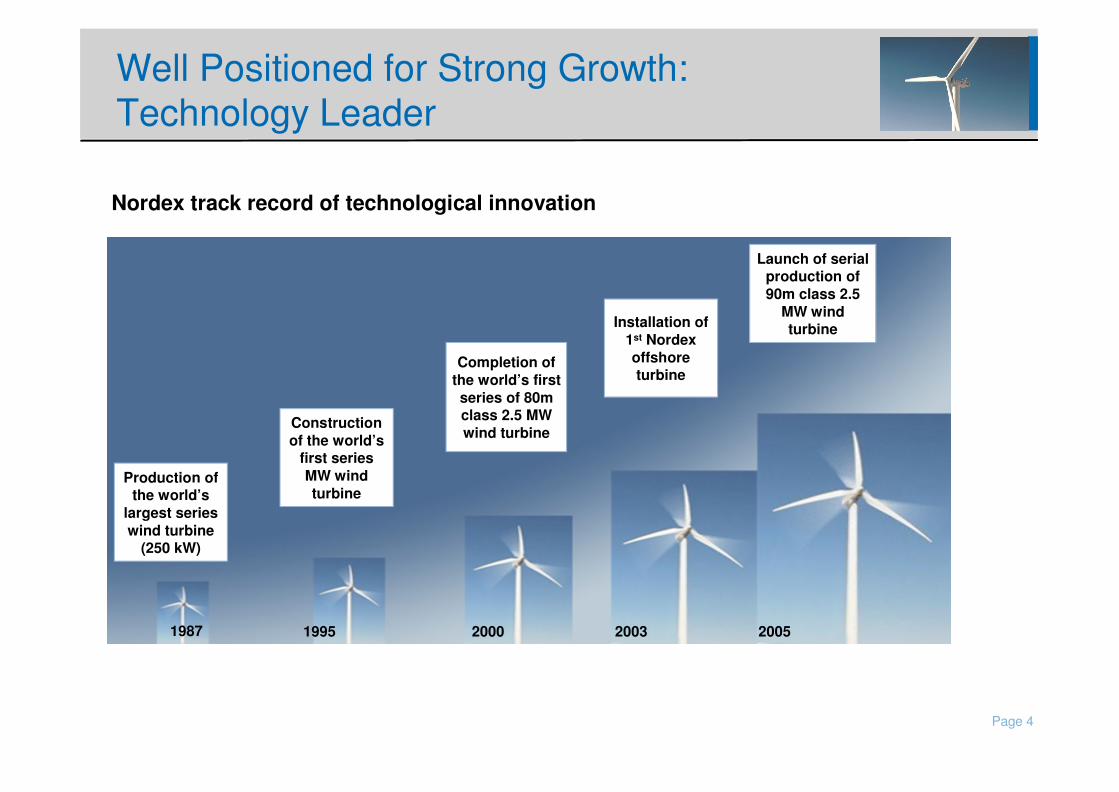
Well Positioned for Strong Growth: Technology Leader
Nordex track record of technological innovation
Production of the world’s
largest series wind turbine
(250 kW)
Construction of the world’s
first series MW wind turbine
Completion of the world’s first series of 80m class 2.5 MW wind turbine
Installation of 1st Nordex offshore turbine
Launch of serial production of 90m class 2.5
MW wind turbine
1987 1995 2000 2003 2005
Page 5
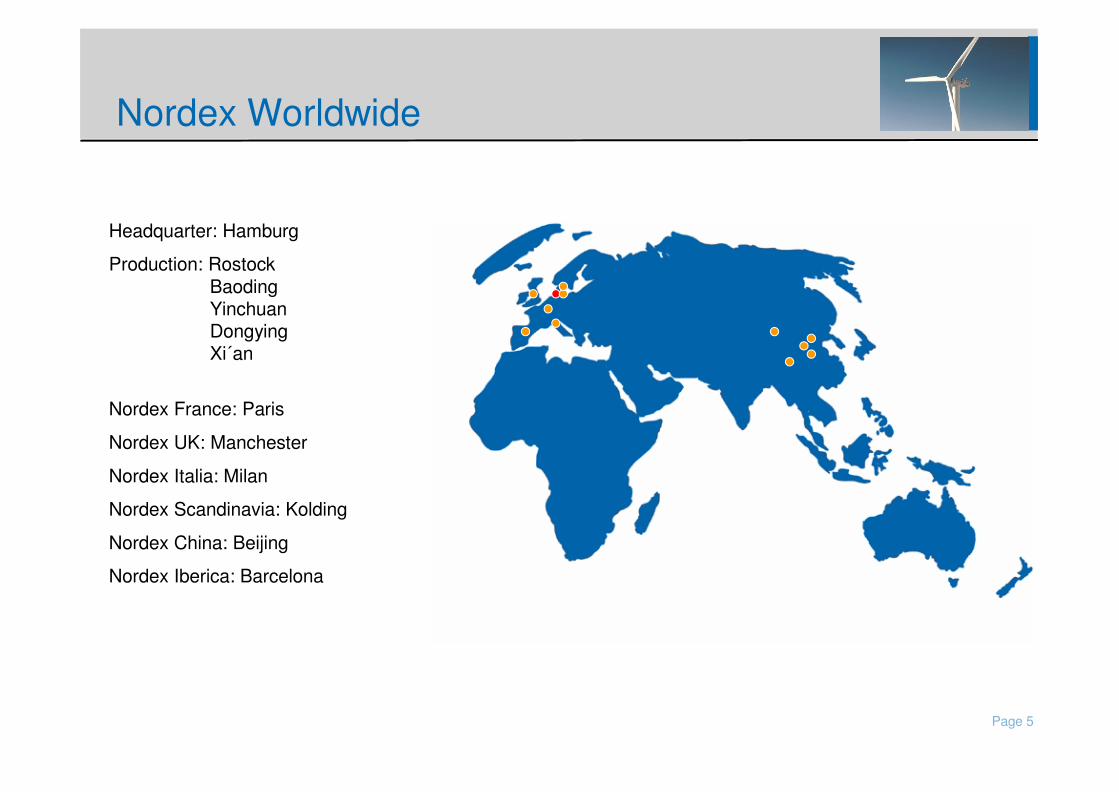
Nordex Worldwide
Headquarter: Hamburg
Production: RostockBaodingYinchuanDongyingXi´an
Nordex France: Paris
Nordex UK: Manchester
Nordex Italia: Milan
Nordex Scandinavia: Kolding
Nordex China: Beijing
Nordex Iberica: Barcelona

Page 6
Content
Market Development 2
Business Performance in 20063
4 Outlook
5 Appendix
Company Profile 1
Page 7
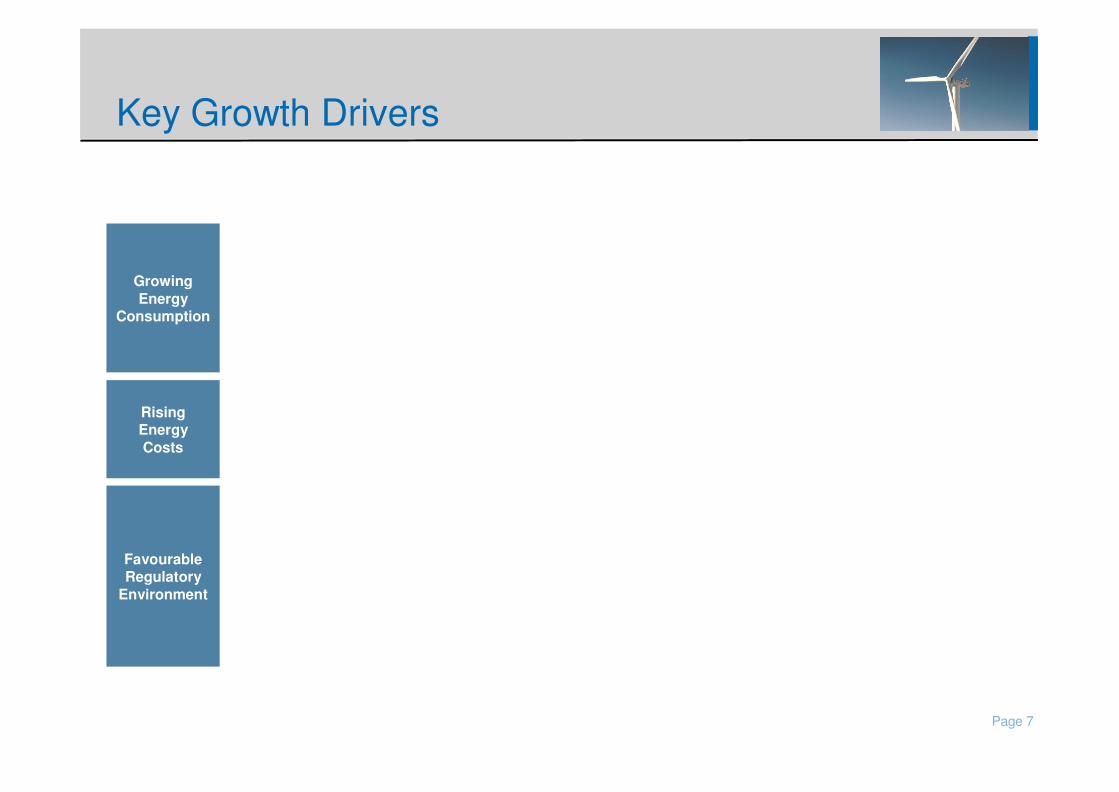
Key Growth Drivers
Growing Energy
Consumption
Rising Energy Costs
Favourable Regulatory
Environment
� Economic growth in 2006 expected to support oil demand further (+2.2% vs. 2005 in volume terms)
� IEA estimates worldwide energy demand may double from 2002 to 2030, especially in Asia
� Oil price more than tripled since 2001, reaching all-time high in summer 2006 with in excess of US$74/barrel
� Market forward curve for oil swaps implies prices at a level of US$70-75 for next three years
� Kyoto protocol supports renewable energy to help countries achieve their targets
� Regulatory outlook worldwide positive:
� PTC in US extended until end of 2007; widely expected to be extended again
� Supportive new renewable energy law in China, France (update), Ireland, Greece.
� European Parliament reiterates position on renewable energy targets (20% by 2020)
Source: Goldman Sachs Commodity Research, Bundesverband Wind Energie, Merrill Lynch Commodities Research
Demand for wind energy driven by renewables regulations, price competitiveness of wind energy and strong worldwide energy demand
Generation Cost in € /MWh
0 50 100 150 200 250
Advanced Nuclear
Conv. Hydro
Geothermal
IGCC - Coal
Wind
Advanced Gas/Oil CC
Biomass
Conv. Gas/Oil CC
Solar Thermal
Photovoltaic
€ /MWh
Page 8
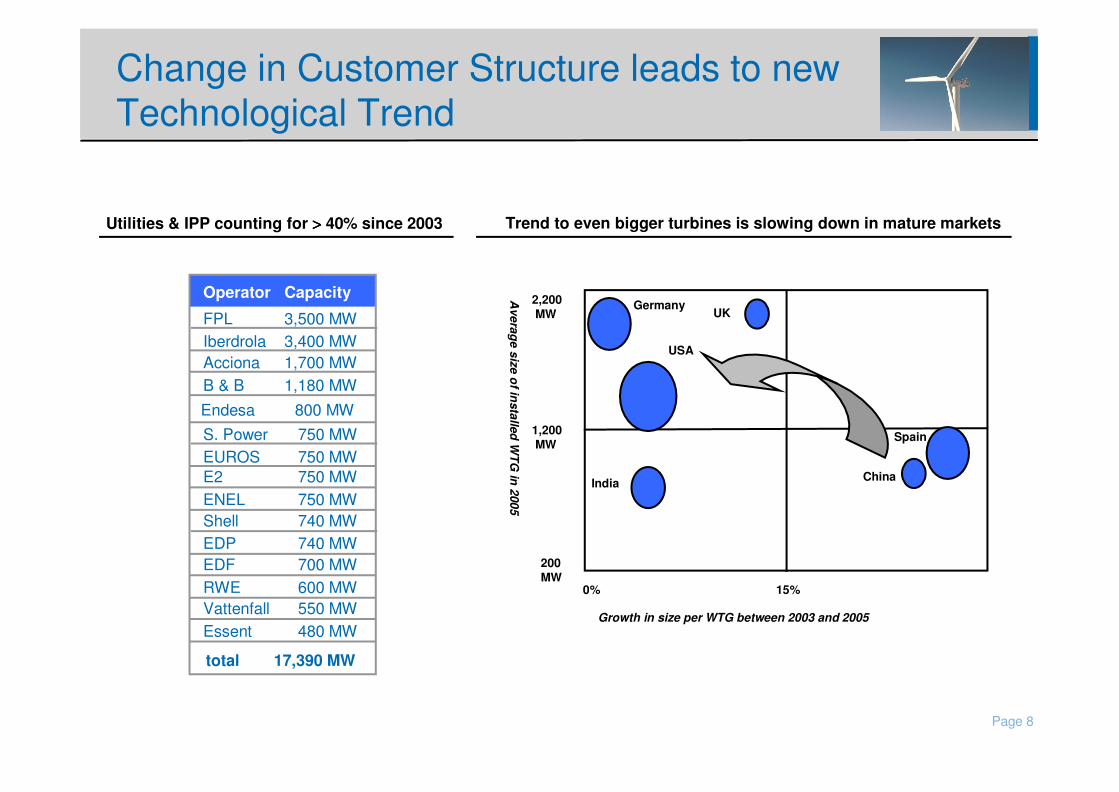
Change in Customer Structure leads to new Technological Trend
Operator Capacity
FPL 3,500 MWIberdrola 3,400 MWAcciona 1,700 MWB & B 1,180 MW
S. Power 750 MWEUROS 750 MWE2 750 MWENEL 750 MWShell 740 MWEDP 740 MWEDF 700 MWRWE 600 MWVattenfall 550 MWEssent 480 MW
total 17,390 MW
Endesa 800 MW
200 MW
1,200MW
2,200MW
15%
Germany
China
Spain
India
UK
USA
Average size of installed W
TG in 2005
Growth in size per WTG between 2003 and 2005
0%
Trend to even bigger turbines is slowing down in mature marketsUtilities & IPP counting for >>>> 40% since 2003
Page 9
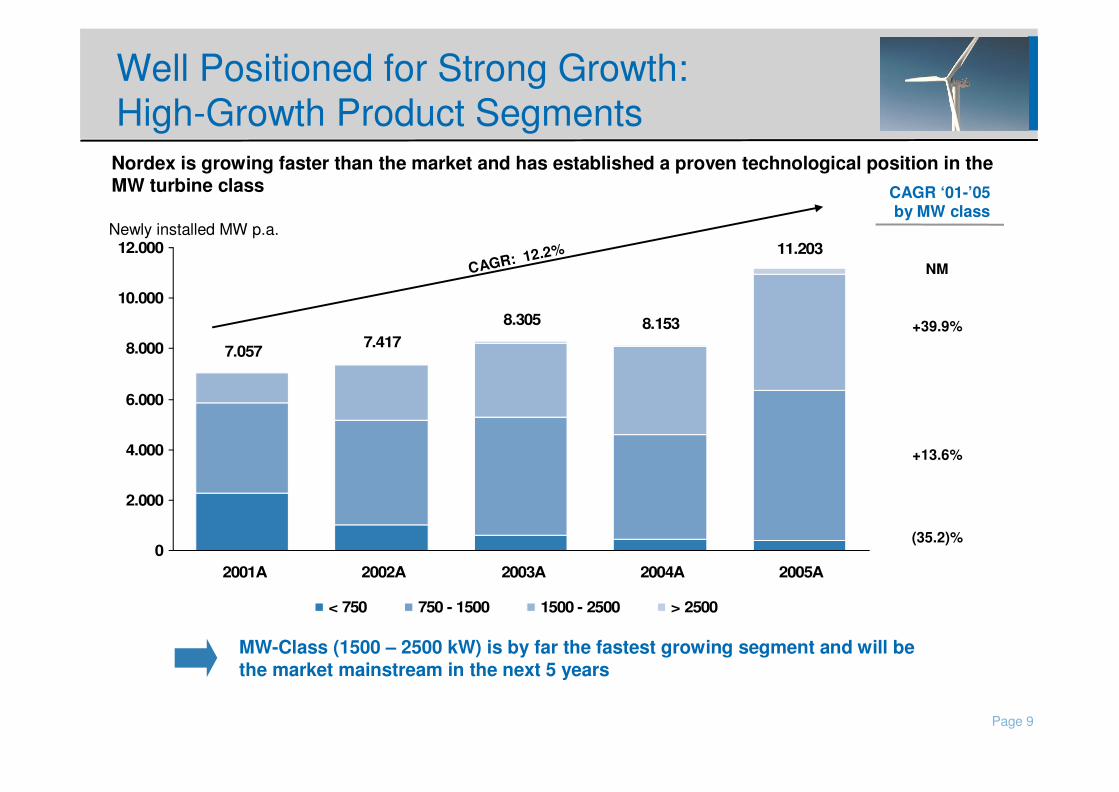
Well Positioned for Strong Growth: High-Growth Product Segments
MW-Class (1500 – 2500 kW) is by far the fastest growing segment and will be the market mainstream in the next 5 years
Newly installed MW p.a.11.203
8.1538.3057.4177.057
0
2.000
4.000
6.000
8.000
10.000
12.000
2001A 2002A 2003A 2004A 2005A
< 750 750 - 1500 1500 - 2500 > 2500
CAGR: 12.2%
CAGR ‘01-’05by MW class
NM
+39.9%
+13.6%
(35.2)%
Nordex is growing faster than the market and has established a proven technological position in the MW turbine class

Page 10
Content
Market Development 2
Business Performance in 20063
4 Outlook
5 Appendix
Company Profile 1
Page 11
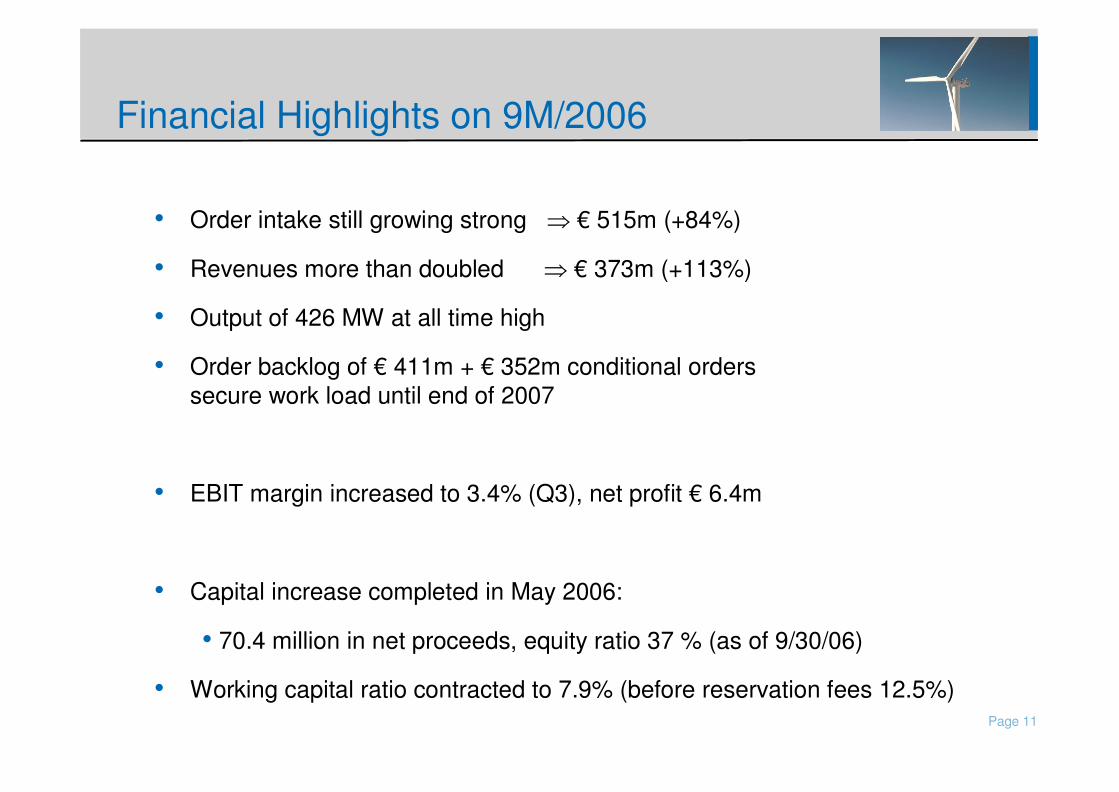
Financial Highlights on 9M/2006
• Order intake still growing strong ⇒ € 515m (+84%)
• Revenues more than doubled ⇒ € 373m (+113%)
• Output of 426 MW at all time high
• Order backlog of € 411m + € 352m conditional orders secure work load until end of 2007
• EBIT margin increased to 3.4% (Q3), net profit € 6.4m
• Capital increase completed in May 2006:
• 70.4 million in net proceeds, equity ratio 37 % (as of 9/30/06)
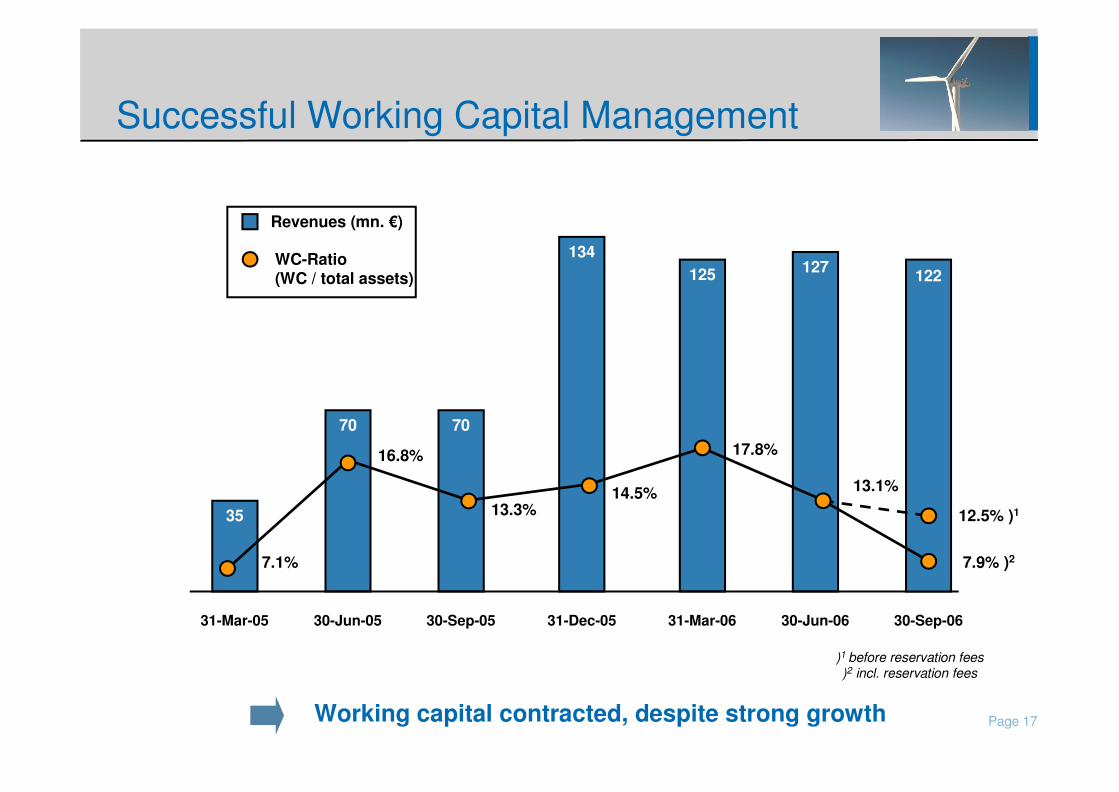
• Working capital ratio contracted to 7.9% (before reservation fees 12.5%)
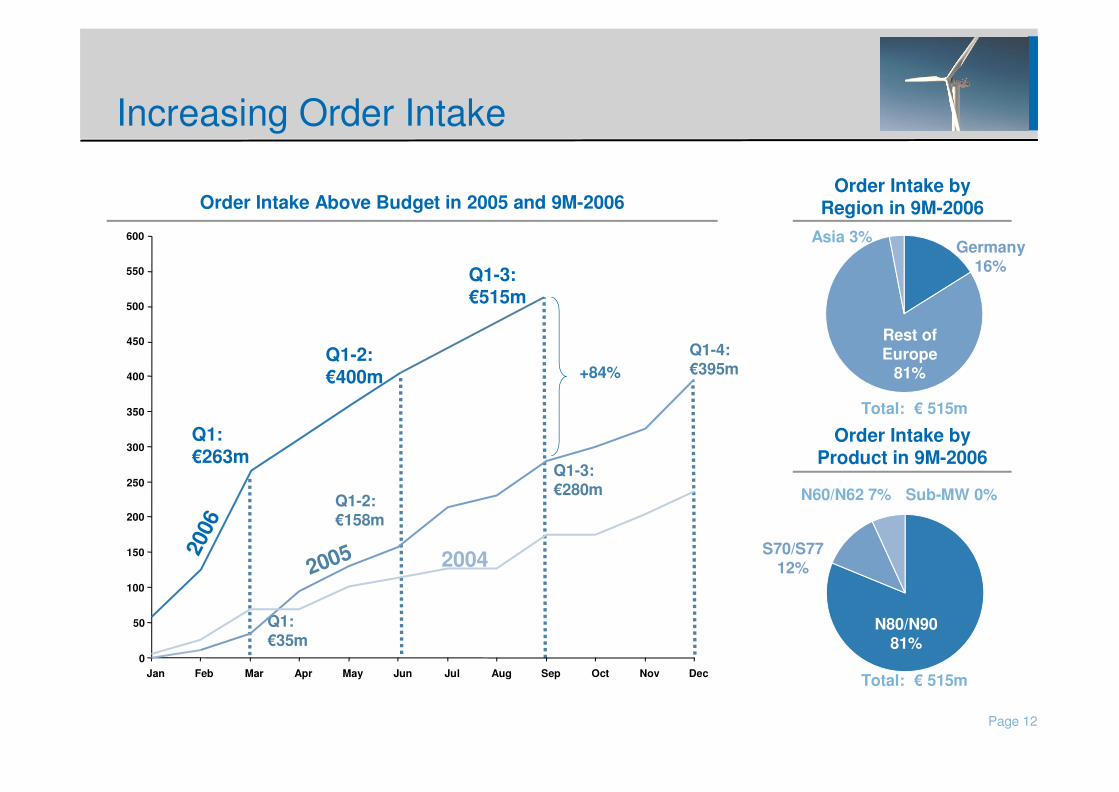
Page 12
Increasing Order Intake
Order Intake Above Budget in 2005 and 9M-2006
Germany 16%
Order Intake by Region in 9M-2006
Rest of Europe
81%
Asia 3%
Total: € 515m
Order Intake by Product in 9M-2006
Total: € 515m
N80/N90 81%
N60/N62 7% Sub-MW 0%
S70/S77 12%
Q1: € 35m
Q1-2: € 158m
Q1-3: € 280m
Q1-4: € 395m
Q1: € 263m
20052006
+84%
2004
Q1-2: € 400m
0
50
100
150
200
250
300
350
400
450
Jan Feb Mar Apr May Jun Jul Aug Sep Oct Nov Dec
500
550
600
Q1-3: € 515m
Page 13
Income Statement (IFRS) 9M-2006
01-Jan-2006-30-Sep-2006€ m
Sales
Total Revenues
Cost of materials% of total revenues
Personnel costs% of total revenues
Depreciation/amortisation% of total revenues
Other operating income/expenses% of total revenues
EBIT
Financial result
Tax
Net income/loss
373.4
387.2
(316.9)81.8%
(29.4)7.6%
(9.1)2.3%
(19.6)5.1%
12.1
(1.7)
(4.0)
6.4
01-Jan-2005-30-Sep-2005
175.2
187.6
(147.0)78.4%
(25.7)13.7%
(8.8)4.7%
(18.5)9.9%
(12.3)
(2.4)
(0.1)
(14.6)
€ 3 million (temps) can be classified as
personnel costs
Page 14
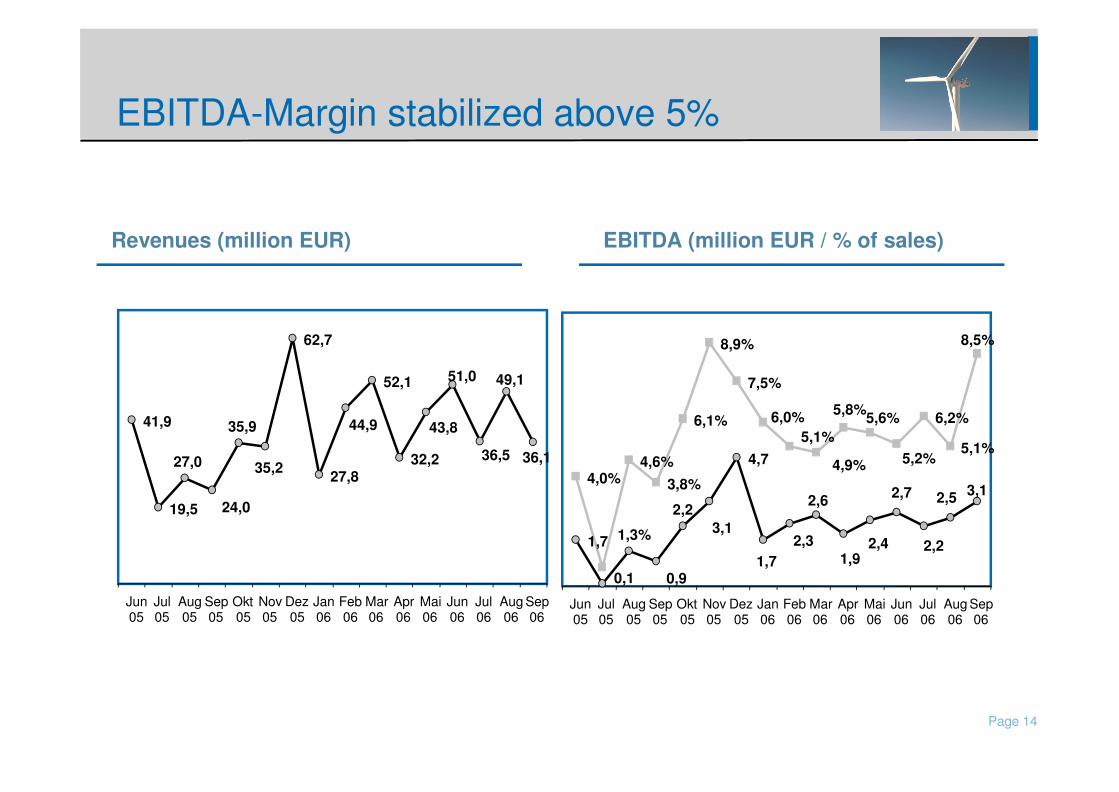
EBITDA-Margin stabilized above 5%
Revenues (million EUR) EBITDA (million EUR / % of sales)
0,1
4,7
1,71,91,7
2,63,12,5
2,2
2,7
2,42,33,1
2,2
0,9
1,3%
4,0%4,6%
3,8%
6,1%
8,9%
7,5%
6,0% 6,2%
5,1%5,1%
4,9% 5,2%
5,6%5,8%
8,5%
Jun05
Jul05
Aug05
Sep05
Okt05
Nov05
Dez05
Jan06
Feb06
Mar06
Apr06
Mai06
Jun06
Jul06
Aug06
Sep06
41,9
19,5
62,7
27,8
52,1
32,2 36,1
49,1
36,5
51,0
43,844,9
35,2
35,9
24,0
27,0
Jun05
Jul05
Aug05
Sep05
Okt05
Nov05
Dez05
Jan06
Feb06
Mar06
Apr06
Mai06
Jun06
Jul06
Aug06
Sep06
Page 15
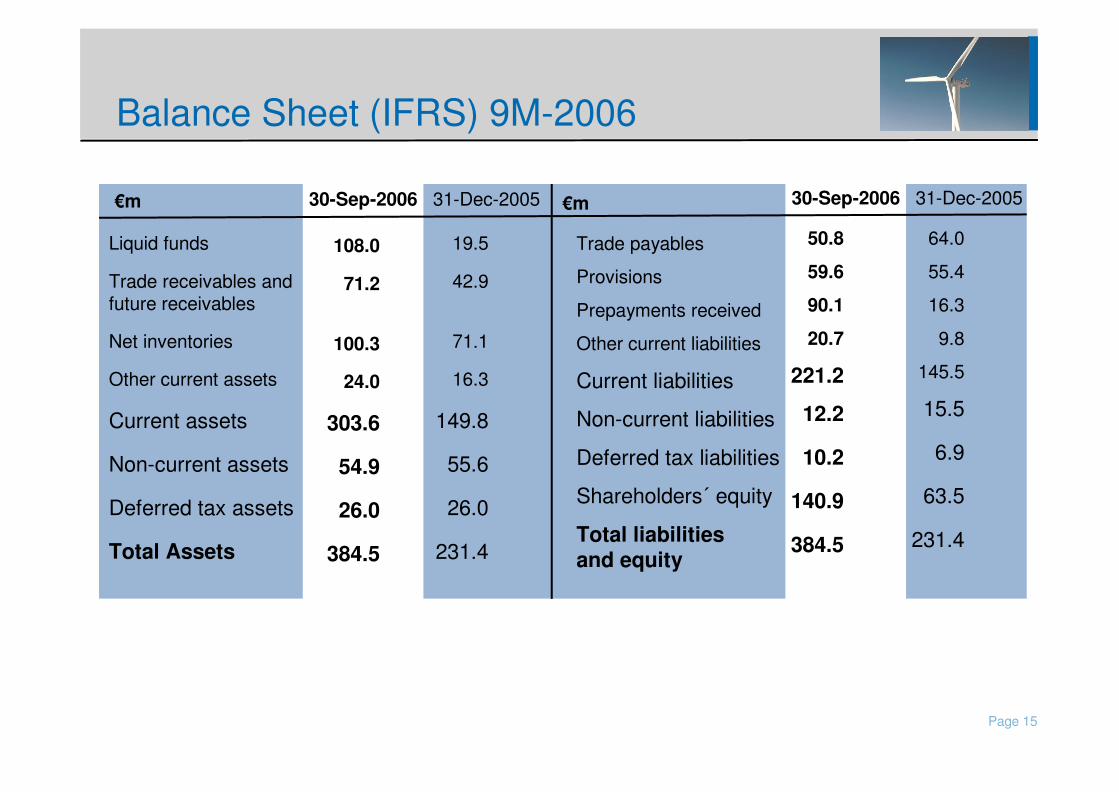
Balance Sheet (IFRS) 9M-2006
€ m 30-Sep-2006 31-Dec-2005
Liquid funds
Trade receivables and future receivables
Net inventories
Other current assets
Current assets
Non-current assets
Deferred tax assets
Total Assets
Trade payables
Provisions
Prepayments received
Other current liabilities
Current liabilities
Non-current liabilities
Deferred tax liabilities
Shareholders´ equity
Total liabilities and equity
19.5
42.9
71.1
16.3
149.8
55.6
26.0
231.4
108.0
71.2
100.3
24.0
303.6
54.9
26.0
384.5
30-Sep-2006 31-Dec-2005
50.8
59.6
90.1
20.7
221.2
12.2
10.2
140.9
384.5
64.0
55.4
16.3
9.8
145.5
15.5
6.9
63.5
231.4
€ m
Page 16
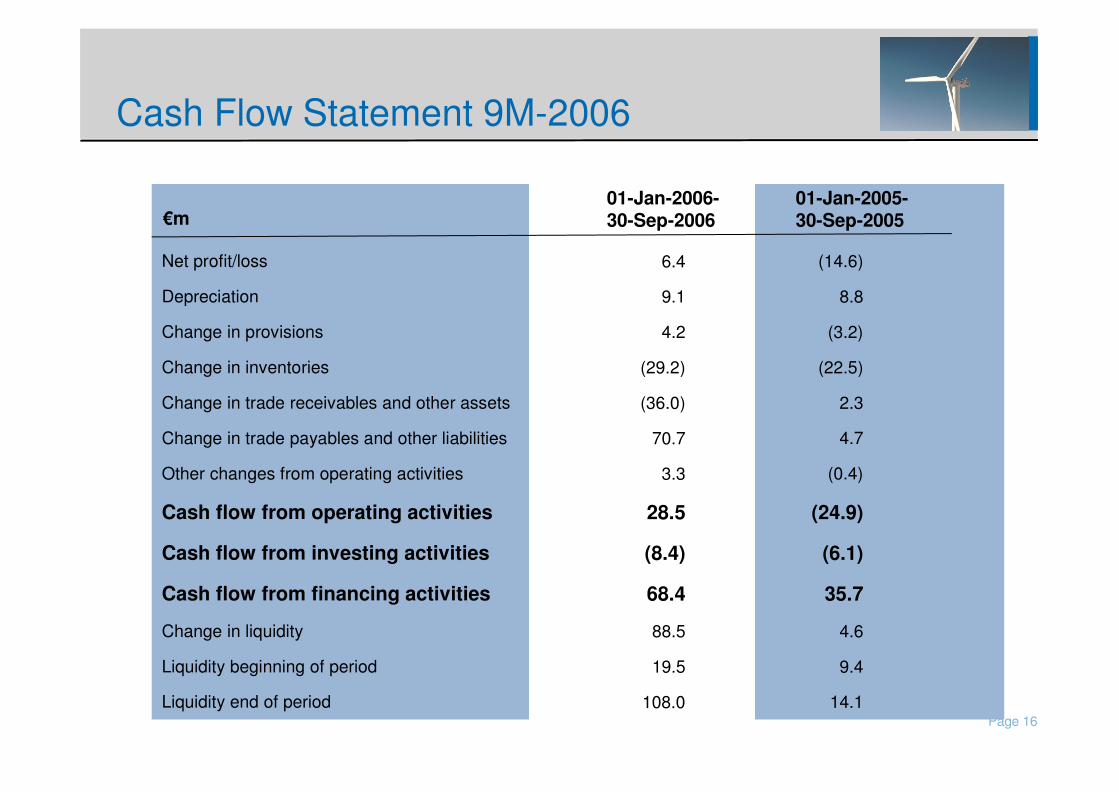
Cash Flow Statement 9M-2006
01-Jan-2006-30-Sep-2006
Net profit/loss
Depreciation
Change in provisions
Change in inventories
Change in trade receivables and other assets
Change in trade payables and other liabilities
Other changes from operating activities
Cash flow from operating activities
Cash flow from investing activities
Cash flow from financing activities
Change in liquidity
Liquidity beginning of period
Liquidity end of period
01-Jan-2005-30-Sep-2005
(14.6)
8.8
(3.2)
(22.5)
2.3
4.7
(0.4)
(24.9)
(6.1)
35.7
4.6
9.4
14.1
6.4
9.1
4.2
(29.2)
(36.0)
70.7
3.3
28.5
(8.4)
68.4
88.5
19.5
108.0
€ m
Page 17
Successful Working Capital Management
31-Mar-05 30-Jun-05 30-Sep-05 31-Dec-05 31-Mar-06 30-Jun-06
35
70 70
134125 127
7.1%
16.8%
13.3%14.5%
17.8%
13.1%
Working capital contracted, despite strong growth
WC-Ratio(WC / total assets)
Revenues (mn. € )
122
12.5% )1
7.9% )2
)1 before reservation fees )2 incl. reservation fees
30-Sep-06
Page 18
Content
Market Development 2
Business Performance in 20063
4 Outlook
5 Appendix
Company Profile 1
Page 19
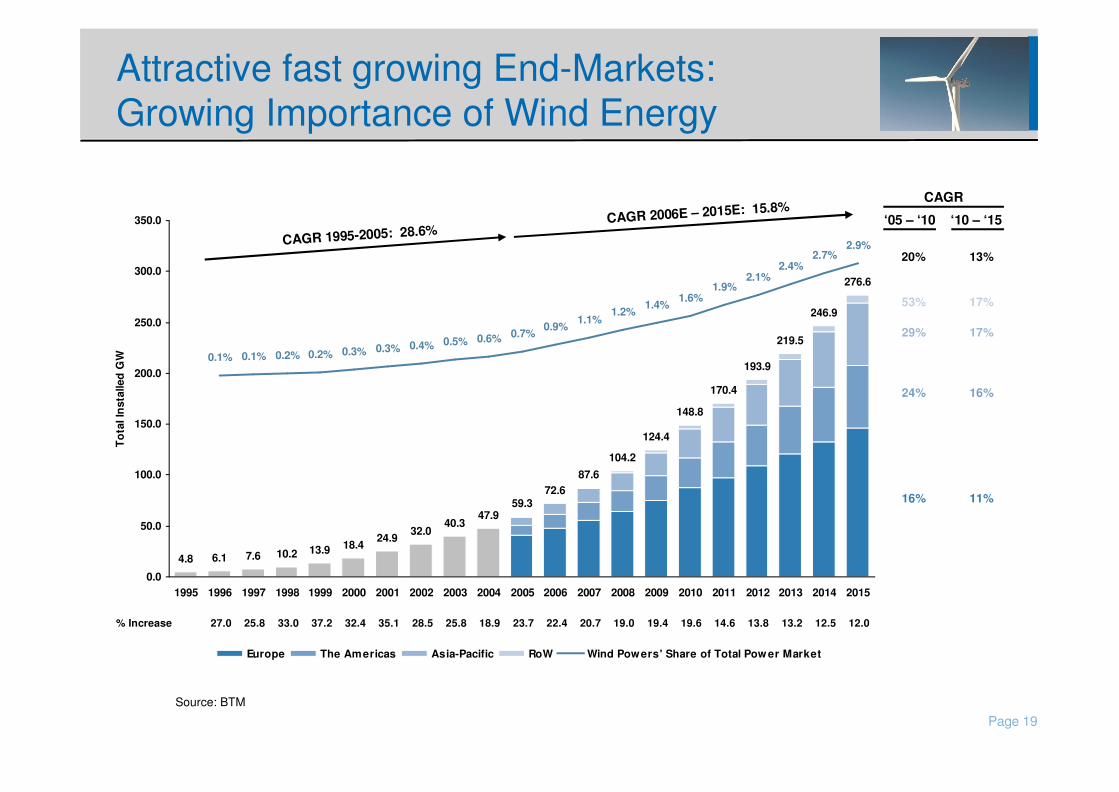
Attractive fast growing End-Markets: Growing Importance of Wind Energy
4.8 6.1 7.6 10.2 13.9 18.424.9
32.040.3
47.959.3
72.687.6
104.2
124.4
148.8
170.4
193.9
219.5
246.9
276.6
0.1% 0.1% 0.2% 0.2% 0.3% 0.3% 0.4% 0.5% 0.6% 0.7%0.9%
1.1%1.2%
1.4%1.6%
1.9%2.1%
2.4%2.7%
2.9%
0.0
50.0
100.0
150.0
200.0
250.0
300.0
350.0
1995 1996 1997 1998 1999 2000 2001 2002 2003 2004 2005 2006 2007 2008 2009 2010 2011 2012 2013 2014 2015
To
tal I
nst
alle
d G
W
Europe The Americas Asia-Pacific RoW Wind Powers' Share of Total Pow er Market
CAGR 1995-2005: 28.6%CAGR 2006E – 2015E: 15.8%
12.012.513.213.814.619.619.419.020.722.423.718.925.828.535.132.437.233.025.827.0% Increase
CAGR
‘05 – ‘10 ‘10 – ‘15
53% 17%
29% 17%
24% 16%
16% 11%
13%20%
Source: BTM
Page 20
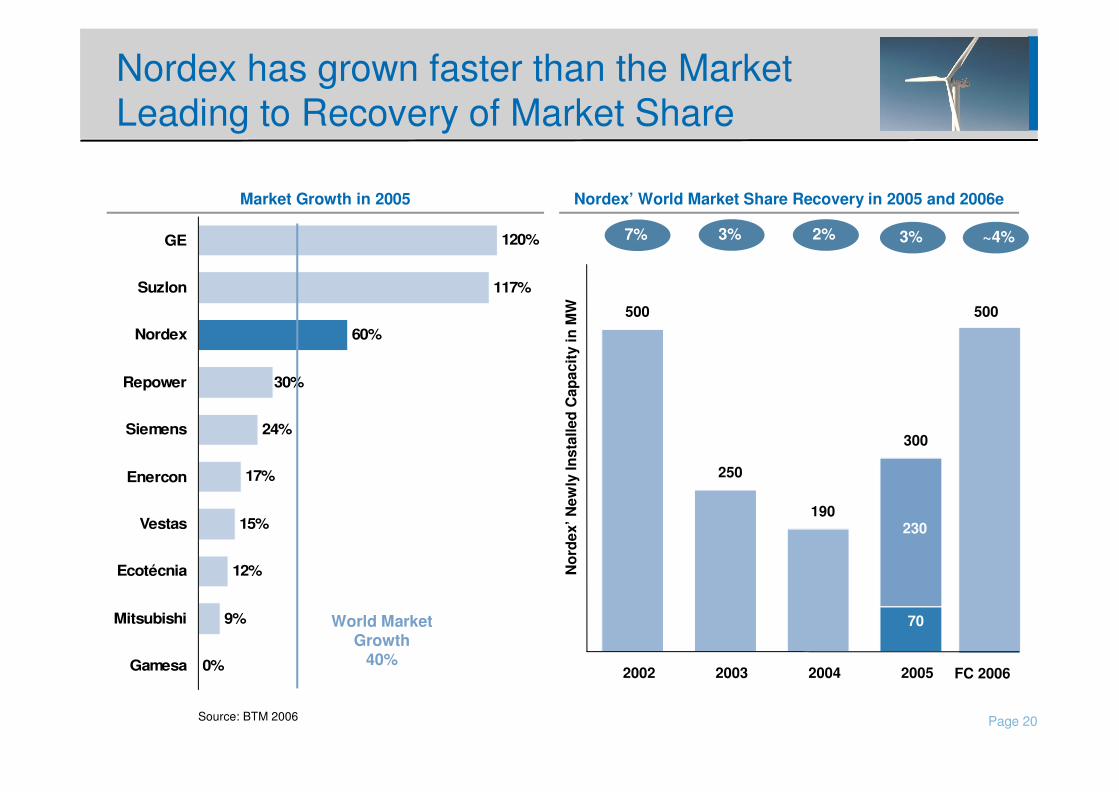
Nordex has grown faster than the Market Leading to Recovery of Market Share
0%
9%
12%
15%
17%
24%
60%
117%
120%
30%
Gamesa
Mitsubishi
Ecotécnia
Vestas
Enercon
Siemens
Repower
Nordex
Suzlon
GE
Market Growth in 2005 Nordex’ World Market Share Recovery in 2005 and 2006e
7% 3% 2% 3%
2H
1HWorld Market
Growth40%
Source: BTM 2006
Nor
dex’
New
ly In
stal
led
Cap
acity
in M
W
70
230
500
250
190
300
2002 2003 2004 2005
500
FC 2006
~4%
Page 21
Market Initiatives for International Expansion
China: � Set-up of local production
� Local partners to secure order intake
� Increase of market share
� Intensify projects developed,
� Increase market share
� Increase market share
� Market entry
� Market re-entry
Country Activity
USA:
France:
UK:
Italy:
Implementation
� 2nd blade production: Start 1/2007
� JV assembly: Start 11/2006
� Supply chain: 70% localised
� Rise in installation 2006e to ~300 MW
� New orders € 226m in 2006
� € 110m order intake from UK in 2006
� Expected market share in 2006 >10%
� € 73m order intake from Italy in 2006
� 1st turbine in 2007 (test site)
� 1st contract in 2007 expected
Page 22
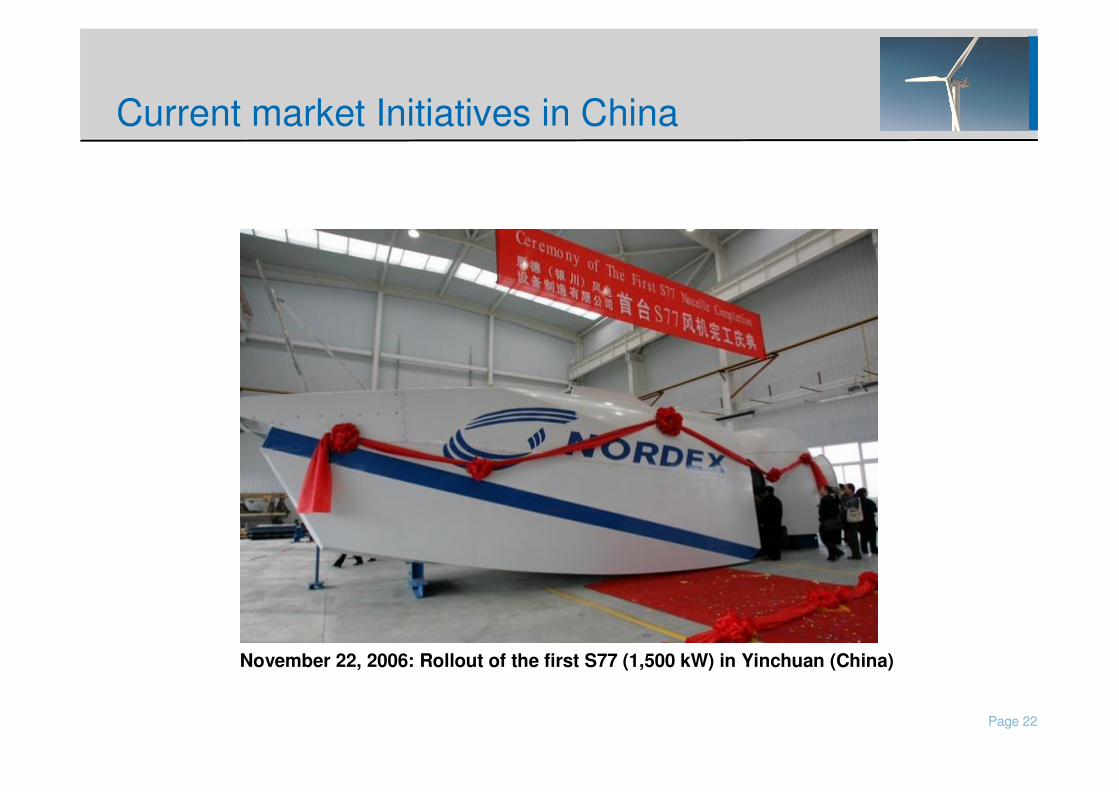
Current market Initiatives in China
November 22, 2006: Rollout of the first S77 (1,500 kW) in Yinchuan (China)
Page 23
Outlook 2006
� Projected revenues secured by order backlog:
� 100% of 2006 revenues secured by unconditional orders
� Unconditional and conditional orders secure workload until end of 2007
� Mid-term annual growth target of 50%
9M-2006 2006e
Order Intake € 515m ≥€ 700m
(Y-on-Y) +84% +77%
Revenues € 373m ≥€ 500m
(Y-on-Y) +113% 62%
EBIT Margin 3.1% ≥3.0%
Page 24
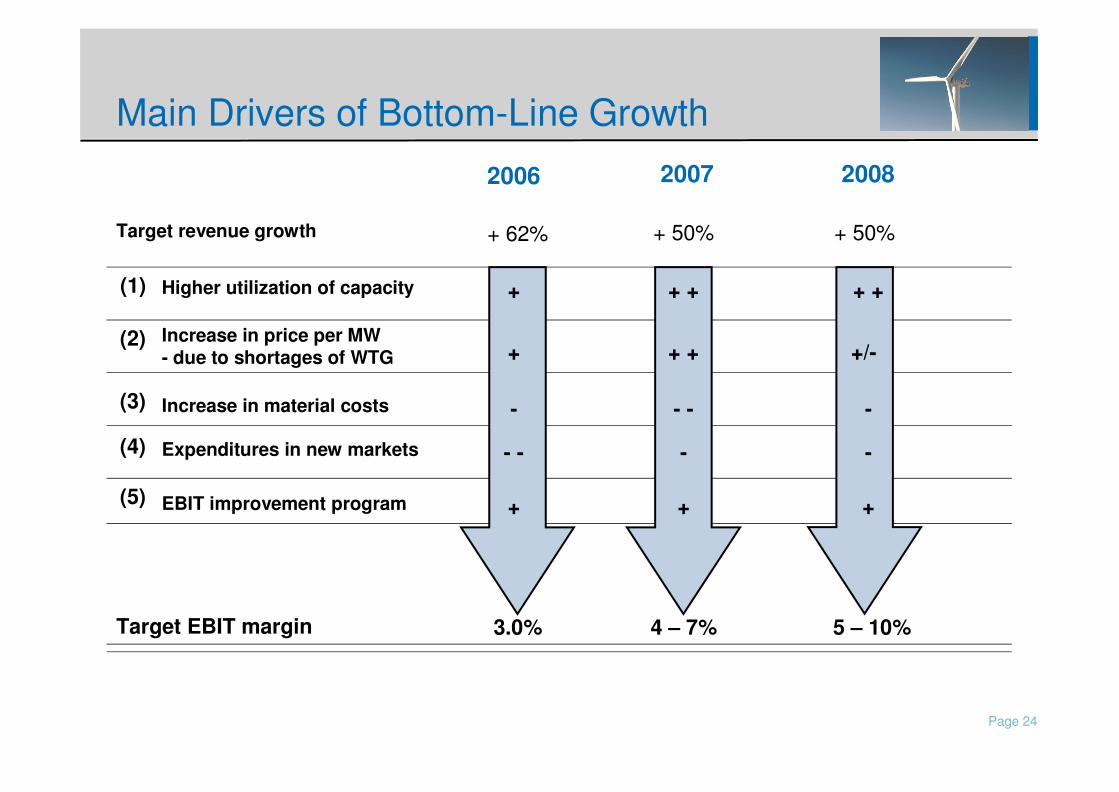
Main Drivers of Bottom-Line Growth
Increase in price per MW - due to shortages of WTG
2006 2007 2008
+ + + +/-
EBIT improvement program + + +
Increase in material costs - - - -
Expenditures in new markets - - - -
Target EBIT margin 3.0% 4 – 7% 5 – 10%
Target revenue growth + 62% + 50% + 50%
(1) Higher utilization of capacity + + + + +
(2)
(3)
(4)
(5)
Page 25
• Nordex has left the restructuring phase, on a sustainable basis
• Arrangements have been implemented to recover market share. Also in 2006, Nordex will grow faster than the market
• Measures to preparing Nordex for an international business volume of € 1bn in 2008 are right on track
• Further EBIT improvement steps will lead to sustainable profitability on the high end of our industry benchmark
• Strategic plan for the years beyond 2008 is in process of consolidation
Summary

Page 26
Content
Market Development 2
Business Performance in 20063
4 Outlook
5 Appendix
Company Profile 1
Page 27
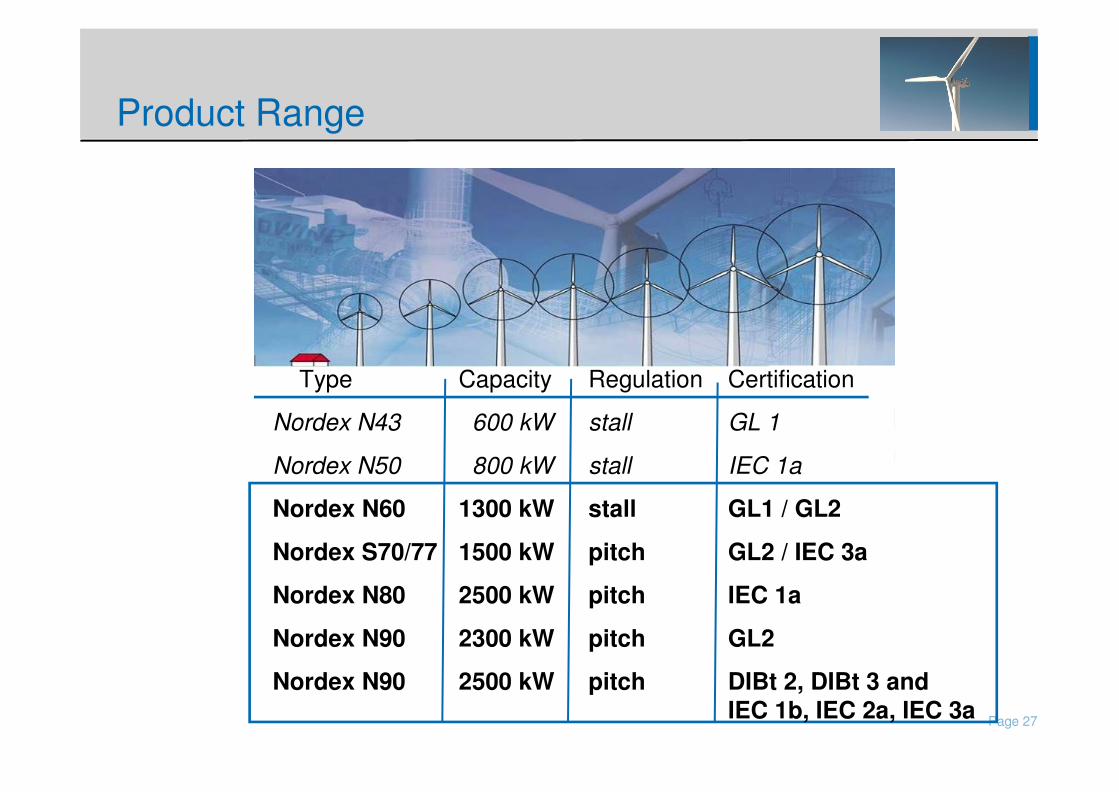
Product Range
Type Capacity Regulation Certification
Nordex N43 600 kW stall GL 1
Nordex N50 800 kW stall IEC 1a
Nordex N60 1300 kW stall GL1 / GL2
Nordex S70/77 1500 kW pitch GL2 / IEC 3a
Nordex N80 2500 kW pitch IEC 1a
Nordex N90 2300 kW pitch GL2
Nordex N90 2500 kW pitch DIBt 2, DIBt 3 andIEC 1b, IEC 2a, IEC 3a
Page 28
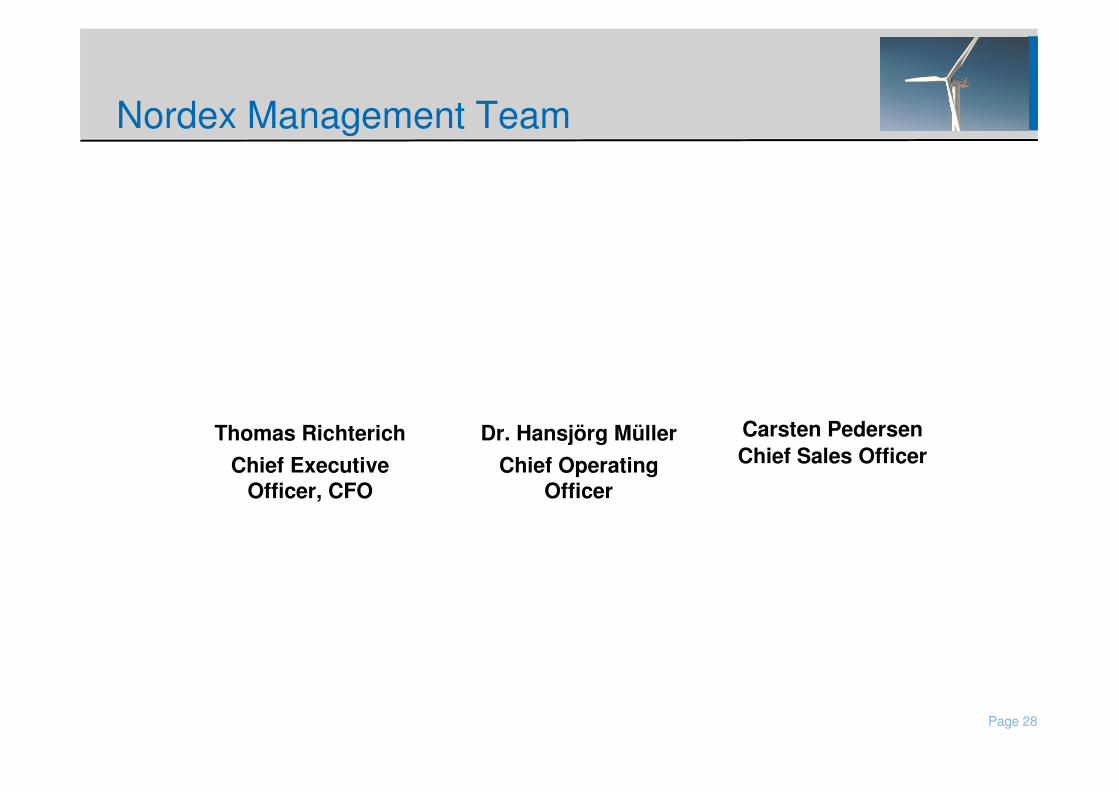
Nordex Management Team
Thomas RichterichChief Executive
Officer, CFO
Carsten PedersenChief Sales Officer
Dr. Hansjörg MüllerChief Operating
Officer
� Previous positions with MAN, Ferrostaal and Babcock Borsig
� CFO since 2002, CEO since 2005
� Managing Director of Nordex Energy GmbH since 1987 and Board Member of Nordex
� Responsible for Sales, since 2001
� Previous positions with Siemens and Roland Berger
� Since 2004 Nordex board member for Operations
Page 29
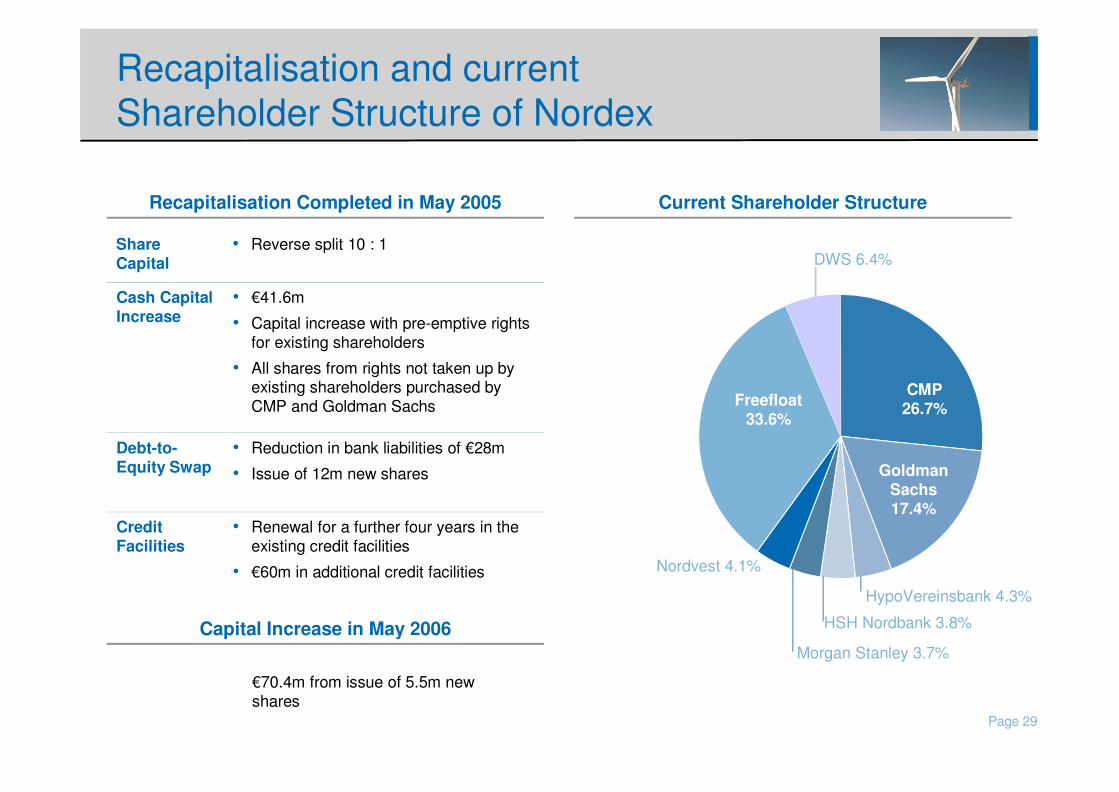
Recapitalisation and current Shareholder Structure of Nordex
• Reduction in bank liabilities of € 28m
• Issue of 12m new shares
Debt-to-Equity Swap
• Renewal for a further four years in the existing credit facilities
• € 60m in additional credit facilities
Credit Facilities
• € 41.6m
• Capital increase with pre-emptive rights for existing shareholders
• All shares from rights not taken up by existing shareholders purchased by CMP and Goldman Sachs
Cash Capital Increase
• Reverse split 10 : 1Share Capital
CMP26.7%
GoldmanSachs17.4%
HypoVereinsbank 4.3%
HSH Nordbank 3.8%
Morgan Stanley 3.7%
Nordvest 4.1%
Freefloat33.6%
Recapitalisation Completed in May 2005 Current Shareholder Structure
Capital Increase in May 2006
€ 70.4m from issue of 5.5m newshares
DWS 6.4%
Page 30
Financial Calendar
� Forecast on fiscal year 2007 December, 2006(conference call)
� Report on fiscal 2006 April 26, 2007
� Annual general meeting May 15, 2007
Page 31
Contact
Ralf Peters
Head of Corporate Communication/ Investor Relations
Phone: +49 (0)40/500 98 522
Fax: +49 (0)40/500 98 333
eMail: [email protected]
Nordex AG
Bornbarch 2
22848 Norderstedt
Germany
www.nordex-online.com