fracture porosity in the décollement zone of nankai accretionary wedge using logging while drilling...
TRANSCRIPT
Fracture porosity in the de¤collement zone ofNankai accretionary wedge using Logging While Drilling
resistivity data
Sylvain Bourlange a;�, Pierre Henry a, J. Casey Moore b, Hitoshi Mikada c,Adam Klaus d
a Laboratoire de Ge¤ologie, Ecole Normale Supe¤rieure, 24 Rue Lhomond, 75005 Paris, Franceb Department of Earth Sciences, University of California, Santa Cruz, CA 95064, USA
c Deep Sea Research Department, JAMSTEC, 2-15, Natsushima-cho, Yokosuka-shi, Kanagawa 237-0061, Japand Ocean Drilling Program, Texas ApM University, 1000 Discovery Drive, College Station, TX 77845-9547, USA
Received 2 August 2002; received in revised form 10 February 2003; accepted 13 February 2003
Abstract
Fracture porosity in the de¤collement zone of Nankai accretionary wedge is estimated by comparison of porositymeasured on cores during Ocean Drilling Program Leg 131 and porosity calculated from resistivity logs acquiredduring Leg 196 using Logging While Drilling. Resistivity is converted to formation factor considering both pore fluidconductivity and surface conductivity of clay particles. Pore fluid conductivity is calculated from temperature and ionconcentration in interstitial water, whereas surface conductivity is calculated from cationic exchange capacity data andexchangeable cation concentrations. Finally the formation factor is converted to porosity using the generalizedArchie’s law. The de¤collement appears as a zone of compacted rock where dilatant fractures have developed. Thecontrast between resistivity^porosity and core porosity is used to estimate fracture porosity in the de¤collement,assuming that the total conductivity is the result of fracture network and rock fragment conductivities, behaving asresistors in parallel, in the direction of the fracture network. Fracture porosity increases downward in the de¤collementzone from 1.8% to 8.5%. This suggests pore pressure in the de¤collement zone is higher than the pore pressureestimated from compaction curves (excess pore pressure ratio of 0.47). A possible explanation is that dilatancy isassociated with a high pressure transient. The migration of a pressure wave along the de¤collement could occur at avelocity of 500 m/yr if the permeability of the dilated zone is higher than 10312 m2. The characteristic time fortransient dissipation by diffusion in the footwall and hanging wall of the de¤collement is estimated to be 100^1000years. Coexistence of dilatant and compactive shear localization structures is observed within the wedge and in themain fault zones. However, only the de¤collement is currently dilated by fluids. We propose that fluids are injected intothe de¤collement zone during or after fracturing and that initial shear localization is always compactive and occurs
0012-821X / 03 / $ ^ see front matter C 2003 Elsevier Science B.V. All rights reserved.doi:10.1016/S0012-821X(03)00082-7
* Corresponding author. Tel. : +33-1-44-32-27-02; Fax: +33-1-44-32-20-00.E-mail addresses: [email protected] (S. Bourlange), [email protected] (P. Henry), [email protected] (J.C. Moore),
[email protected] (H. Mikada), [email protected] (A. Klaus).
EPSL 6584 18-3-03
Earth and Planetary Science Letters 209 (2003) 103^112
www.elsevier.com/locate/epsl
ahead of the fluid injections. This sequence of events could occur during each fluid migration and slip event,constituting an increment of de¤collement propagation.C 2003 Elsevier Science B.V. All rights reserved.
Keywords: Nankai trough; resistivity; porosity; logging while drilling; de¤collement; accretionary wedge; ODP Site 808;pore pressure
1. Introduction
Identi¢cation of the mechanisms responsible forthe low apparent friction along plate boundariesis currently a major scienti¢c problem. De¤colle-ments are a type of weak fault that follow sedi-mentary (or crustal) layering and thus play a fun-damental role in the growth of mountain belts. Insubduction zones where sediment accretion is oc-curring, the updip end of the subduction plane isthe de¤collement of the accretionary wedge. It isgenerally aseismic near the toe of the wedge[1,2]. One question is whether high £uid pressure[3] or mineralogy is the cause of the low e¡ectivefriction on the de¤collement. Furthermore, £uidmigration along the de¤collement is thought toplay a major role in de¤collement initiation in thetrench [4]. Several authors have proposed thatepisodic £uid injections result in a mode I hydro-fracture-like propagation, followed by shearing[5,6]. Fluid £ow along faults in accretionarywedge is episodic and models associating transienthigh pore pressure with aseismic slip have beenproposed [7^10]. All models of lateral £ow requirea high de¤collement permeability (more than 10314
m2 in steady state, and possibly higher in transi-ent state) which may only be reached in a dilatedfracture network [9^11]. In this paper, we inves-tigate the dilatancy in the Nankai wedge de¤colle-ment and fault zones from logging while drilling(LWD) data.Pore pressure investigations by drilling in accre-
tionary wedge de¤collements have been conductedat the toe of the Barbados and Nankai accretion-ary wedges [12,13]. Essential tools used for assess-ment of pore pressure in the fault zone are LWD[14,15], and sealed borehole observatories(CORK) [16,17]. The £uid overpressure measuredin Barbados wedge de¤collement is moderate,which led to the hypothesis that the de¤collement
slides only during episodes of higher pore pressureassociated with £uid £ow [10]. In Barbados, thede¤collement forms along a weak and anomalouslyhigh-porosity layer of radiolarian clay [18,19],probably a¡ecting the friction coe⁄cient. Ob-served zones with high porosity may be main-tained by continuous £uid recharge along the de¤-collement [18]. In Nankai accretionary wedge,apparent homogeneity of lithology around the de¤-collement [13] makes it a good location to inves-tigate the role of £uids in de¤collement initiation.At the toe of Nankai wedge, the de¤collement
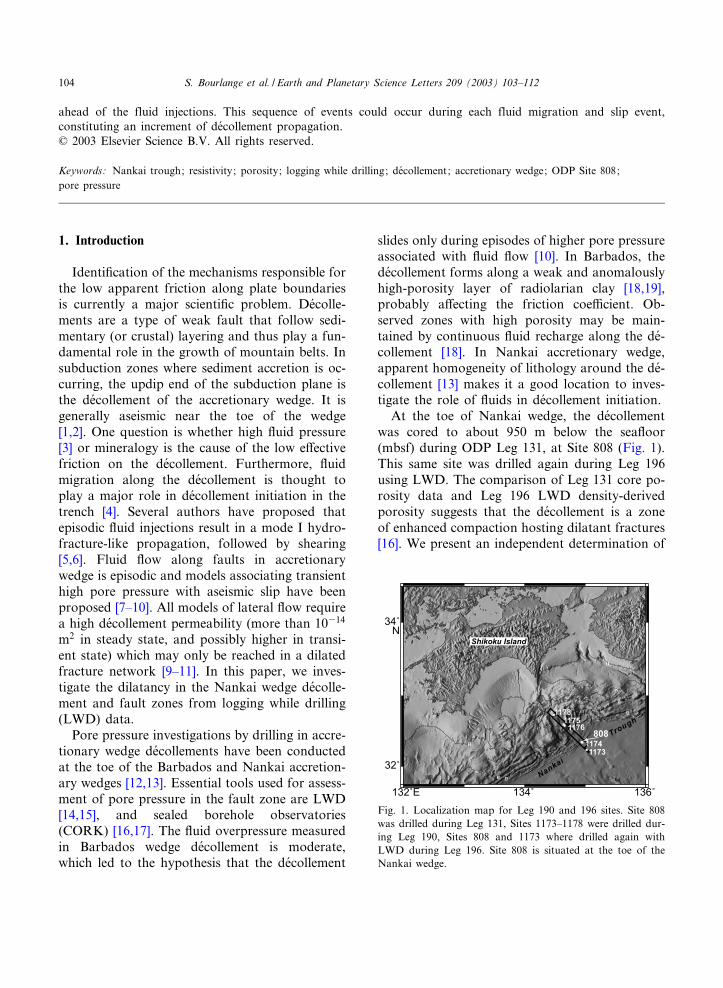
was cored to about 950 m below the sea£oor(mbsf) during ODP Leg 131, at Site 808 (Fig. 1).This same site was drilled again during Leg 196using LWD. The comparison of Leg 131 core po-rosity data and Leg 196 LWD density-derivedporosity suggests that the de¤collement is a zoneof enhanced compaction hosting dilatant fractures[16]. We present an independent determination of
Fig. 1. Localization map for Leg 190 and 196 sites. Site 808was drilled during Leg 131, Sites 1173^1178 were drilled dur-ing Leg 190, Sites 808 and 1173 where drilled again withLWD during Leg 196. Site 808 is situated at the toe of theNankai wedge.
EPSL 6584 18-3-03
S. Bourlange et al. / Earth and Planetary Science Letters 209 (2003) 103^112104

porosity at Site 808 based on LWD resistivity.Considering that the excess porosity in the de¤-collement likely corresponds to fracture porosity,we propose a simple model to account for thee¡ect of dilatant fractures on resistivity. Usingthis approach, we estimate the fracture porosityin the de¤collement. We then discuss the implica-tions of de¤collement dilatancy for the £uid pres-sure regime and we propose a model of incremen-tal de¤collement propagation.
2. Computation of porosity from resistivity
2.1. Resistivity, temperature and physico-chemicaldata
The resistivity log was obtained during Leg 196(Fig. 2). The tool used was the Resistivity at theBit (RAB) tool provided by Schlumberger-Ana-drill. This tool provides resistivity imagery fromrotating button electrodes but also quantitativemeasurement of formation resistivity using aring electrode. The ring electrode is situated 2.05 mfrom the bit and provides a focused lateralresistivity measurement, with a vertical resolutionof 5 cm and a depth of investigation of 18 cm.The resistivity measurement is less sensitive to
hole diameter e¡ects than gamma densitometry.The resistivity image is generally good even inintervals which yielded bad density data. Thissuggests borehole enlargement (the caliper is onthe density tool) occurred progressively above thedrill bit and has little e¡ect on the resistivity mea-surement.Temperature has a large e¡ect on electrical con-
ductivity. A temperature pro¢le at Site 808 is cal-culated from the thermal conductivity measuredon samples during Leg 131 and assuming a con-stant conductive heat £ow of 129 mW/m2 [20](Fig. 2). This heat £ow was determined fromfour relatively shallow (200^350 mbsf) bottomhole temperature measurements. Conductivity isalso sensitive to pore £uid composition and toclay mineralogy. Pore £uid major cation compo-sition is available from shipboard analysis [13].Cation exchange capacity (CEC) is used to esti-mate clay surface conductivity. CEC determina-tions were performed using cobaltihexamine oncore samples from Hole 808C and taken aboutevery 10 m (every 5 m around fault zones andde¤collement) (Fig. 2). Since the composition ofexchangeable cations at Site 808 was not mea-sured, we estimated it from the major cation com-position of the cobaltihexamine extract obtainedpreviously at Site 1174 (2 km seaward of Site
Fig. 2. Site 808 data. (A) Resistivity acquired using LWD. (B) Cationic exchange capacity measured on Site 808 core samples.(C) Temperature gradient extrapolated from thermal permeability, heat £ux and temperature measurements. (D) Concentrationof exchangeable ions expressed as quantity of positive charge per mass of dry rock. Due to the low concentration of potassiumand magnesium (less than 3 cmol+/kg), only calcium (triangles) and sodium (circles) are represented.
EPSL 6584 18-3-03
S. Bourlange et al. / Earth and Planetary Science Letters 209 (2003) 103^112 105
808), corrected using Site 808 and 1174 shipboardpore £uid composition data.
2.2. Porosity calculation
In a rock with non-conducting grains, the bulkconductivity depends linearly on the conductivityof the £uid, and the formation factor F is conven-iently de¢ned as the ratio of £uid conductivity cf
to bulk conductivity c :
F ¼ c f
c
ð1Þ
Generalized Archie’s law then links formationfactor and porosity [21] :
F ¼ aP3m ð2Þ
where m is referred as the cementation factor andparameter a is a constant. In this equation, P isthe total porosity of the material, including bothintergrain space porosity and smectite interlayerporosity. Nankai hemipelagites are rich in clay(50%) [13] which have signi¢cant surface conduc-tivity. This e¡ect can be treated by de¢ning theformation factor as the limit of cf /c for in¢nite£uid conductivity [22].We use a model taking into account both the
ionic composition of the pore £uid and the sur-face conductive layer [23]. First, the porous £uidconductivity is calculated at any depth. Seawaterconductivity shows strong variations with temper-ature, which vary from 0‡C to 90‡C in the bore-hole (Fig. 2C). The following relation has beenused:
c sw ¼ 5:32ð1þ 0:02ðT325ÞÞ ð3Þ
where T is expressed in ‡C.Interstitial £uid composition was determined
during Leg 190 [13] and di¡ers from seawater.Consequently, a linear correction has to be ap-plied at any depth:
c f ¼ c sw
Xi
LifZiCi
iws
Xj
LjfZjC
jsw
ð4Þ
where Lif is the ionic mobility in the £uid, C i
iwsand C i
sw are, respectively, concentration deter-mined on squeezed samples [13] and seawater con-
centration for chloride, sodium, sulfate, magnesi-um, calcium and potassium ions. Lowerconcentrations of chloride and sodium in the low-er part of the hole decrease £uid conductivity rel-ative to seawater by about 20%.Secondly, surface conductivity is computed
from CEC, grain density bg, and equivalent sur-face mobility Ls :
c s ¼23b gCECL s ð5Þ
This relation is a combination of equations 7 and8 in [23] (with a correction of equation 7 for anunexpected Zs). Equivalent surface mobility is cal-culated by linear combination of Naþ, Kþ, NHþ
4 ,Ca2þ and Mg2þ cation surface mobility L
is, their
respective concentrations Ci in the surface layerand their charge Zi :
L s ¼
Xi
LisZiCi
Xj
ZjCjð6Þ
Both Lif and L
is are linearly dependent on temper-
ature, with coe⁄cients summarized in [23].Sodium and calcium are the dominant ions in
the surface layer and the calcium to sodium ratiois higher than in the pore £uid. Since calcium sur-face mobility is lower than that of sodium, surfaceconductivity is about 15% lower than what wouldbe calculated if the surface layer £uid compositionwere assumed to be identical to pore £uid.The h ratio is computed as surface conductivity
cs over £uid conductivity cf :
h ¼ c s
c fð7Þ
h increases down the hole from 0.01 to 0.05.Formation factor F is calculated using a high-
salinity asymptotic approximation of the completeequations in [23] obtained through a Taylor ex-pansion calculation, valid for hI1.
F ¼ c f
c
1þ 2hc f
c
31� �� �
ð8Þ
This new expression is more accurate than thelinear high-salinity asymptote in [23]. The devia-tion from the complete equation is less than 5% inthe range of h and cf in the borehole. The for-mation factor F is ¢nally converted to porosityusing the generalized Archie’s law. With this
EPSL 6584 18-3-03
S. Bourlange et al. / Earth and Planetary Science Letters 209 (2003) 103^112106
method, parameters m and a of the generalizedArchie’s law are the only adjustable parameters.
2.3. Results
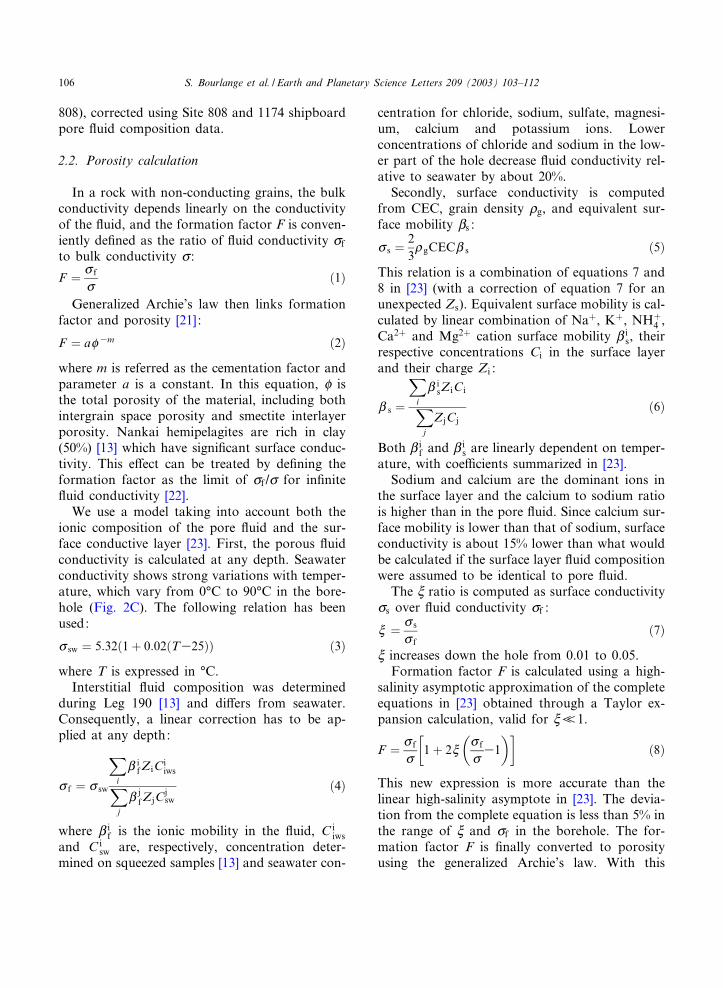
Resistivity-derived porosity is compared withporosity measured on cores (Fig. 3a) and porosityderived from LWD density acquired during Leg196 (Fig. 3b). Resistivity^porosity was calculatedwith values a=1.0 and m=1.95 for the general-ized Archie’s law. With these values, the resistiv-ity^porosity/core porosity and resistivity^poros-ity/density^porosity ¢ts are very good. Becausedensity measurements are very sensitive to holeconditions, a ¢lter has been applied to removedata from sections with poor hole conditions, orcollected more than 1.5 h after drilling (see cap-tion of Fig. 3). As a consequence, some sectionsappear with no density^porosity data, like the
poorly cemented turbidite section above 550mbsf, or the underthrust sequence below 970mbsf, which su¡ered from hole collapse aroundthe de¤collement level. The data comparison showsthat resistivity is a very useful measurement to getporosity information especially in sections wheredensitometry fails due to hole degradation.The frontal thrust at 400 mbsf and the fault
zone at 560 mbsf are characterized by a decreasein resistivity^porosity, interpreted as dominantlycompactive deformation associated with thesestructures. However, RAB images showed con-ductive planes interpreted as fractures. Such dis-crete conductive structures were only observed inthe main fault zones and de¤collement [16]. Frac-ture-like features imaged outside the main faultzones are resistive and thus should be interpretedas compactive shear zones at least at the cm scaleof the RAB images.Around the de¤collement zone, resistivity^poros-
ity increases regularly from the above-de¤collementto the below-de¤collement value, but porosity mea-sured on cores in the same zone follows an oppo-site trend with a sharp 7% decrease (Fig. 5a).Rock fragments in the de¤collement therefore in-dicate compactive strain, whereas resistivity^po-
Fig. 3. (a) Porosity measured on cores during Leg 131(dots), and porosity derived from LWD resistivity using Leg196 data (line). Dashed lines indicate the position of thefrontal thrust (389^414 mbsf), the fault zone (559^574 mbsf)and the de¤collement (945^964 mbsf). (b) Porosity derivedfrom Leg 196 LWD resistivity data (same as in a) comparedwith porosity derived from Leg 196 LWD bulk density(dots). Bulk density data have been ¢ltered to keep data ac-quired where the di¡erential caliper is lower than 0.7 inch,and the delay between drilling and measure is shorter than1.5 h. Porosity was calculated assuming a grain densitybg = 2.64+6.5U1035z for z6 823.7 mbsf and bg = 2.65+1.0U1034z for zs 823.7 mbsf. Water density is assigned thevalue 1035 kg/m3.
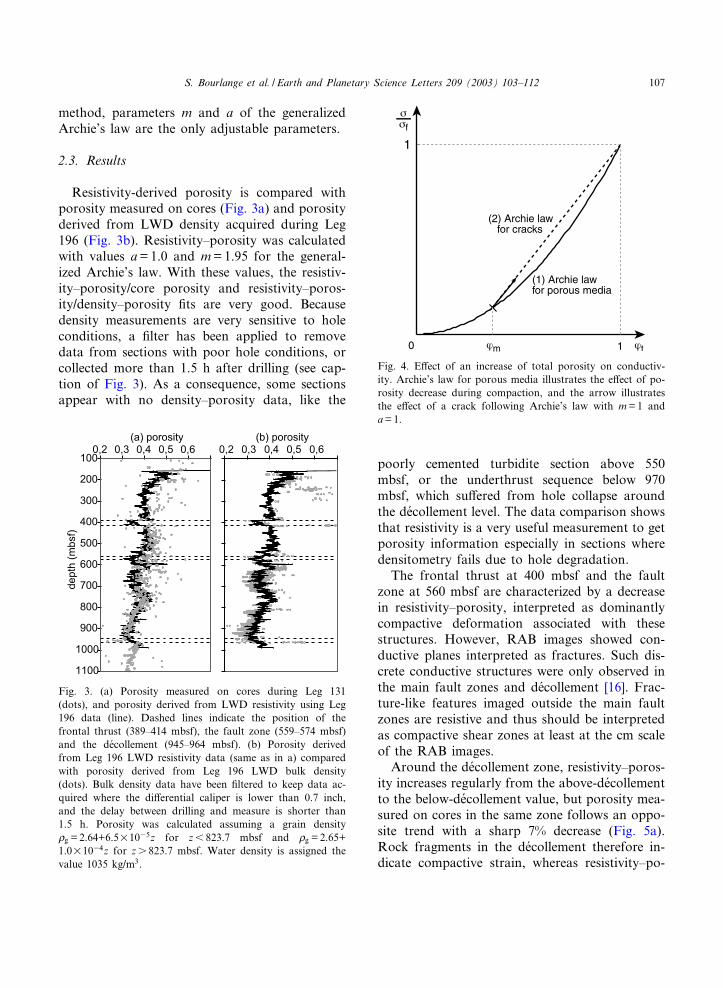
Fig. 4. E¡ect of an increase of total porosity on conductiv-ity. Archie’s law for porous media illustrates the e¡ect of po-rosity decrease during compaction, and the arrow illustratesthe e¡ect of a crack following Archie’s law with m=1 anda=1.
EPSL 6584 18-3-03
S. Bourlange et al. / Earth and Planetary Science Letters 209 (2003) 103^112 107

rosity increase reveals that the zone is globallydilated. We interpret these observations as dueto fracture dilatancy enhanced by a high £uidpressure.
3. Determination of fracture porosity in thede¤collement
Resistivity-derived porosity is based on a gen-eral relationship for intact rock, and should notbe applied to fractured intervals. If a porous sam-ple presents a porosity increase without crack lo-calization, then conductivity would be expected tovary with porosity according to Archie’s law. Ifthe same sample undergoes dilatant fracturing,then, for a same porosity change, conductivityshould increase more than in the previous case(Fig. 4). Fracture porosity and conductivity canbe assumed to follow a generalized Archie’s lawwith a=1 and exponent m=1. All studies of frac-tured rocks ¢nd an exponent m close to 1 [24^31].Theoretically, a cannot be less than 1 and in-creases with the fraction of the fracture porositywhich does not participate in the transport pro-cesses (unconnected fractures, voids). a=1 is thelimit for a perfectly connected network with astrong preferred orientation parallel to the direc-tion of measurement. Choosing a=1 therefore
leads to a lower bound estimation of fracture po-rosity.Conductivity along a fracture zone with a frac-
ture porosity Pc can be decomposed to two terms.The ¢rst term accounts for the conductivity alongthe fracture network, ¢lled with a £uid of conduc-tivity cf and the second term accounts for theconductivity cr of rock fragments. Assumingthat the fracture network and the rock fragmentsare analogous to resistors in parallel, the forma-tion factor has to be the sum of these conductiv-ities a¡ected by a relative volume coe⁄cient: Pcfor the fracture network and (13Pc) for the rockfragments. The resultant equation is :
c ¼ P cc f þ ð13P cÞc r ð9Þ
Rearranging Eq. 9 yields:
P c ¼c3c r
c f3c rð10Þ
Rock conductivity is calculated from core sam-ple porosity and equations presented in Section2.2.Fig. 5 shows the calculated values of fracture
porosity in the de¤collement zone (945^964 mbsf,as de¢ned during Leg 131). Calculated fractureporosity is about 1.8% at the top of the de¤colle-ment and increases downward to more than 8.5%.The increasing trend of fracture porosity with
Fig. 5. (a) Zoom of Fig. 3 at the de¤collement zone. (b) Calculated fracture porosity. Dashed lines indicate the upper and lowerboundary of the de¤collement.
EPSL 6584 18-3-03
S. Bourlange et al. / Earth and Planetary Science Letters 209 (2003) 103^112108
depth inside the de¤collement indicates higher frac-ture dilatancy at the base of the de¤collement.
4. Discussion
4.1. Transient high pore pressure in thede¤collement
Previous workers have proposed that transient£uid £ow along the de¤collement raises excess porepressure to the minimum principal stress, permit-ting a strain event to occur [8^10]. Excess porepressure ratio in the underthrust sequence esti-mated from a compaction curve [32] is V*= 0.47and would correspond to an excess pore pressureof 4 MPa at de¤collement level. This value wouldalso correspond to a minimal e¡ective stress of 4.5MPa if c3 is lithostatic, and to a minimum of 2^2.5 MPa if the stress state rotated to horizontalextension. This stress is probably too high to en-able fracture opening. The dilatant zone thus ap-pears as a narrow 15^20 m thick zone of highpore pressure, out of equilibrium with ambientpore pressure conditions. This feature must betransient. Time scales may be constrained fromtwo main processes: migration of a pressurewave along the de¤collement [7,10] and decay ofthe overpressure by di¡usion in the footwall andhanging wall. Pore pressure waves can propagatealong a de¤collement if the permeability increasewith pore pressure is considered [7]. The velocityof these pressure waves is given by [7] as a func-tion of the wedge taper, dilatancy and permeabil-ity. In Nankai, taper amounts to 4‡ and dilatancyhas been estimated in Section 3 to be between1.8% and 8.5%. The propagation of a pressurewave from the updip end of the seismogeniczone to the toe of the wedge during the 50 yearinterval since the last subduction earthquake im-plies a minimum pressure wave velocity of 500 m/yr. This would require a permeability higher than10312 m2 in the dilated zone.Secondly, excess pore pressure in the de¤colle-
ment decays due to pressure di¡usion outsidethe de¤collement zone. Assuming linear pressuredi¡usion following Darcy’s law, the order of mag-nitude of the decay time can be estimated. Decay
time is a function of the width of the pressurizedzone and of the drained compressibility and per-meability of the non-dilated wall rock [33]. Labo-ratory experiments indicate a compressibility ofabout 6^7U1039/Pa [34]. Permeability is consid-ered to be in the range 10319^10318 m2, based onlaboratory measurements under con¢ning pres-sure approaching the in situ state. For a perme-ability of 10319 m2, pressure decays in about 1000years and for a permeability of 10318 m2, in about100 years. In both cases the zone a¡ected by porepressure di¡usion is about 50 m on each side ofthe fault zone. The pressure transients are short atthe scale of accretionary wedge growth and mayhave a relationship with the seismic cycle.
4.2. Initiation of the de¤collement
One striking observation is the coexistence ofdilatant and compactive deformation modes.This may be a consequence of pore pressure cy-cling, as proposed above for the de¤collement.However, this observation could also in part bethe consequence of the strain localization process.Experiments under drained conditions on po-
rous rocks show that for a su⁄ciently high con-¢ning stress, strain localization initiates in a com-pactive mode well below the Coulomb failurestress [35]. The material then may reach condi-tions for brittle failure, as a consequence of eitherporosity reduction or increase of pore pressure.This would result in a later dilatant deformation.This behavior may explain microstructural obser-vations on Nankai cores [36] and, at a largerscale, RAB observations in fault zones. However,the high fracture porosity inferred for the de¤colle-ment likely requires dilatancy enhancement by £u-id pressure. Pore pressure transfer along the faultzone requires high permeabilities that probablycan only be reached in this dilated state.Therefore, we propose a model of incremental
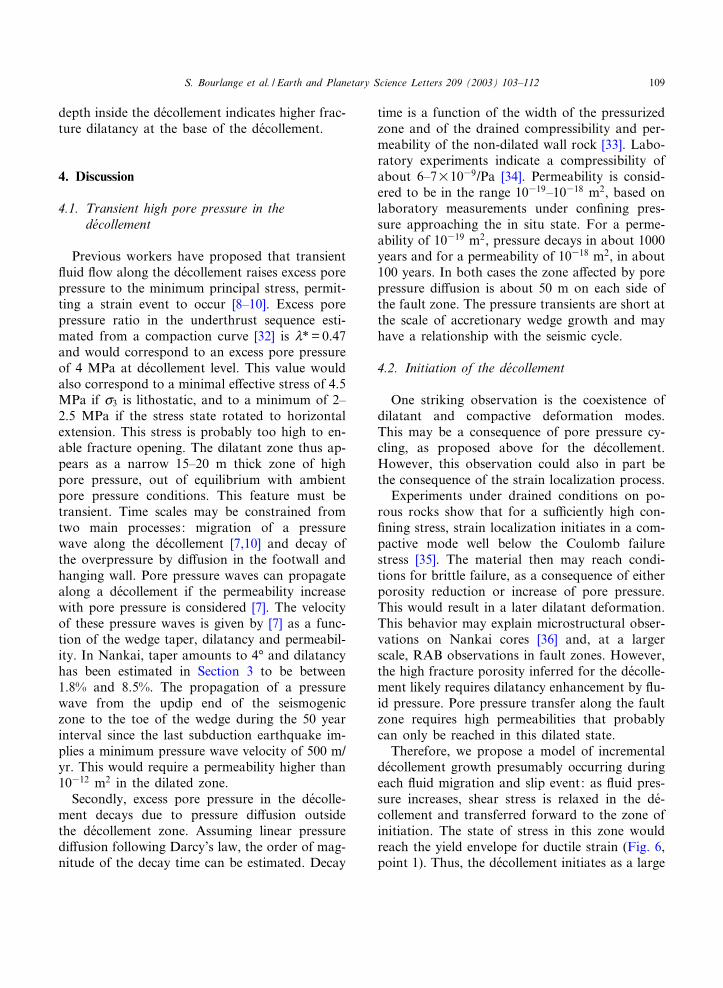
de¤collement growth presumably occurring duringeach £uid migration and slip event: as £uid pres-sure increases, shear stress is relaxed in the de¤-collement and transferred forward to the zone ofinitiation. The state of stress in this zone wouldreach the yield envelope for ductile strain (Fig. 6,point 1). Thus, the de¤collement initiates as a large
EPSL 6584 18-3-03
S. Bourlange et al. / Earth and Planetary Science Letters 209 (2003) 103^112 109
scale compactive shear band, presumably associ-ated with a decrease of permeability. Further in-crease of di¡erential stress and/or strain weaken-ing would lead the stress state to the fractureenvelope (Fig. 6, point 2), increasing permeabilityalong the de¤collement and enabling transient lat-eral £uid transfer from beneath the wedge. As aconsequence, e¡ective stress decreases and dila-tancy is enhanced (Fig. 6, point 3).
5. Summary and conclusion
LWD resistivity data have been converted toporosity using generalized Archie’s law, associ-ated with a description of electrical conductivityas the e¡ect of both porous £uid and conductivelayer at the surface of clay particles. The results ofthis inversion have been compared to porositymeasured on cores during ODP Leg 131, and po-rosity derived from density acquired at the sametime as resistivity (Leg 196). The determination ofporosity from resistivity appears to ¢t porositymeasured on cores very well outside the de¤colle-ment. The de¤collement presents dilated fracturesin a compacted rock matrix. Fracture porosityamounts to 1.8^8.5%. The coexistence of tectoniccompaction with brittle fracturing within the de¤-
collement suggests the occurrence of cyclic £uidpressure and stress variations. Propagation ofpore pressure waves from the seismogenic zoneto the trench could occur within each earthquakecycle if the dilated fault zone permeability is morethan about 10312 m2. A pressure increase in thede¤collement zone causes shear stress reduction inthe pressurized zone but also a shear stress in-crease at the de¤collement tip by elastic (or elasto-plastic) stress transfer. We wonder what the im-portance of this process is for de¤collementpropagation.
Acknowledgements
We thank the crew of the JOIDES Resolution.We would also like to thank Barbara Bekins forcareful and helpful review, as well as two otheranonymous reviewers.[BARD]
References
[1] D.E. Byrne, D.M. Davis, L.R. Sykesi, Loci and maximumsize of thrust earthquakes and the mechanics of the shal-low region of subduction zones, Tectonics 7 (1988) 833^857.
[2] D.A. Oleskevich, R.D. Hyndman, K. Wang, The updipand downdip limits to great subduction earthquakes:Thermal and structural models of Cascadia, south Alaska,SW Japan and Chile, J. Geophys. Res. B 104 (1999)14965^14991.
[3] D. Davis, J. Suppe, F.A. Dahlen, The mechanics of foldand thrust belts, J. Geophys. Res. B 88 (1983) 1153^1172.
[4] J.C. Moore, P. Vrolijk, Fluids in accretionary prisms,Rev. Geophys. 30 (1992) 113^135.
[5] D.E. Karig, J.K. Morgan, Tectonic deformation; stresspaths and strain histories, in: A. Maltman (Ed.), TheGeological Deformation of Sediments, Chapman andHall, London, 1994, pp. 167^204.
[6] G.K. Westbrook, M.J. Smith, Long decollements andmud volcanoes: Evidence from the Barbados Ridge com-plex for high pore £uid pressure in the development of anaccretionary complex, Geology 11 (1983) 279^283.
[7] J. Rice, Fault stress states, pore pressure distributions,and the weakness of the San Andreas Fault, in: B. Evans,T.-F. Wong (Eds.), Fault Mechanics and Transport Prop-erties of Rocks, Academic, London, 1992, pp. 475^503.
[8] K.M. Brown, B.A. Bekins, B. Clennell, D. Dewhurst,G.K. Westbrook, Heterogeneous hydrofracture develop-ment and accretionary fault dynamics, Geology 22 (1994)259^262.
Fig. 6. Mean stress (p)^di¡erential stress (q) diagram illus-trating the evolution of the state of stress for materials inthe de¤collement during its initiation. The gray line is the en-velope for brittle failure, the gray curve is the limit for duc-tile deformation onset. The e¡ect on permeability (k) is alsoindicated. Sketches represent the de¤collement and surround-ing materials. Intensity of gray indicates the level of compac-tion.
EPSL 6584 18-3-03
S. Bourlange et al. / Earth and Planetary Science Letters 209 (2003) 103^112110
[9] B.A. Bekins, A.M. McCa¡rey, S.J. Dreiss, Episodic andconstant £ow models for the origin of low-chloride watersin a modern accretionary complex, Water Resour. Res. 31(1995) 3205^3215.
[10] P. Henry, Fluid £ow at the toe of the Barbados accre-tionary wedge constrained by thermal, chemical, and hy-drogeologic observations and models, J. Geophys. Res. B105 (2000) 25855^25872.
[11] E.J. Screaton, D.R. Wuthrich, S.J. Dreiss, Permeabilities,£uid pressures and £ow rates in the Barbados Ridge com-plex, J. Geophys. Res. B 95 (1990) 8997^9007.
[12] J.C. Moore, A. Klaus, N.L. Bangs, B. Bekins, W. Brueck-mann, C.J. Buecker, S.N. Erickson, O. Hansen, T. Hor-ton, P. Ireland, C.O. Major, G.F. Moore, S. Peacock, S.Saito, E.J. Screaton, J.W. Shimeld, P.H. Stau¡er, T. Tay-maz, P.A. Teas, T. Tokunaga, Synthesis of results; log-ging while drilling, northern Barbados accretionary prism,in: J.C. Moore, A. Klaus (Eds.), Proc. ODP Sci. Reports171A (2000) 1^25.
[13] Shipboard Scienti¢c Party, Leg 190 summary, in: G.F.Moore, A. Taira, A. Klaus. et al. (Eds.), Proc. ODPInit. Reports 190 (2001) 1^87.
[14] D. Goldberg, The role of downhole measurements in ma-rine geology and geophysics, Rev. Geophys. 35 (1997)315^342.
[15] J.C. Moore, A. Klaus, N.L. Bangs, B. Bekins, C.J. Buck-er, W. Bruckmann, S.N. Erickson, O. Hansen, T. Horton,P. Ireland, C.O. Major, G.F. Moore, S. Peacock, S. Saito,E.J. Screaton, J.W. Shimeld, P.H. Stau¡er, T. Taymaz,P.A. Teas, T. Tokunaga, Consolidation patterns duringinitiation and evolution of a plate boundary decollement:Northern Barbados accretionary prism, Geology 26(1998a) 811^814.
[16] Shipboard Scienti¢c Party, Leg 196 summary: deforma-tion and £uid £ow processes in the Nankai Trough accre-tionary prism: logging while drilling and AdvancedCORKs, in: H. Mikada, K. Becker, J.C. Moore, A.Klaus, et al. (Eds.), Proc. ODP Init. Reports 196 (2002).
[17] J.P. Foucher, P. Henry, F. Harmegnies, Long-term obser-vations of pressure and temperature in Hole 948D, Bar-bados Accretionary Prism, in: T.H. Shipley, Y. Ogawa, P.Blum, J.M. Bahr (Eds.), Proc. ODP Sci. Results 156(1997) 239^245.
[18] N.L. Bangs, T.H. Shipley, J.C. Moore, G.F. Moore, Fluidaccumulation and channeling along the northern Barba-dos Ridge decollement thrust, J. Geophys. Res. B 104(1999) 20399^20414.
[19] S. Saito, D. Goldberg, Compaction and dewatering pro-cesses of the oceanic sediments in the Costa Rica andBarbados subduction zones; estimates from in situ phys-ical property measurements, Earth Planet. Sci. Lett. 191(2001) 283^293.
[20] M. Yamano, J.P. Foucher, M. Kinoshita, A. Fisher, R.D.Hyndman, A. Taira, I. Hill, J.V. Firth, U. Berner, W.Brueckmann, T. Byrne, T. Chabernaud, T. Gamo, J.M.Gieskes, D. Karig, M. Kastner, Y. Kato, S. Lallemant, R.Lu, A.J. Maltman, K. Moran, G. Moore, G. Olafsson, B.
Owens, K. Pickering, F. Siena, E. Taylor, M. Underwood,C. Wilkinson, J. Zhang, Heat £ow and £uid £ow regimein the western Nankai accretionary prism, Earth Planet.Sci. Lett. 109 (1992) 451^462.
[21] G.E. Archie, Electrical resistivity an aid in core-analysisinterpretation, Am. Assoc. Pet. Geol. B 31 (1947) 350^366.
[22] A.E. Bussian, Electrical conductance in a porous medium,Geophysics 48 (1983) 1258^1268.
[23] A. Revil, L.M. Cathles III, S. Losh, J.A. Nunn, Electricalconductivity in shaly sands with geophysical applications,J. Geophys. Res. B 103 (1998) 23925^23936.
[24] R. Aguilera, Analysis of naturally fractured reservoirsfrom conventional well logs, J. Pet. Technol. 28 (1976)764^772.
[25] W.F. Brace, A.S. Orange, Electrical resistivity changes insaturated rocks during fracture and frictional sliding,J. Geophys. Res. 73 (1968) 1433^1445.
[26] C. Broglia, D. Moos, M.H. Salisbury, J.H. Scott, K.Becker, W. Bosum, R.L. Carlson, A.T. Fisher, J.M.Gieskes, M.A. Holmes, H. Hoskins, J. Legrand, D. Rio,R.A. Stephen, R.H. Wilkens, In-situ structure and proper-ties of 110-Ma crust from geophysical logs in DSDP Hole418A, in: C. Auroux, E.K. Mazzullo (Eds.), Proc. ODPSci. Results 102 (1988) 29^47.
[27] J.W. Johnson, Critical Phenomena in Hydrothermal Sys-tems; State, Thermodynamic, Transport, and Electro-static Properties of H2O in the Critical Region, DoctoralThesis, University of Arizona, Tucson, AZ, 1987.
[28] T.J. Katsube, J.P. Hume, Permeability determination incrystalline rocks by standard geophysical logs, Geophysics52 (1987) 342^352.
[29] H. Pape, L. Riepe, J.R. Schopper, P.F.C. Worthington,Petrophysical detection of micro¢ssures in granites, in:SPWLA Twenty-sixth Annual Logging Symposium, Dal-las, TX, 1985, pp. 1^17.
[30] P.A. Pezard, Electrical properties of mid-ocean ridge ba-salt and implications for the structure of the upper oce-anic crust in Hole 504B, J. Geophys. Res. B 95 (1990)9237^9264.
[31] L.M. Schwartz, S. Kimminau, Analysis of electrical con-duction in the grain consolidation model, Geophysics 52(1987) 1402^1411.
[32] E. Screaton, D. Sa¡er, P. Henry, S. Hunze, G.F. Moore,A. Taira, A. Klaus, K. Becker, L. Becker, B. Boeckel,B.A. Cragg, A. Dean, C.L. Fergusson, S. Hirano, T. Hi-samitsu, M. Kastner, A.J. Maltman, J.K. Morgan, Y.Murakami, M. Sanchez-Gomez, D.C. Smith, A.J. Spi-vack, J. Steurer, H.J. Tobin, K. Ujiie, M.B. Underwood,M. Wilson, Porosity loss within the underthrust sedimentsof the Nankai accretionary complex; implications foroverpressures, Geology 30 (2002) 19^22.
[33] G. De Marsily, Quantitative Hydrogeology, AcademicPress, London, 1986, 440 pp.
[34] K. Moran, W. Brueckmann, V. Feeser, R.G. Campanella,I.A. Hill, A. Taira, J.V. Firth, U. Berner, T. Byrne, T.Chabernaud, A. Fisher, J.-P. Foucher, T. Gamo, J.M.
EPSL 6584 18-3-03
S. Bourlange et al. / Earth and Planetary Science Letters 209 (2003) 103^112 111
Gieskes, R.D. Hyndman, D.E. Karig, M. Kastner, Y.Kato, S. Lallemant, R. Lu, A.J. Maltman, G.F. Moore,G. Olafsson, W.H. Owens, K.T. Pickering, F. Siena, E.Taylor, M.B. Underwood, C. Wilkinson, M. Yamano, J.Zhang, W.R.E. Winkler, N.J.E. Stewart, In-situ stressconditions at Nankai Trough, Site 808, Proc. ODP Sci.Results 131 (1993) 283^291.
[35] P. Besuelle, Compacting and dilating shear bands in po-rous rocks; theoretical and experimental conditions,J. Geophys. Res. B 106 (2001) 13435^13442.
[36] A.J. Maltman, T. Byrne, D.E. Karig, S. Lallemant, De-formation at the toe of an active accretionary prism; syn-opsis of results from ODP Leg 131, Nankai, SW Japan,J. Struct. Geol. 15 (1993) 949^964.
EPSL 6584 18-3-03
S. Bourlange et al. / Earth and Planetary Science Letters 209 (2003) 103^112112