fourth quarter and year end 2014 financial results
TRANSCRIPT
Q4 2014 Financial Results March 16, 2015
This presentation contains forward-looking information under Canadian securities legislation. Forward-looking information includes, but is not limited to, statements with respect to the
development potential and timetable of the projects; the Company’s ability to raise additional funds as necessary or on commercially reasonable terms; the future price of gold; the
estimation of mineral resources and mineral reserves; conclusions of economic evaluation (including scoping studies); the realization of mineral resource and reserve estimates; the
timing and amount of estimated future production, development and exploration; costs of future activities; capital and operating expenditures; success of exploration activities; mining
or processing issues; currency exchange rates; government regulation of mining operations; and environmental risks. Generally, forward-looking information can be identified by the
use of forward-looking terminology such as “plans,” “expects” or “does not expect,” “is expected,” “budget,” “scheduled,” “estimates,” “forecasts,” “intends,” “anticipates” or “does not
anticipate,” or “believes,” or variations of such words and phrases or statements that certain actions, events or results “may,” “could,” “would,” “might,” or “will be taken,” “occur” or “be
achieved”. Forward-looking information is based on the opinions and estimates of management as of the date such statements are made. Estimates regarding the anticipated timing,
amount and cost of mining at the projects are based on assumptions underlying mineral resource estimates and the realization of such estimates; results of previous mining activities at
the projects, and detailed research and analysis completed by independent of the Company; research and estimates regarding the timing of delivery for long-lead items; knowledge
regarding the factors involved in building a mine and other factors described in the technical reports and Annual Information Form filed under the profile of the Company on SEDAR.
Capital and operating cost estimates are based on results of previous mining activities, research of the Company and independent consultants, recent estimates of construction and
mining costs and other factors that are set out in the scoping study. Production estimates are based on mine plans and production schedules, which have been developed by the
Company’s personnel and independent consultants. Forward-looking information is subject to known and unknown risks, uncertainties and other factors that may cause the actual
results, level of activity, performance or achievements of the Company to be materially different from those expressed or implied by such forward-looking information, including but not
limited to risks related to: timing and availability of external financing on acceptable terms; unexpected events and delays during construction, expansion and start-up; variations in ore
grade and recovery rates; receipt and revocation of government approvals; actual results of exploration and mining activities; changes in project parameters as plans continue to be
refined; future prices of gold; failure of plant, equipment or processes to operate as anticipated; accidents, labour disputes and other risks of the mining industry. Although management
of the Company has attempted to identify important factors that could cause actual results to differ materially from those contained in forward-looking information, there may be other
factors that cause results not to be as anticipated, estimated or intended. There can be no assurance that such statements will prove to be accurate, as actual results and future events
could differ materially from those anticipated in such statements. Accordingly, readers should not place undue reliance on forward-looking information. The Company does not
undertake to update any forward-looking information except in accordance with applicable securities laws.
Investors are advised that National Instrument NI 43-101 of the Canadian Securities Administrators requires that each category of mineral reserves and mineral resources be reported
separately. Mineral resources that are not mineral reserves do not have demonstrated economic viability. Due to the uncertainty of measured, indicated or inferred mineral resources,
these mineral resources may never be upgraded to proven and probable mineral reserves.
Mark Edwards MAIG MAusIMM (CP)., is a “qualified person” as such term is defined in National Instrument 43-101 and has reviewed and approved the technical information and data
included in this presentation.
Cautionary Note to U.S. Investors Concerning Estimates of Measured, Indicated or Inferred Resources
The information presented uses the terms “measured”, “indicated” and “inferred” mineral resources. United States investors are advised that while such terms are recognized and
required by Canadian regulations, the United States Securities and Exchange Commission does not recognize these terms. “Inferred mineral resources” have a great amount of
uncertainty as to their existence, and as to their economic and legal feasibility. It cannot be assumed that all or any part of an inferred mineral resource will ever be upgraded to a
higher category. Under Canadian rules, estimates of inferred mineral resources may not form the basis of feasibility or other economic studies. United States investors are cautioned
not to assume that all or any part of measured or indicated mineral resources will ever be converted into mineral reserves. United States investors are also cautioned not to assume
that all or any part of an inferred mineral resource exists, or is economically or legally mineable.
2
Forward Looking Information
3
Management Participants
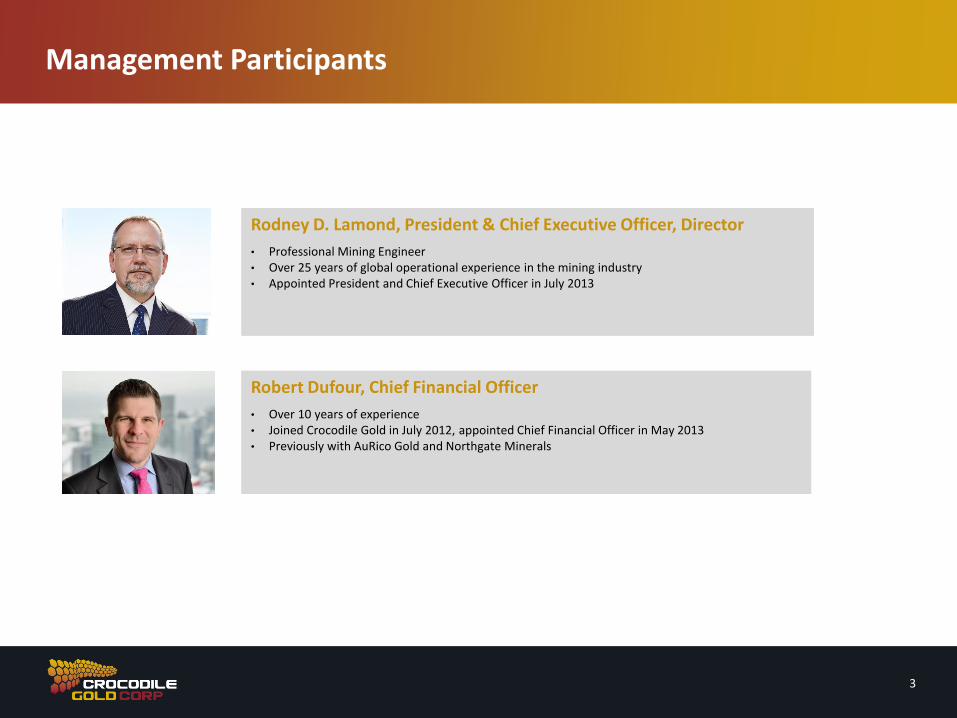
Rodney D. Lamond, President & Chief Executive Officer, Director
• Professional Mining Engineer • Over 25 years of global operational experience in the mining industry • Appointed President and Chief Executive Officer in July 2013
Robert Dufour, Chief Financial Officer
• Over 10 years of experience • Joined Crocodile Gold in July 2012, appointed Chief Financial Officer in May 2013 • Previously with AuRico Gold and Northgate Minerals
4
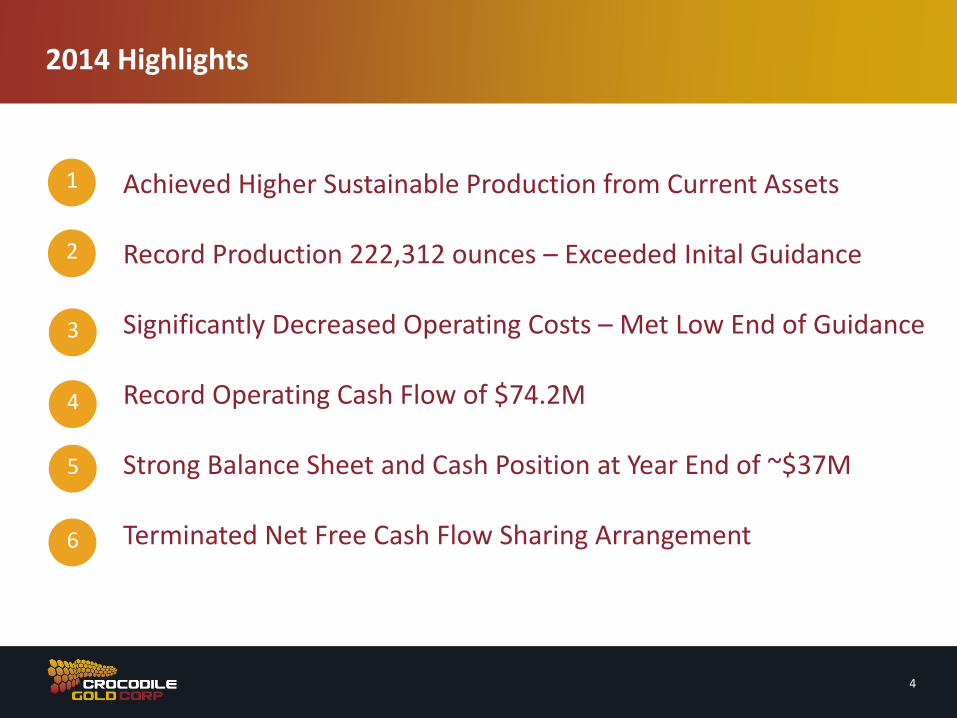
2014 Highlights
Achieved Higher Sustainable Production from Current Assets Record Production 222,312 ounces – Exceeded Inital Guidance Significantly Decreased Operating Costs – Met Low End of Guidance Record Operating Cash Flow of $74.2M Strong Balance Sheet and Cash Position at Year End of ~$37M Terminated Net Free Cash Flow Sharing Arrangement
1
2
3
4
5
6
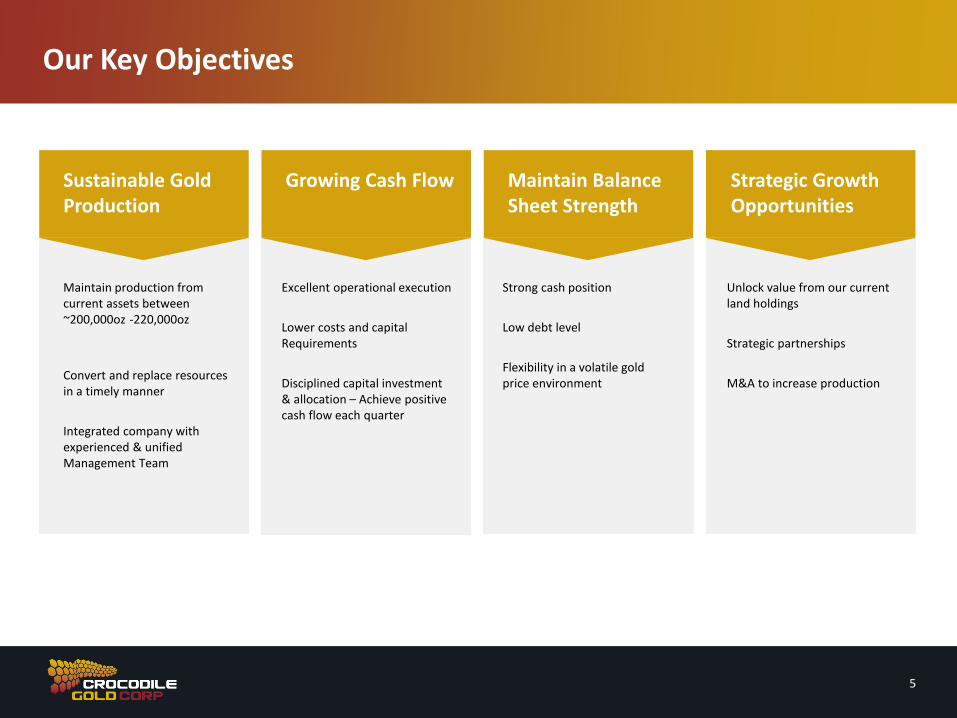
Our Key Objectives
5
Sustainable Gold Production
Maintain production from current assets between ~200,000oz -220,000oz
Convert and replace resources in a timely manner
Integrated company with experienced & unified Management Team
Growing Cash Flow
Excellent operational execution
Lower costs and capital Requirements
Disciplined capital investment & allocation – Achieve positive cash flow each quarter
Maintain Balance Sheet Strength
Strong cash position
Low debt level
Flexibility in a volatile gold price environment
Strategic Growth Opportunities
Unlock value from our current land holdings
Strategic partnerships
M&A to increase production

6
Australia - A Stable & Proven Gold Jurisdiction with Opportunity
Australia recognized as a stable and low risk jurisdiction
with access to infrastructure and skills
11% of the world’s Economic Demonstrated
Resources of gold
Future Asset Consolidation Declining gold prices have impacted many companies, there will be future asset consolidation in Australia – We are well positioned to make strategic acquisitions
Potential for high producing discoveries in the
same geographical regions where our assets are located
Cosmo Mine Union Reefs Mill
Stawell Fosterville
15M oz Since 1870
5M oz Since 1853 39M oz
Since 1851
7
Management Committee – A Unified Team
Rodney D. Lamond, P. Eng., President & Chief Executive Officer, Director
Mr. Lamond joined Crocodile Gold as President and Chief Executive Officer of Crocodile Gold in July 2013. Mr. Lamond is a Professional Mining Engineer with over 25 years of operational experience in the mining industry in North Amercia and Internationally.
Robert Dufour, CPA, CA, Chief Financial Officer
Mr. Dufour is a Chartered Accountant with over 10 years of finance and accounting experience. He started his career with PricewaterhouseCoopers. He later joined Northgate Minerals and was the Group Financial Controller for Northgate’s Australian subsidiaries, based out of Victoria, Australia until its acquisition by AuRico Gold.
Troy Cole, General Manager, Stawell Gold Mines
Mr. Cole joined Crocodile Gold in 2012 through the acquisition of the Stawell Gold Mines from AuRico. Mr. Cole has been Stawell Gold Mines General Manager since 2007 and has had the responsibilities of director, mine management and engineering during his tenure.
Ian Holland, General Manager, Fosterville Gold Mine
Mr. Holland joined Crocodile Gold through the acquisition of the Fosterville Gold Mine in 2012 and has been in the role of General Manager since 2007. Ian has over 17 years experience across a number of gold and base metal mining operations throughout Australia. He is a geologist by background and has a strong track record in metalliferous operations.
Jason Morin, General Manager, NT Operations
Mr. Morin joined Crocodile Gold in September 2013. He was most recently the General Manager of the Langlois Mine in Quebec for Nyrstar where he successfully guided the site from care and maintenance to full plant capacity in 6 months.
Mark Edwards, General Manager, Exploration and Business Development
Mr. Edwards has been part of the Crocodile Gold Northern Territory Project since March 2010. Mr. Edwards is a qualified geologist with approximately 16 years experience working on Gold and Industrial Mineral deposits in the Northern Territory, Queensland, Western Australia, Tasmania and Botswana.
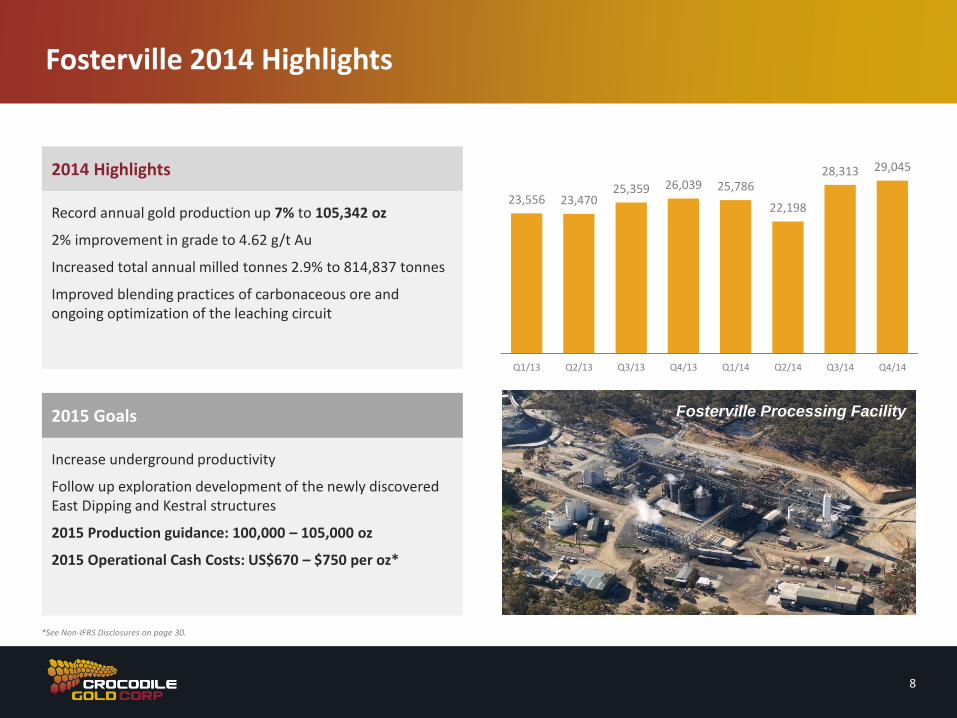
2015 Goals
Increase underground productivity
Follow up exploration development of the newly discovered East Dipping and Kestral structures
2015 Production guidance: 100,000 – 105,000 oz
2015 Operational Cash Costs: US$670 – $750 per oz*
Fosterville Processing Facility
23,556 23,470 25,359 26,039 25,786
22,198
28,313 29,045
Q1/13 Q2/13 Q3/13 Q4/13 Q1/14 Q2/14 Q3/14 Q4/14
8
2014 Highlights
Record annual gold production up 7% to 105,342 oz
2% improvement in grade to 4.62 g/t Au
Increased total annual milled tonnes 2.9% to 814,837 tonnes
Improved blending practices of carbonaceous ore and ongoing optimization of the leaching circuit
*See Non-IFRS Disclosures on page 30.
Fosterville 2014 Highlights
9
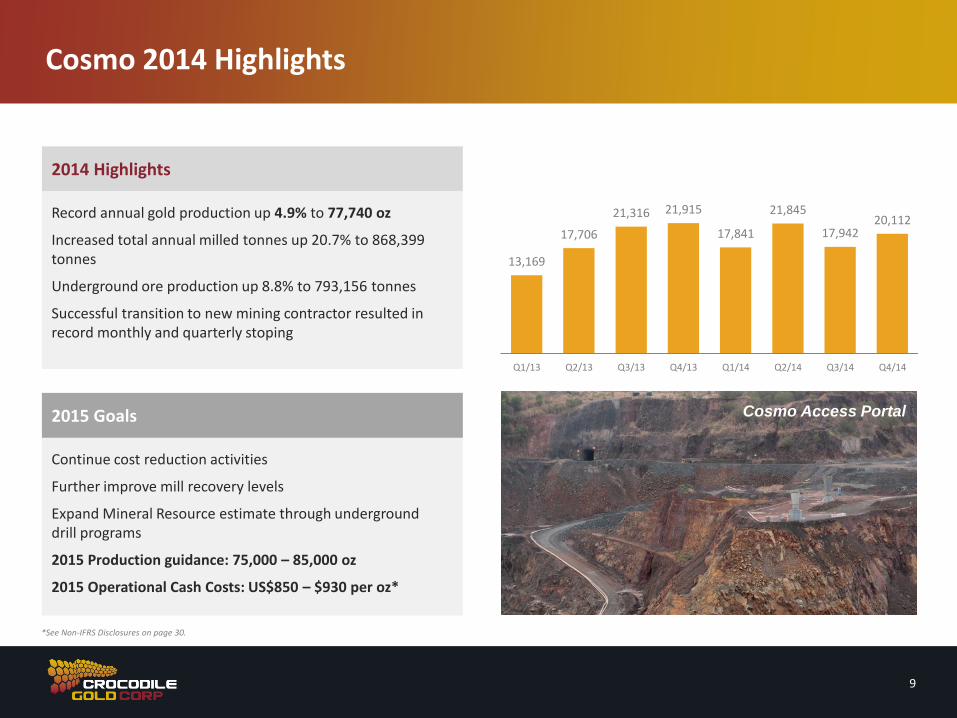
13,169
17,706
21,316 21,915
17,841
21,845
17,942 20,112
Q1/13 Q2/13 Q3/13 Q4/13 Q1/14 Q2/14 Q3/14 Q4/14
2015 Goals
Continue cost reduction activities
Further improve mill recovery levels
Expand Mineral Resource estimate through underground drill programs
2015 Production guidance: 75,000 – 85,000 oz
2015 Operational Cash Costs: US$850 – $930 per oz*
2014 Highlights
Record annual gold production up 4.9% to 77,740 oz
Increased total annual milled tonnes up 20.7% to 868,399 tonnes
Underground ore production up 8.8% to 793,156 tonnes
Successful transition to new mining contractor resulted in record monthly and quarterly stoping
Cosmo 2014 Highlights
Cosmo Access Portal
*See Non-IFRS Disclosures on page 30.
Fosterville Processing Facility
10
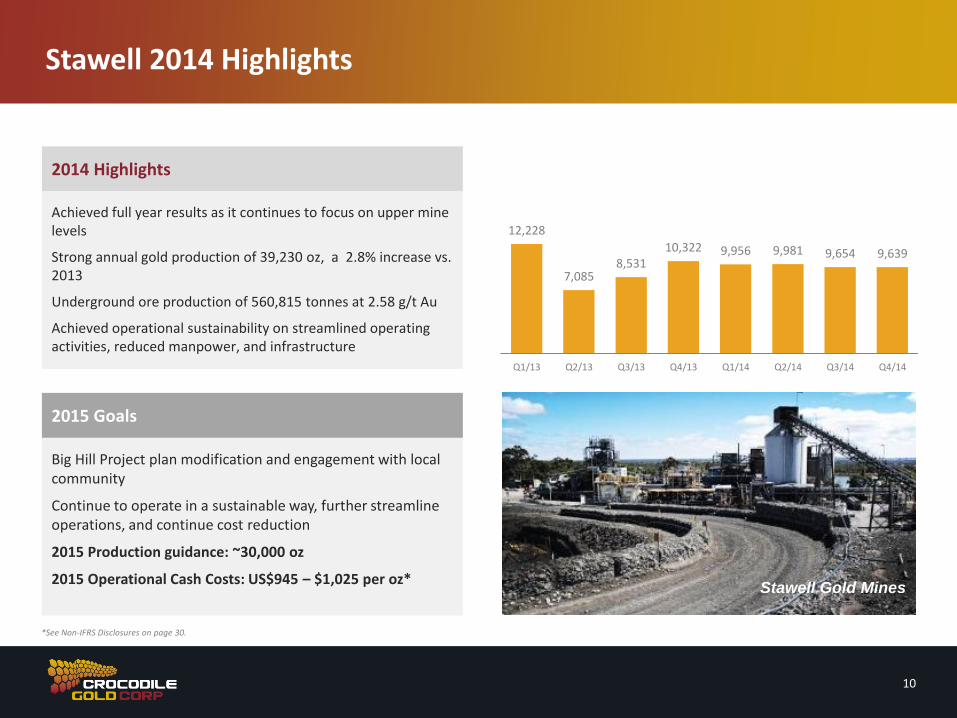
Stawell 2014 Highlights
12,228
7,085 8,531
10,322 9,956 9,981 9,654 9,639
Q1/13 Q2/13 Q3/13 Q4/13 Q1/14 Q2/14 Q3/14 Q4/14
2015 Goals
Big Hill Project plan modification and engagement with local community
Continue to operate in a sustainable way, further streamline operations, and continue cost reduction
2015 Production guidance: ~30,000 oz
2015 Operational Cash Costs: US$945 – $1,025 per oz*
2014 Highlights
Achieved full year results as it continues to focus on upper mine levels
Strong annual gold production of 39,230 oz, a 2.8% increase vs. 2013
Underground ore production of 560,815 tonnes at 2.58 g/t Au
Achieved operational sustainability on streamlined operating activities, reduced manpower, and infrastructure
Stawell Gold Mines
*See Non-IFRS Disclosures on page 30.
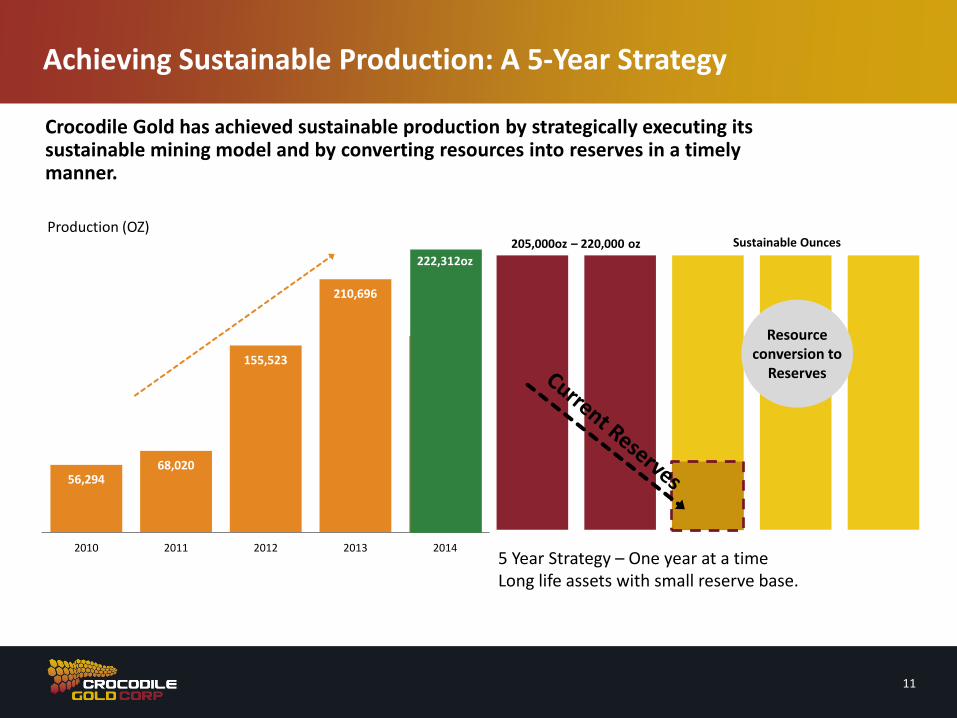
Achieving Sustainable Production: A 5-Year Strategy
56,294 68,020
155,523
210,696
2010 2011 2012 2013 20145 Year Strategy – One year at a time Long life assets with small reserve base.
205,000oz – 220,000 oz
222,312oz
Production (OZ)
11
Resource conversion to
Reserves
Crocodile Gold has achieved sustainable production by strategically executing its sustainable mining model and by converting resources into reserves in a timely manner.
Sustainable Ounces
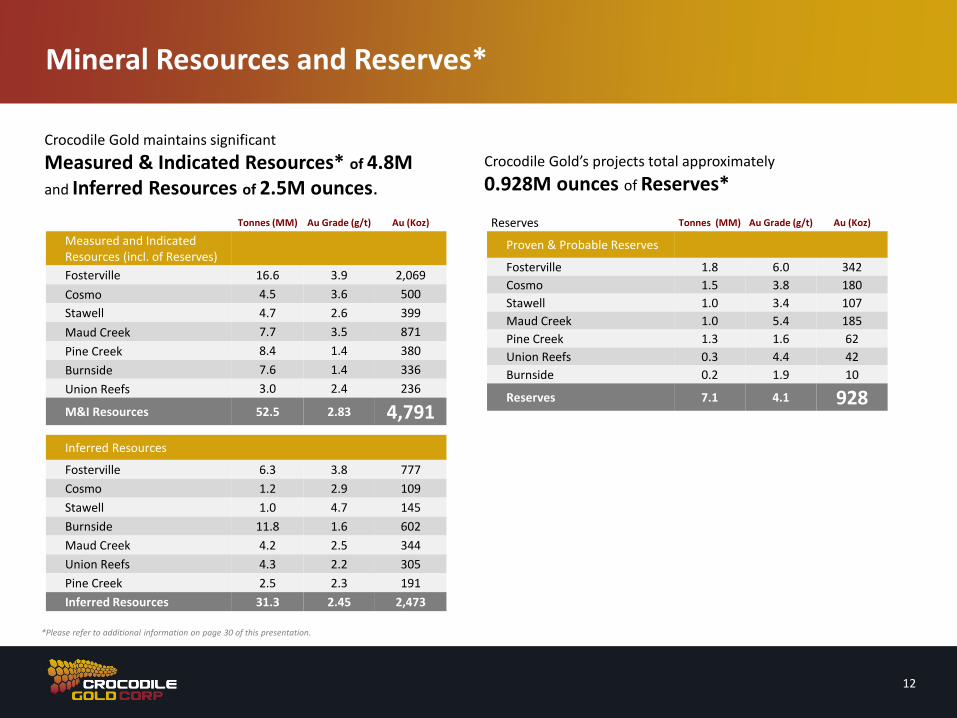
Tonnes (MM) Au Grade (g/t) Au (Koz)
Measured and Indicated Resources (incl. of Reserves)
Fosterville 16.6 3.9 2,069
Cosmo 4.5 3.6 500
Stawell 4.7 2.6 399
Maud Creek 7.7 3.5 871
Pine Creek 8.4 1.4 380
Burnside 7.6 1.4 336
Union Reefs 3.0 2.4 236
M&I Resources 52.5 2.83 4,791
Inferred Resources
Fosterville 6.3 3.8 777
Cosmo 1.2 2.9 109
Stawell 1.0 4.7 145
Burnside 11.8 1.6 602
Maud Creek 4.2 2.5 344
Union Reefs 4.3 2.2 305
Pine Creek 2.5 2.3 191
Inferred Resources 31.3 2.45 2,473
Crocodile Gold maintains significant
Measured & Indicated Resources* of 4.8M and Inferred Resources of 2.5M ounces.
12
Mineral Resources and Reserves*
*Please refer to additional information on page 30 of this presentation.
Reserves Tonnes (MM) Au Grade (g/t) Au (Koz)
Proven & Probable Reserves
Fosterville 1.8 6.0 342
Cosmo 1.5 3.8 180
Stawell 1.0 3.4 107
Maud Creek 1.0 5.4 185
Pine Creek 1.3 1.6 62
Union Reefs 0.3 4.4 42
Burnside 0.2 1.9 10
Reserves 7.1 4.1 928
Crocodile Gold’s projects total approximately
0.928M ounces of Reserves*
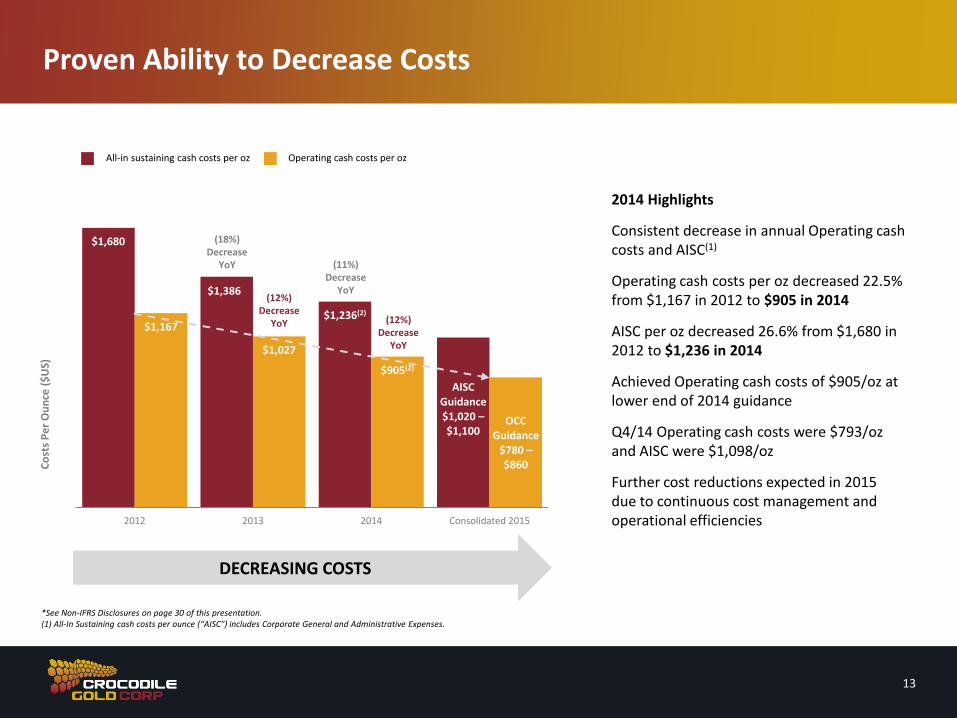
$1,680
$1,386
$1,236(2)
AISC Guidance $1,020 – $1,100
$1,167
$1,027
$905(2)
OCC Guidance
$780 – $860
2012 2013 2014 Consolidated 2015
(18%) Decrease
YoY
Proven Ability to Decrease Costs
2014 Highlights
Consistent decrease in annual Operating cash costs and AISC(1)
Operating cash costs per oz decreased 22.5% from $1,167 in 2012 to $905 in 2014
AISC per oz decreased 26.6% from $1,680 in 2012 to $1,236 in 2014
Achieved Operating cash costs of $905/oz at lower end of 2014 guidance
Q4/14 Operating cash costs were $793/oz and AISC were $1,098/oz
Further cost reductions expected in 2015 due to continuous cost management and operational efficiencies
DECREASING COSTS
(11%) Decrease
YoY (12%)
Decrease YoY (12%)
Decrease YoY
13
Co
sts
Pe
r O
un
ce (
$U
S)
All-in sustaining cash costs per oz Operating cash costs per oz
*See Non-IFRS Disclosures on page 30 of this presentation. (1) All-In Sustaining cash costs per ounce (“AISC”) includes Corporate General and Administrative Expenses.
14
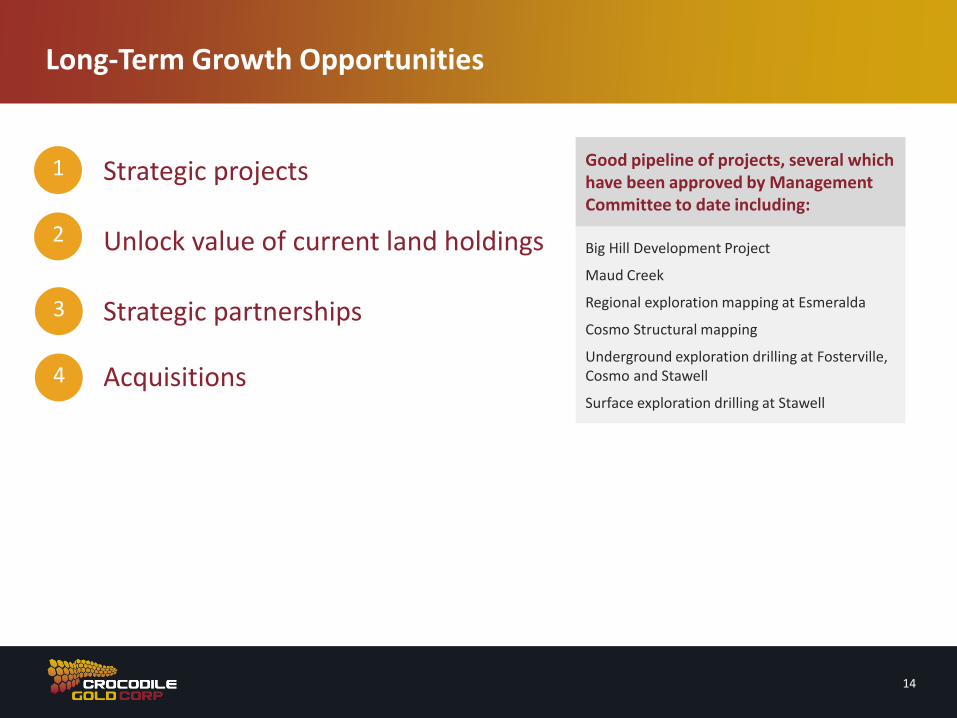
Long-Term Growth Opportunities
Strategic projects Unlock value of current land holdings Strategic partnerships
Acquisitions
1
2
3
Good pipeline of projects, several which have been approved by Management Committee to date including:
Big Hill Development Project
Maud Creek
Regional exploration mapping at Esmeralda
Cosmo Structural mapping
Underground exploration drilling at Fosterville, Cosmo and Stawell
Surface exploration drilling at Stawell
4
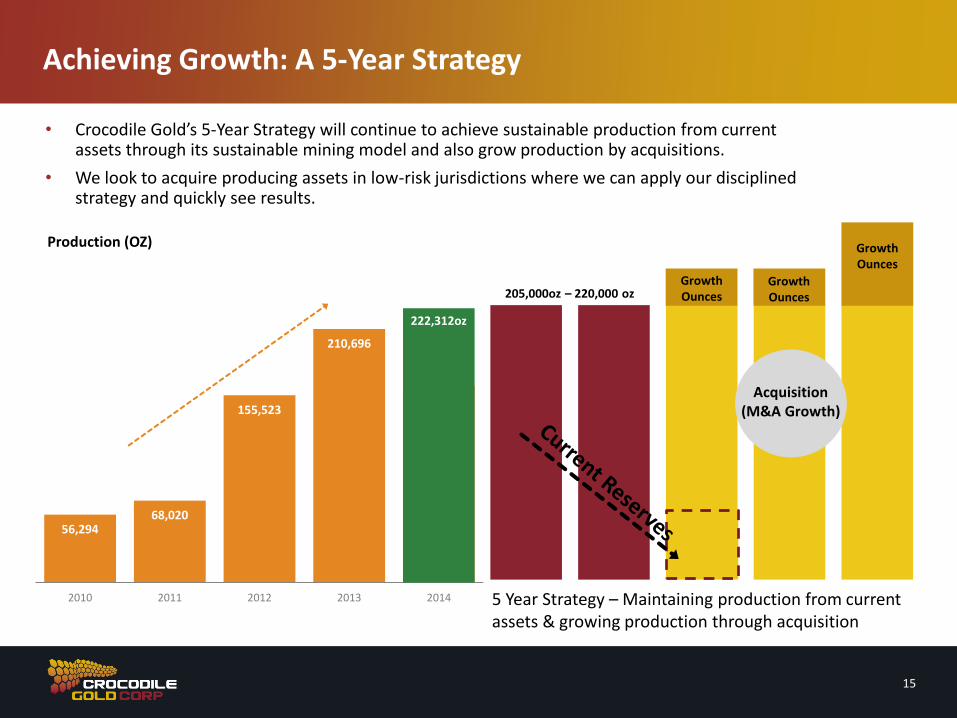
Achieving Growth: A 5-Year Strategy
56,294 68,020
155,523
210,696
2010 2011 2012 2013 2014 5 Year Strategy – Maintaining production from current assets & growing production through acquisition
205,000oz – 220,000 oz
222,312oz
Production (OZ)
15
Acquisition (M&A Growth)
• Crocodile Gold’s 5-Year Strategy will continue to achieve sustainable production from current assets through its sustainable mining model and also grow production by acquisitions.
• We look to acquire producing assets in low-risk jurisdictions where we can apply our disciplined strategy and quickly see results.
Growth Ounces
Growth Ounces
Growth Ounces
Q4 2014 Financial Review
17
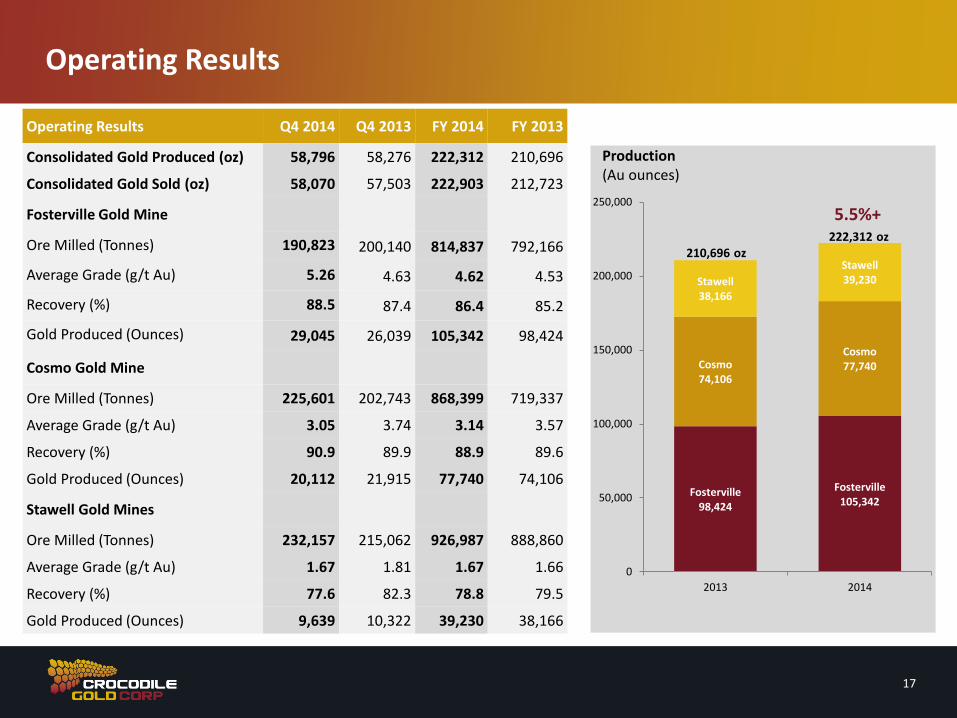
Operating Results
Operating Results Q4 2014 Q4 2013 FY 2014 FY 2013
Consolidated Gold Produced (oz) 58,796 58,276 222,312 210,696
Consolidated Gold Sold (oz) 58,070 57,503 222,903 212,723
Fosterville Gold Mine
Ore Milled (Tonnes) 190,823 200,140 814,837 792,166
Average Grade (g/t Au) 5.26 4.63 4.62 4.53
Recovery (%) 88.5 87.4 86.4 85.2
Gold Produced (Ounces) 29,045 26,039 105,342 98,424
Cosmo Gold Mine
Ore Milled (Tonnes) 225,601 202,743 868,399 719,337
Average Grade (g/t Au) 3.05 3.74 3.14 3.57
Recovery (%) 90.9 89.9 88.9 89.6
Gold Produced (Ounces) 20,112 21,915 77,740 74,106
Stawell Gold Mines
Ore Milled (Tonnes) 232,157 215,062 926,987 888,860
Average Grade (g/t Au) 1.67 1.81 1.67 1.66
Recovery (%) 77.6 82.3 78.8 79.5
Gold Produced (Ounces) 9,639 10,322 39,230 38,166
Fosterville 98,424
Fosterville 105,342
Cosmo 74,106
Cosmo 77,740
Stawell 38,166
Stawell 39,230
0
50,000
100,000
150,000
200,000
250,000
2013 2014
222,312 oz
Production (Au ounces)
5.5%+
210,696 oz
18
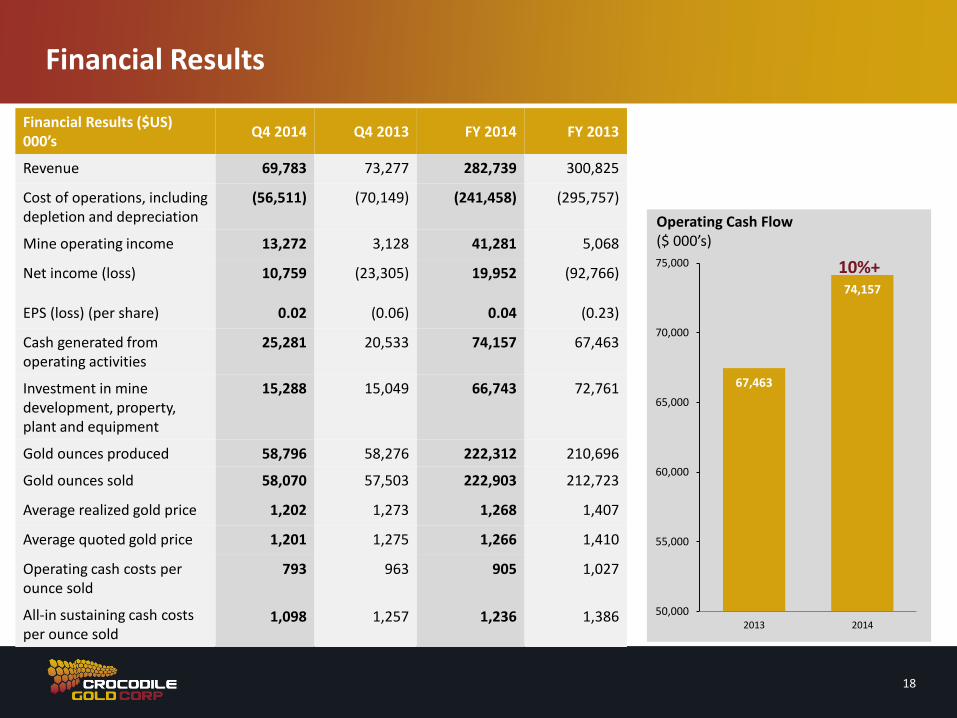
Financial Results
Financial Results ($US) 000’s
Q4 2014 Q4 2013 FY 2014 FY 2013
Revenue 69,783 73,277 282,739 300,825
Cost of operations, including depletion and depreciation
(56,511) (70,149) (241,458) (295,757)
Mine operating income 13,272 3,128 41,281 5,068
Net income (loss) 10,759 (23,305) 19,952 (92,766)
EPS (loss) (per share) 0.02 (0.06) 0.04 (0.23)
Cash generated from operating activities
25,281 20,533 74,157 67,463
Investment in mine development, property, plant and equipment
15,288 15,049 66,743 72,761
Gold ounces produced 58,796 58,276 222,312 210,696
Gold ounces sold 58,070 57,503 222,903 212,723
Average realized gold price 1,202 1,273 1,268 1,407
Average quoted gold price 1,201 1,275 1,266 1,410
Operating cash costs per ounce sold
793 963 905 1,027
All-in sustaining cash costs per ounce sold
1,098 1,257 1,236 1,386
67,463
74,157
50,000
55,000
60,000
65,000
70,000
75,000
2013 2014
Operating Cash Flow ($ 000’s)
10%+
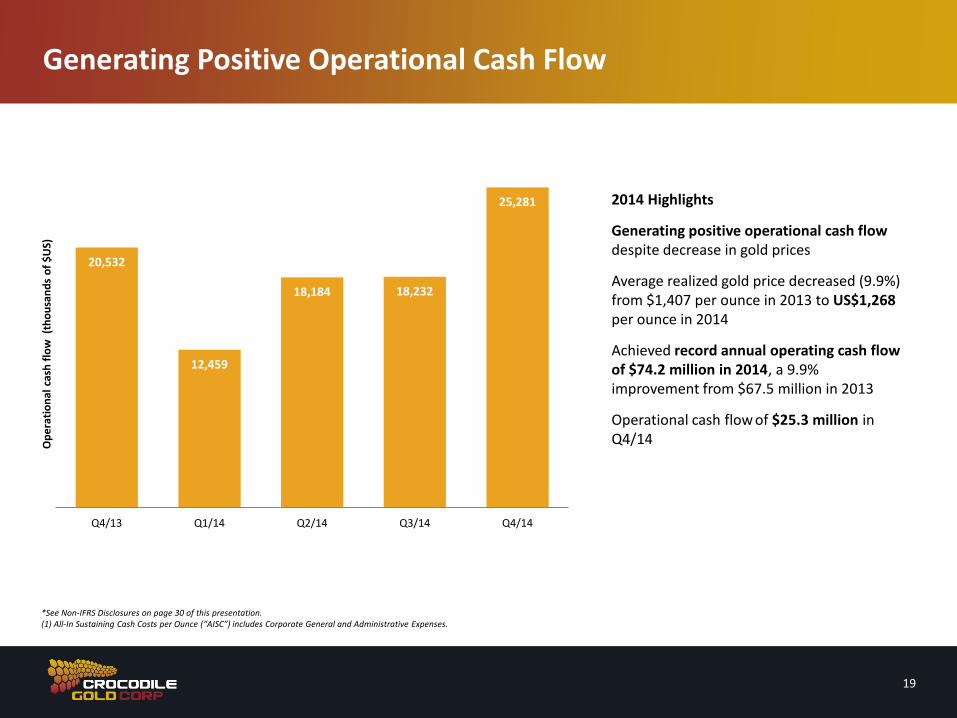
Generating Positive Operational Cash Flow
20,532
12,459
18,184 18,232
25,281
Q4/13 Q1/14 Q2/14 Q3/14 Q4/14
19
*See Non-IFRS Disclosures on page 30 of this presentation. (1) All-In Sustaining Cash Costs per Ounce (“AISC”) includes Corporate General and Administrative Expenses.
2014 Highlights
Generating positive operational cash flow despite decrease in gold prices
Average realized gold price decreased (9.9%) from $1,407 per ounce in 2013 to US$1,268 per ounce in 2014
Achieved record annual operating cash flow of $74.2 million in 2014, a 9.9% improvement from $67.5 million in 2013
Operational cash flow of $25.3 million in Q4/14
Op
era
tio
nal
cas
h f
low
(th
ou
san
ds
of
$U
S)
CAPEX
20
• Q4 2014 mine development was $13.6M, invested largely at Fosterville and Cosmo, with an additional $1.7 million invested into plant and equipment
• 2014 mine development decreased to $59.4M versus $67.6M in 2013 and focused on sustainable mine development and resource definition drilling at Fosterville and Cosmo
• The decrease in 2014 is mainly due to 32% less in capital expenditures at Cosmo, compared to the prior year, when Cosmo was ramping up operations
• Total growth capital for the year was $3.1M
Cash and Debt Positions
21
Unaudited Cash Position and Working Capital as at December 31, 2014
Cash Position: US$37.1M cash and gold bullion
Working Capital: US$12.6M
Debt—Convertible Debenture
Fulfilled debt position requirements in cash prior to due date
Successfully completed a private placement in Q1/14 to raise money and pay out a credit facility with Credit Suisse
Convertible debentures of C$34.5M due April 30, 2018, with an 8% coupon and C$0.25 conversion price. Under the agreement, interest payments may be settled in cash or in shares. A total of three interest payments have been made to date on the debentures, all on time, all settled in cash
Total Debt to LTM EBITDA was 0.41x as at December 31, 2014
2015 Production and Cash Cost Guidance
22
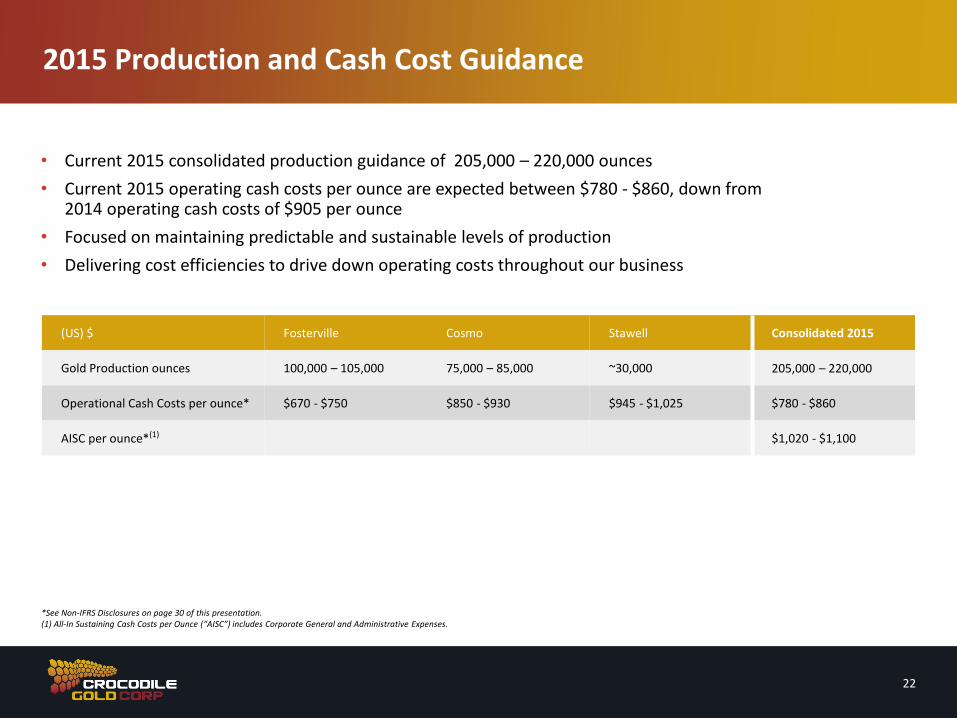
(US) $ Fosterville Cosmo Stawell Consolidated 2015
Gold Production ounces 100,000 – 105,000 75,000 – 85,000 ~30,000 205,000 – 220,000
Operational Cash Costs per ounce* $670 - $750 $850 - $930 $945 - $1,025 $780 - $860
AISC per ounce*(1) $1,020 - $1,100
• Current 2015 consolidated production guidance of 205,000 – 220,000 ounces
• Current 2015 operating cash costs per ounce are expected between $780 - $860, down from 2014 operating cash costs of $905 per ounce
• Focused on maintaining predictable and sustainable levels of production
• Delivering cost efficiencies to drive down operating costs throughout our business
*See Non-IFRS Disclosures on page 30 of this presentation. (1) All-In Sustaining Cash Costs per Ounce (“AISC”) includes Corporate General and Administrative Expenses.

Q&A
Appendix

25
Crocodile Gold Today
Capital Structure & Financial Details
Basic: 476.0 Million
Options: 22.69 Million
Fully Diluted: (includes 138M shares for full conversion of convertible debentures)*
636.7 Million
Market Capitalization: (As of March 13, 2015)
$100 Million
52 Week Trading Range $0.13 – $0.35
*Excludes OTM warrants with a strike of $2.25
SUSTAINABLE MID-TIER GOLD PRODUCER WITH A STRATEGY FOR LONG-TERM GROWTH
Top 20 gold producers listed on the TSX with gold production of 222,312oz in 2014
4.8Moz of M&I
Large resource base with strong track record of converting resources to production and replacing depleting resources
2.5Moz Inferred
$37M (US) cash and gold bullion and generating positive cash flow at December 31, 2014
TSX:CRK Listed on the Toronto stock exchange
Crocodile Gold is a strong mid-tier gold producer. We have three operating mines and significant land holdings in high producing jurisdictions in Australia.
3 Gold Mines
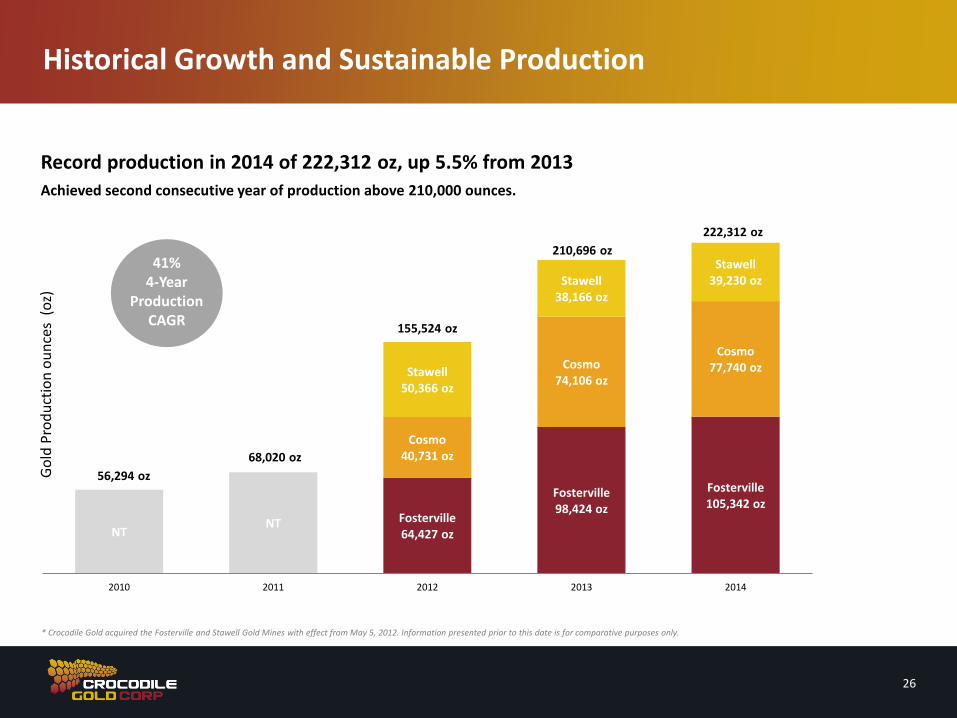
Fosterville 64,427 oz
Fosterville 98,424 oz
Fosterville 105,342 oz
NT NT
Cosmo 40,731 oz
Cosmo 74,106 oz
Cosmo 77,740 oz Stawell
50,366 oz
Stawell 38,166 oz
Stawell 39,230 oz
2010 2011 2012 2013 2014
155,524 oz
210,696 oz
222,312 oz
56,294 oz
41% 4-Year
Production CAGR
Historical Growth and Sustainable Production
68,020 oz
Go
ld P
rod
uct
ion
ou
nce
s (
oz)
26
* Crocodile Gold acquired the Fosterville and Stawell Gold Mines with effect from May 5, 2012. Information presented prior to this date is for comparative purposes only.
Record production in 2014 of 222,312 oz, up 5.5% from 2013
Achieved second consecutive year of production above 210,000 ounces.
Free Cash Flow Agreement Completed
27
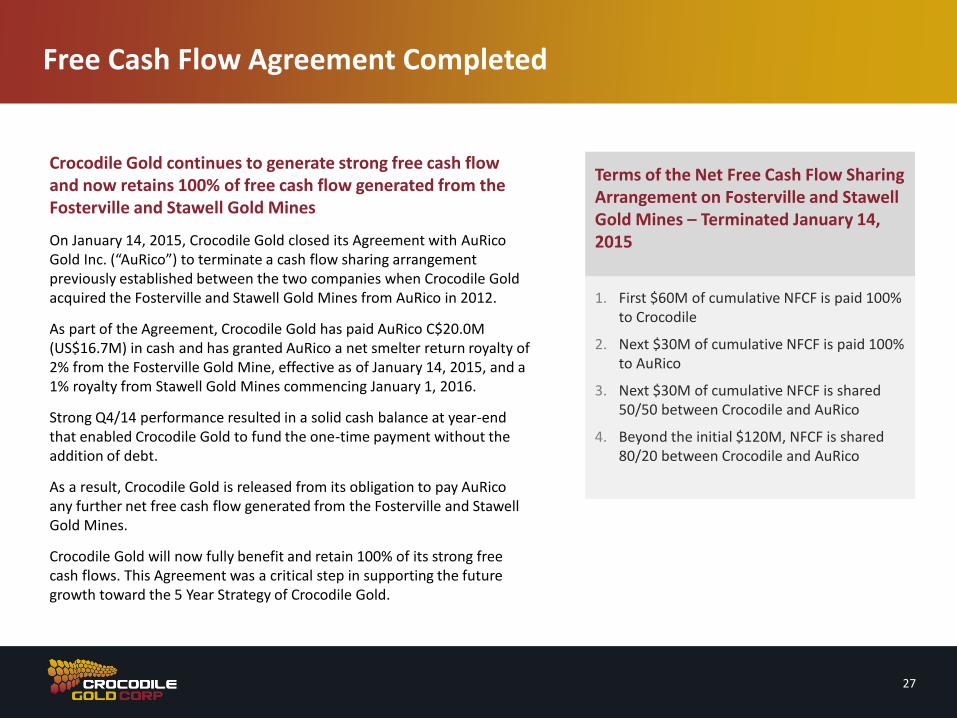
Crocodile Gold continues to generate strong free cash flow and now retains 100% of free cash flow generated from the Fosterville and Stawell Gold Mines
On January 14, 2015, Crocodile Gold closed its Agreement with AuRico Gold Inc. (“AuRico”) to terminate a cash flow sharing arrangement previously established between the two companies when Crocodile Gold acquired the Fosterville and Stawell Gold Mines from AuRico in 2012.
As part of the Agreement, Crocodile Gold has paid AuRico C$20.0M (US$16.7M) in cash and has granted AuRico a net smelter return royalty of 2% from the Fosterville Gold Mine, effective as of January 14, 2015, and a 1% royalty from Stawell Gold Mines commencing January 1, 2016.
Strong Q4/14 performance resulted in a solid cash balance at year-end that enabled Crocodile Gold to fund the one-time payment without the addition of debt.
As a result, Crocodile Gold is released from its obligation to pay AuRico any further net free cash flow generated from the Fosterville and Stawell Gold Mines.
Crocodile Gold will now fully benefit and retain 100% of its strong free cash flows. This Agreement was a critical step in supporting the future growth toward the 5 Year Strategy of Crocodile Gold.
Terms of the Net Free Cash Flow Sharing Arrangement on Fosterville and Stawell Gold Mines – Terminated January 14, 2015
1. First $60M of cumulative NFCF is paid 100% to Crocodile
2. Next $30M of cumulative NFCF is paid 100% to AuRico
3. Next $30M of cumulative NFCF is shared 50/50 between Crocodile and AuRico
4. Beyond the initial $120M, NFCF is shared 80/20 between Crocodile and AuRico
Strategic Projects
28
Crocodile Gold continues to look for opportunities to invest in attractive projects in low-risk jurisdictions.
Significant land holdings in the Northern Territory and also in the State of Victoria
2,061km2 in Northern Territory and 2,154km2 in Victoria
JDS Silver: Silvertip Project, Northern British Columbia
In early 2014, the company identified JDS Silver as a strategic opportunity given our extensive knowledge of the project. The Company completed its due diligence process and in Q3/14 invested $5.1M for a 19.9% minority interest
The Silvertip project is a highly attractive near-production, high grade silver and polymetallic resource in a stable mining jurisdiction in North America. Indicated Resources are 2.7Mt @ 341g/t Ag, 6.53% Pb and 9.12% Zn*
Capital requirements are low
The mine includes a developed access decline, full camp facilities, and an access road. JDS Silver also owns a full processing plant with power generating capabilities that is in excellent condition.
JDS Silver underscores our core mining principals as we are highly familiar with the project’s site location and geological setting.
*Please refer to cautionary language on page 30 of this presentation.
Crocodile Gold is open to entering into Joint Ventures (JVs) of non-core assets primarily in the Northern Territory and discussions are ongoing. Potential benefits include:
• Return upside in the form of earn-in rights, royalties and other similar arrangements
• Carrying cost savings
• Sharper focus on core producing assets
Crocodile Gold looks for opportunities to divest non-core assets and has completed a number of divestments in 2014 which include:
Phoenix Copper Option and Sale Agreement
• Crocodile Gold entered into a sale agreement with Phoenix Copper (“Phoenix”) for 100% of the Company’s Iron Blow and Mt. Bonnie massive sulphide deposits for a 2% royalty on precious metals and claw back rights
• The Company also entered into an option agreement which allows Phoenix to earn up to a 90% interest in the nearby Burnside and Moline gold projects and the Chessman base metals project. Terms of the agreement include Phoenix's commitment to spend AUD$4M in exploration expenditures over the next four years
Rockland Option Agreement
• Crocodile Gold entered into a uranium exploration agreement with Rockland Resources, where Rockland received 100% uranium interest on the Company’s property for a AUD$1M exploration commitment over four years. A 1.0% net smelter royalty is capped at AUD$2.5M
Non-Core Asset Divestment
29
Non-IFRS Measures
Crocodile Gold believes that investors use certain indicators to assess gold mining companies. The indicators are intended to provide additional information and should not be
considered in isolation or as a substitute for measures of performance in accordance with the International Financial Reporting Standards.
“Operational Cash Costs per Ounce” is a non-IFRS performance measure which could provide an indication of the mining and processing efficiency at the operations.
The Company calculates operating cash costs per ounce by deducting silver sales revenue as a by-product from operating expenses per the consolidated statement of operations,
then dividing by the gold ounces sold during the applicable period. Operating expenses include mine site operating costs such as mining, processing and administration as well as
royalties, however excludes depletion and depreciation, share-based payments and rehabilitation costs. There are variations in the method of computation of “operational cash
costs per ounce” as determined by the Company compared with other mining companies. For more detail on the operational cash costs per ounce determination for Crocodile Gold,
please visit www.sedar.com or www.crocgold.com and review the latest Annual Financial Statements issued on March 19, 2014.
“All-In Sustaining Costs per Ounce of Gold (“AISC”)” Effective December 31, 2013, the Company has adopted an all-in sustaining cost (“AISC”) performance measure that
reflects all of the expenditures that are required to produce an ounce of gold from current operations. While there is no standardized meaning of the measure across the industry,
the Company’s definition conforms to the AISC definition as set out by the World Gold Council in its guidance dated June 27, 2013. The World Gold Council is a non-regulatory,
non-profit organization established in 1987 whose members include global senior mining companies. The Company believes that this measure will be useful to external users in
assessing operating performance and the ability to generate free cash flow from current operations. The Company defines AISC as the sum of operating cash costs (per above),
sustaining capital (capital required to maintain current operations at existing levels), capital lease repayments, corporate general and administrative expenses, in-mine exploration
expenses and rehabilitation accretion and amortization related to current operations. AISC excludes capital expenditures for significant improvements at existing operations deemed
to be expansionary in nature, exploration and evaluation related to growth projects, rehabilitation accretion and amortization not related to current operations, financing costs, debt
repayments, share-based compensation not related to operations, and taxes.
Additional Information
Notes for Page 12: For information regarding mineral resource and reserve estimates, including parameters used to generate the estimates and depletion, please see the technical
reports titled: NI43-101 TECHNICAL REPORT FOSTERVILLE GOLD MINE, VICTORIA, AUSTRALIA PREPARED FOR CROCODILE GOLD CORP dated May 27, 2014 and;
NI43-101 TECHNICAL REPORT – BIG HILL ENHANCED DEVELOPMENT PROJECT AT STAWELL GOLD MINE MINERAL RESOURCES & RESERVES PREPARED FOR
CROCODILE GOLD CORP dated June 6, 2014. For the Northern Territory Mineral Reserve Estimates please refer to the technical reports titled: REPORT ON THE MINERAL
RESOURCES & MINERAL RESERVES OF THE COSMO DEEPS GOLD PROJECT dated May 27, 2014;
REPORT ON THE MINERAL RESOURCES & MINERAL RESERVES OF THE UNION REEFS GOLD PROJECT dated December 31, 2012; REPORT ON THE MINERAL
RESOURCES & MINERAL RESERVES OF THE PINE CREEK GOLD PROJECT dated December 31, 2012; REPORT ON THE MINERAL RESOURCES & MINERAL RESERVES
OF THE MAUD CREEK GOLD PROJECT dated December 31, 2012 and;
REPORT ON THE MINERAL RESOURCES & MINERAL RESERVES OF THE BURNSIDE GOLD AND BASE METAL PROJECT dated December 12, 2013.
Mineral resources that are not mineral reserves do not have demonstrated economic viability.
Notes for Page 28: For information regarding mineral resource and reserve estimates, including parameters used to generate the estimates and depletion, please see the technical
reports titled: NI43-101 TECHNICAL REPORT AND RESOURCE UPDATE 2011, ON THE SILVERTIP PROPERTY, NORTHERN BRITISH COLUMBIA, CANADA FOR
SILVERCORP METALS INC. dated June 15, 2011.
30
Non-IFRS and Additional Information
Laura Lepore Director, Investor Relations e: [email protected] t: 416-847-1847