fourth quarter | 2019 investor presentation
TRANSCRIPT
1
Fourth Quarter | 2019
Investor Presentation
2
Statements in this presentation regarding management’s future expectations, beliefs, intentions, goals, strategies, plans or prospects, including, withoutlimitation, the statements relating to Mimecast’s future financial performance on both a GAAP and non-GAAP basis, may constitute forward-looking statementswithin the meaning of the Private Securities Litigation Reform Act of 1995 and other federal securities laws. All statements, other than statements of historicalfact, are statements that could be deemed forward-looking statements, including statements containing the words "predicts," "plan," "expects," "anticipates,""believes," "goal," "target," "estimate," "potential," "may," "might," "could," "see," "seek," "forecast," and similar words. Mimecast intends all such forward-looking statements to be covered by the safe harbor provisions for forward-looking statements contained in Section 21E of the Exchange Act and the PrivateSecurities Litigation Reform Act of 1995. Such forward-looking statements involve known and unknown risks, uncertainties and other factors including thoserisks, uncertainties and factors detailed in Mimecast’s filings with the Securities and Exchange Commission. As a result of such risks, uncertainties and factors,Mimecast’s actual results may differ materially from any future results, performance or achievements discussed in or implied by the forward-looking statementscontained herein. Mimecast is providing the information in this presentation as of this date and assumes no obligations to update the information included inthis press release or revise any forward-looking statements, whether as a result of new information, future events or otherwise.
In addition to GAAP financials, this presentation includes certain non-GAAP financial measures. These non-GAAP financial measures are in addition to, and not asubstitute for or superior to, measures of financial performance prepared in accordance with GAAP. Information regarding the non-GAAP financial measuresreferenced in this presentation, including the reconciliation to the nearest GAAP financial measures, can be found in the Appendix to this presentation. Pleaseconsider this as you review these non-GAAP financial measures.
This presentation contains statistical data that we obtained from industry publications and reports generated by third parties. Although we believe that thepublications and reports are reliable, we have not independently verified this statistical data.
The trademarks included herein are the property of the owners thereof and are used for reference purposes only. Such use should not be construed as anendorsement of the products or services of Mimecast.
This document may not be, reproduced or distributed, in whole or in part, by any means (including electronic without the prior written consent of Mimecast.
Safe Harbor for Forward-Looking Statements
3
Peter Bauer Co-Founder, Chairman and CEO
4
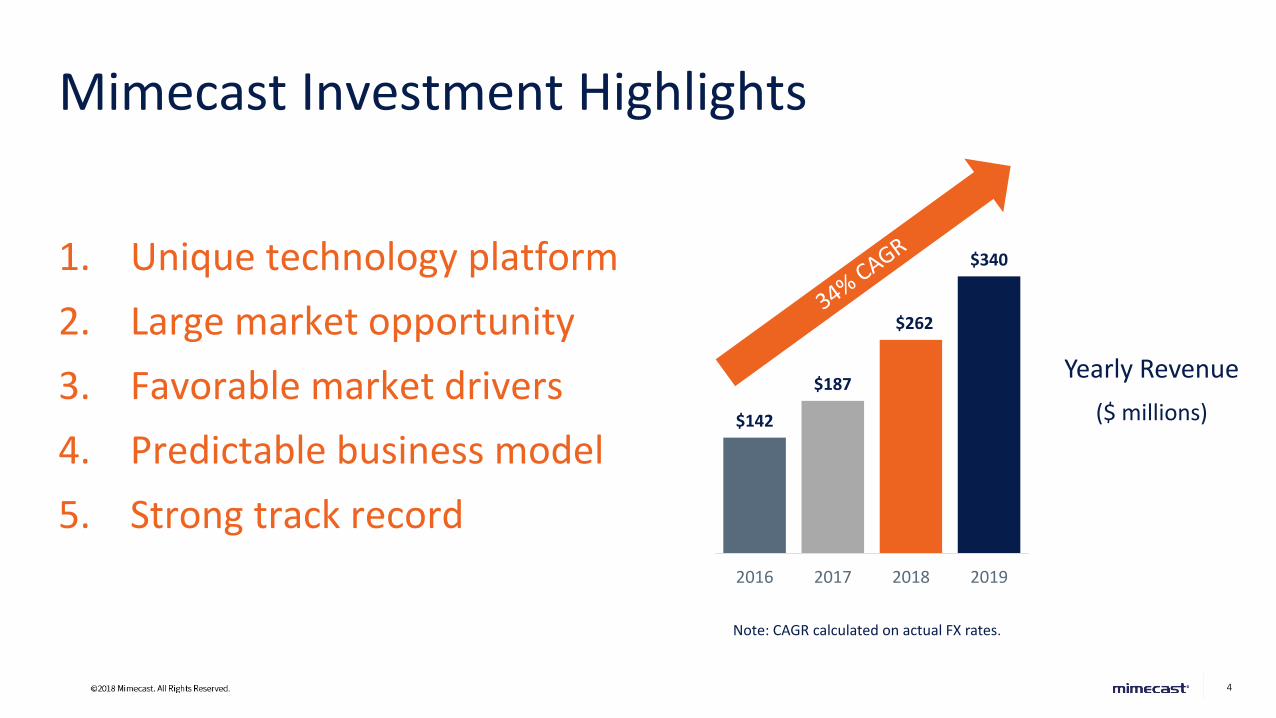
1. Unique technology platform
2. Large market opportunity
3. Favorable market drivers
4. Predictable business model
5. Strong track record
Mimecast Investment Highlights
Yearly Revenue
($ millions)$142
$187
$262
$340
2016 2017 2018 2019
Note: CAGR calculated on actual FX rates.

5
IPO November 2015
6
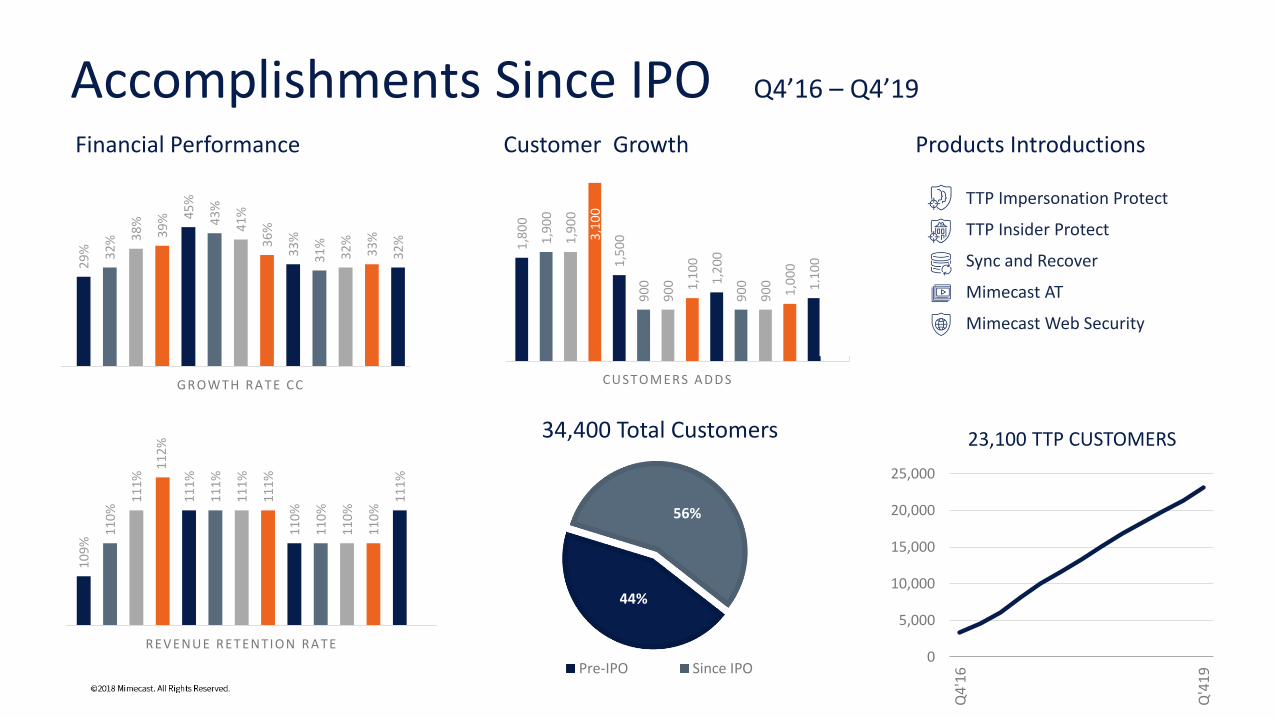
Accomplishments Since IPO Q4’16 – Q4’191
09
%
11
0%
11
1%
11
2%
11
1%
11
1%
11
1%
11
1%
11
0%
11
0%
11
0%
11
0%
11
1%
REV ENUE RETENTION RA TE
1,8
00
1,9
00
1,9
00
3,1
00
1,5
00
90
0
90
0 1,1
00
1,2
00
90
0
90
0
1,0
00
1,1
00
CUSTOMERS A D D S
44%
56%
Pre-IPO Since IPO
34,400 Total Customers
TTP Impersonation Protect
TTP Insider Protect
Sync and Recover
Mimecast AT
Mimecast Web Security
0
5,000
10,000
15,000
20,000
25,000
Q4
'16
Q1
'17
Q2
'17
Q3
'17
Q4
'17
Q1
'18
Q2
'18
Q3
'18
Q4
'18
Q1
'19
Q2
'19
Q3
'19
Q'4
19
29
% 32
% 38
%
39
% 45
%
43
%
41
%
36
%
33
%
31
%
32
%
33
%
32
%GROWTH RA TE CC
23,100 TTP CUSTOMERS
Financial Performance Customer Growth Products Introductions
77
Tech Platform
8
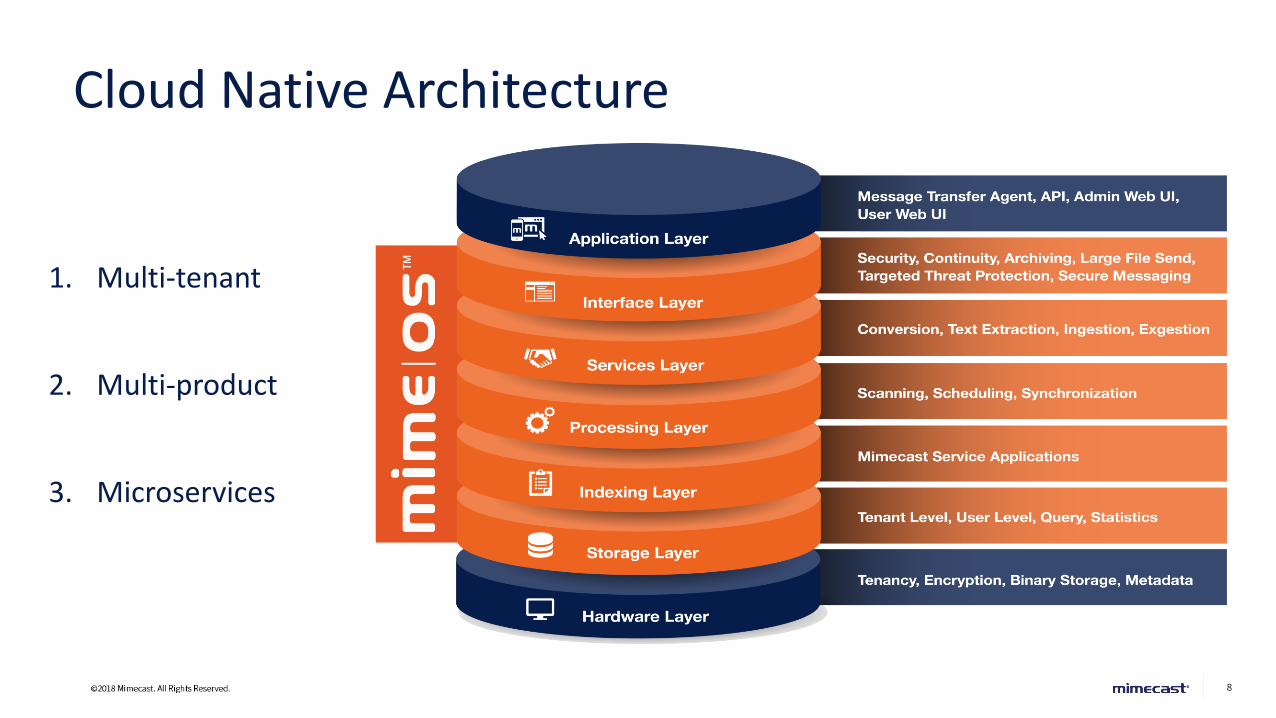
Cloud Native Architecture
1. Multi-tenant
2. Multi-product
3. Microservices
9
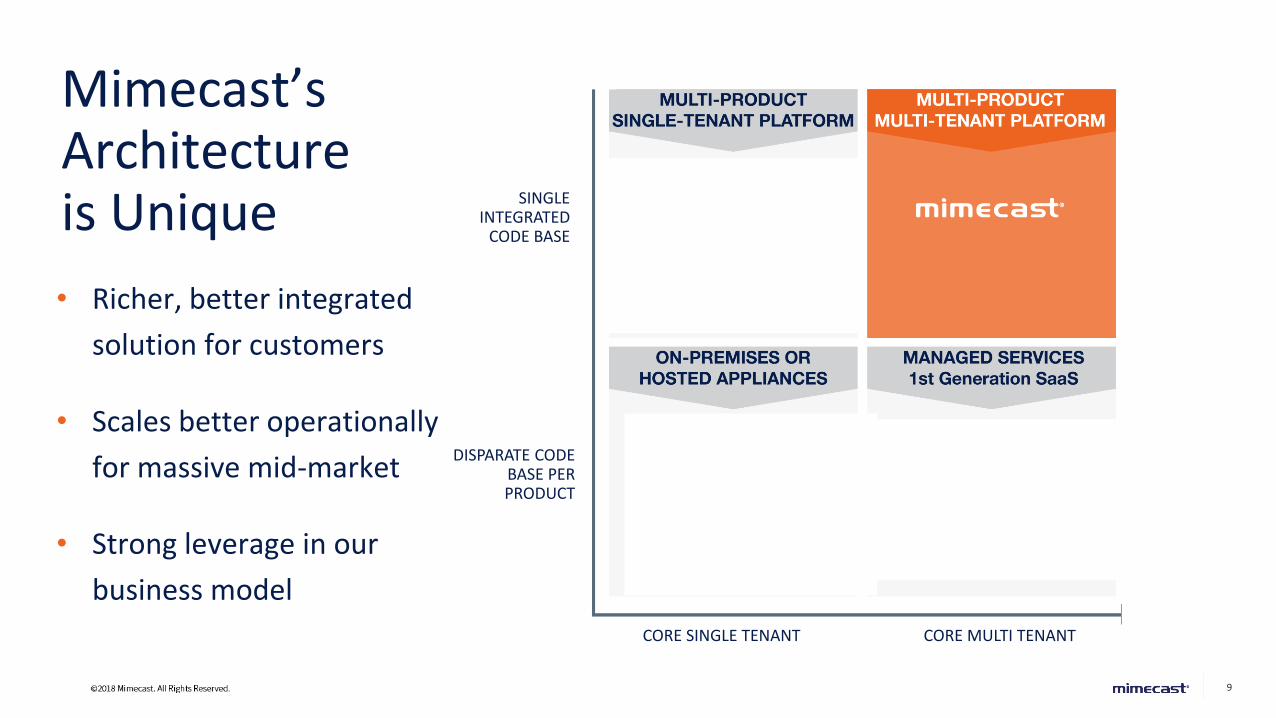
Mimecast’s Architectureis Unique SINGLE
INTEGRATED CODE BASE
DISPARATE CODE BASE PER PRODUCT
CORE SINGLE TENANT CORE MULTI TENANT
• Richer, better integrated
solution for customers
• Scales better operationally
for massive mid-market
• Strong leverage in our
business model
10
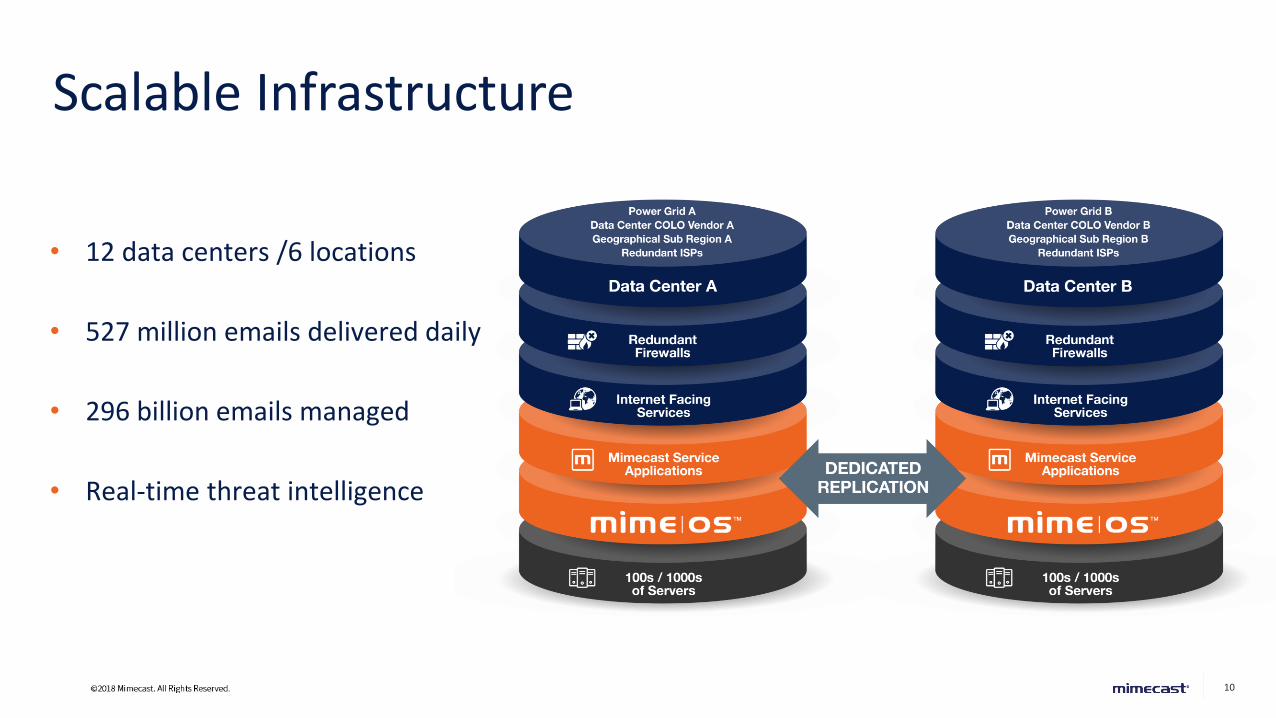
Scalable Infrastructure
Data as of December 31, 2018
• 12 data centers /6 locations
• 527 million emails delivered daily
• 296 billion emails managed
• Real-time threat intelligence
11
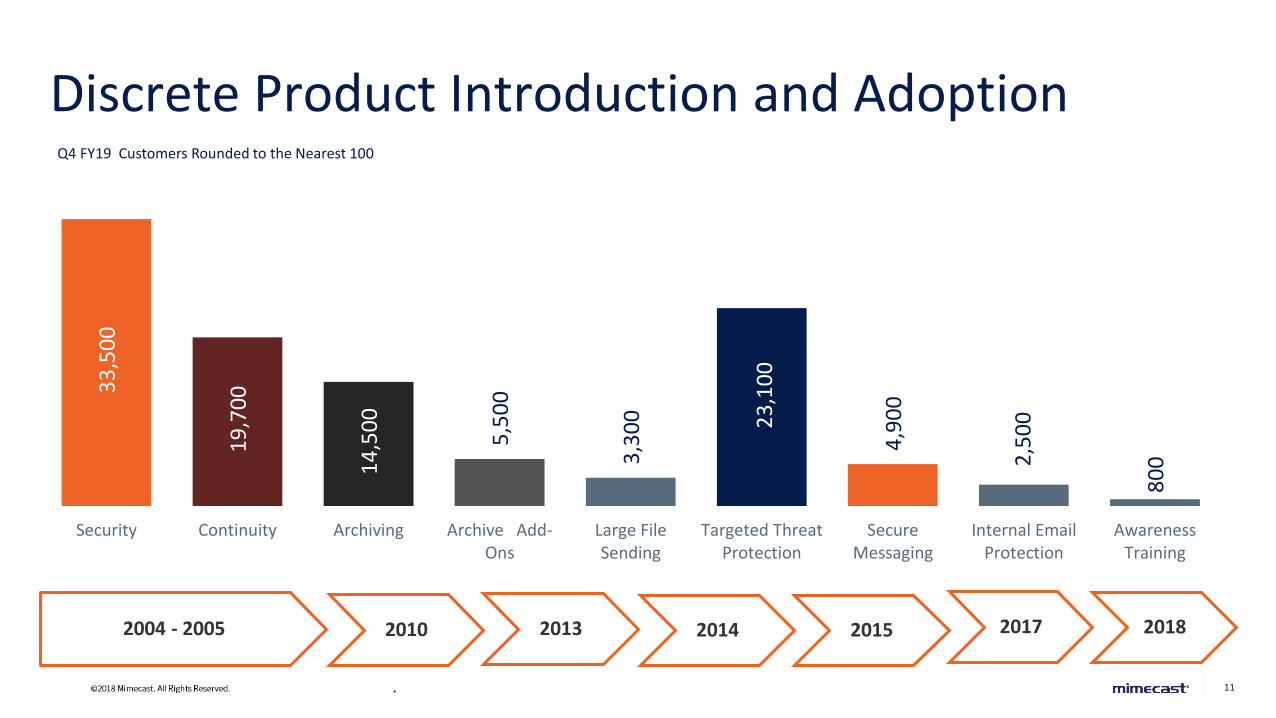
Discrete Product Introduction and Adoption3
3,5
00
19
,70
0
14
,50
0
5,5
00
3,3
00
23
,10
0
4,9
00
2,5
00
80
0
Security Continuity Archiving Archive Add-Ons
Large FileSending
Targeted ThreatProtection
SecureMessaging
Internal EmailProtection
AwarenessTraining
.
2004 - 2005 2010 2013 2014 2015
Q4 FY19 Customers Rounded to the Nearest 100
2017 2018
12
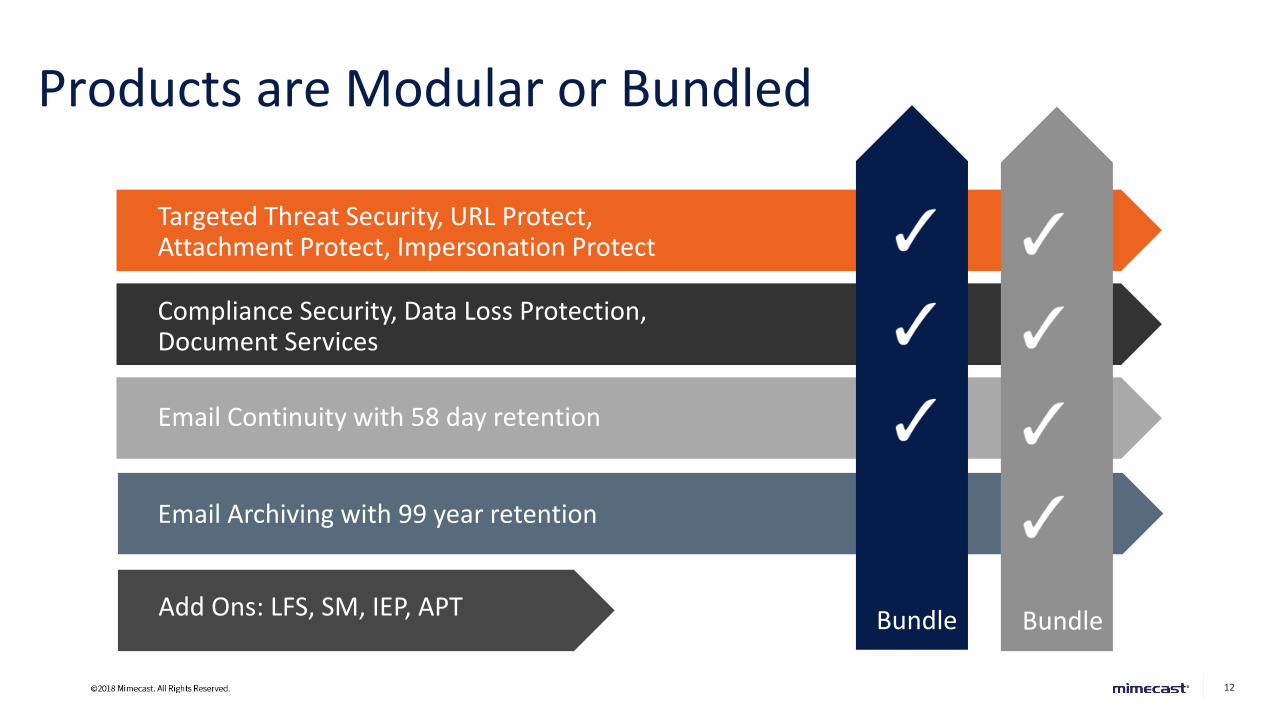
Targeted Threat Security, URL Protect,Attachment Protect, Impersonation Protect
Compliance Security, Data Loss Protection,Document Services
Email Continuity with 58 day retention
Email Archiving with 99 year retention
Products are Modular or Bundled
Add Ons: LFS, SM, IEP, APT Bundle Bundle
13
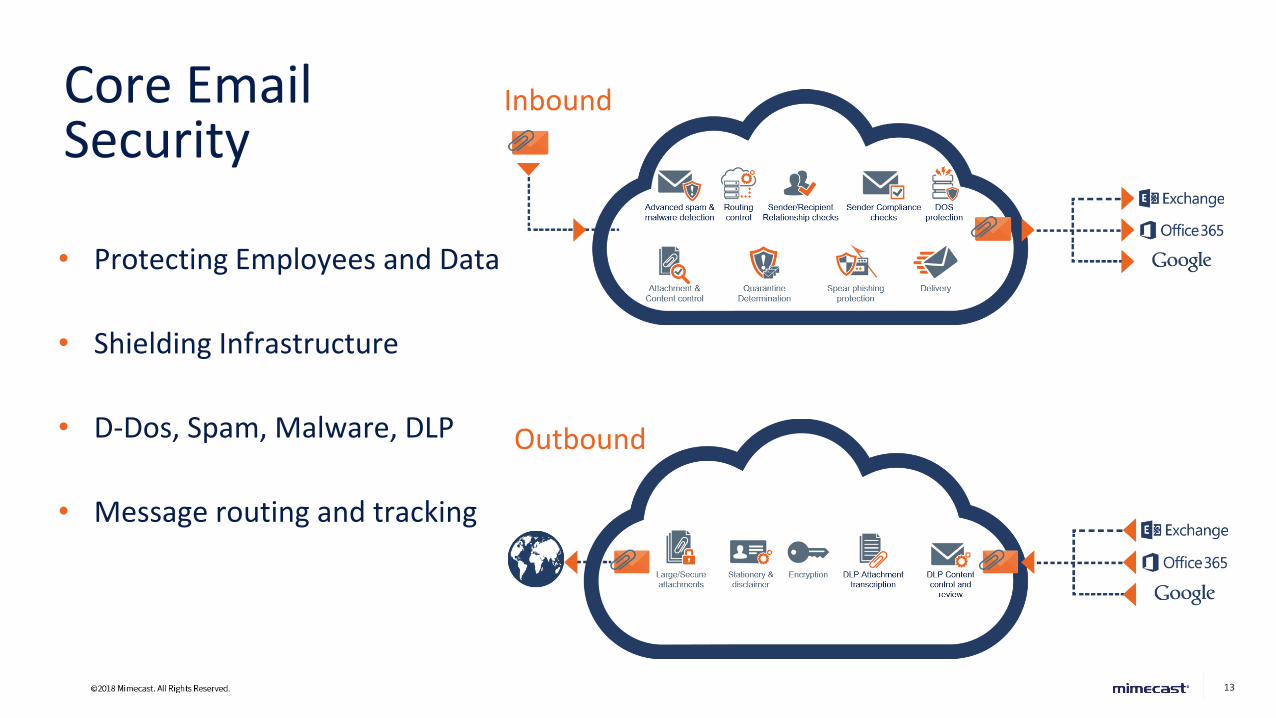
• Protecting Employees and Data
• Shielding Infrastructure
• D-Dos, Spam, Malware, DLP
• Message routing and tracking
Core Email Security
Inbound
Outbound
14
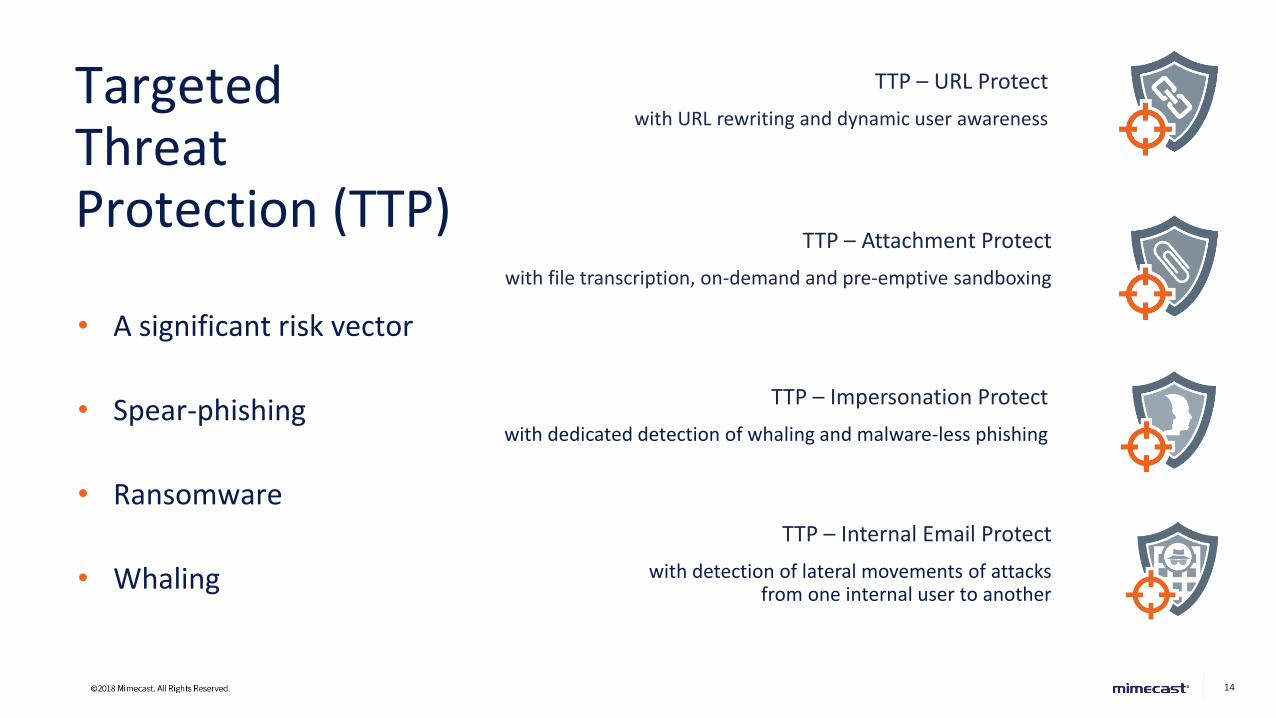
TargetedThreatProtection (TTP)
TTP – URL Protect
with URL rewriting and dynamic user awareness
TTP – Attachment Protect
with file transcription, on-demand and pre-emptive sandboxing
TTP – Impersonation Protect
with dedicated detection of whaling and malware-less phishing
TTP – Internal Email Protect
with detection of lateral movements of attacksfrom one internal user to another
• A significant risk vector
• Spear-phishing
• Ransomware
• Whaling
15
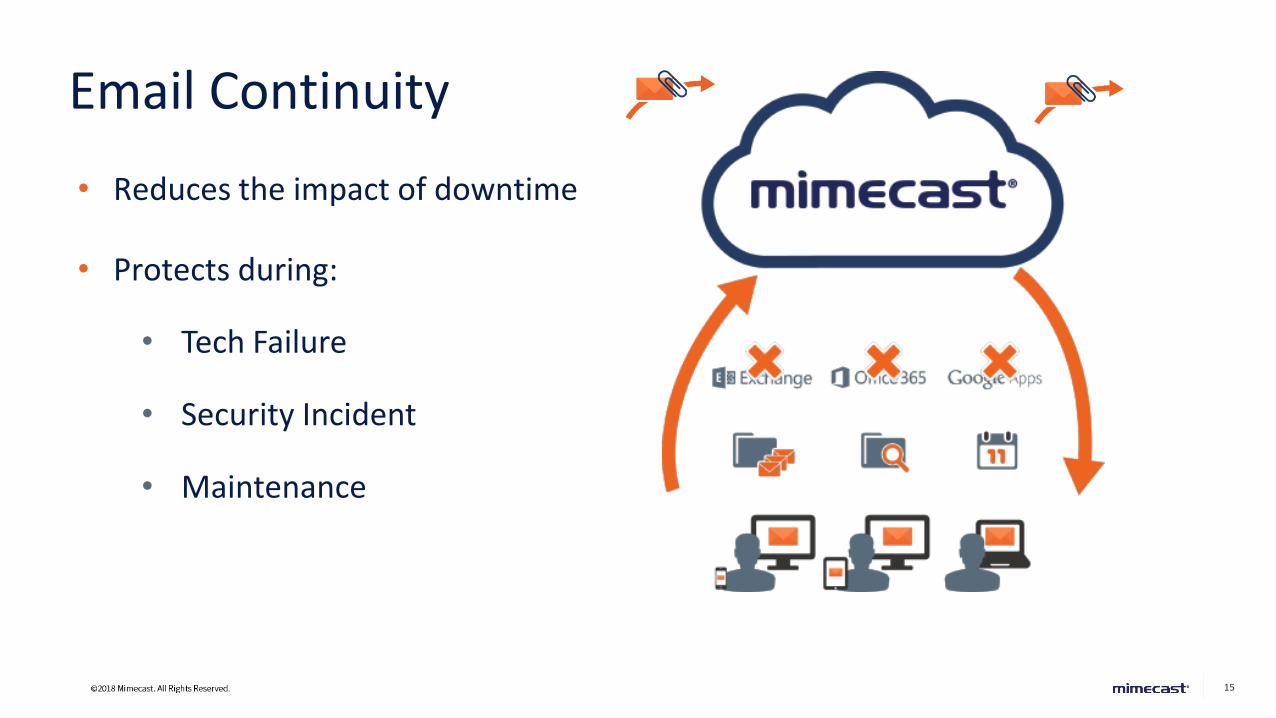
Email Continuity
• Reduces the impact of downtime
• Protects during:
• Tech Failure
• Security Incident
• Maintenance
16
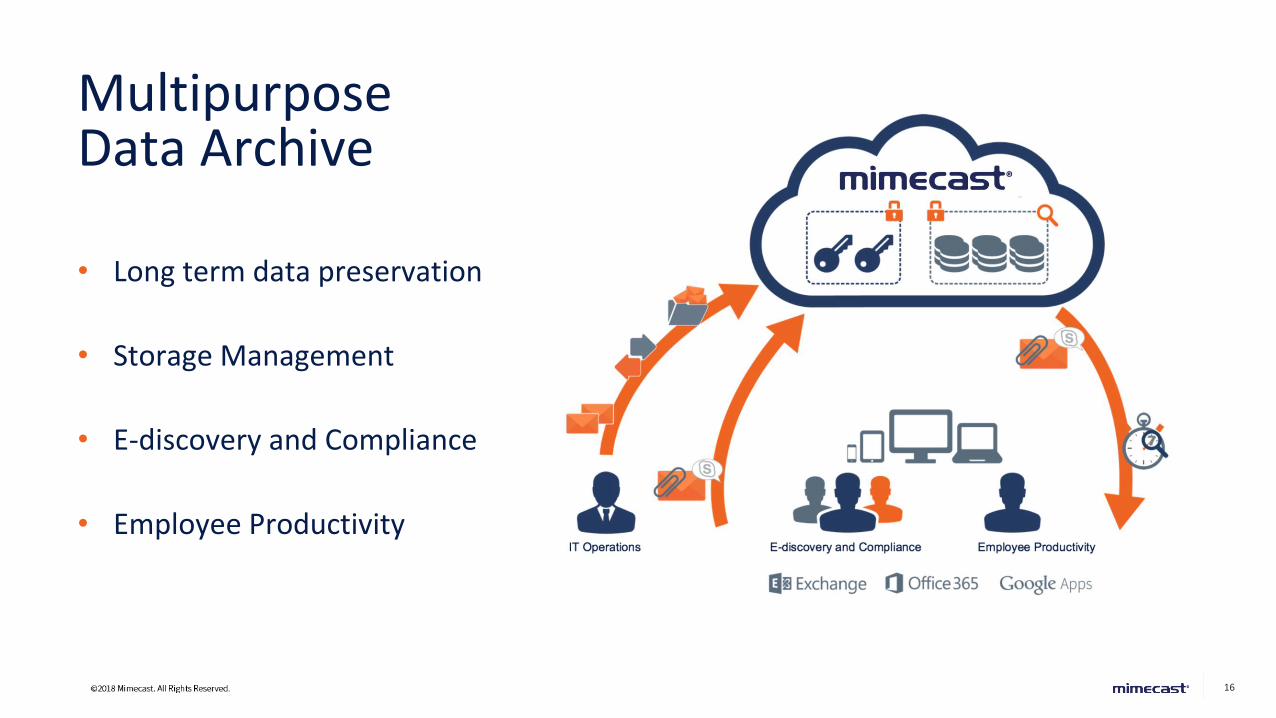
Multipurpose Data Archive
• Long term data preservation
• Storage Management
• E-discovery and Compliance
• Employee Productivity

1717
Market Drivers
18
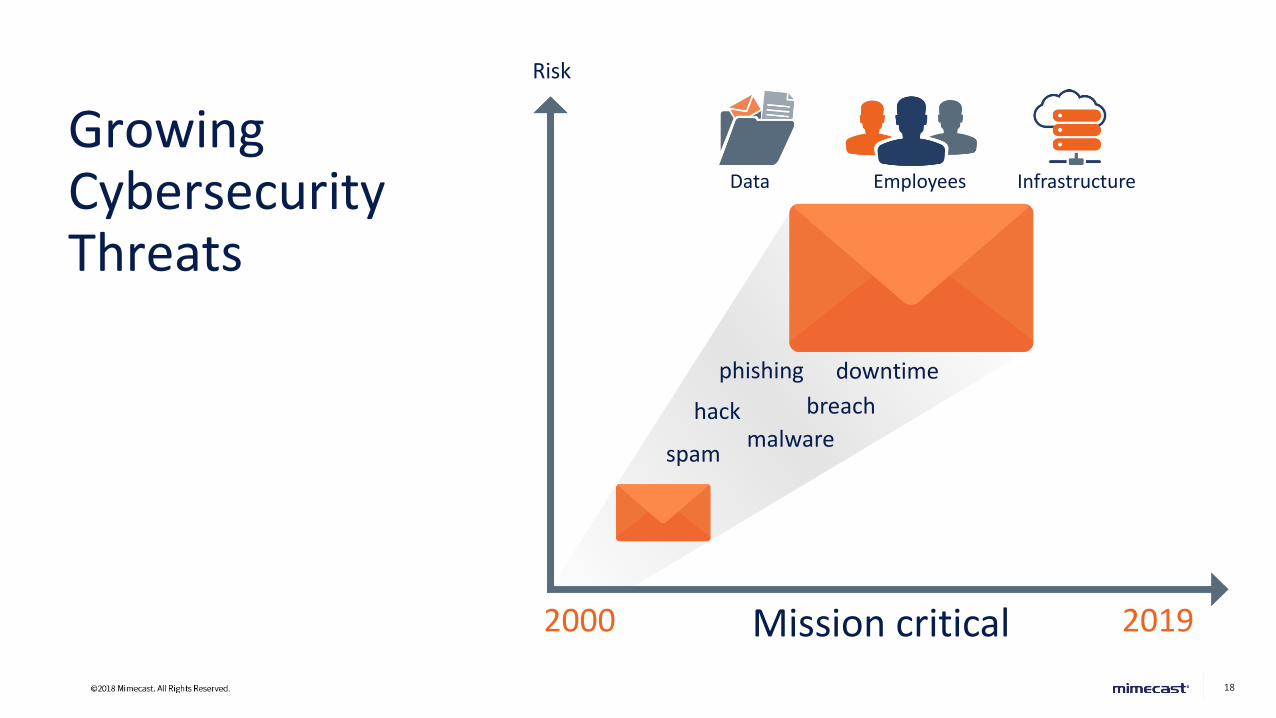
Growing Cybersecurity Threats
Risk
Mission critical 20192000
Data Employees Infrastructure
hackmalware
breach
phishing
spam
downtime
19
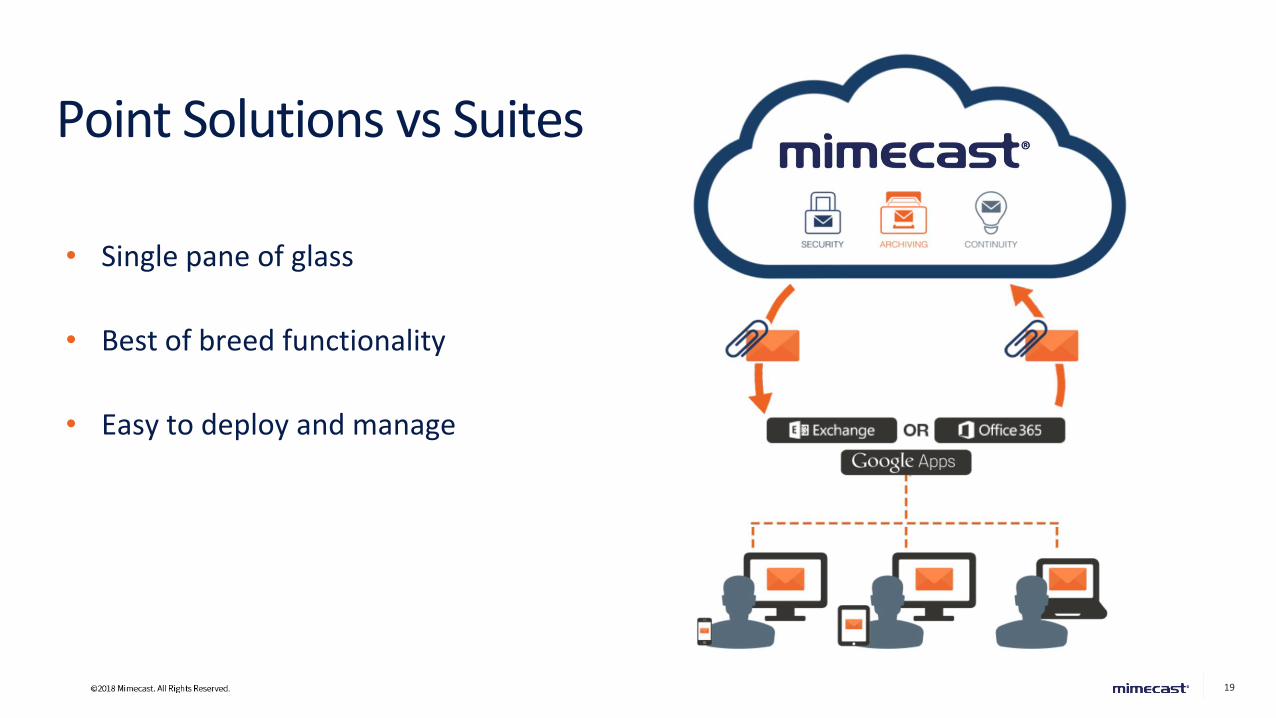
Point Solutions vs Suites
• Single pane of glass
• Best of breed functionality
• Easy to deploy and manage
20
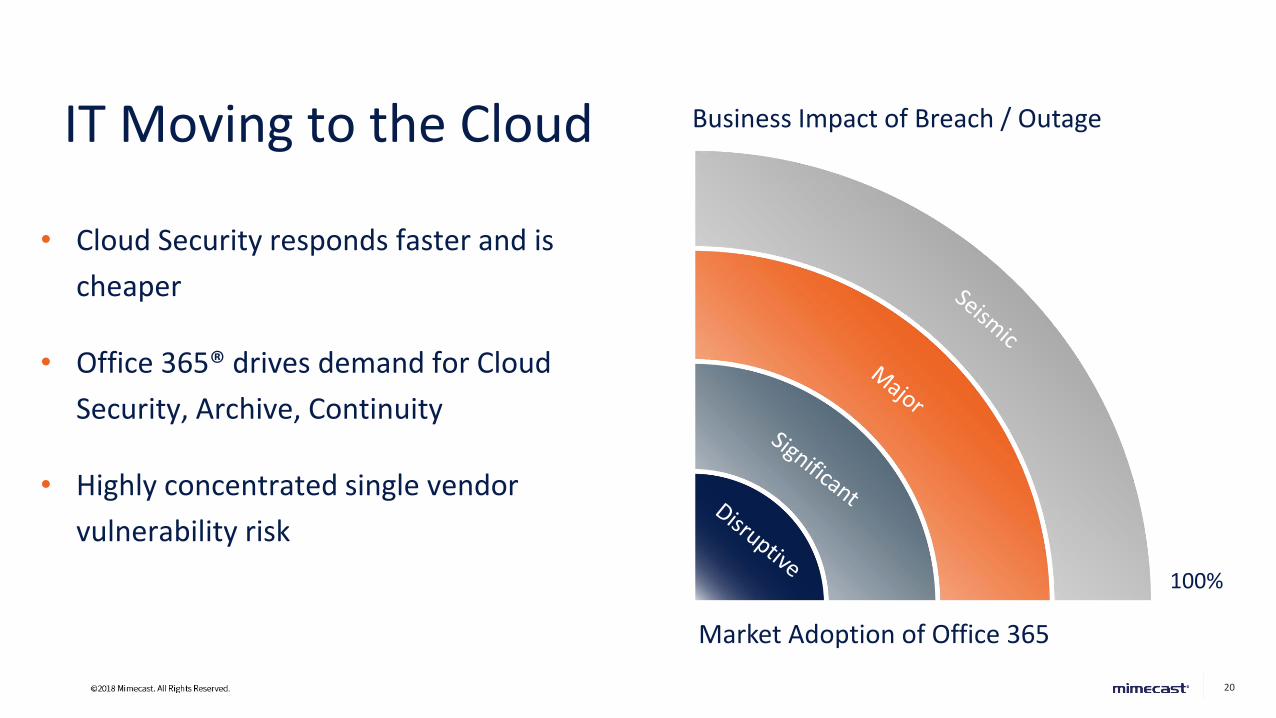
IT Moving to the Cloud2015
Market Adoption of Office 365
Business Impact of Breach / Outage
100%
• Cloud Security responds faster and is
cheaper
• Office 365® drives demand for Cloud
Security, Archive, Continuity
• Highly concentrated single vendor
vulnerability risk

2121
Large Market Opportunity
22
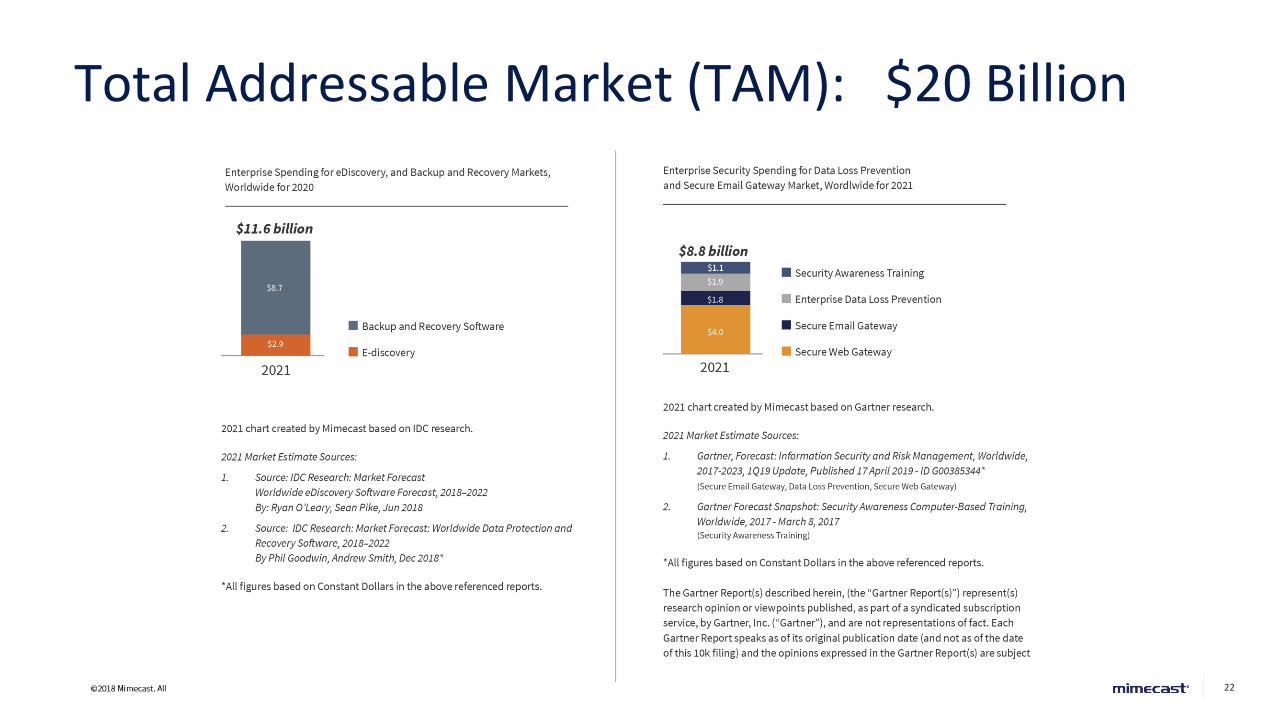
Total Addressable Market (TAM): $20 Billion
23
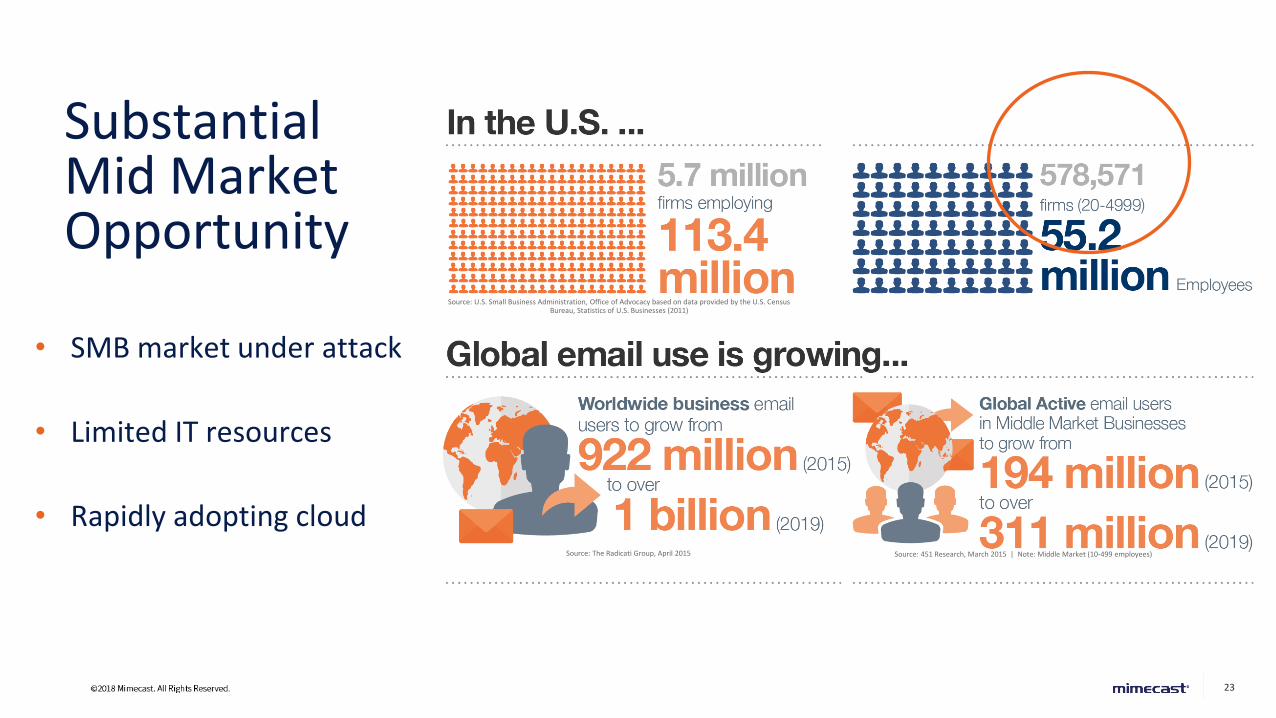
Substantial Mid Market Opportunity
Source: 451 Research, March 2015 | Note: Middle Market (10-499 employees)Source: The Radicati Group, April 2015
Source: U.S. Small Business Administration, Office of Advocacy based on data provided by the U.S. Census Bureau, Statistics of U.S. Businesses (2011)
• SMB market under attack
• Limited IT resources
• Rapidly adopting cloud
24
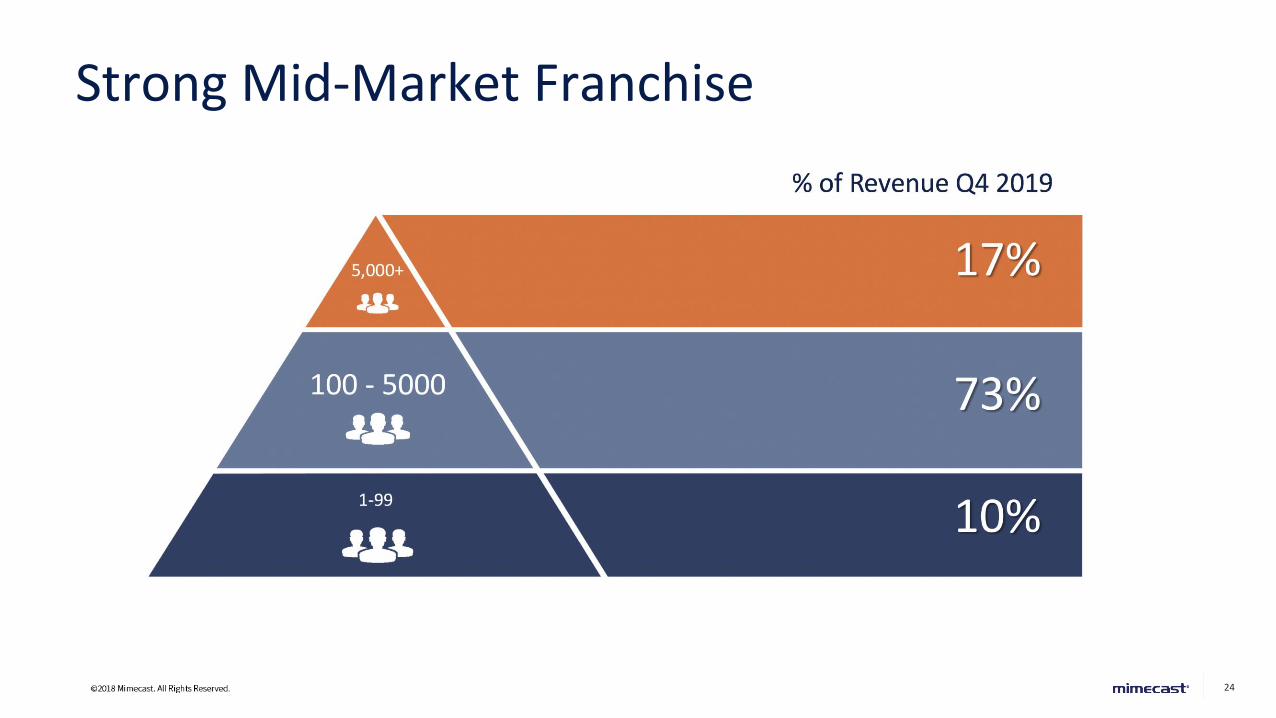
Strong Mid-Market Franchise
5,000+
100 - 5000
1-99
25
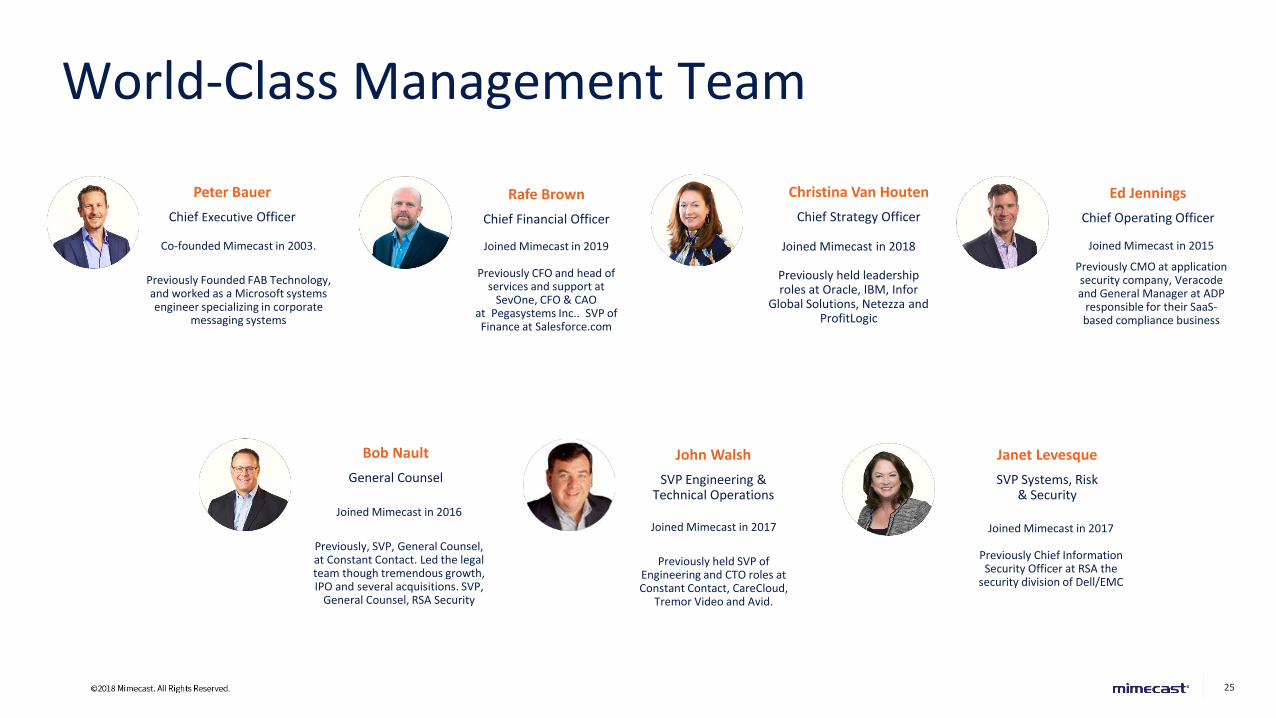
World-Class Management Team
Rafe Brown
Chief Financial Officer
Ed Jennings
Chief Operating Officer
John Walsh
SVP Engineering & Technical Operations
Joined Mimecast in 2019
Previously CFO and head of services and support at
SevOne, CFO & CAO at Pegasystems Inc.. SVP of Finance at Salesforce.com
Joined Mimecast in 2015
Previously CMO at application security company, Veracode and General Manager at ADP
responsible for their SaaS-based compliance business
Joined Mimecast in 2017
Previously held SVP of Engineering and CTO roles at Constant Contact, CareCloud,
Tremor Video and Avid.
Peter Bauer
Chief Executive Officer
Co-founded Mimecast in 2003.
Previously Founded FAB Technology, and worked as a Microsoft systems engineer specializing in corporate
messaging systems
Bob Nault
General Counsel
Joined Mimecast in 2016
Previously, SVP, General Counsel, at Constant Contact. Led the legal team though tremendous growth, IPO and several acquisitions. SVP,
General Counsel, RSA Security
Janet Levesque
SVP Systems, Risk& Security
Joined Mimecast in 2017
Previously Chief Information Security Officer at RSA the
security division of Dell/EMC
Christina Van Houten
Chief Strategy Officer
Joined Mimecast in 2018
Previously held leadership roles at Oracle, IBM, Infor
Global Solutions, Netezza and ProfitLogic
2626
Business Model
27
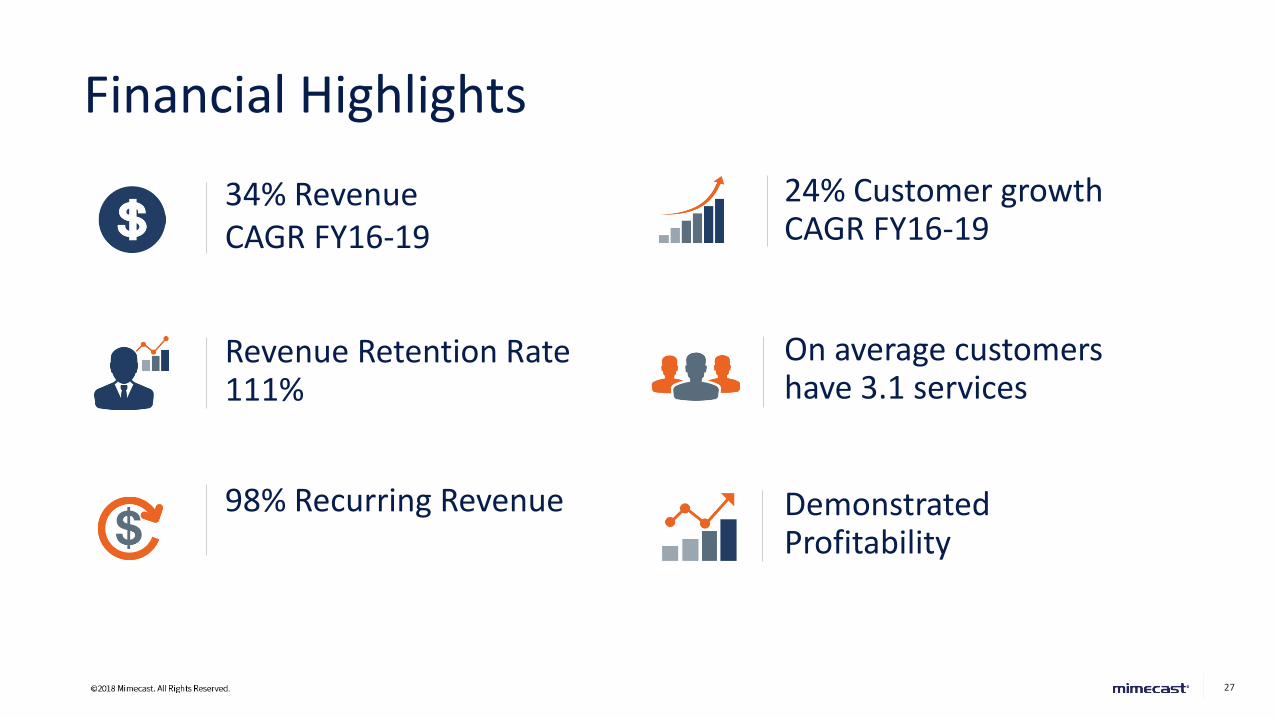
Financial Highlights
On average customers have 3.1 services
98% Recurring Revenue
Revenue Retention Rate 111%
Demonstrated Profitability
34% RevenueCAGR FY16-19
24% Customer growthCAGR FY16-19
28
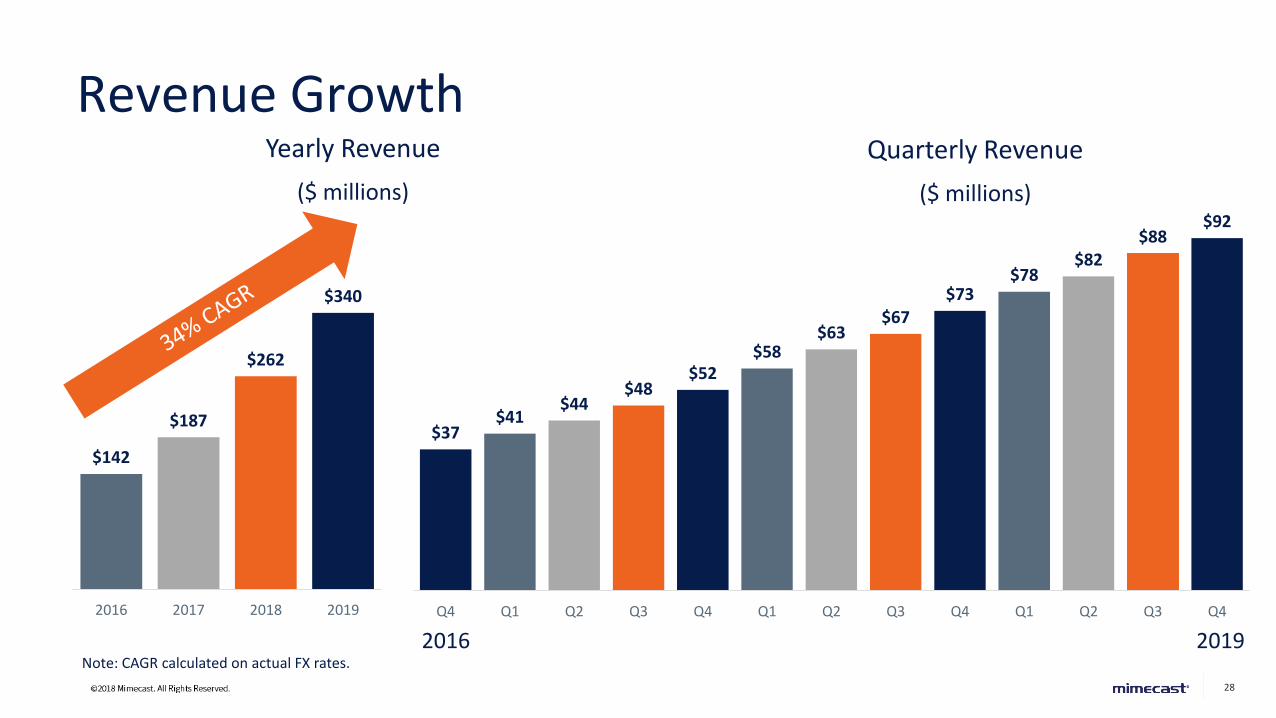
Revenue GrowthYearly Revenue
($ millions)
Quarterly Revenue
($ millions)
$142
$187
$262
$340
2016 2017 2018 2019
$37$41
$44$48
$52$58
$63 $67
$73 $78
$82 $88
$92
Q4 Q1 Q2 Q3 Q4 Q1 Q2 Q3 Q4 Q1 Q2 Q3 Q4
2016 2019Note: CAGR calculated on actual FX rates.
29
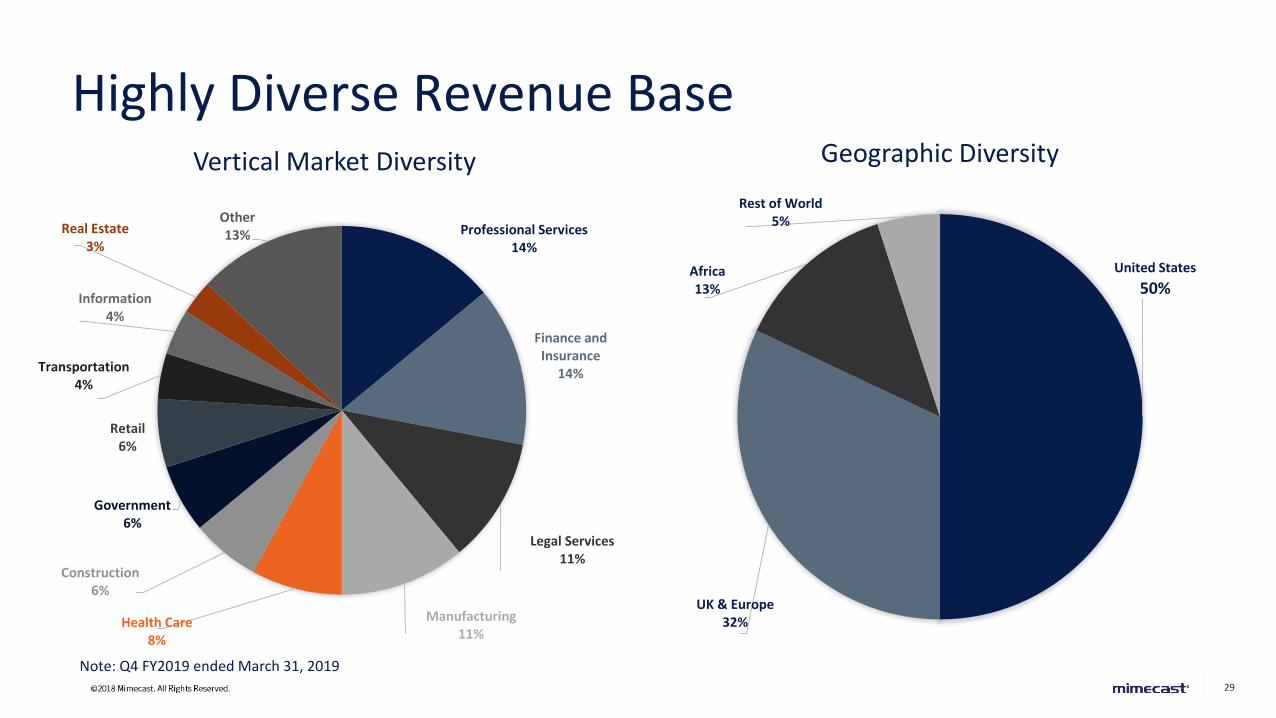
Highly Diverse Revenue BaseGeographic DiversityVertical Market Diversity
Note: Q4 FY2019 ended March 31, 2019
Professional Services14%
Finance and Insurance
14%
Legal Services11%
Manufacturing11%
Health Care8%
Construction6%
Government6%
Retail6%
Transportation 4%
Information4%
Real Estate 3%
Other13%
United States
50%
UK & Europe32%
Africa13%
Rest of World5%
30
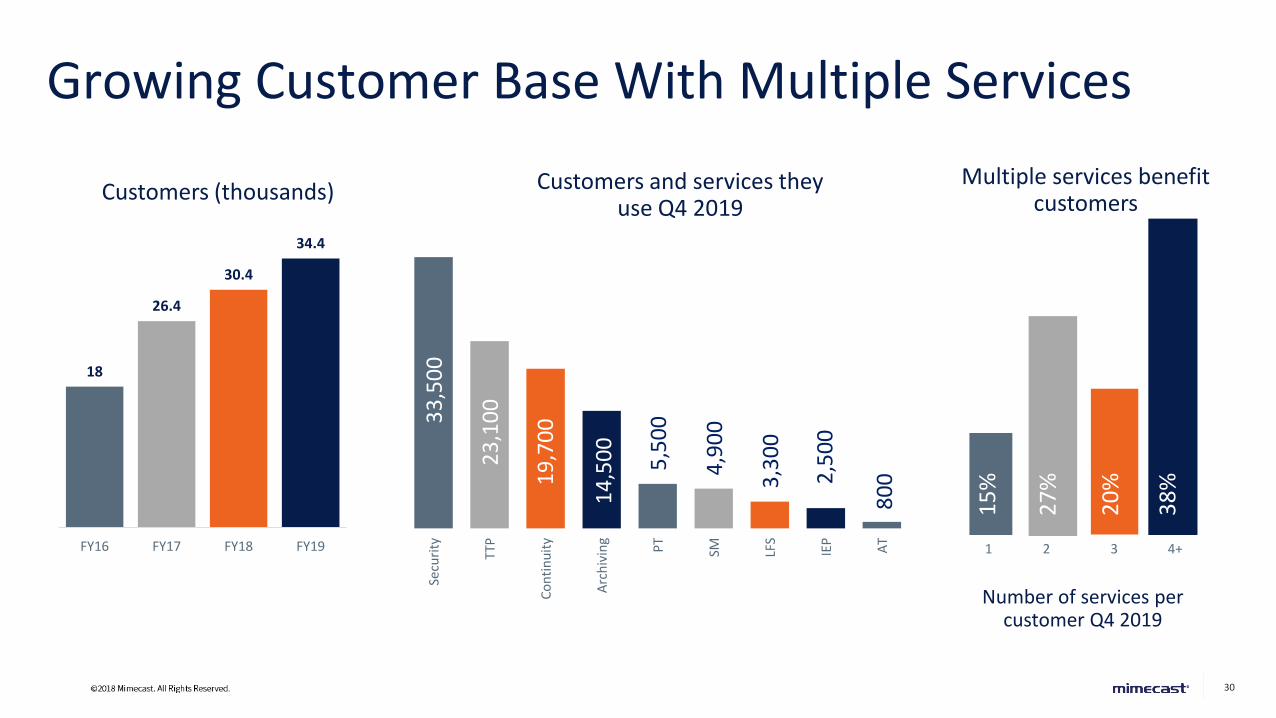
Growing Customer Base With Multiple Services
Multiple services benefit customers
Customers and services they use Q4 2019
Customers (thousands)
15
%
38
%
27
%
20
%
31 2 4+
Number of services per customer Q4 2019
18
26.4
30.4
34.4
FY16 FY17 FY18 FY19
33
,50
0
23
,10
0
19
,70
0
14
,50
0
5,5
00
4,9
00
3,3
00
2,5
00
80
0
Secu
rity
TTP
Co
nti
nu
ity
Arc
hiv
ing
PT
SM LFS
IEP
AT
31
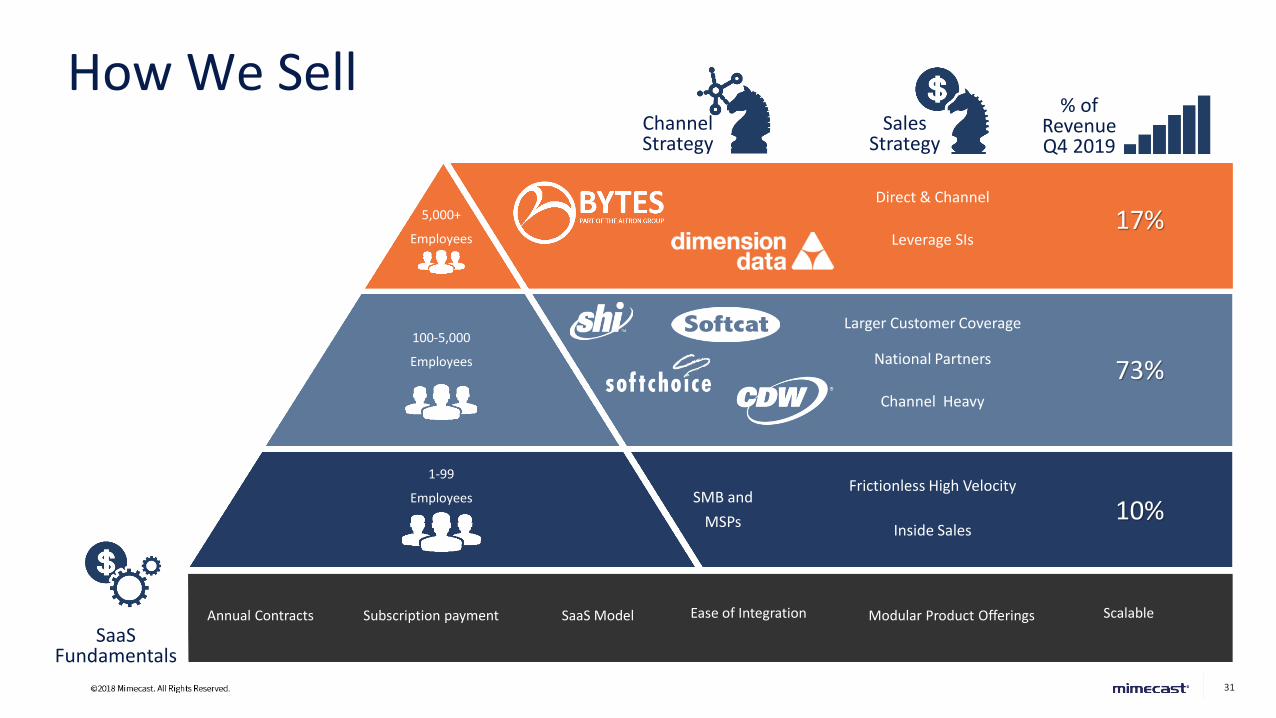
How We Sell
SMB and
MSPs
Channel Strategy
Frictionless High Velocity
Inside Sales
Larger Customer Coverage
National Partners
Channel Heavy
Direct & Channel
Leverage SIs
SalesStrategy
SaaS Fundamentals
5,000+
Employees
100-5,000
Employees
1-99
Employees10%
73%
17%
% of RevenueQ4 2019
ScalableEase of IntegrationSaaS ModelSubscription paymentAnnual Contracts Modular Product Offerings
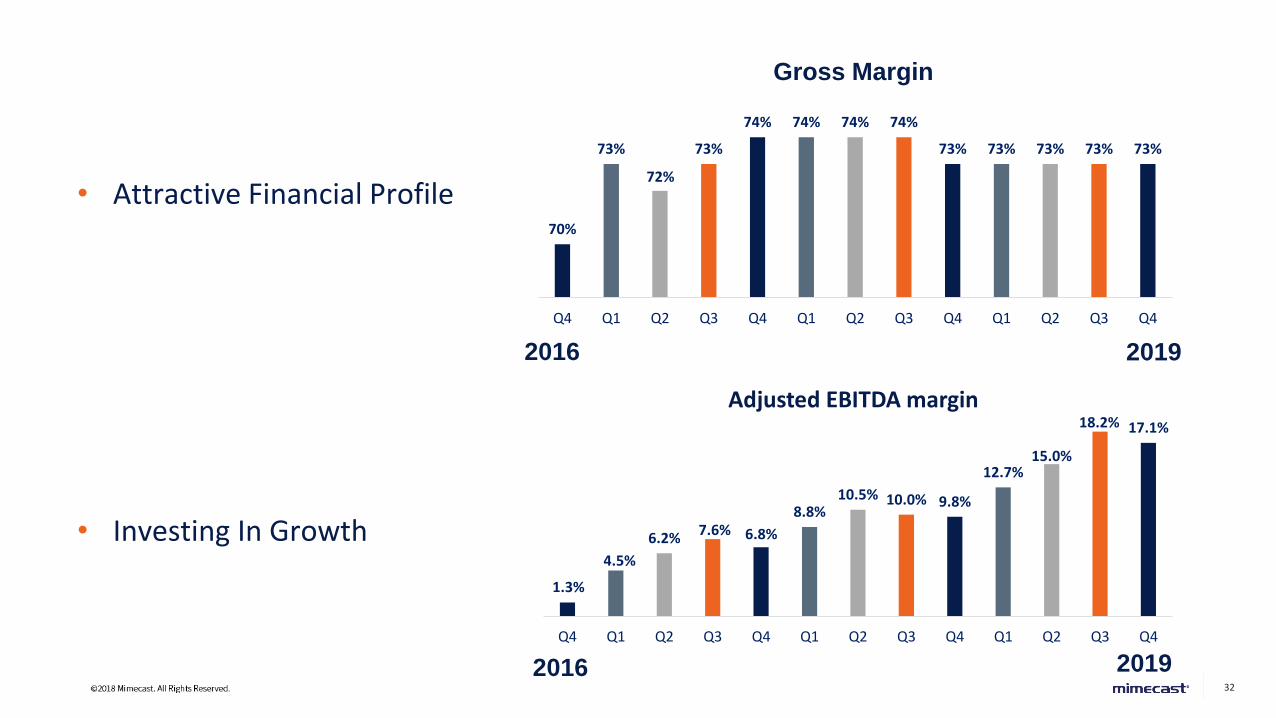
32
Gross Margin
Adjusted EBITDA margin
70%
73%
72%
73%
74% 74% 74% 74%
73% 73% 73% 73% 73%
Q4 Q1 Q2 Q3 Q4 Q1 Q2 Q3 Q4 Q1 Q2 Q3 Q4
1.3%
4.5%
6.2%7.6% 6.8%
8.8%10.5% 10.0% 9.8%
12.7%15.0%
18.2% 17.1%
Q4 Q1 Q2 Q3 Q4 Q1 Q2 Q3 Q4 Q1 Q2 Q3 Q4
20192016
2016 2019
• Attractive Financial Profile
• Investing In Growth
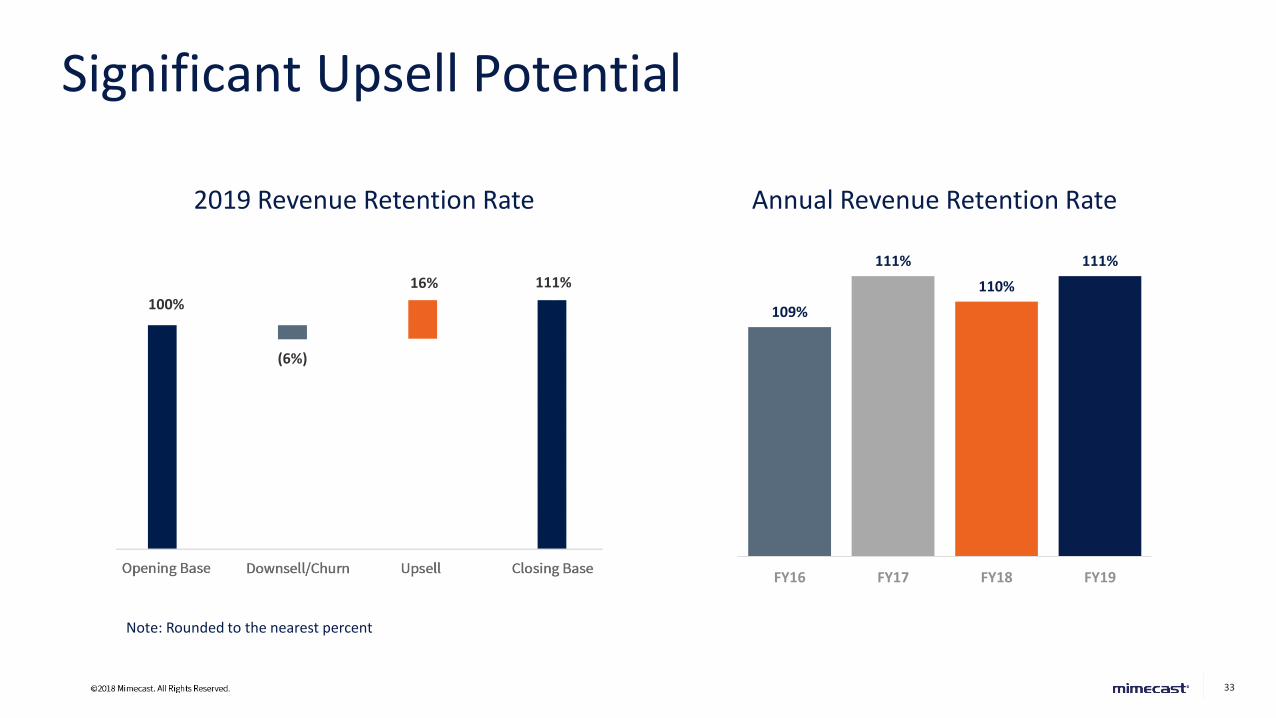
33
Significant Upsell Potential
2019 Revenue Retention Rate Annual Revenue Retention Rate
109%
111%
110%
111%
FY16 FY17 FY18 FY19
100%
(6%)
16% 111%
Note: Rounded to the nearest percent
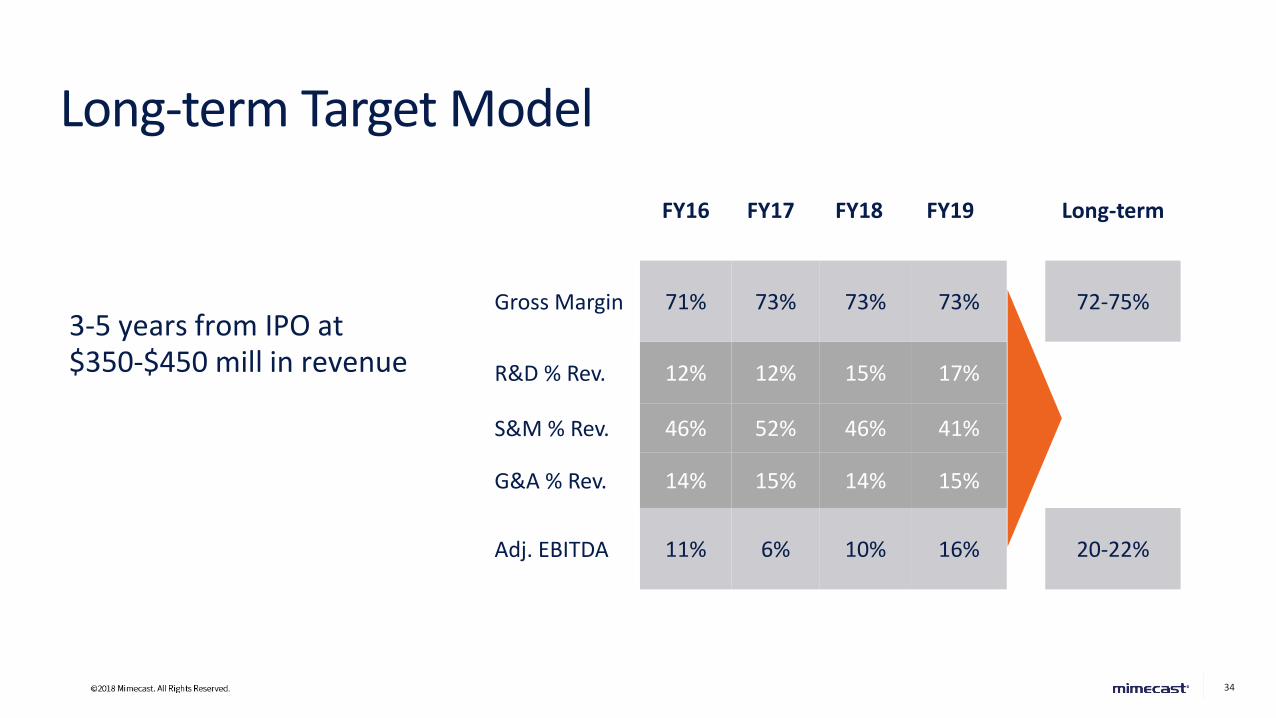
34
FY16 FY17 FY18 FY19 Long-term
Gross Margin 71% 73% 73% 73% 72-75%
R&D % Rev. 12% 12% 15% 17%
S&M % Rev. 46% 52% 46% 41%
G&A % Rev. 14% 15% 14% 15%
Adj. EBITDA 11% 6% 10% 16% 20-22%
Note: Fiscal Year Ends March 31
Long-term Target Model
3-5 years from IPO at$350-$450 mill in revenue
35
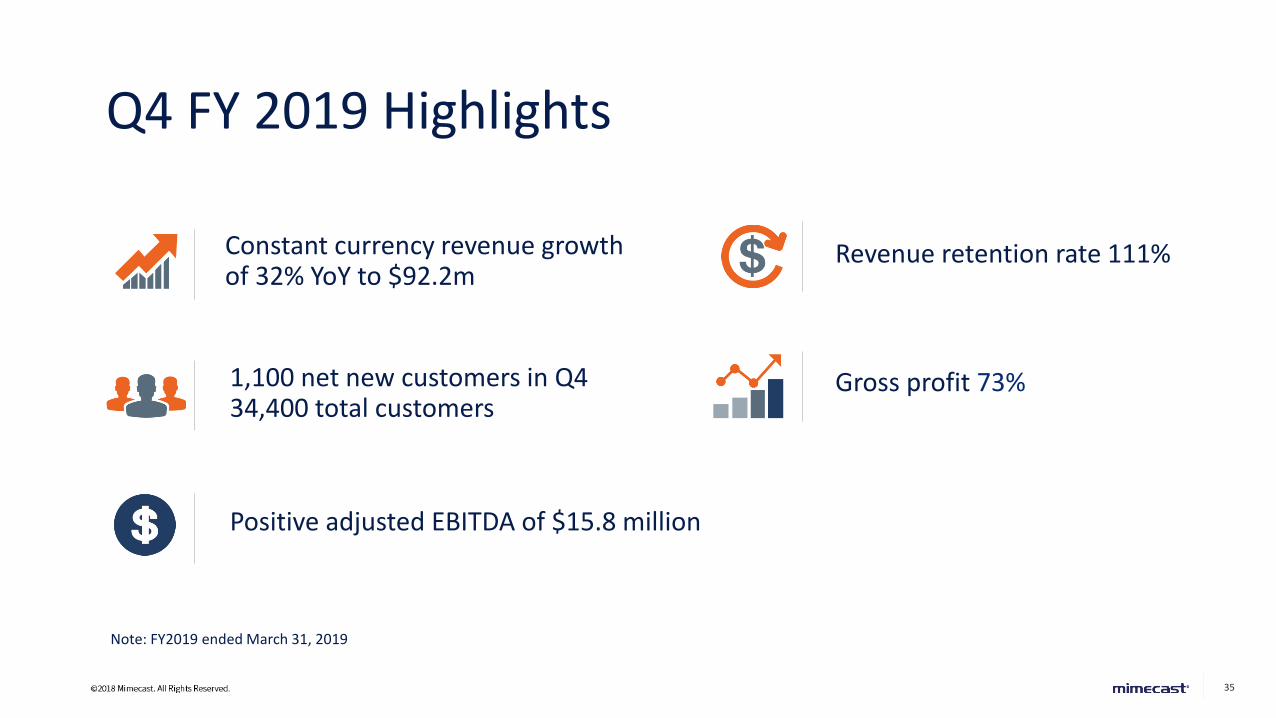
Q4 FY 2019 Highlights
1,100 net new customers in Q4 34,400 total customers
Revenue retention rate 111%Constant currency revenue growth of 32% YoY to $92.2m
Gross profit 73%
Positive adjusted EBITDA of $15.8 million
Note: FY2019 ended March 31, 2019

36
Fourth Quarter | 2019
Investor Presentation