fourth quarter 2017 earnings - xerox news and … fourth quarter 2017 earnings ... adjusted earnings...
TRANSCRIPT

January 31, 2018http://www.xerox.com/investor
Fourth Quarter 2017 EarningsNon-GAAP Financial Measures
Jeff Jacobson, CEOBill Osbourn, CFO

2
Non-GAAP Financial MeasuresWe have reported our financial results in accordance with generally accepted accounting principles (GAAP). In addition, we have discussed our
financial results using the non-GAAP measures described below. We believe these non-GAAP measures allow investors to better understand the
trends in our business and to better understand and compare our results. Accordingly, we believe it is necessary to adjust several reported amounts,
determined in accordance with GAAP, to exclude the effects of certain items as well as their related income tax effects.
A reconciliation of these non-GAAP financial measures to the most directly comparable financial measures calculated and presented in accordance
with GAAP are set forth below as well as on our website at www.xerox.com/investor.
These non-GAAP financial measures should be viewed in addition to, and not as a substitute for, the company’s reported results prepared in
accordance with GAAP.
Adjusted Earnings Measures
• Net income and Earnings per share (EPS)
• Effective tax rate
• Gross margin, RD&E and SAG (only adjusted for non-service retirement-related costs and transaction/proxy related costs)
The above measures were adjusted for the following items:
• Amortization of intangible assets: The amortization of intangible assets is driven by our acquisition activity which can vary in size, nature and timing
as compared to other companies within our industry and from period to period. The use of intangible assets contributed to our revenues earned
during the periods presented and will contribute to our future period revenues as well. Amortization of intangible assets will recur in future periods.

3
Non-GAAP Financial Measures
• Restructuring and related costs: Restructuring and related costs include restructuring and asset impairment charges as well as costs associated
with our Strategic Transformation program beyond those normally included in restructuring and asset impairment charges. Restructuring consists of
costs primarily related to severance and benefits paid to employees pursuant to formal restructuring and workforce reduction plans. Asset
impairment includes costs incurred for those assets sold, abandoned or made obsolete as a result of our restructuring actions, exiting from a
business or other strategic business changes. Additional costs for our Strategic Transformation program are primarily related to the implementation
of strategic actions and initiatives and include third-party professional service costs as well as one-time incremental costs. All of these costs can
vary significantly in terms of amount and frequency based on the nature of the actions as well as the changing needs of the business. Accordingly,
due to that significant variability, we will exclude these charges since we do not believe they provide meaningful insight into our current or past
operating performance nor do we believe they are reflective of our expected future operating expenses as such charges are expected to yield future
benefits and savings with respect to our operational performance.
• Non-service retirement-related costs: Our defined benefit pension and retiree health costs include several elements impacted by changes in plan
assets and obligations that are primarily driven by changes in the debt and equity markets as well as those that are predominantly legacy in nature
and related to employees who are no longer providing current service to the company (e.g. retirees and ex-employees). These elements include (i)
interest cost, (ii) expected return on plan assets, (iii) amortized actuarial gains/losses and (iv) the impacts of any plan settlements/curtailments.
Accordingly, we consider these elements of our periodic retirement plan costs to be outside the operational performance of the business or legacy
costs and not necessarily indicative of current or future cash flow requirements. Adjusted earnings will continue to include the elements of our
retirement costs related to current employee service (service cost and amortization of prior service cost) as well as the cost of our defined
contribution plans.

4
Non-GAAP Financial Measures
• Other discrete, unusual or infrequent items: In addition, we also excluded the following items given their discrete, unusual or infrequent nature and
their impact on our results for the period:
• Losses on early extinguishment of debt in the first and fourth quarter of 2017
• A benefit from the remeasurement of a tax matter in the first quarter of 2017 that related to a previously adjusted item
• Costs incurred in the fourth quarter of 2017 related to the recently announced transaction with Fujifilm as well as to our expected proxy
contest. These costs are primarily for third-party investment banking, legal, accounting, consulting and other similar services.
• An estimated non-cash charge in the fourth quarter 2017 reflecting the impact associated with the enactment of the Tax Cuts and Jobs Act
(the "Tax Act") in December 2017. See our Fourth Quarter 2017 Earnings Release on Form 8-K filed with the Securities and Exchange
Commission.
We believe the exclusion of these items allows investors to better understand and analyze the results for the period as compared to prior periods and
expected future trends in our business.
Adjusted Operating Income/Margin
We also calculate and utilize adjusted operating income and margin measures by adjusting our reported pre-tax income and margin amounts. In
addition to the costs and expenses noted as adjustments for our Adjusted Earnings measures, adjusted operating income and margin also exclude
Other expenses, net. Other expenses, net is primarily comprised of non-financing interest expense and also includes certain other non-operating
costs and expenses. We exclude these amounts in order to evaluate our current and past operating performance and to better understand the
expected future trends in our business. Adjusted Operating income and margin also include Equity in net income of unconsolidated affiliates. Equity
in net income of unconsolidated affiliates primarily reflects our 25% share of Fuji Xerox net income. We include this amount in our measure of
operating income and margin as Fuji Xerox is our primary intermediary to the Asia/Pacific market for distribution of Xerox branded products and
services.
5
Non-GAAP Financial MeasuresConstant Currency
To better understand trends in our business, we believe that it is helpful to adjust revenue to exclude the impact of changes in the translation of foreign
currencies into U.S. dollars. We refer to this adjusted revenue as “constant currency.” This impact is calculated by translating current period activity in
local currency using the comparable prior year period's currency translation rate. This impact is calculated for all countries where the functional currency
is the local country currency. The constant currency impact for signings growth is calculated on the basis of plan currency rates. Management believes
the constant currency measure provides investors an additional perspective on revenue trends. Currency impact can be determined as the difference
between actual growth rates and constant currency growth rates.
Free Cash Flow
To better understand trends in our business, we believe that it is helpful to subtract amounts for capital expenditures (inclusive of internal use software)
from cash flows from continuing operations. Management believes this measure gives investors an additional perspective on cash flow from operating
activities in excess of amounts required for reinvestment. It provides a measure of our ability to fund acquisitions, dividends and share repurchase.
Summary:
Management believes that all of these non-GAAP financial measures provide an additional means of analyzing the current period’s results against the
corresponding prior period’s results. However, these non-GAAP financial measures should be viewed in addition to, and not as a substitute for, the
company’s reported results prepared in accordance with GAAP. Our non-GAAP financial measures are not meant to be considered in isolation or as a
substitute for comparable GAAP measures and should be read only in conjunction with our consolidated financial statements prepared in accordance
with GAAP. Our management regularly uses our supplemental non-GAAP financial measures internally to understand, manage and evaluate our
business and make operating decisions. These non-GAAP measures are among the primary factors management uses in planning for and forecasting
future periods. Compensation of our executives is based in part on the performance of our business based on these non-GAAP measures.
A reconciliation of these non-GAAP financial measures and the most directly comparable measures calculated and
presented in accordance with GAAP are set forth on the following tables:

6
Net Income and EPS reconciliation
(in millions, except per share amounts)
Net (Loss)
Income
Diluted
EPS
Net
Income
Diluted
EPS
Net
Income
Diluted
EPS
Net
Income
Diluted
EPS
As Reported (1)
$ (196) $ (0.78) $ 185 $ 0.70 $ 192 $ 0.70 $ 622 $ 2.33
Restructuring and related costs 24 92 220 264
Amortization of intangible assets 12 14 53 58
Non-service retirement-related costs 62 19 198 131
Loss on extinguishment of debt 7 - 20 -
Transaction and proxy related fees 9 - 9 -
Income tax on adjustments (2)
(45) (46) (171) (151)
US Tax Act 400 - 400 -
Remeasurement of unrecognized tax positions - - (16) -
Restructuring and other charges - Fuji Xerox (3)
1 - 10 3
Adjusted 274$ $ 1.04 264$ $ 1.00 915$ $ 3.48 927$ $ 3.53
Dividends on preferred stock used in adjusted EPS calculation (4)
$ - $ - $ - $ 24
Weighted average shares for adjusted EPS (4)
264 264 263 256
Fully diluted shares at end of period (5)
264
(1) Net (Loss) Income and EPS from continuing operations attributable to Xerox.
(3) Other charges in 2017 represent audit and other fees associated with the independent investigation of Fuji Xerox's accounting practices.(4) For those periods that exclude the preferred stock dividend the average shares for the calculations of diluted EPS include 7 million shares associated with our Series A or Series B
convertible preferred stock.
(5) Represents common shares outstanding at December 31, 2017 as well as shares associated with our Series B convertible preferred stock plus dilutive potential common shares as
used for the calculation of diluted earnings per share for the fourth quarter 2017.
Three Months Ended
December 31, 2017
Three Months Ended
December 31, 2016
Year Ended
December 31, 2017
Year Ended
December 31, 2016
(2) Refer to Effective Tax Rate reconciliation.

7
Effective Tax Rate reconciliation
(in millions)
Pre-Tax
Income
Income Tax
Expense
Effective
Tax Rate
Pre-Tax
Income
Income Tax
Expense
Effective
Tax Rate
Pre-Tax
Income
Income Tax
Expense
Effective
Tax Rate
Pre-Tax
Income
Income Tax
Expense
Effective
Tax Rate
Reported (1)
$ 226 $ 444 196.5% $ 179 $ 18 10.1% $ 570 $ 481 84.4% $ 568 $ 62 10.9%
Non-GAAP Adjustments (2)
114 45 125 46 500 171 453 151
US Tax Act - (400) - - - (400) - -
Remeasurement of unrecognized
tax positions - - - - - 16 - -
Adjusted (3)
$ 340 $ 89 26.2% $ 304 $ 64 21.1% $ 1,070 $ 268 25.0% $ 1,021 $ 213 20.9%
__________
(1) Pre-Tax Income and Income Tax Expense from continuing operations.
(2) Refer to Net Income and EPS reconciliations for details.
Three Months Ended
December 31, 2017
Three Months Ended
December 31, 2016
Year Ended
December 31, 2017
Year Ended
December 31, 2016
(3) The tax impact on the Adjusted Pre‐Tax Income from continuing operations is calculated under the same accounting principles applied to the As Reported Pre-Tax Income under ASC 740, which employs an
annual effective tax rate method to the results.

8
Key Financial Ratios – Q4
(1) Revenue and costs from continuing operations.
(2) 2017 includes adjustments for non-service retirement-related costs and transaction/proxy-related costs. 2016 includes
adjustments for non-service retirement-related costs.
(in millions)
Total Revenues $ 2,747 $ - $ 2,747 $ 2,734 $ - $ 2,734
Total Gross Profit 1,088 23 1,111 1,094 7 1,101
Post Sale Revenue 2,065 - 2,065 2,080 - 2,080
Post Sale Gross Profit 901 23 924 889 7 896
RD&E 114 (8) 106 113 (4) 109
SAG 676 (40) 636 639 (8) 631
Total Gross Margin 39.6 % 40.4 % 40.0 % 40.3 %
Post Sale Gross Margin 43.6 % 44.7 % 42.7 % 43.1 %
RD&E as a % of Revenue 4.1 % 3.9 % 4.1 % 4.0 %
SAG as a % of Revenue 24.6 % 23.2 % 23.4 % 23.1 %
December 31, 2017 December 31, 2016
Three Months Ended Three Months Ended
As Reported (1)
Adjustments (2) Adjusted As Reported
(1)Adjustments
(2) Adjusted

9
Key Financial Ratios – FY
(1) Revenue and costs from continuing operations.
(2) 2017 includes adjustments for non-service retirement-related costs and transaction/proxy-related costs. 2016 includes
adjustments for non-service retirement-related costs.
(in millions)
Total Revenues $ 10,265 $ - $ 10,265 $ 10,771 $ - $ 10,771
Total Gross Profit 4,061 75 4,136 4,261 49 4,310
Post Sale Revenue 8,014 - 8,014 8,352 - 8,352
Post Sale Gross Profit 3,414 75 3,489 3,513 49 3,562
RD&E 446 (25) 421 476 (25) 451
SAG 2,631 (107) 2,524 2,695 (57) 2,638
Total Gross Margin 39.6 % 40.3 % 39.6 % 40.0 %
Post Sale Gross Margin 42.6 % 43.5 % 42.1 % 42.6 %
RD&E as a % of Revenue 4.3 % 4.1 % 4.4 % 4.2 %
SAG as a % of Revenue 25.6 % 24.6 % 25.0 % 24.5 %
Year Ended
December 31, 2017 December 31, 2016
Year Ended
AdjustedAs Reported (1)
Adjustments (2) Adjusted As Reported
(1)Adjustments
(2)

10
Operating Income/Margin reconciliation – Q4
(1) Pre-Tax Income and revenue from continuing operations.
(2) Other charges in 2017 represent audit and other fees associated with the independent investigation of Fuji Xerox’s
accounting practices.
(in millions) Profit Revenue Margin Profit Revenue Margin
Reported (1)
226$ 2,747$ 8.2% 179$ 2,734$ 6.5%
Adjustments:
Restructuring and related costs 24 92
Amortization of intangible assets 12 14
Non-service retirement-related costs 62 19
Transaction and proxy related fees 9 -
Equity in net income of unconsolidated affiliates 25 27
Restructuring and other charges - Fuji Xerox (2)
1 -
Other expenses, net 36 57
Adjusted 395$ 2,747$ 14.4% 388$ 2,734$ 14.2%
Three Months Ended December 31, 2017 Three Months Ended December 31, 2016

11
Operating Income/Margin reconciliation – FY
(1) Pre-Tax Income and revenue from continuing operations.
(2) Other charges in 2017 represent audit and other fees associated with the independent investigation of Fuji Xerox’s
accounting practices.
(in millions) Profit Revenue Margin Profit Revenue Margin
Reported (1)
570$ 10,265$ 5.6% 568$ 10,771$ 5.3%
Adjustments:
Restructuring and related costs 220 264
Amortization of intangible assets 53 58
Non-service retirement-related costs 198 131
Transaction and proxy related fees 9 -
Equity in net income of unconsolidated affiliates 115 127
Restructuring and other charges - Fuji Xerox (2)
10 3
Other expenses, net 141 200
Adjusted 1,316$ 10,265$ 12.8% 1,351$ 10,771$ 12.5%
Year Ended December 31, 2017 Year Ended December 31, 2016

12
Other expenses, net
(in millions) December 31, 2017 December 31, 2016
Other expenses, net - Reported 36$ 57$
Adjustment:
Loss on early extinguishment of debt (7) -
Other expenses, net - Adjusted 29$ 57$
Three Months Ended

13
Operating Cash Flow / Free Cash Flow reconciliation
(1) Operating Cash Flow and Free Cash Flow from continuing operations.
(in millions) Q4 2017 Actual FY 2017 Actual FY 2018 Guidance
Operating Cash Flow (1)
(28)$ 122$ $ 900 - 1,100
Less: CAPEX (inclusive of Internal Use Software) (35) (105) (150)
Free Cash Flow (1)
(63)$ 17$ $ 750 - 950
(in millions) Q4 2017 Actual FY 2017 Actual FY 2017 Guidance
Operating Cash Flow (1)
(28)$ 122$ $ (50) - 150
Elimination of certain accounts receivables sales programs 350 350 350
Incremental, voluntary contributions to U.S. defined benefit pension plans - 500 500
Adjusted Operating Cash Flow (1)
322 972 $ 800 - 1,000
Less: CAPEX (inclusive of Internal Use Software) (35) (105)
Adjusted Free Cash Flow (1)
287$ 867$
14
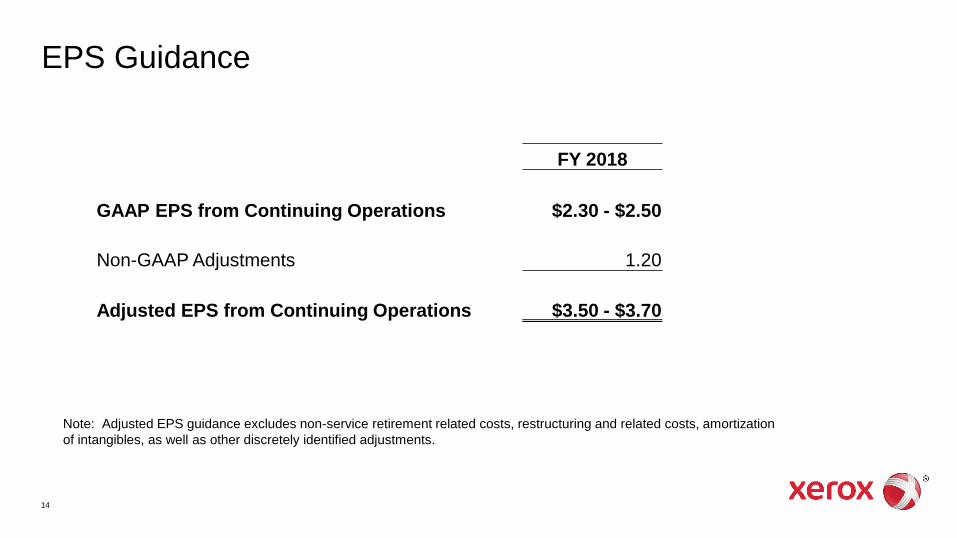
EPS Guidance
Note: Adjusted EPS guidance excludes non-service retirement related costs, restructuring and related costs, amortization
of intangibles, as well as other discretely identified adjustments.
FY 2018
GAAP EPS from Continuing Operations $2.30 - $2.50
Non-GAAP Adjustments 1.20
Adjusted EPS from Continuing Operations $3.50 - $3.70

© 2018 Xerox Corporation. All rights reserved. Xerox® and Xerox and Design® are trademarks of Xerox Corporation in the United States and/or other countries.