fourth quarter 2010 results
TRANSCRIPT
Investor Presentation
Fourth Quarter 2010 Results February 15, 2011
Disclosure The following materials have been prepared for use in the February 15, 2011 conference call on Omnicom’s results of operations for the period ended December 31, 2010. The call will be archived on the Internet at http://www.omnicomgroup.com/financialwebcasts.
Forward-Looking Statements Certain of the statements in this document constitute forward-looking statements within the meaning of the Private Securities Litigation Reform Act of 1995. In addition, from time to time, we or our representatives have made or may make forward-looking statements, orally or in writing. These statements relate to future events or future financial performance and involve known and unknown risks and other factors that may cause our actual or our industry’s results, levels of activity, or achievement to be materially different from those expressed or implied by any forward-looking statements. These risks and uncertainties include, but are not limited to, our future financial position and results of operations, future global economic conditions and conditions in the credit markets, losses on media purchases and production costs incurred on behalf of clients, reductions in client spending and/or a slowdown in client payments, competitive factors, changes in client communication requirements, the hiring and retention of personnel, maintaining a highly skilled workforce, our ability to attract new clients and retain existing clients, reliance on information technology systems, changes in government regulations impacting our advertising and marketing strategies, risks associated with assumptions we make in connection with our critical accounting estimates, legal proceedings, settlements, investigations and claims, and our international operations, which are subject to the risks of currency fluctuations and foreign exchange controls. In some cases, forward-looking statements can be identified by terminology such as “may,” “will,” “could,” “would,” “should,” “expect,” “plan,” “anticipate,” “intend,” “believe,” “estimate,” “predict,” “potential” or “continue” or the negative of those terms or other comparable terminology. These statements are our present expectations. Actual events or results may differ. We undertake no obligation to update or revise any forward-looking statement, except as required by law.
Non-GAAP Financial Measures We provide herein financial measures determined in accordance with accounting principles generally accepted in the United States (“GAAP”) and adjustments to the GAAP presentation (“non-GAAP”) which we believe are meaningful for understanding our performance. Non-GAAP financial measures should not be considered in isolation from, or as a substitute for, financial information presented in compliance with GAAP. Non-GAAP financial measures as reported by us may not be comparable to similarly titled amounts reported by other companies. We provide a reconciliation of non-GAAP measures to the comparable GAAP measures on pages 27 and 28.
The measures used in this presentation include the following:
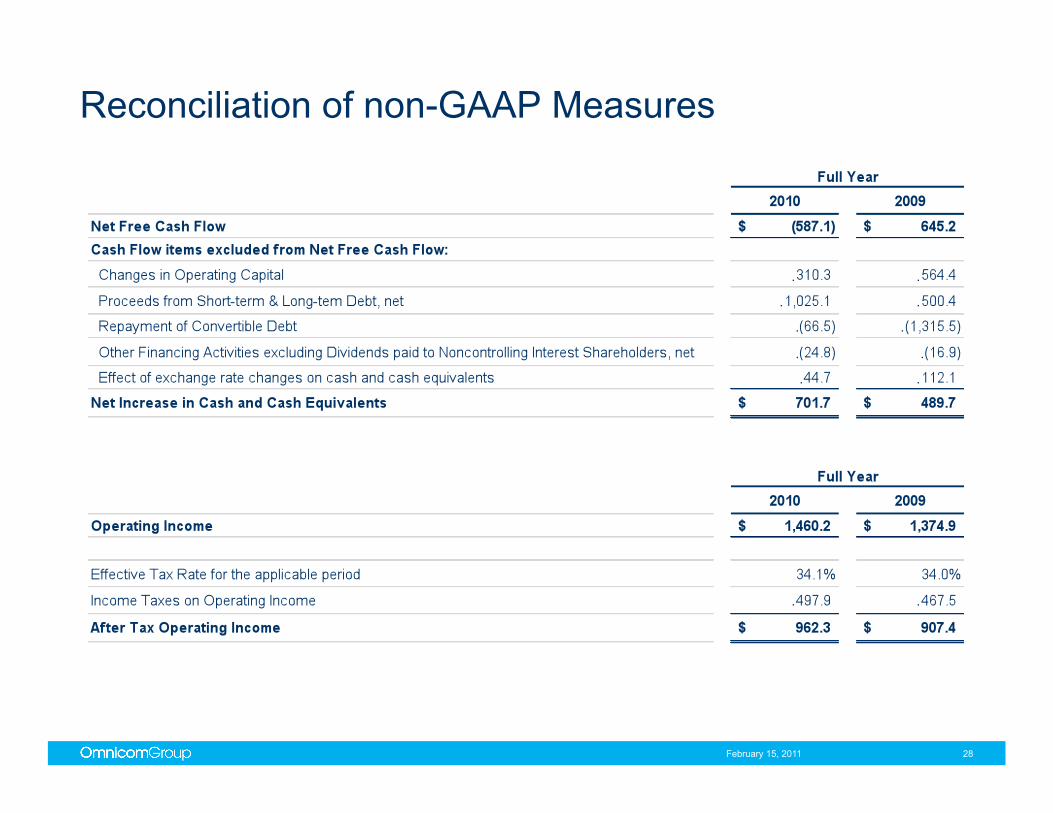
Net Free Cash Flow, defined as Free Cash Flow (defined below) less the Primary Uses of Cash (defined below). Net Free Cash Flow is one of the metrics used by us to assess our sources and uses of cash and was derived from our consolidated statements of cash flows. We believe that this presentation is meaningful for understanding our primary sources and primary uses of that cash flow. Free Cash Flow, defined as net income plus depreciation, amortization and share based compensation expense less other non-cash items to reconcile to net cash provided by operating activities and capital expenditures. Primary Uses of Cash, defined as dividends to common shareholders, dividends paid to noncontrolling interest shareholders, cash paid on acquisitions, payments for additional interest in controlled subsidiaries and stock repurchases, net of the proceeds and excess tax benefit from our stock plans, and excludes changes in working capital and other investing and financing activities, including commercial paper issuances and redemptions used to fund these working capital changes. EBITDA, defined as operating income before interest, taxes, depreciation and amortization. We believe EBITDA is more meaningful for purposes of this analysis because the financial covenants in our credit facilities are based on EBITDA . EBITA, defined as operating income before interest, taxes and amortization. We use EBITA as an additional operating performance measure, which excludes acquisition-related amortization expense, because we believe that EBITA is a useful measure to evaluate the performance of our businesses. Net Debt, defined as total debt less cash, cash equivalents and short-term investments. We believe net debt, together with the comparable U.S. GAAP measures, reflects one of the metrics used by us to assess our cash management. After Tax Operating Income, defined as operating income less income taxes calculated using the effective tax rate for the applicable period.
Other Information All dollar amounts are in millions except for per share amounts. The following financial information contained in this document has not been audited, although some of it has been derived from Omnicom’s historical financial statements, including its audited financial statements. In addition, industry, operational and other non-financial data contained in this document have been derived from sources we believe to be reliable, but we have not independently verified such information, and we do not, nor does any other person, assume responsibility for the accuracy or completeness of that information. Certain amounts in prior periods have been reclassified to conform to our current presentation.
The inclusion of information in this presentation does not mean that such information is material or that disclosure of such information is required.
1 February 15, 2011

2010 vs. 2009 P&L Summary
February 15, 2011 2
(a) See page 22 for additional earnings per share information. (b) EBITA is a non-GAAP financial measure. See page 1 for the definition of this measure and page 27 for the reconciliation of non-GAAP measures.
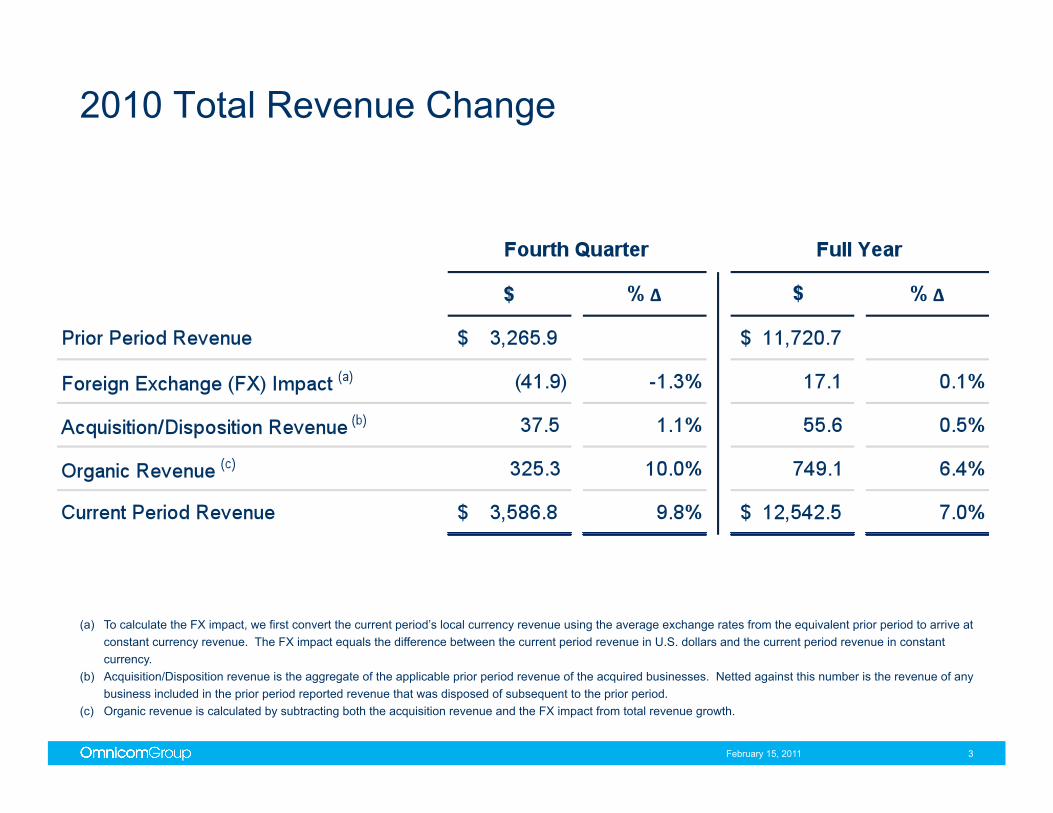
2010 Total Revenue Change
February 15, 2011 3
(a) To calculate the FX impact, we first convert the current period’s local currency revenue using the average exchange rates from the equivalent prior period to arrive at constant currency revenue. The FX impact equals the difference between the current period revenue in U.S. dollars and the current period revenue in constant currency.
(b) Acquisition/Disposition revenue is the aggregate of the applicable prior period revenue of the acquired businesses. Netted against this number is the revenue of any business included in the prior period reported revenue that was disposed of subsequent to the prior period.
(c) Organic revenue is calculated by subtracting both the acquisition revenue and the FX impact from total revenue growth.
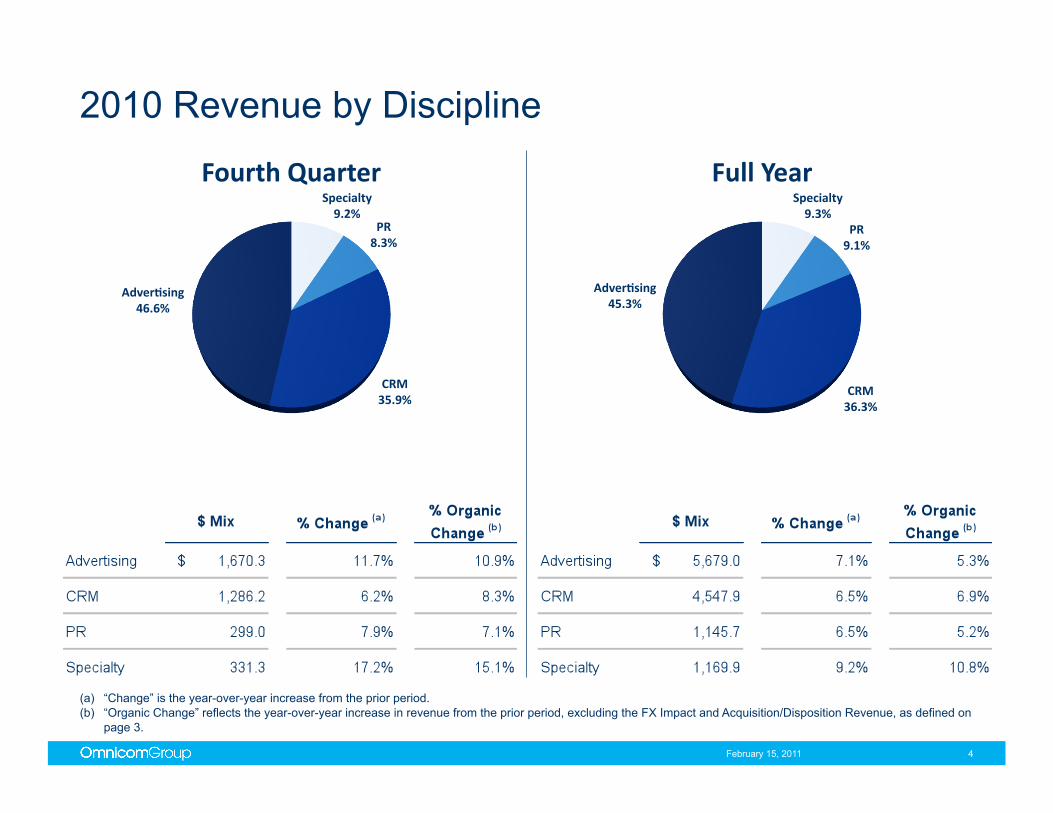
2010 Revenue by Discipline
February 15, 2011 4
(a) “Change” is the year-over-year increase from the prior period. (b) “Organic Change” reflects the year-over-year increase in revenue from the prior period, excluding the FX Impact and Acquisition/Disposition Revenue, as defined on
page 3.
Specialty 9.2%
PR 8.3%
CRM 35.9%
Adver:sing 46.6%
Fourth Quarter Specialty 9.3%
PR 9.1%
CRM 36.3%
Adver:sing 45.3%
Full Year
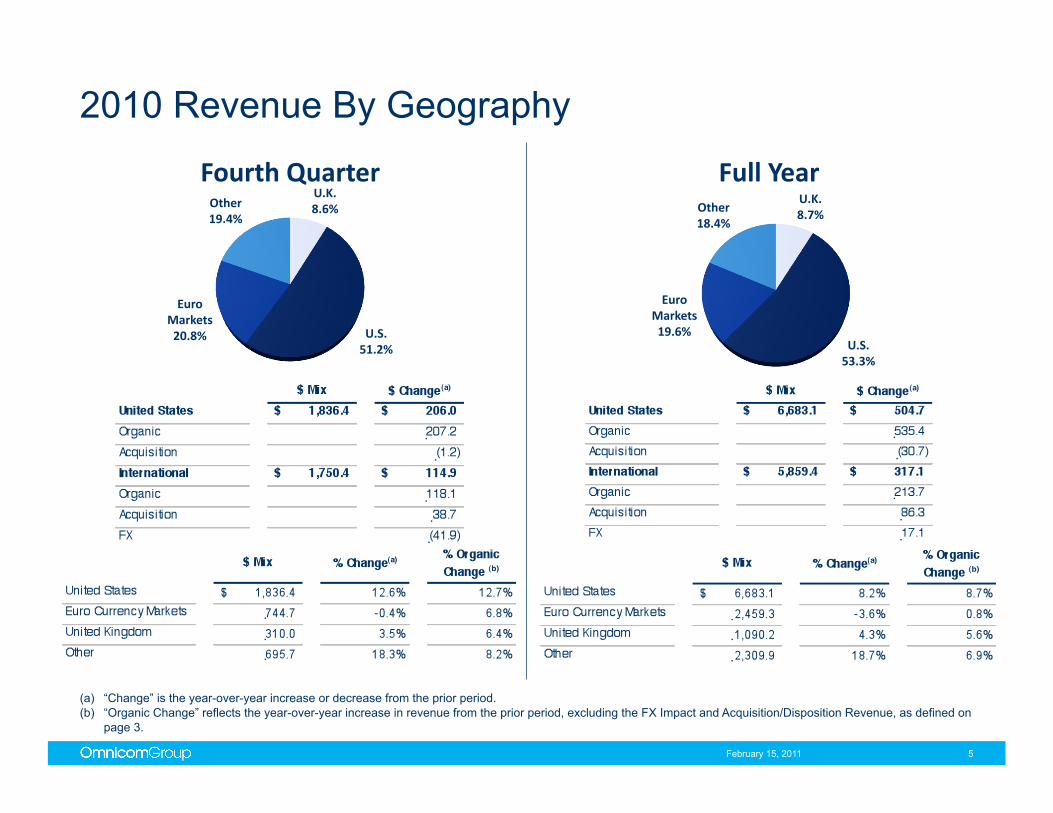
2010 Revenue By Geography!
February 15, 2011 5
(a) “Change” is the year-over-year increase or decrease from the prior period. (b) “Organic Change” reflects the year-over-year increase in revenue from the prior period, excluding the FX Impact and Acquisition/Disposition Revenue, as defined on
page 3.
U.K. 8.6%
U.S. 51.2%
Euro Markets 20.8%
Other 19.4%
Fourth Quarter U.K. 8.7%
U.S. 53.3%
Euro Markets 19.6%
Other 18.4%
Full Year
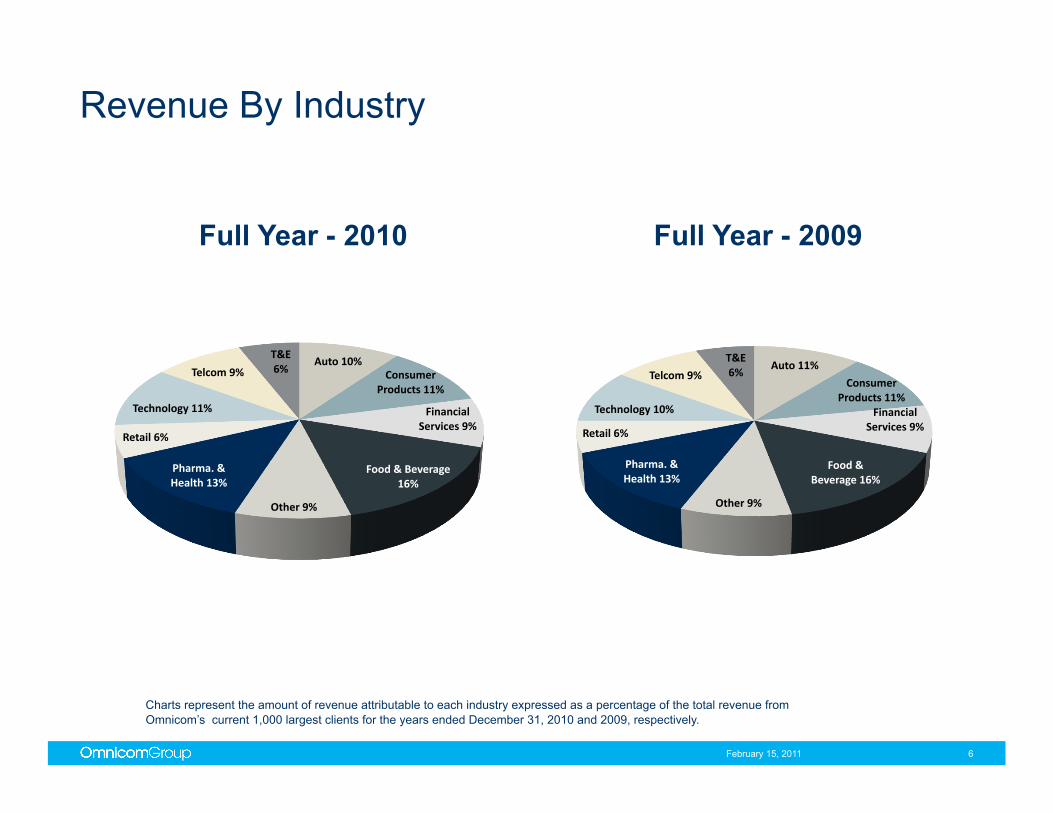
Revenue By Industry
Charts represent the amount of revenue attributable to each industry expressed as a percentage of the total revenue from Omnicom’s current 1,000 largest clients for the years ended December 31, 2010 and 2009, respectively.
6 February 15, 2011
Auto 10% Consumer
Products 11%
Financial Services 9%
Food & Beverage 16%
Other 9%
Pharma. & Health 13%
Retail 6%
Technology 11%
Telcom 9%
T&E 6%
Full Year - 2010
Auto 11%
Consumer Products 11%
Financial Services 9%
Food & Beverage 16%
Other 9%
Pharma. & Health 13%
Retail 6%
Technology 10%
Telcom 9%
T&E 6%
Full Year - 2009
7
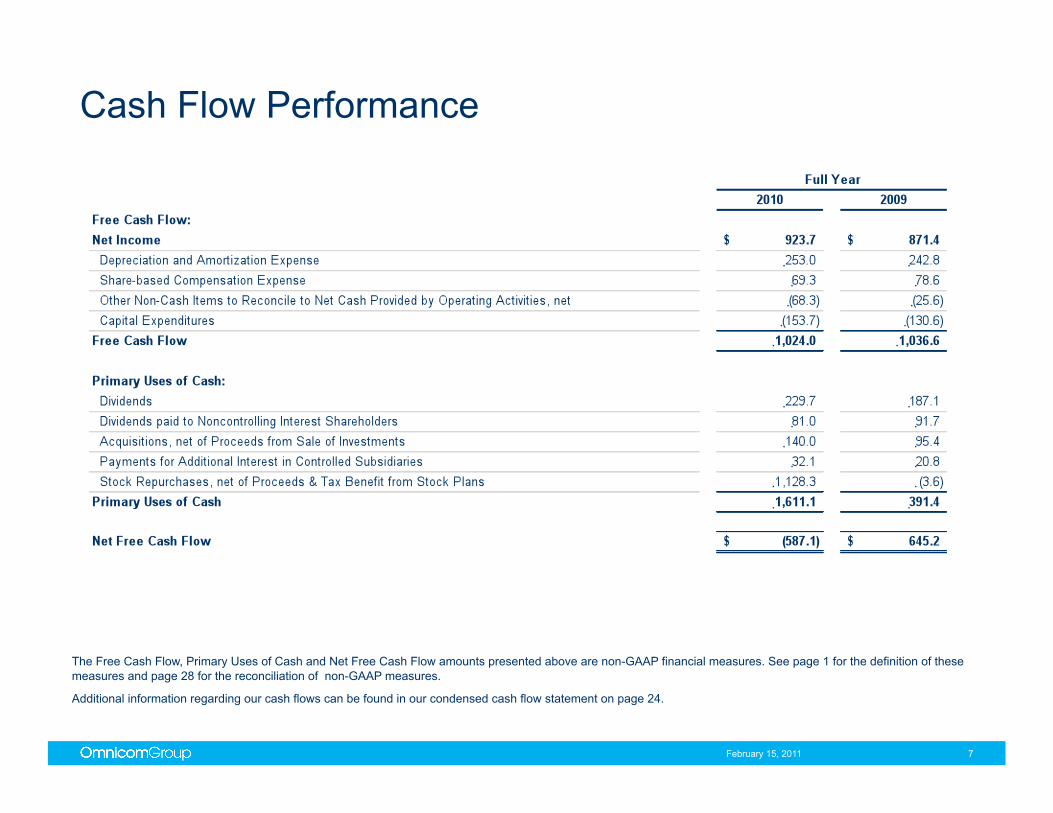
Cash Flow Performance
February 15, 2011
The Free Cash Flow, Primary Uses of Cash and Net Free Cash Flow amounts presented above are non-GAAP financial measures. See page 1 for the definition of these measures and page 28 for the reconciliation of non-GAAP measures.
Additional information regarding our cash flows can be found in our condensed cash flow statement on page 24.
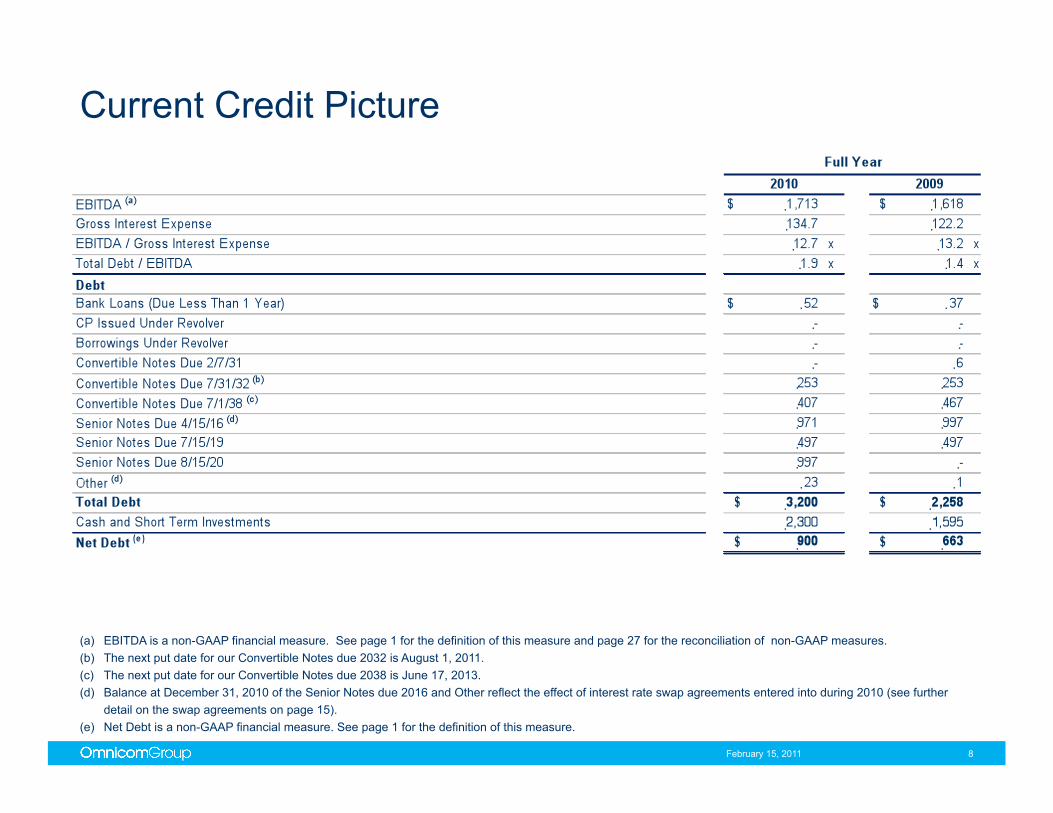
Current Credit Picture
February 15, 2011 8
(a) EBITDA is a non-GAAP financial measure. See page 1 for the definition of this measure and page 27 for the reconciliation of non-GAAP measures. (b) The next put date for our Convertible Notes due 2032 is August 1, 2011. (c) The next put date for our Convertible Notes due 2038 is June 17, 2013. (d) Balance at December 31, 2010 of the Senior Notes due 2016 and Other reflect the effect of interest rate swap agreements entered into during 2010 (see further
detail on the swap agreements on page 15). (e) Net Debt is a non-GAAP financial measure. See page 1 for the definition of this measure.
9
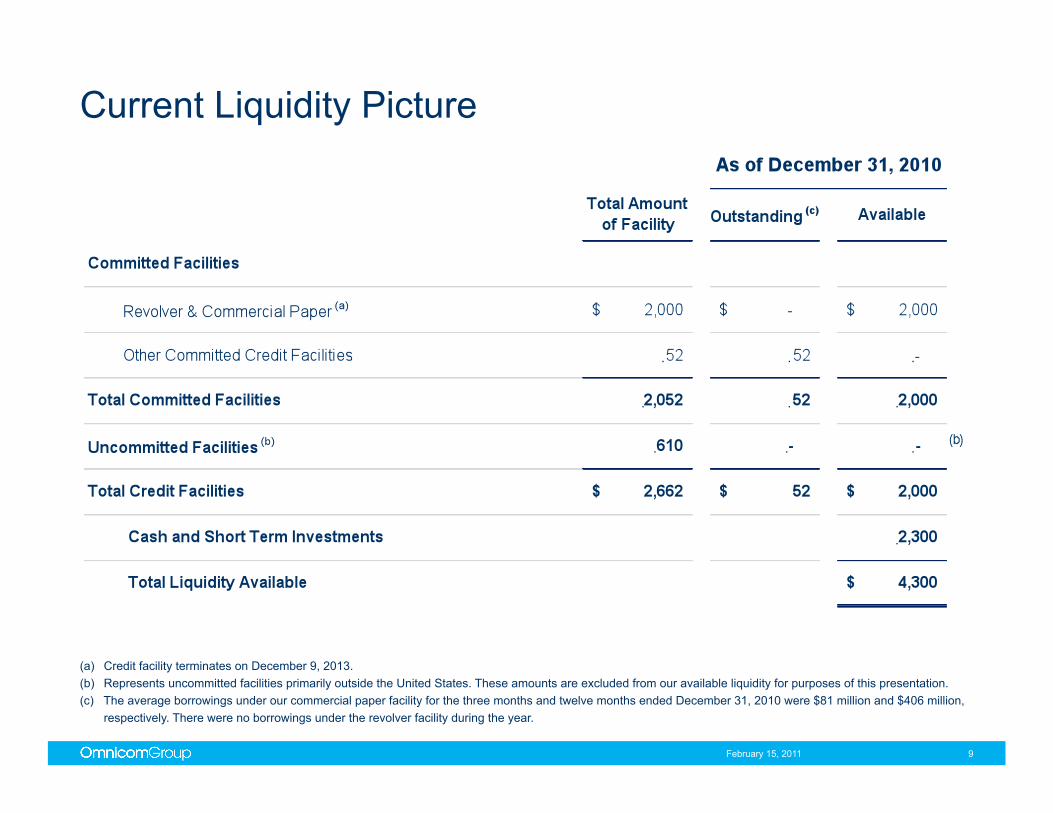
Current Liquidity Picture
(a) Credit facility terminates on December 9, 2013. (b) Represents uncommitted facilities primarily outside the United States. These amounts are excluded from our available liquidity for purposes of this presentation. (c) The average borrowings under our commercial paper facility for the three months and twelve months ended December 31, 2010 were $81 million and $406 million,
respectively. There were no borrowings under the revolver facility during the year.
February 15, 2011
10
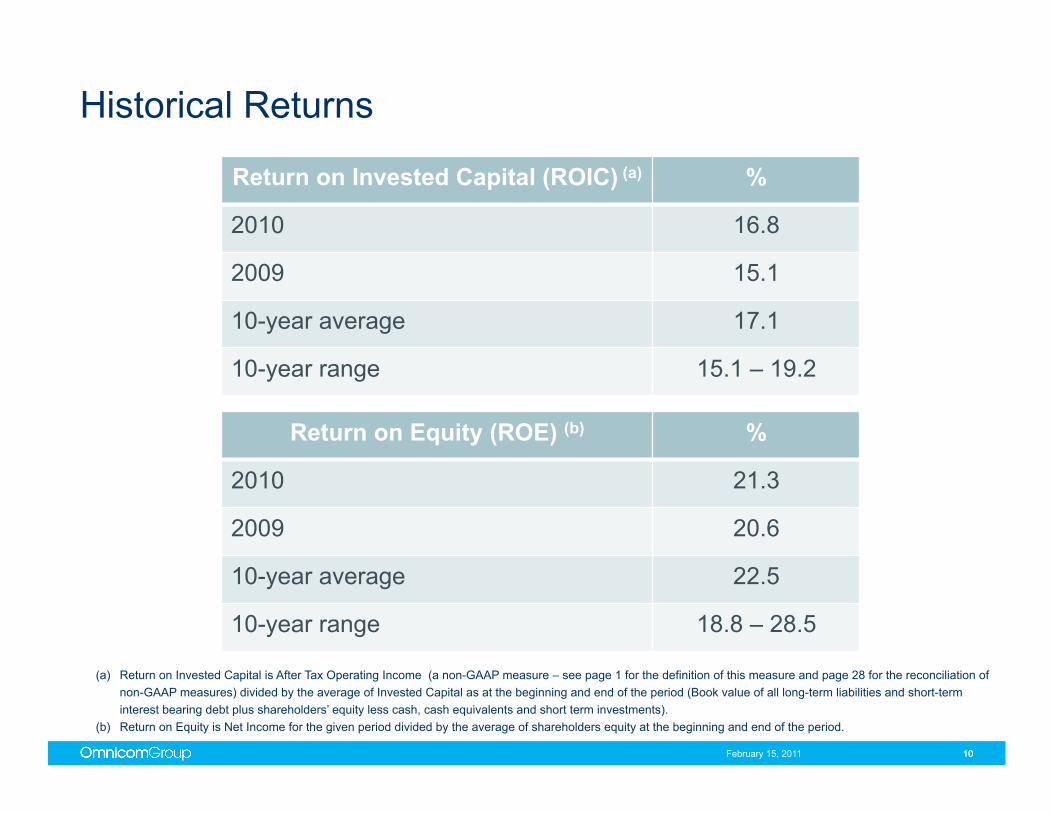
Historical Returns
(a) Return on Invested Capital is After Tax Operating Income (a non-GAAP measure – see page 1 for the definition of this measure and page 28 for the reconciliation of non-GAAP measures) divided by the average of Invested Capital as at the beginning and end of the period (Book value of all long-term liabilities and short-term interest bearing debt plus shareholders’ equity less cash, cash equivalents and short term investments).
(b) Return on Equity is Net Income for the given period divided by the average of shareholders equity at the beginning and end of the period.
10
Return on Equity (ROE) (b) %
2010 21.3
2009 20.6
10-year average 22.5
10-year range 18.8 – 28.5
Return on Invested Capital (ROIC) (a) %
2010 16.8
2009 15.1
10-year average 17.1
10-year range 15.1 – 19.2
February 15, 2011
Omnicom Debt Structure Supplemental Information
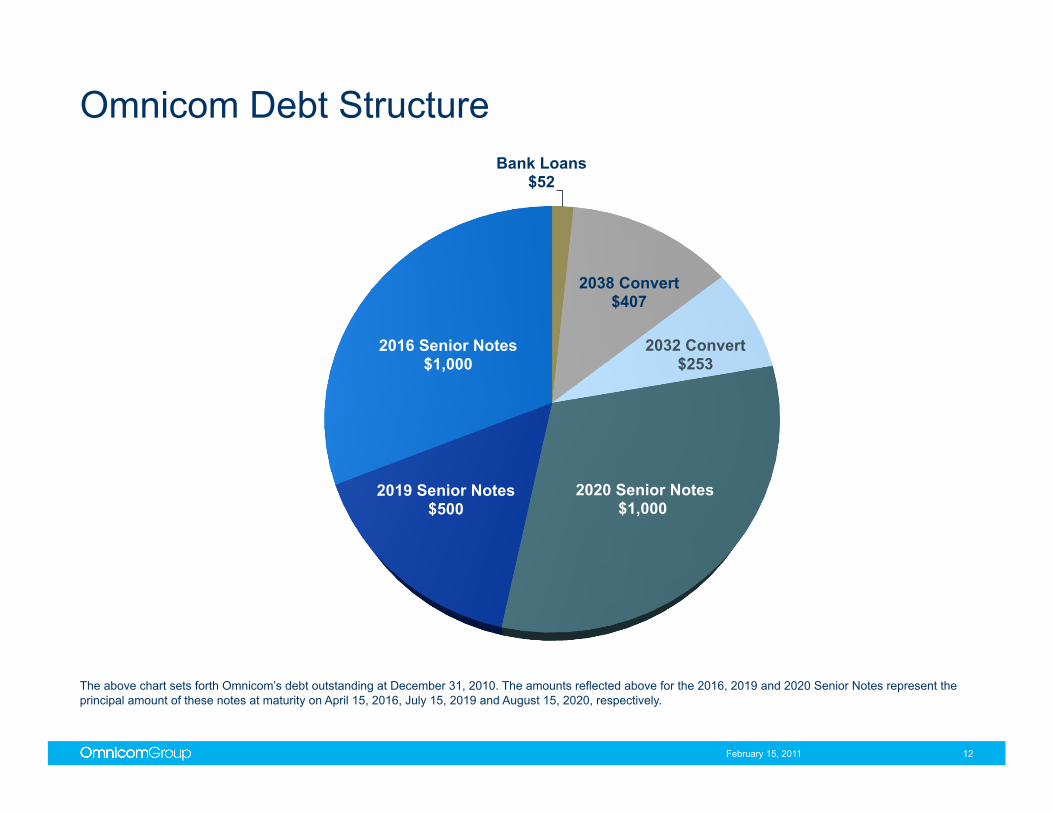
Omnicom Debt Structure
February 15, 2011 12
The above chart sets forth Omnicom’s debt outstanding at December 31, 2010. The amounts reflected above for the 2016, 2019 and 2020 Senior Notes represent the principal amount of these notes at maturity on April 15, 2016, July 15, 2019 and August 15, 2020, respectively.
Bank Loans $52
2038 Convert $407
2032 Convert $253
2020 Senior Notes $1,000
2019 Senior Notes $500
2016 Senior Notes $1,000
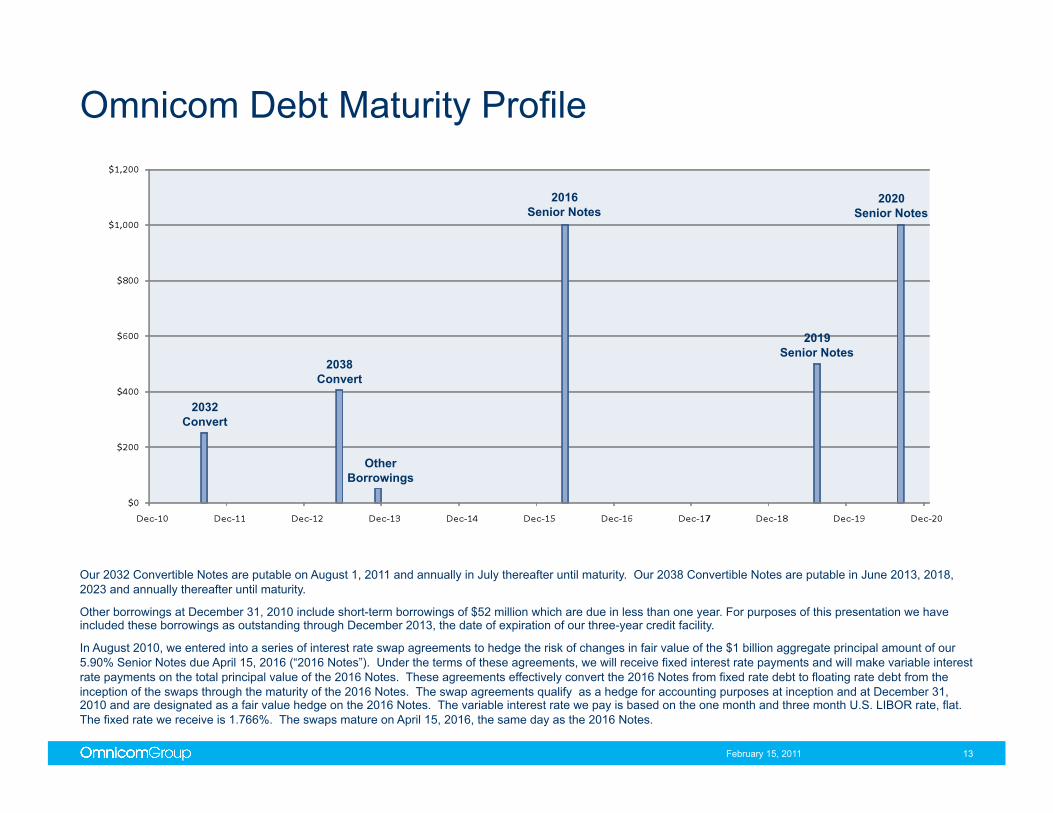
Omnicom Debt Maturity Profile
February 15, 2011 13
Our 2032 Convertible Notes are putable on August 1, 2011 and annually in July thereafter until maturity. Our 2038 Convertible Notes are putable in June 2013, 2018, 2023 and annually thereafter until maturity.
Other borrowings at December 31, 2010 include short-term borrowings of $52 million which are due in less than one year. For purposes of this presentation we have included these borrowings as outstanding through December 2013, the date of expiration of our three-year credit facility.
In August 2010, we entered into a series of interest rate swap agreements to hedge the risk of changes in fair value of the $1 billion aggregate principal amount of our 5.90% Senior Notes due April 15, 2016 (“2016 Notes”). Under the terms of these agreements, we will receive fixed interest rate payments and will make variable interest rate payments on the total principal value of the 2016 Notes. These agreements effectively convert the 2016 Notes from fixed rate debt to floating rate debt from the inception of the swaps through the maturity of the 2016 Notes. The swap agreements qualify as a hedge for accounting purposes at inception and at December 31, 2010 and are designated as a fair value hedge on the 2016 Notes. The variable interest rate we pay is based on the one month and three month U.S. LIBOR rate, flat. The fixed rate we receive is 1.766%. The swaps mature on April 15, 2016, the same day as the 2016 Notes.
2032 Convert
2038 Convert
2016 Senior Notes
Other Borrowings
2019 Senior Notes
2020 Senior Notes
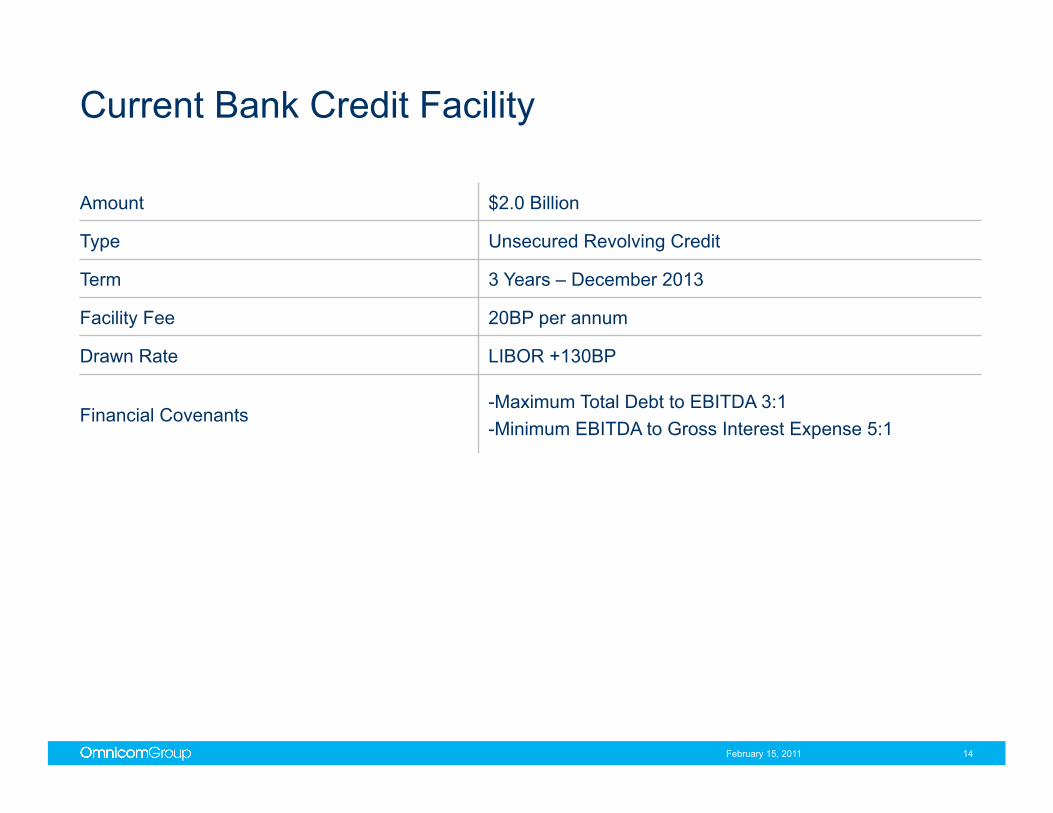
Current Bank Credit Facility
February 15, 2011 14
Amount $2.0 Billion
Type Unsecured Revolving Credit
Term 3 Years – December 2013
Facility Fee 20BP per annum
Drawn Rate LIBOR +130BP
Financial Covenants -Maximum Total Debt to EBITDA 3:1 -Minimum EBITDA to Gross Interest Expense 5:1
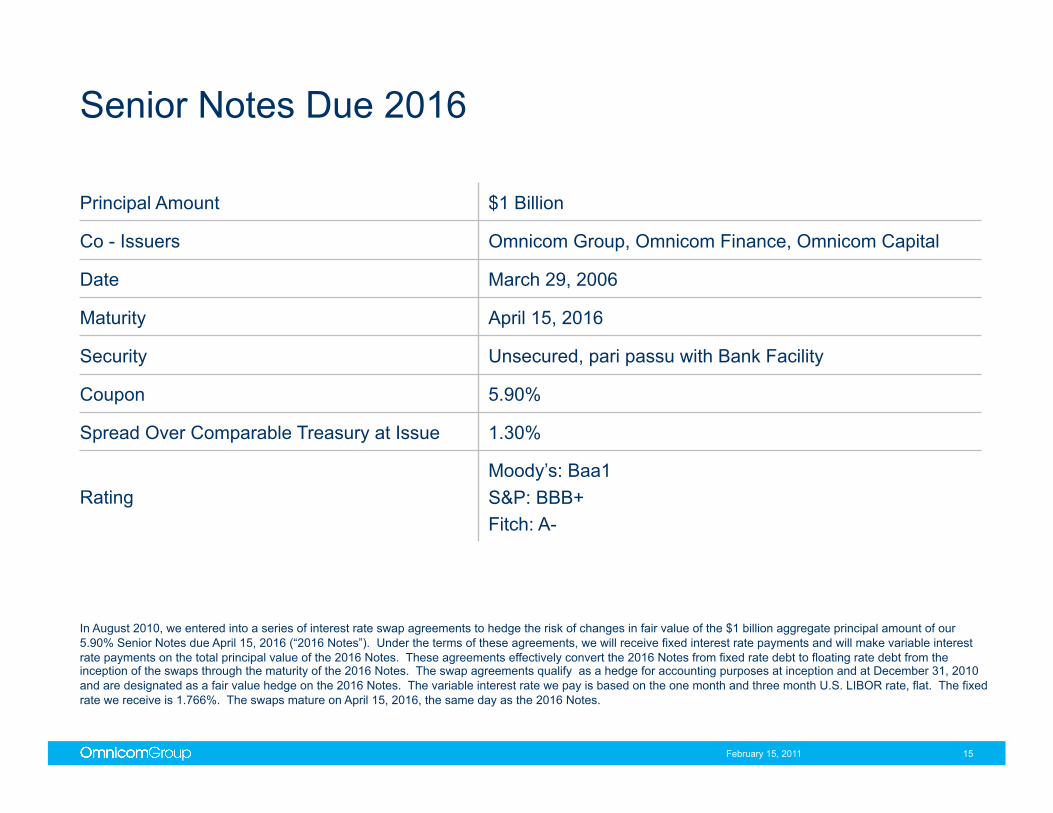
Senior Notes Due 2016
February 15, 2011 15
Principal Amount $1 Billion
Co - Issuers Omnicom Group, Omnicom Finance, Omnicom Capital
Date March 29, 2006
Maturity April 15, 2016
Security Unsecured, pari passu with Bank Facility
Coupon 5.90%
Spread Over Comparable Treasury at Issue 1.30%
Rating Moody’s: Baa1 S&P: BBB+ Fitch: A-
In August 2010, we entered into a series of interest rate swap agreements to hedge the risk of changes in fair value of the $1 billion aggregate principal amount of our 5.90% Senior Notes due April 15, 2016 (“2016 Notes”). Under the terms of these agreements, we will receive fixed interest rate payments and will make variable interest rate payments on the total principal value of the 2016 Notes. These agreements effectively convert the 2016 Notes from fixed rate debt to floating rate debt from the inception of the swaps through the maturity of the 2016 Notes. The swap agreements qualify as a hedge for accounting purposes at inception and at December 31, 2010 and are designated as a fair value hedge on the 2016 Notes. The variable interest rate we pay is based on the one month and three month U.S. LIBOR rate, flat. The fixed rate we receive is 1.766%. The swaps mature on April 15, 2016, the same day as the 2016 Notes.
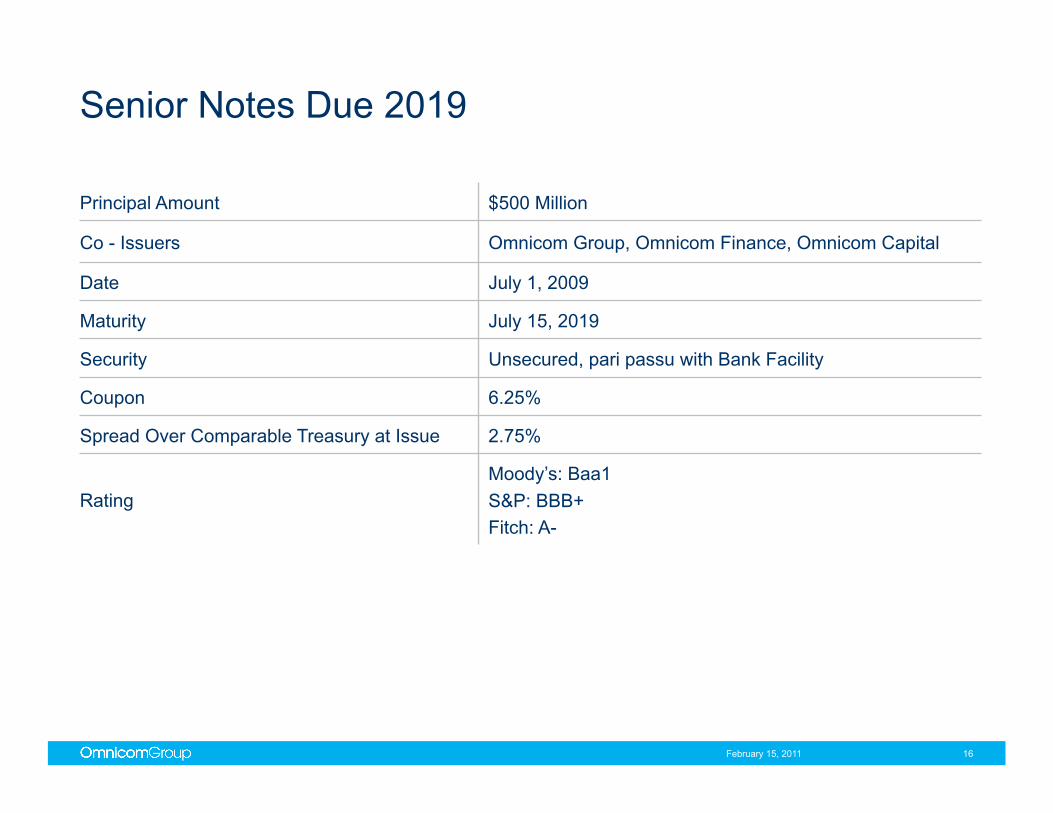
Senior Notes Due 2019
February 15, 2011 16
Principal Amount $500 Million
Co - Issuers Omnicom Group, Omnicom Finance, Omnicom Capital
Date July 1, 2009
Maturity July 15, 2019
Security Unsecured, pari passu with Bank Facility
Coupon 6.25%
Spread Over Comparable Treasury at Issue 2.75%
Rating Moody’s: Baa1 S&P: BBB+ Fitch: A-
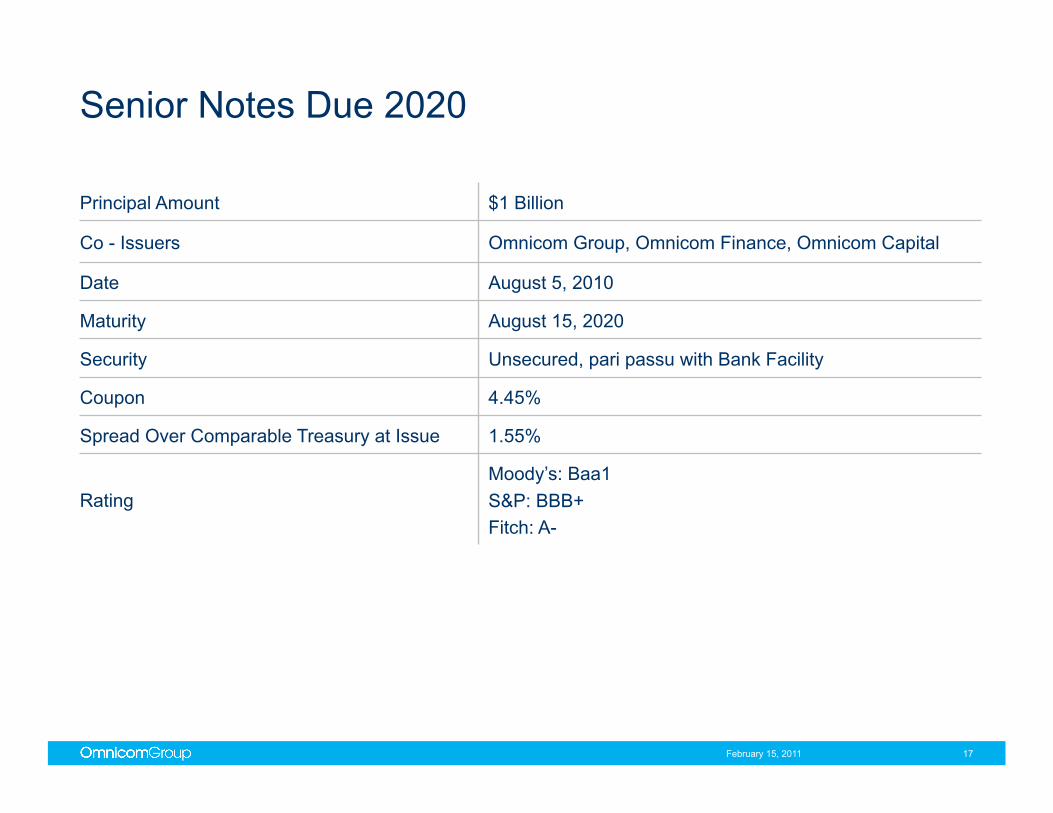
Senior Notes Due 2020
February 15, 2011 17
Principal Amount $1 Billion
Co - Issuers Omnicom Group, Omnicom Finance, Omnicom Capital
Date August 5, 2010
Maturity August 15, 2020
Security Unsecured, pari passu with Bank Facility
Coupon 4.45%
Spread Over Comparable Treasury at Issue 1.55%
Rating Moody’s: Baa1 S&P: BBB+ Fitch: A-
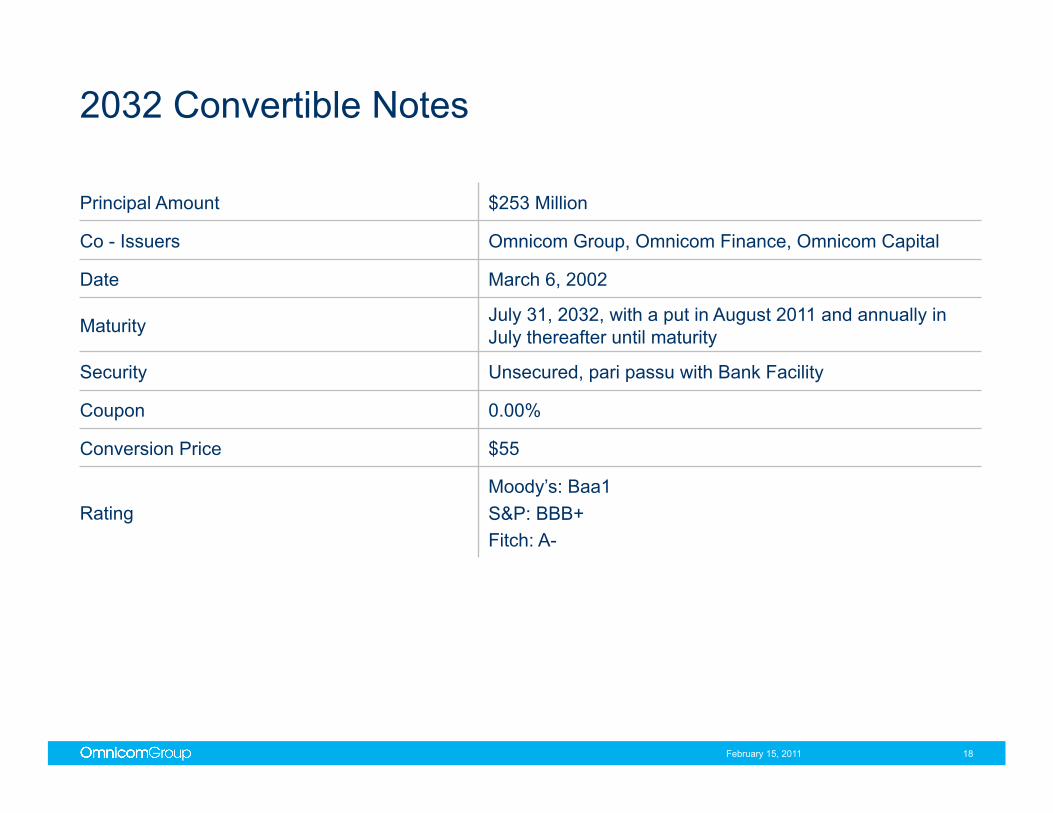
2032 Convertible Notes
February 15, 2011 18
Principal Amount $253 Million
Co - Issuers Omnicom Group, Omnicom Finance, Omnicom Capital
Date March 6, 2002
Maturity July 31, 2032, with a put in August 2011 and annually in July thereafter until maturity
Security Unsecured, pari passu with Bank Facility
Coupon 0.00%
Conversion Price $55
Rating Moody’s: Baa1 S&P: BBB+ Fitch: A-
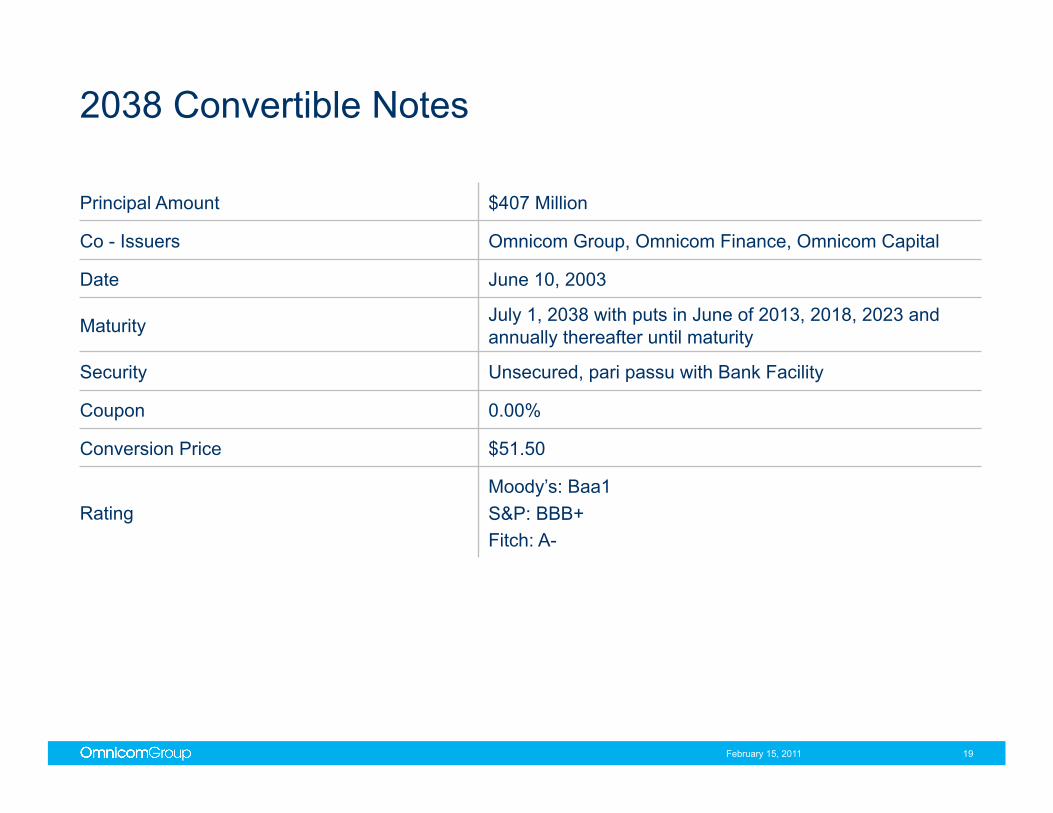
2038 Convertible Notes
February 15, 2011 19
Principal Amount $407 Million
Co - Issuers Omnicom Group, Omnicom Finance, Omnicom Capital
Date June 10, 2003
Maturity July 1, 2038 with puts in June of 2013, 2018, 2023 and annually thereafter until maturity
Security Unsecured, pari passu with Bank Facility
Coupon 0.00%
Conversion Price $51.50
Rating Moody’s: Baa1 S&P: BBB+ Fitch: A-
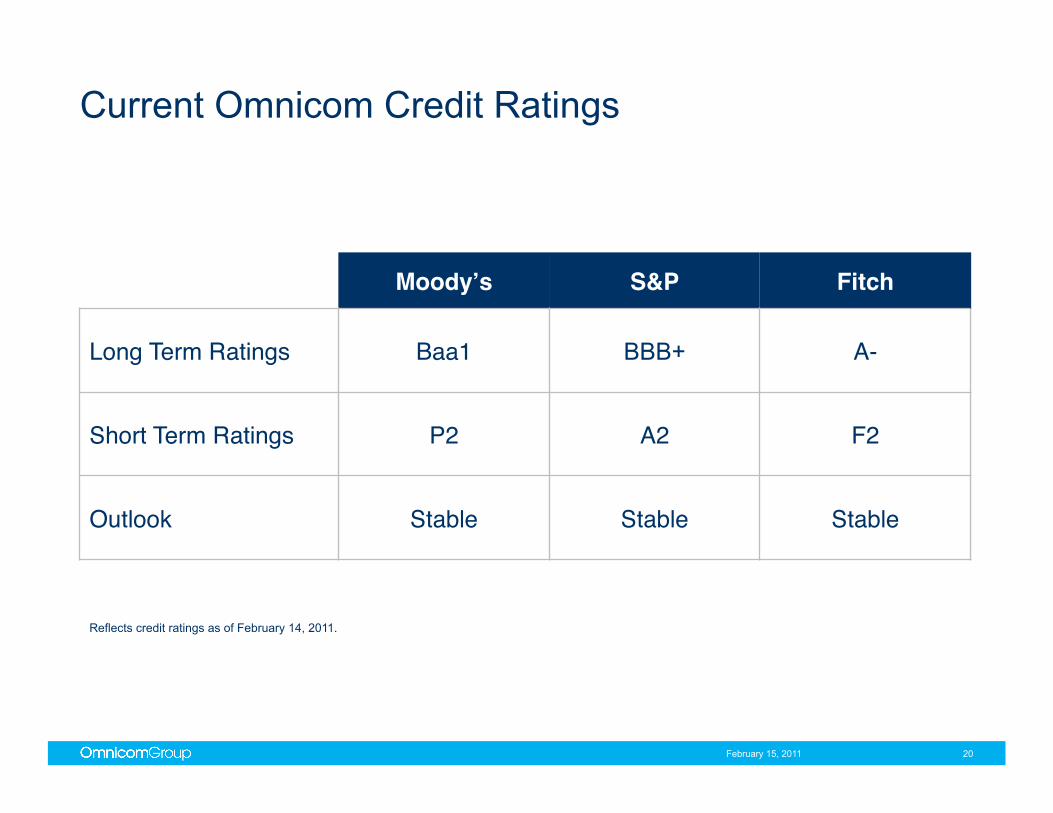
Current Omnicom Credit Ratings
February 15, 2011 20
Moodyʼs" S&P" Fitch"
Long Term Ratings" Baa1" BBB+" A-"
Short Term Ratings" P2" A2" F2"
Outlook" Stable" Stable" Stable"
Reflects credit ratings as of February 14, 2011.
Supplemental Financial Information
22
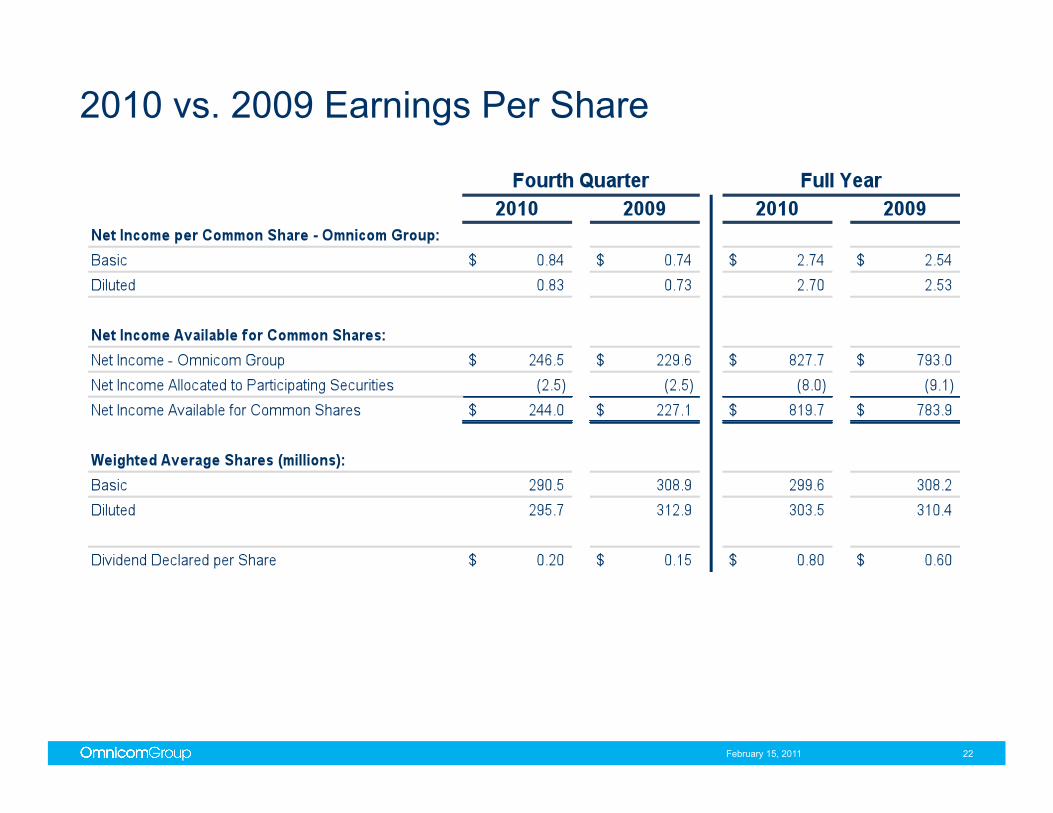
2010 vs. 2009 Earnings Per Share
February 15, 2011
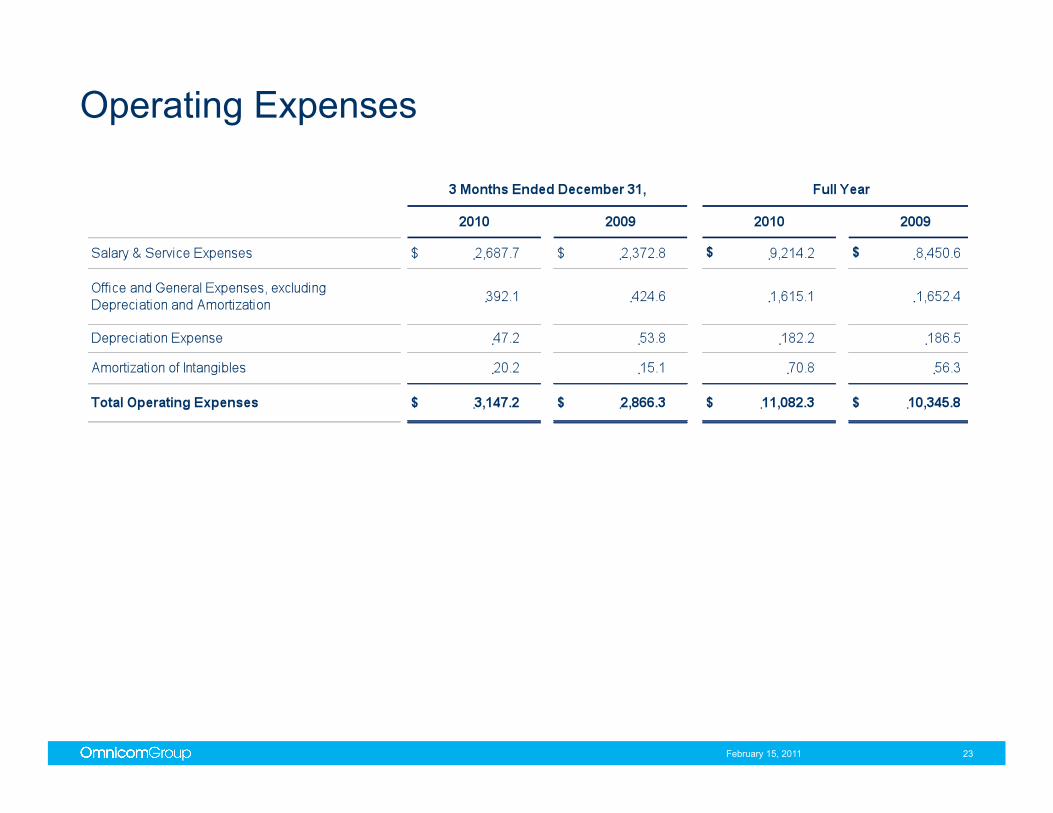
Operating Expenses
February 15, 2011 23
24
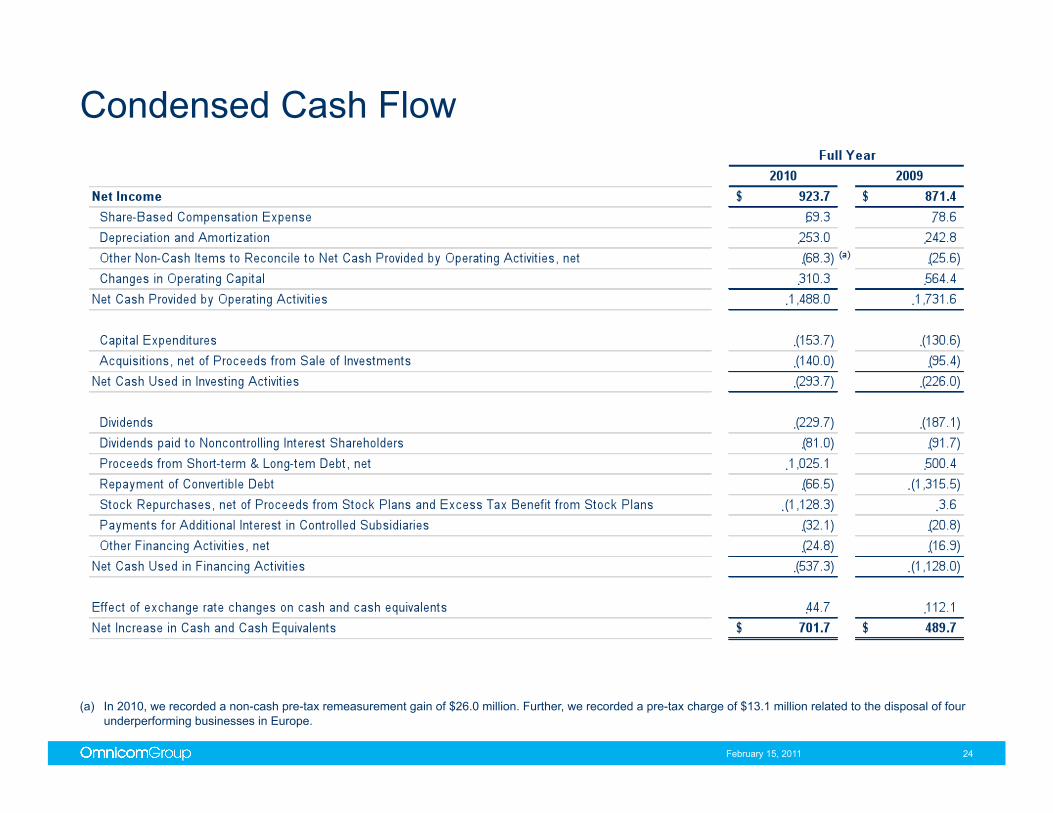
Condensed Cash Flow
February 15, 2011
(a) In 2010, we recorded a non-cash pre-tax remeasurement gain of $26.0 million. Further, we recorded a pre-tax charge of $13.1 million related to the disposal of four underperforming businesses in Europe.
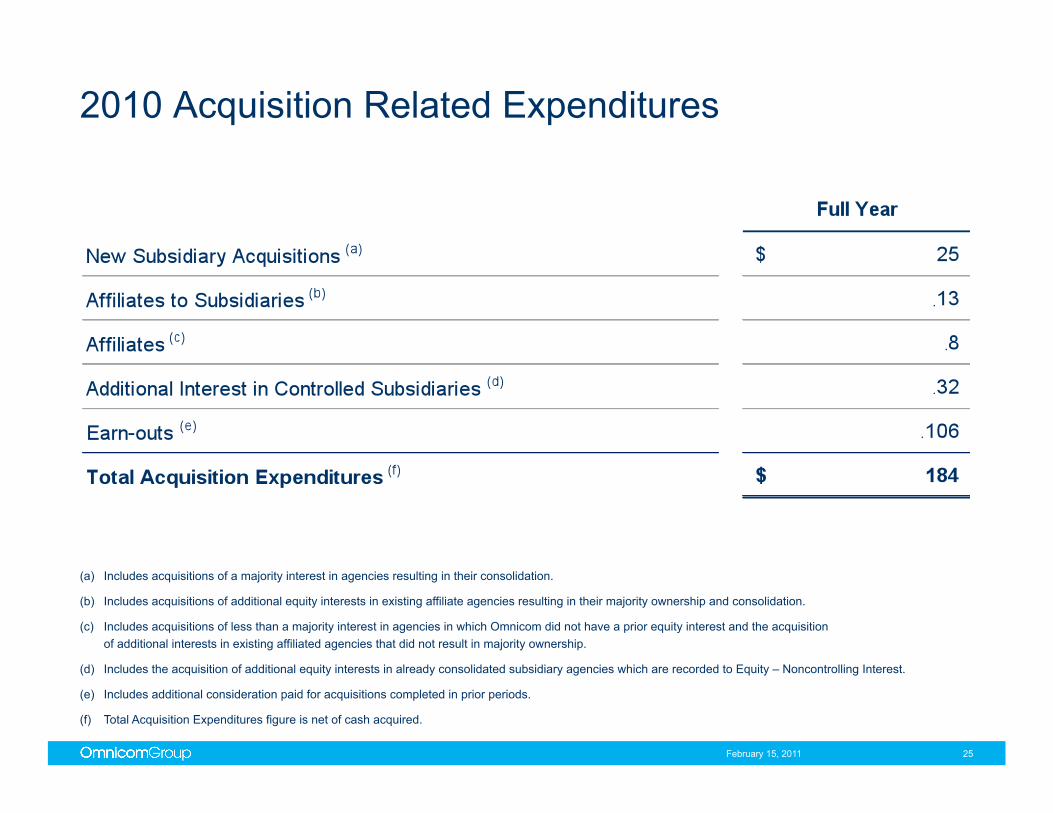
2010 Acquisition Related Expenditures
February 15, 2011 25
(a) Includes acquisitions of a majority interest in agencies resulting in their consolidation.
(b) Includes acquisitions of additional equity interests in existing affiliate agencies resulting in their majority ownership and consolidation.
(c) Includes acquisitions of less than a majority interest in agencies in which Omnicom did not have a prior equity interest and the acquisition of additional interests in existing affiliated agencies that did not result in majority ownership.
(d) Includes the acquisition of additional equity interests in already consolidated subsidiary agencies which are recorded to Equity – Noncontrolling Interest.
(e) Includes additional consideration paid for acquisitions completed in prior periods.
(f) Total Acquisition Expenditures figure is net of cash acquired.
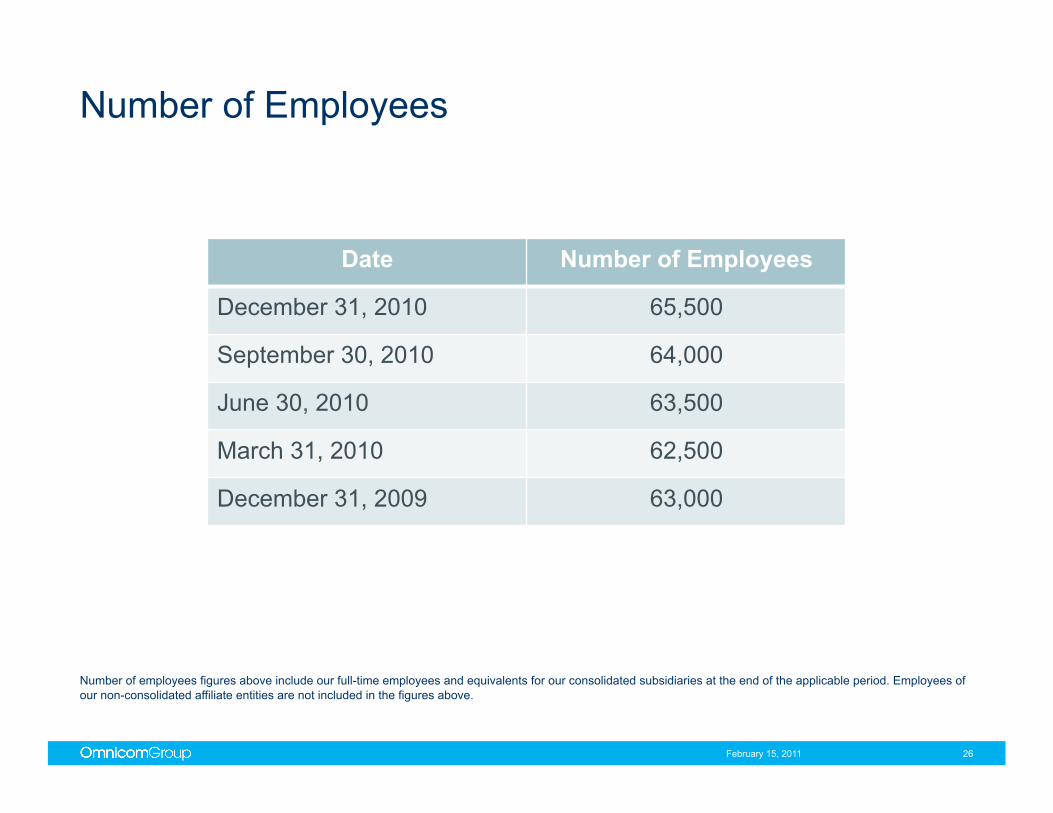
Number of Employees
February 15, 2011 26
Date Number of Employees
December 31, 2010 65,500
September 30, 2010 64,000
June 30, 2010 63,500
March 31, 2010 62,500
December 31, 2009 63,000
Number of employees figures above include our full-time employees and equivalents for our consolidated subsidiaries at the end of the applicable period. Employees of our non-consolidated affiliate entities are not included in the figures above.
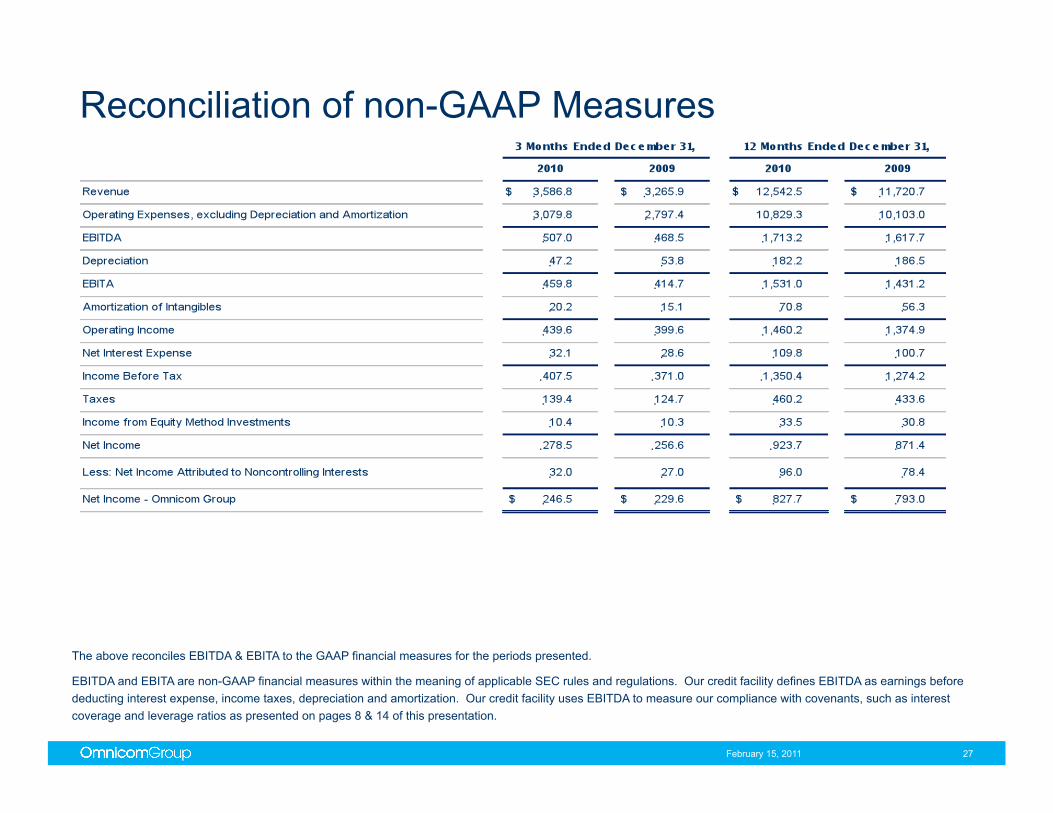
Reconciliation of non-GAAP Measures
February 15, 2011 27
The above reconciles EBITDA & EBITA to the GAAP financial measures for the periods presented.
EBITDA and EBITA are non-GAAP financial measures within the meaning of applicable SEC rules and regulations. Our credit facility defines EBITDA as earnings before deducting interest expense, income taxes, depreciation and amortization. Our credit facility uses EBITDA to measure our compliance with covenants, such as interest coverage and leverage ratios as presented on pages 8 & 14 of this presentation.
28
Reconciliation of non-GAAP Measures
February 15, 2011

Fourth Quarter Acquisition
February 15, 2011 29
The Core is an award-winning design and communications agency. Founded in 1990, The Core offers clients a range of services including branding, packaging design, innovation and advertising.
Located in London, Hull and Leeds, UK, The Core will operate as an aligned agency of Hornall Anderson within the Diversified Agency Services network.
L
Fourth Quarter Acquisition
February 15, 2011 30
Excerpta Medica is a full service medical communications agency. Its portfolio of strategic communications services includes publication planning, medical meetings and education, interactive solutions and customized publishing solutions.
With offices in Amsterdam, London and New Jersey, Excerpta Medica will operate as part of the Adelphi Group of companies within the Diversified Agency Services network.
L

Fourth Quarter Acquisition
February 15, 2011 31
Art Meets Commerce Interactive is a “new media” agency, specializing in the Theatre industry. Founded in 2007, Art Meets Commerce crafts innovative campaigns that attract new audiences, keep current customers interested and increase sales through social networking, email marketing, promotional campaigns, fan engagement and community building. Services include website design and development, copywriting, flash animation and video integration, content creation and management, statistical analysis, usability consultation and regular site maintenance.
Art Meets Commerce is based in New York, New York and will align with Serino Coyne within the Diversified Agency Services network.
L
Fourth Quarter Acquisition
February 15, 2011 32
Nancy Bailey & Associates is a full-service licensing agency that was established in 1982 specializing in the development and management of corporate licensing programs, primarily for Fortune 100 companies.
Nancy Bailey & Associates is headquartered in Atlanta, Georgia and will be part of the Beanstalk Group within the Diversified Agency Services network.
L
Fourth Quarter Acquisition
February 15, 2011 33
The Modellers is a high-end analytics and advanced quantitative design, analysis and programming group that was established in 1998. The Modellers specialize in product line optimization, marketing mix analysis, customer satisfaction and brand positioning for a broad range of industries including technology, banking, food & beverage, entertainment, travel, government and pharmaceutical.
The Modellers is headquartered in Salt Lake City, Utah and will operate within the Diversified Agency Services network.
L
Fourth Quarter Acquisition
February 15, 2011 34
Ketchum, a leading global public relations consultancy, purchased a controlling interest in its operations in Greater China. The company has recognized expertise in corporate communications, public affairs, issues and crisis management and the technology sector throughout the Greater China region.
Headquarters for Ketchum Greater China is in Hong Kong, with offices in Beijing, Shanghai, Guangzhou, China and Taipei, Taiwan. Ketchum is a subsidiary within the Diversified Agency Services network.
L

Fourth Quarter Acquisition
February 15, 2011 35
Maslov PR is a full-service public relations company specializing in brand marketing, corporate and technology disciplines. The company provides strategic counsel to a number of multinational clients in the areas of brand marketing communications, public affairs, crisis communications, issues management, reputation management, internal communications and investor relations.
The Company is located in Moscow, Russia and will operate as part of Ketchum within the Diversified Agency Services network.
L
Fourth Quarter Acquisition
February 15, 2011 36
DDB purchased a controlling interest in DDB Colombia Group. The company has operated as an affiliate of the DDB network since 1998, and is a fully integrated marketing services group; with expertise in direct marketing and CRM, digital advertising, public relations, mobile marketing, events, promotions and strategic consulting.
The company is headquartered in Bogota, Colombia and has additional offices in Medellin and Cali.
L