four scenarios for the future of the massachusetts...
TRANSCRIPT
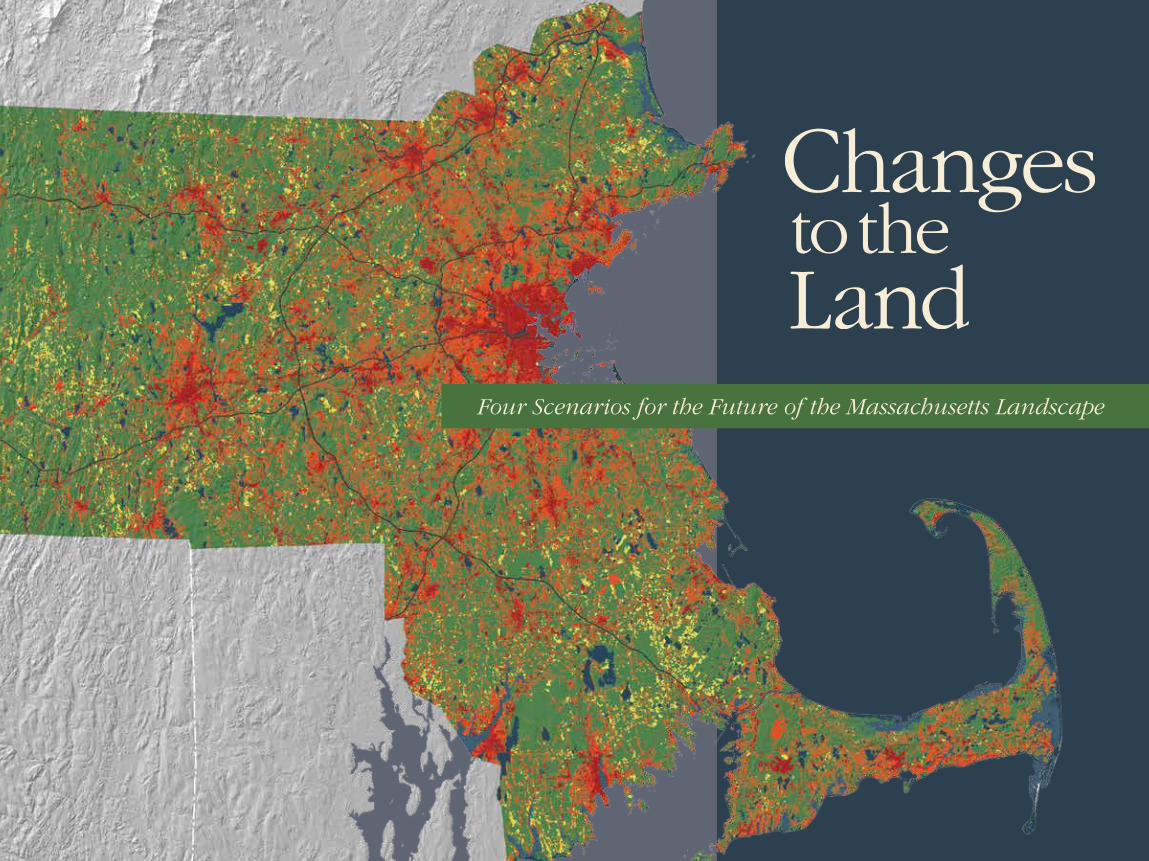
Four Scenarios for the Future of the Massachusetts Landscape

Preface
The Early Massachusetts Landscape Although a peopled land, for more than 10,000 years, Massachusetts was overwhelmingly a forested land. Then in the nineteenth century, European settlers displaced native people and transformed the land, steadily converting most forests to farms. The remaining forests were cut for fuel wood, charcoal, potash, lumber, furniture, pulp, and paper (Foster and Aber 2004, Donahue 2004). As farming peaked in the mid-nineteenth century, forests began to return through the process that Henry David Thoreau called “the succession of forest trees” (Foster 1999). Through the late 19th and 20th centuries, New England industrialized and agriculture shifted to other parts of the globe (Donahue 1999). As hundreds of thousands of acres in Massachusetts and New England farmland were abandoned, forests reclaimed the land.
The Regreening of Massachusetts and New England Today, forests cover just over 60 percent of Massachusetts, ranking it eighth nationwide in forest cover (Alerich 2000). Importantly, more than 75% of the forestland is privately owned. Across the state, forests contain more wood than at any time in the past 200 years (MISER 2002, Berlik et al. 2002). The “regreening” of Massachusetts provides a second chance to determine the fate of the forests and their balance with farmland and development (McKibben 1995). Indeed, for the first time since agricultural abandonment in the mid-1800s, Massachusetts and the five other New England states are again losing forest cover (Figure 1). Each year, thousands of acres of Massachusetts’ forests and fields are lost to subdivisions, commercial development, and roads. This “hard deforestation” process is much harder to reverse than the historic clearing of land for farms and pasture.
Year
New England Population
0
10
20
30
40
50
60
70
80
90
100
1,600,000
0
3,200,000
4,800,000
6,400,000
8,000,000
11,200,000
12,800,000
14,400,000
16,000,000
1600 1650 1700 1750 1800 1850 1900 1950 2000
Fore
st C
over
(per
cen
tag
e of
sta
te)
9,600,000
Pop
ulat
ion
Connecticut
Maine
Massachusetts
New Hampshire
Rhode Island
Vermont
All New England (% of all six states)
Forest Cover and Population Change in New England
FIGURE 1: Long-term trends in forest cover and human population in the six New England states shows that even as the population grew, forest cover increased between 1850 and the early 2000s. In recent years, forest cover has again declined due to conversion of forests to developed land.
The Wildlands and Woodlands Vision
Mill
ion
s of
Acr
es
Year
1951 1971 1985 2005 2013 2030 2050
5
4
3
2
1
0
Recent Land Cover Change
After Proposed Protection
All Other Types
Developed
Unprotected Forest
Protected Forest
Developed
Woodlands
Wildlands
100
50
0
Lan
d in
Mas
sach
uset
ts (%
)
FIGURE 2: The Wildlands and Woodlands vision for Massachusetts calls for increasing the forest area that is protected from development to 2.5 million acres, which still leaves room for a doubling of land development.
The Wildlands and Woodlands Vision Recognizing that Massachusetts and New England were at a turning point, a group of Harvard Forest colleagues formulated a long-term conservation vision for the Commonwealth (Foster et al. 2005) and for the region (Foster et al. 2010). Wildlands and Woodlands: A Vision or the Forests of Massachusetts argues that the existing protected forest land base of one million acres should be increased to 2.5 million acres of forest, an area equal to half of the State’s land area (Figure 2). The protected forestlands would be held by predominantly by private landowners and would be comprised of expansive woodlands managed for diverse purposes, punctuated by large wildland reserves left to shaping by natural processes. The vision holds that sustainably managed private woodlands are a central part of the region’s history, identity, and economy (Foster et al. 2010). It argues that curtailing local sustainable wood production in order to “protect nature,” while continuing to convert forests to development and increase the harvest of more fragile forests elsewhere, perpetuates an “illusion of preservation” (cf. Berlik et al. 2002, Foster et al. 2010). The Wildlands and Woodlands goals build on region’s pioneering conservation tradition to maintain and enhance the extraordinary environmental, social, and economic values of the forested landscape. Rarely does history provide us with second chances of such magnitude and promise. Looking to the Future After the publication of the first Wildlands and Woodlands report in 2005, many people asked — what would this look like, what would it accomplish, and how does it compare to other landscape visions? To tackle these questions, a team of collaborators including natural resource professionals from across Massachusetts and scientists from the Harvard Forest and the Smithsonian Institution initiated the “Massachusetts Landscape Scenarios Project.” This report details the process, results, and implications of that two-year study.
C o n n e c t i c u t R h o d e I s l a n d
N e w H a m p s h i r eV e r m o n t
N e w Y o r k
Forest
Mixed-Use
Agriculture
ResidentialTotal Acreage in the State
Becket
Boston
Worcester
Springfield
Spencer
North
Andover
Cape Cod Bay
Total Acreage in the State
0 10 20 30 50 miles
Interstate
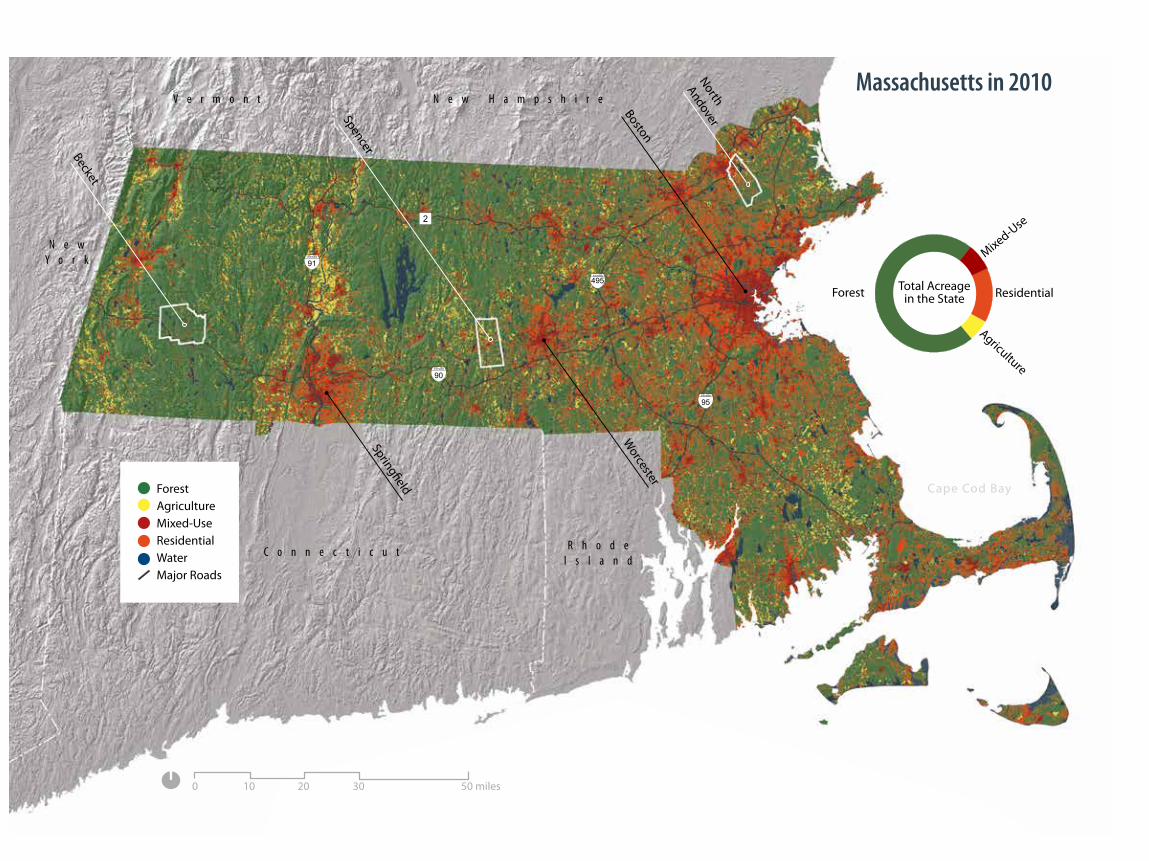
Massachusetts in 2010
ForestAgricultureMixed-UseResidentialWaterMajor Roads
Forest
Agriculture
Mixed-Use
Residential
Water
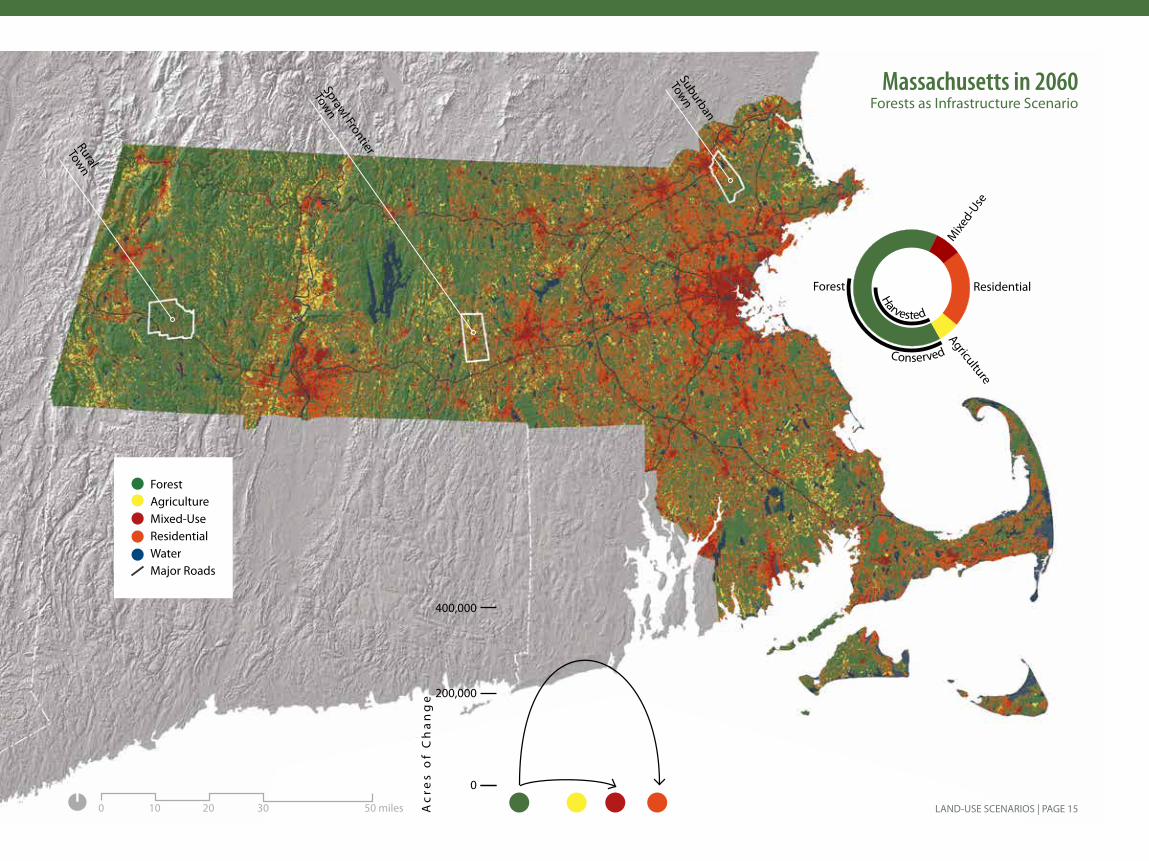
Guide for Readers This report presents the results of the collaborative landscape scenarios project led by the Harvard Forest. As a research effort, the project is unique for its two-way exchange with natural resource and conservation professionals and for its emphasis on evaluating the different views of future land use developed by non-scientists. The scenarios are not a set of formal predictions or recommendations by the authors, rather they represent a set of contrasting views of the future that are simulated using cutting-edge land-use and ecosystem models. The results provide insight and information to guide land-use policy and conservation decisions. The layout of this report enables readers to open the front flap and fold it over the left-hand page to compare state-level landscape conditions in 2010 with the simulated landscape in 2060 under each of the four scenarios on pages 8, 10, 12, and 14. By opening the flap readers may also compare town-level changes under 2010 and 2060 conditions.
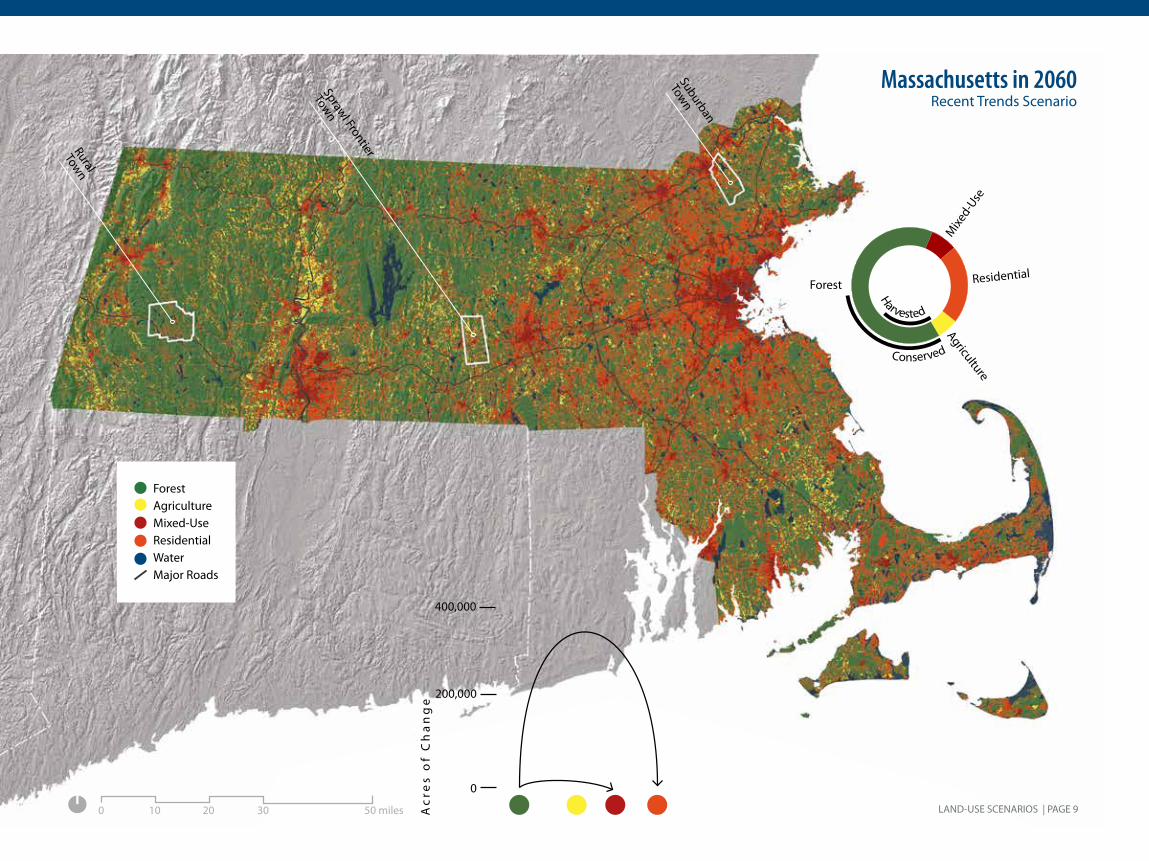
State Land Cover Maps The land cover maps used in this report are derived from a Massachusetts statewide, seamless digital dataset of land cover, created using semi-automated methods, and based on 0.5-meter resolution digital ortho imagery acquired in 2005 and published by MassGIS in 2009. For this study, the map was used to represent the initial condition for the simulations — ostensibly year 2010. It was resampled to 50-meter resolution and the forty land cover codes were reclassified into the five shown below. In this classification scheme, “mixed-use” refers to compact residential development together with commercial and industrial development.
Land Cover Figures The land cover figure to the right of the state map is called an “annular diagram.” It depicts the proportion of the landscape that exists in each of the four major land cover classes: forest, agriculture, residential development, and mixed-use development. For forest lands, the fraction that is conserved and the fraction that is harvested at least once in the 50-year simulation period are also shown. The figure below the state map in each of the scenarios shows the changes in land cover out of forest and into residential, mixed-use, and agricultural land. The height, or amplitude, of the line reflects the acres of change.
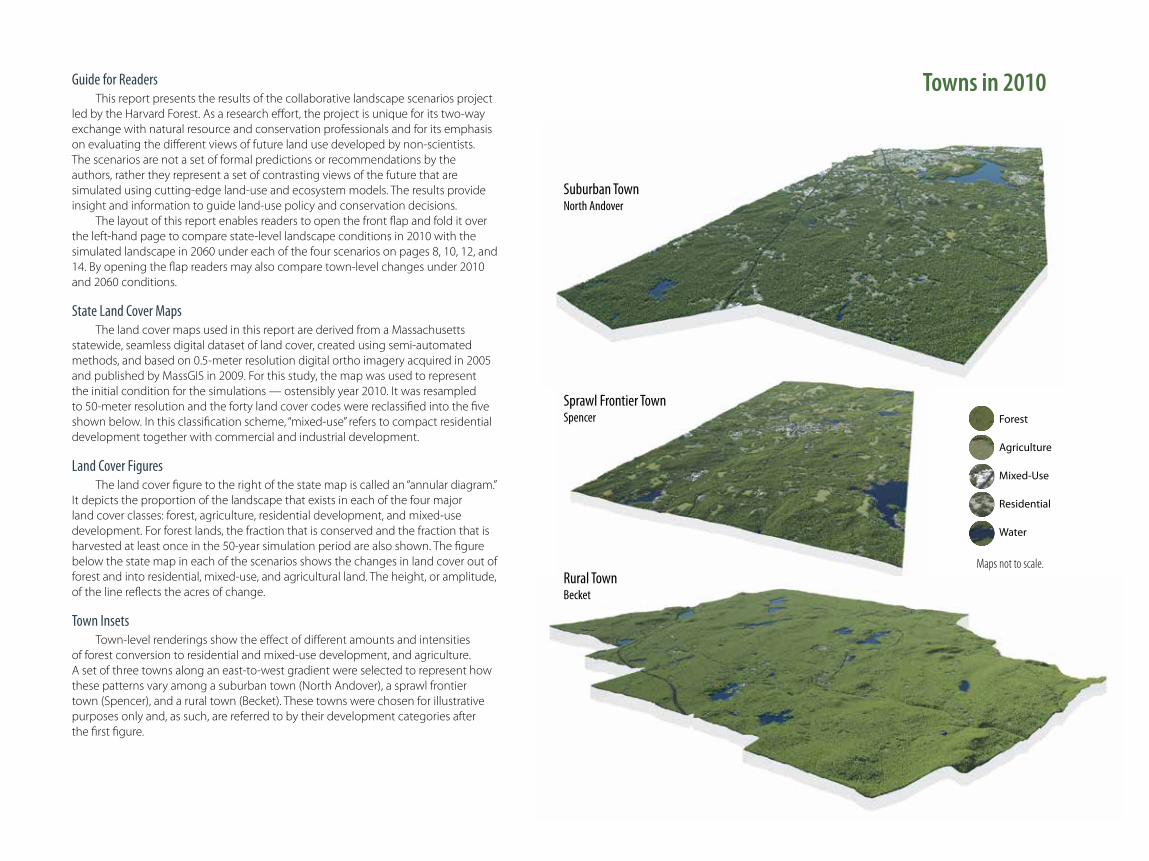
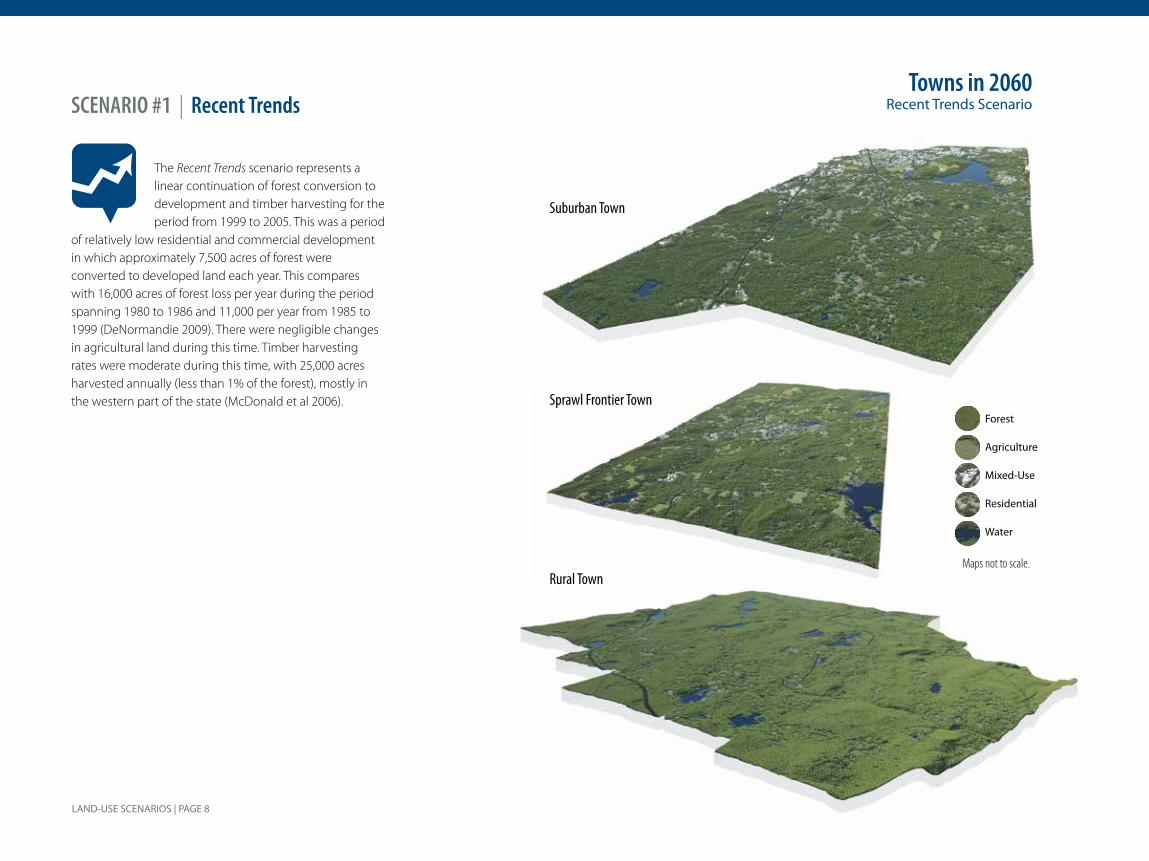
Town Insets Town-level renderings show the effect of different amounts and intensities of forest conversion to residential and mixed-use development, and agriculture. A set of three towns along an east-to-west gradient were selected to represent how these patterns vary among a suburban town (North Andover), a sprawl frontier town (Spencer), and a rural town (Becket). These towns were chosen for illustrative purposes only and, as such, are referred to by their development categories after the first figure.
Rural Town Becket
Sprawl Frontier Town Spencer
Suburban Town North Andover
Maps not to scale.
Towns in 2010

Changes to the LandFour Scenarios for the Future of the Massachusetts Landscape
Harvard Forest, Harvard UniversityPetersham, Massachusetts
Jonathan Thompson, Kathy Fallon Lambert, David Foster, Meghan Blumstein, Eben Broadbent, Angelica Almeyda Zambrano
2014
LAND-USE SCENARIOS | PAGE 2
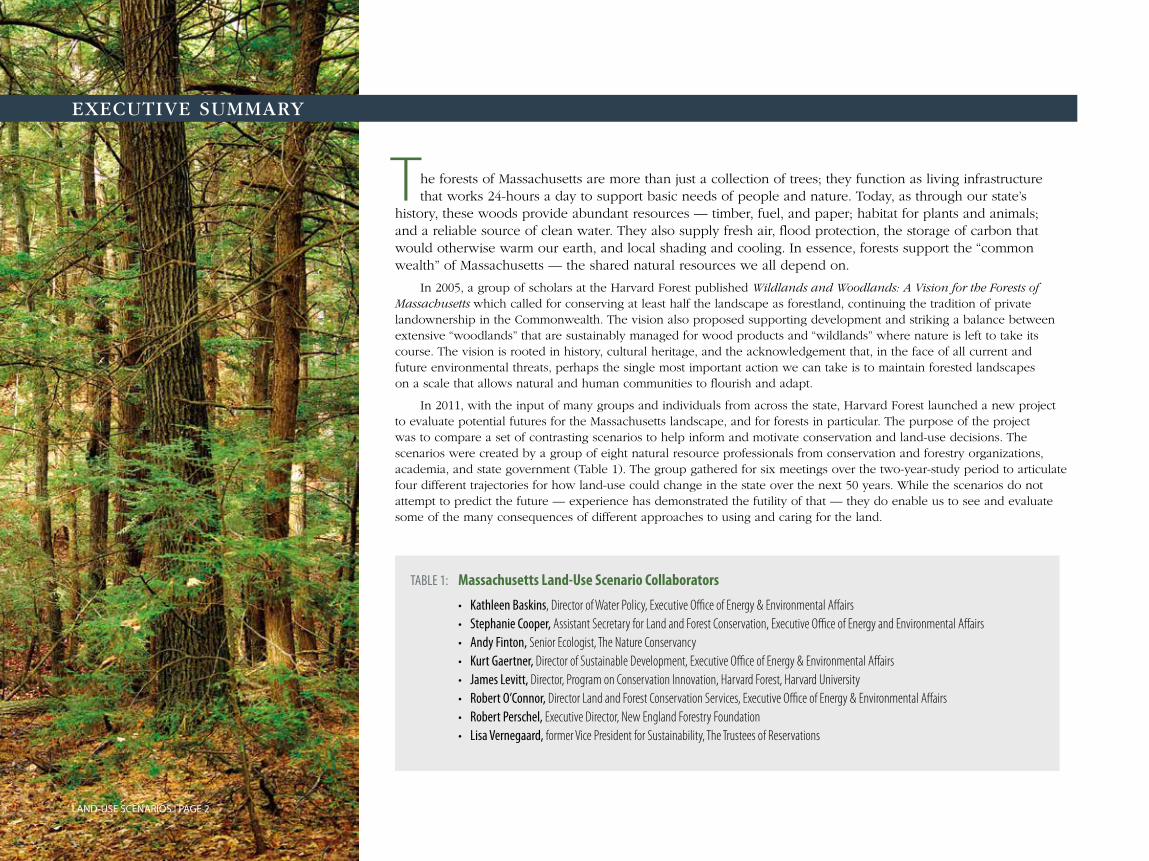
he forests of Massachusetts are more than just a collection of trees; they function as living infrastructure that works 24-hours a day to support basic needs of people and nature. Today, as through our state’s history, these woods provide abundant resources — timber, fuel, and paper; habitat for plants and animals; and a reliable source of clean water. They also supply fresh air, flood protection, the storage of carbon that would otherwise warm our earth, and local shading and cooling. In essence, forests support the “common wealth” of Massachusetts — the shared natural resources we all depend on.
In 2005, a group of scholars at the Harvard Forest published Wildlands and Woodlands: A Vision for the Forests of Massachusetts which called for conserving at least half the landscape as forestland, continuing the tradition of private landownership in the Commonwealth. The vision also proposed supporting development and striking a balance between extensive “woodlands” that are sustainably managed for wood products and “wildlands” where nature is left to take its course. The vision is rooted in history, cultural heritage, and the acknowledgement that, in the face of all current and future environmental threats, perhaps the single most important action we can take is to maintain forested landscapes on a scale that allows natural and human communities to flourish and adapt.
In 2011, with the input of many groups and individuals from across the state, Harvard Forest launched a new project to evaluate potential futures for the Massachusetts landscape, and for forests in particular. The purpose of the project was to compare a set of contrasting scenarios to help inform and motivate conservation and land-use decisions. The scenarios were created by a group of eight natural resource professionals from conservation and forestry organizations, academia, and state government (Table 1). The group gathered for six meetings over the two-year-study period to articulate four different trajectories for how land-use could change in the state over the next 50 years. While the scenarios do not attempt to predict the future — experience has demonstrated the futility of that — they do enable us to see and evaluate some of the many consequences of different approaches to using and caring for the land.
EXECUTIVE SUMMARY
T
TABLE 1: Massachusetts Land-Use Scenario Collaborators
• Kathleen Baskins, Director of Water Policy, Executive Office of Energy & Environmental Affairs • Stephanie Cooper, Assistant Secretary for Land and Forest Conservation, Executive Office of Energy and Environmental Affairs • Andy Finton, Senior Ecologist, The Nature Conservancy • Kurt Gaertner, Director of Sustainable Development, Executive Office of Energy & Environmental Affairs • James Levitt, Director, Program on Conservation Innovation, Harvard Forest, Harvard University • Robert O’Connor, Director Land and Forest Conservation Services, Executive Office of Energy & Environmental Affairs • Robert Perschel, Executive Director, New England Forestry Foundation • Lisa Vernegaard, former Vice President for Sustainability, The Trustees of Reservations
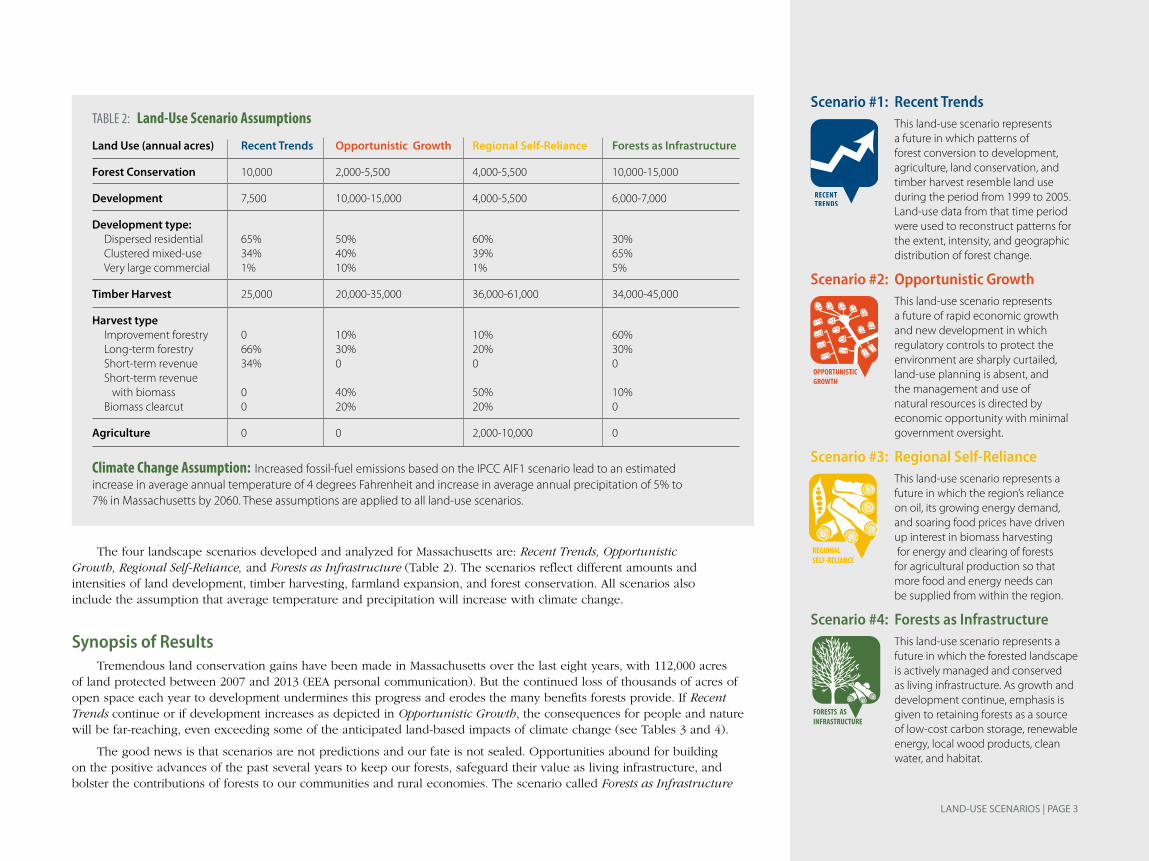
Scenario #1: Recent TrendsThis land-use scenario represents a future in which patterns of forest conversion to development, agriculture, land conservation, and timber harvest resemble land use during the period from 1999 to 2005. Land-use data from that time period were used to reconstruct patterns for the extent, intensity, and geographic distribution of forest change.
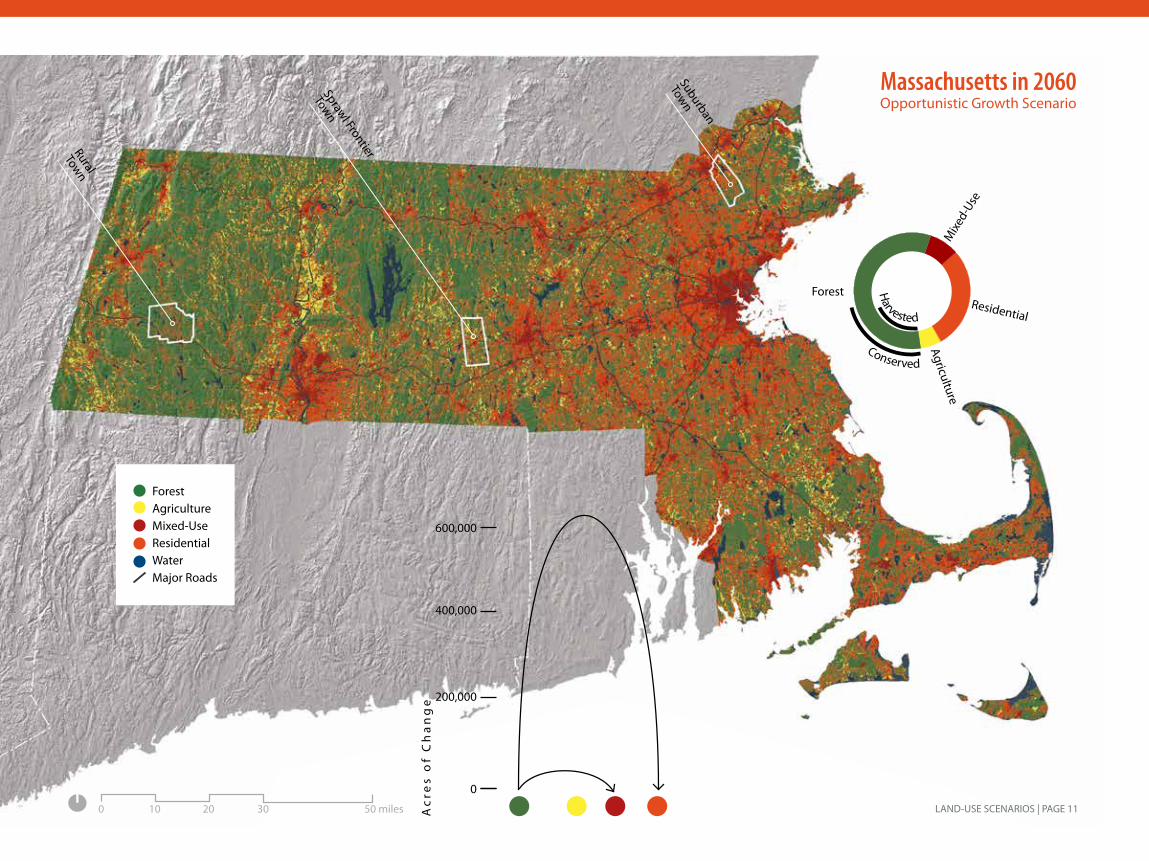
Scenario #2: Opportunistic Growth This land-use scenario represents a future of rapid economic growth and new development in which regulatory controls to protect the environment are sharply curtailed, land-use planning is absent, and the management and use of natural resources is directed by economic opportunity with minimal government oversight.
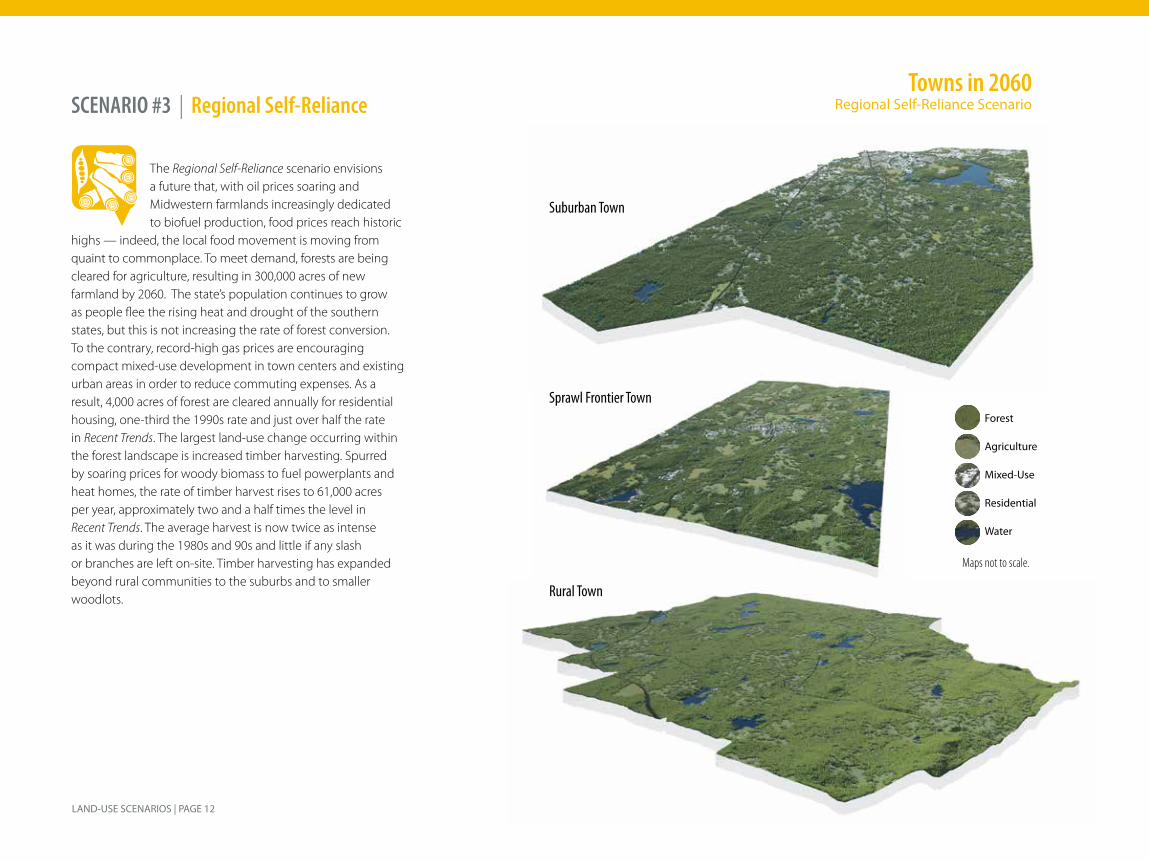
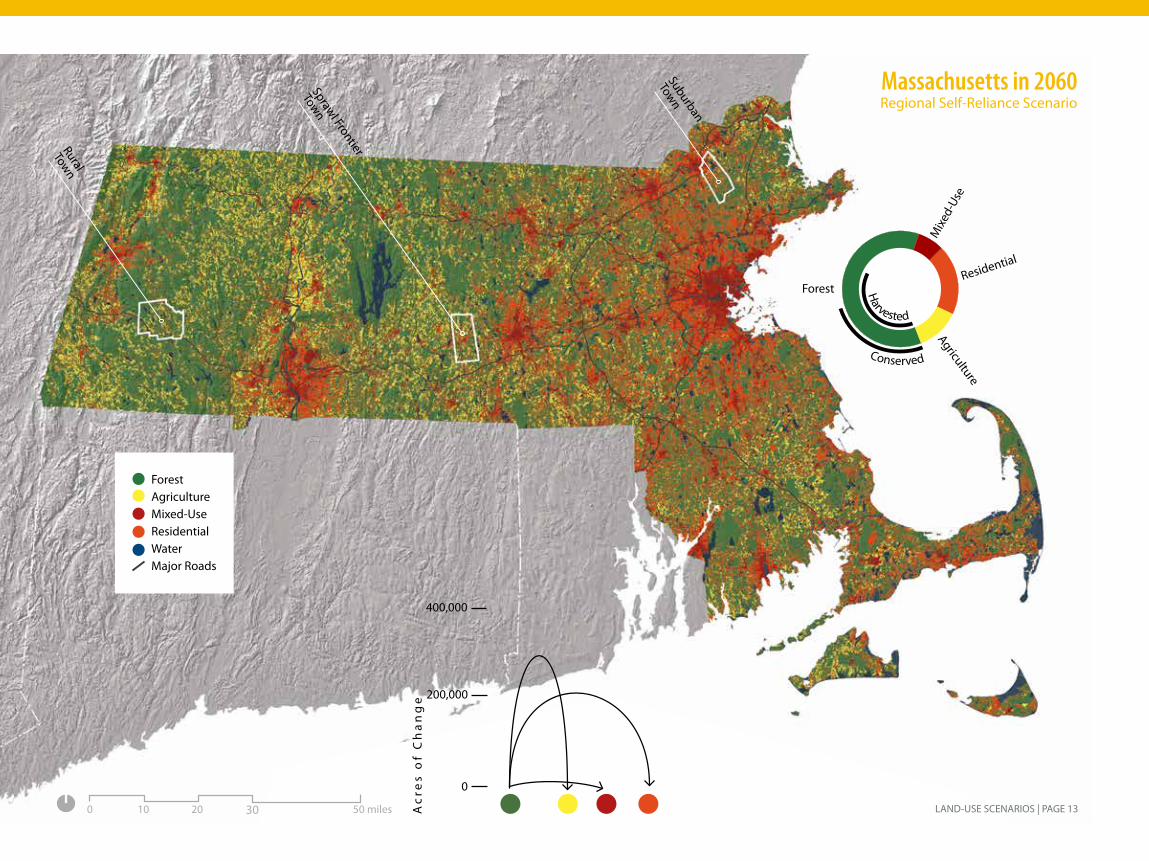
Scenario #3: Regional Self-Reliance This land-use scenario represents a future in which the region’s reliance on oil, its growing energy demand, and soaring food prices have driven up interest in biomass harvesting for energy and clearing of forests for agricultural production so that more food and energy needs can be supplied from within the region.
Scenario #4: Forests as Infrastructure This land-use scenario represents a future in which the forested landscape is actively managed and conserved as living infrastructure. As growth and development continue, emphasis is given to retaining forests as a source of low-cost carbon storage, renewable energy, local wood products, clean water, and habitat.
TABLE 2: Land-Use Scenario Assumptions
Land Use (annual acres) Recent Trends Opportunistic Growth Regional Self-Reliance Forests as Infrastructure
Forest Conservation 10,000 2,000-5,500 4,000-5,500 10,000-15,000
Development 7,500 10,000-15,000 4,000-5,500 6,000-7,000
Development type: Dispersed residential 65% 50% 60% 30%Clustered mixed-use 34% 40% 39% 65%Very large commercial 1% 10% 1% 5%
Timber Harvest 25,000 20,000-35,000 36,000-61,000 34,000-45,000
Harvest type Improvement forestry 0 10% 10% 60%Long-term forestry 66% 30% 20% 30%Short-term revenue 34% 0 0 0Short-term revenue with biomass 0 40% 50% 10%Biomass clearcut 0 20% 20% 0
Agriculture 0 0 2,000-10,000 0
The four landscape scenarios developed and analyzed for Massachusetts are: Recent Trends, Opportunistic Growth, Regional Self-Reliance, and Forests as Infrastructure (Table 2). The scenarios reflect different amounts and intensities of land development, timber harvesting, farmland expansion, and forest conservation. All scenarios also include the assumption that average temperature and precipitation will increase with climate change.
Synopsis of Results Tremendous land conservation gains have been made in Massachusetts over the last eight years, with 112,000 acres of land protected between 2007 and 2013 (EEA personal communication). But the continued loss of thousands of acres of open space each year to development undermines this progress and erodes the many benefits forests provide. If Recent Trends continue or if development increases as depicted in Opportunistic Growth, the consequences for people and nature will be far-reaching, even exceeding some of the anticipated land-based impacts of climate change (see Tables 3 and 4).
The good news is that scenarios are not predictions and our fate is not sealed. Opportunities abound for building on the positive advances of the past several years to keep our forests, safeguard their value as living infrastructure, and bolster the contributions of forests to our communities and rural economies. The scenario called Forests as Infrastructure
Climate Change Assumption: Increased fossil-fuel emissions based on the IPCC AIF1 scenario lead to an estimated increase in average annual temperature of 4 degrees Fahrenheit and increase in average annual precipitation of 5% to 7% in Massachusetts by 2060. These assumptions are applied to all land-use scenarios.
LAND-USE SCENARIOS | PAGE 3

LAND-USE SCENARIOS | PAGE 4
incorporates nearly the same amount of development as Recent Trends but doubles the percentage that occurs as clustered development. It also raises the rate of timber harvest by 70% but implements “improvement forestry” on two-thirds of the harvested acres (see Box 2). Finally, it increases the rate of forest conservation by 30% from 2005 levels and targets two-thirds of that to “priority habitat.” By 2060, the land-use decisions reflected in the Forests as Infrastructure scenario yield profound benefits to people and nature.
• In the woods, the Forests as Infrastructure scenario yields a 20% increase in tree species with high commercial and wildlife value, twice as much local wood harvested, and a 35% increase in the amount of carbon stored in forests from the 2010 baseline (nearly the same as Recent Trends).
• For water resources, Forests as Infrastructure results in less impervious area than Recent Trends, protects water quality, and limits stormwater and flooding issues by holding the increase in annual runoff to less than 10% in virtually all watersheds.
• In terms of habitat, Forests as Infrastructure results in 25% less forest fragmentation, conserves 750,000 acres of forest for a variety of uses including forestry, and protects 280,000 more acres of priority forest habitat than Recent Trends.
While not explicitly quantified in this study, the direct and substantial benefits of the Forests as Infrastructure scenario, and the land-use choices and policies they represent, help to strengthen rural economies, enhance the vitality of cities, and increase the resilience of towns and communities to climate change.
Key Findings
1. The Forests as Infrastructure scenario ranks first among the four land-use scenarios in terms of the benefits provided to people and nature.
The Forests as Infrastructure scenario increases the pace of conservation, expands sustainable forestry, and implements proactive more clustered development than the other land-use scenarios. Those choices lead to the highest ranking for seven out of the nine nature-based benefits and outcomes analyzed (Table 3). Recent Trends ranks second overall, followed by Regional Self-Reliance and Opportunistic Growth.
2. Targeted and accelerated land conservation protects approximately 550,000 additional acres of priority forest habitat and limits forest habitat degradation and fragmentation.
Approximately 10,000 acres of land per year were conserved between 1999 and 2005. State-funded land conservation has since increased to an average of 17,000 acres per year, with around 12,000 acres as forestland (EOEA 2013). The Forests as Infrastructure scenario protects 15,000 acres of forestland per year and targets two-thirds of all new forest conservation to “priority habitat.” This targeted and accelerated conservation protects more than half a million acres of priority habitat by 2060, compared to 265,000 acres in Recent Trends. Given the continued conversion of forests to development, all scenarios degrade forest habitat somewhat and increase fragmentation but this is lowest in Forests as Infrastructure.
3. The widespread adoption of “improvement forestry” maintains critical forest benefits while supporting increased local wood production.
The Forests as Infrastructure scenario employs “improvement forestry” practices suggested by forestry experts and increase harvesting to as much as 45,000 acres per year from 25,000 acres per year in Recent Trends. These forest management choices result in twice as much local wood harvested with only a slight (4%) decrease in amount of carbon stored in the forest that helps mitigate climate change, at the end of the 50-year period. These forestry practices
LAND-USE SCENARIOS | PAGE 5
also select for and increase high timber quality and tree species with high economic and ecological value. In contrast, the extensive harvesting and agricultural expansion in the Regional Self-Reliance scenario and the permanent loss of forests to development in Opportunistic Growth leads to much lower levels of stored forest carbon. The results suggest that, given the current extent and condition of forests in Massachusetts, more wood can be sustainably harvested while also supporting critical forest benefits and conservation objectives.
4. Clustered development concentrated near existing cities and towns minimizes forest loss and reduces the impact of growth on water resources and forest habitat.
Under Forests as Infrastructure, nearly the same amount of development occurs as in Recent Trends but two-thirds takes the form of clustered development. As a result, it uses land more efficiently, reduces growth impacts, and maintains more benefits for people and nature. By 2060, only one watershed experiences more than a 10% increase in surface water runoff with associated stormwater and flooding risks in Forests as Infrastructure, compared to six in Recent Trends and 25 in Opportunistic Growth. In addition, 25% less forest area is fragmented into small patches than in Recent Trends. The results for some urban watersheds point to the need to retain green space within areas of compact development to minimize adverse effects on water quality.
5. The loss of forests to development has more immediate and pronounced impacts on several nature-based benefits than the gradual forest changes due to average increases in temperature and precipitation associated with climate change.
An analysis of Recent Trends shows that, over a 50-year period, the loss of forests to development has greater impacts on carbon storage and water quality than shifts in forest composition and growth associated with climate change. The analysis is based on anticipated increases in average annual temperature and precipitation. Climate change has a greater impact on water runoff than land use in Recent Trends. But land-use nearly doubles the estimated increase in annual water runoff from climate change in Opportunistic Growth. The results underscore the influence that local land-use decisions have on the capacity of our forests to help offset greenhouse gas emissions and moderate the effects of climate change.
Policy Implications The results of the Massachusetts scenario study demonstrate that the consequences of our land-use choices will be profound, exceeding some of the serious impacts of climate change. As the Recent Trends scenario shows, land conservation and land-use policies during the period from 1999 to 2005 yield many important benefits to people and nature. But the extensive and relatively young forests in the state offer tremendous opportunities for enhancing these benefits and further minimizing the impacts of growth. The results show how land conservation, clustered development near cities and town centers, and sustainable forestry are highly compatible and yield multiple benefits to society. While no single scenario is intended as a formal set of recommendations, the policy implications from the scenario results are clear. The people of Massachusetts have much to gain from conserving forests and managing them well by: (1) recommitting to land conservation, (2) redoubling land-use policy and smart-growth efforts, and (3) promoting sustainable forestry in the Commonwealth.
Changes to the Land: Four Scenarios for the Future of the Massachusetts Landscape elaborates on these conservation and policy directions by detailing the results of the four land-use scenarios in the year 2060. As we consider the fate of the Commonwealth’s land resources, perhaps the knowledge gained from these scenarios can inform and galvanize support for land-use action at a scale commensurate with the opportunity presented by the remarkable return of the forests of Massachusetts.
W
LAND-USE SCENARIOS | PAGE 6
LAND USE: PAST, PRESENT, AND FUTURE
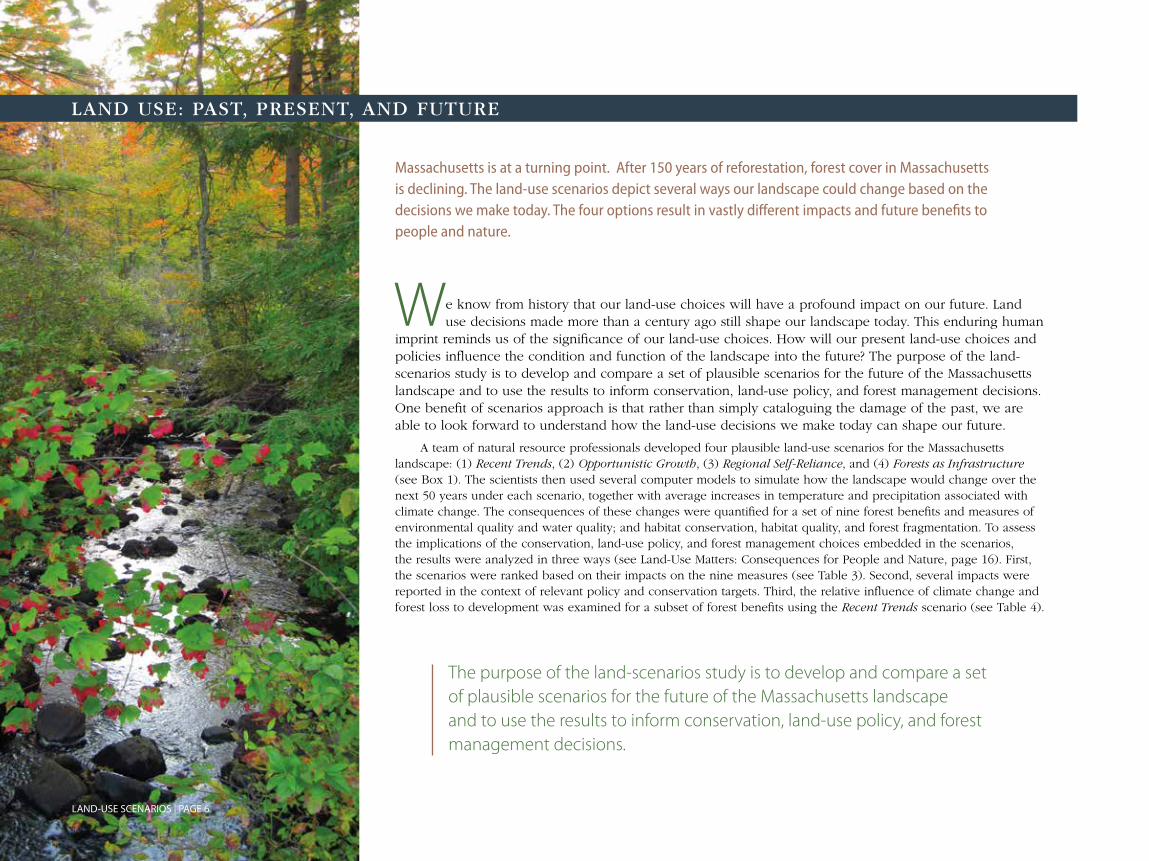
Massachusetts is at a turning point. After 150 years of reforestation, forest cover in Massachusetts is declining. The land-use scenarios depict several ways our landscape could change based on the decisions we make today. The four options result in vastly different impacts and future benefits to people and nature.
e know from history that our land-use choices will have a profound impact on our future. Land use decisions made more than a century ago still shape our landscape today. This enduring human imprint reminds us of the significance of our land-use choices. How will our present land-use choices and policies influence the condition and function of the landscape into the future? The purpose of the land-scenarios study is to develop and compare a set of plausible scenarios for the future of the Massachusetts landscape and to use the results to inform conservation, land-use policy, and forest management decisions. One benefit of scenarios approach is that rather than simply cataloguing the damage of the past, we are able to look forward to understand how the land-use decisions we make today can shape our future.
A team of natural resource professionals developed four plausible land-use scenarios for the Massachusetts landscape: (1) Recent Trends, (2) Opportunistic Growth, (3) Regional Self-Reliance, and (4) Forests as Infrastructure (see Box 1). The scientists then used several computer models to simulate how the landscape would change over the next 50 years under each scenario, together with average increases in temperature and precipitation associated with climate change. The consequences of these changes were quantified for a set of nine forest benefits and measures of environmental quality and water quality; and habitat conservation, habitat quality, and forest fragmentation. To assess the implications of the conservation, land-use policy, and forest management choices embedded in the scenarios, the results were analyzed in three ways (see Land-Use Matters: Consequences for People and Nature, page 16). First, the scenarios were ranked based on their impacts on the nine measures (see Table 3). Second, several impacts were reported in the context of relevant policy and conservation targets. Third, the relative influence of climate change and forest loss to development was examined for a subset of forest benefits using the Recent Trends scenario (see Table 4).
The purpose of the land-scenarios study is to develop and compare a set of plausible scenarios for the future of the Massachusetts landscape and to use the results to inform conservation, land-use policy, and forest management decisions.

LAND-USE SCENARIOS | PAGE 7
BOX 1: What Are Land-Use Scenarios?
cenarios are not predictions of the future or a set of land-use recommendations. They are set of “what ifs…” that represent contrasting visions for the future of the Massachusetts landscape. As such, scenarios make it possible to evaluate the potential consequences of different land-use choices. The process of creating and analyzing scenarios starts with the development of narratives about how the future might unfold. These narratives are created by a team of natural resource professionals to reflect different assumptions concerning economic and regulatory conditions, as well as contrasting views on how societal values might change over time. The narratives also embed different bundles of policy and landowner decisions consistent with those assumptions.
The Massachusetts scenario project started with data that quantified land-use and conservation trends during the period from 1999 to 2005 (the most recent time period for which comprehensive data were available). This information included the amount, intensity, and location of all new development, harvesting, land protection, and farmland expansion in the state. With these patterns as a baseline, the team of natural resource professionals then brainstormed how these patterns might change over the next fifty years. These pathways of change were distilled into three different land-use “scenarios” for the future. After the narratives for the scenarios were articulated, the team developed a set of specific prescriptions for the amount, distribution, and intensity of different land uses that would occur within each scenario.
Next, the scientists translated the land-use assumptions for each scenario into a set of land cover and land-use change maps and worked with collaborators to ensure the maps accurately represented their scenario assumptions. A modified version of a landscape model LANDIS-II (Scheller et al. 2007) was used to simulate how the landscape would change over the next 50 years under each of the four scenarios. The model simulates land cover changes as well as shifts in tree species composition, growth, and interactions among the 25 most common tree species in Massachusetts (Thompson et al. 2011). Changes in climate were incorporated in all of the scenarios based on greenhouse gas emissions estimates from the Intergovernmental Panel on Climate Change for a fossil fuel intensive future (Nakicenovic 2000). Climate change was simulated based on the results of locally scaled estimates of changes in average temperature and precipitation in the Northeast (Hayhoe et al. 2008, Northeast Climate Impacts Assessment Group 2013).
To quantify the changes in the nine nature-based benefits (i.e., ecosystem services), the scientists further analyzed the LANDIS-II output and used a second computer model called InVEST (Integrated Valuation of Environmental Services and Tradeoffs; Tallis et al. 2013). InVEST estimates changes in water runoff, nitrogen and phosphorus export, and other ecosystem services with changes in land cover and land use. InVEST was modified for use with LANDIS-II and parameterized using values from the scientific literature to reflect conditions in the Northeast.
S
LAND-USE SCENARIOS | PAGE 8
SCENARIO #1 | Recent Trends
The Recent Trends scenario represents a linear continuation of forest conversion to development and timber harvesting for the period from 1999 to 2005. This was a period
of relatively low residential and commercial development in which approximately 7,500 acres of forest were converted to developed land each year. This compares with 16,000 acres of forest loss per year during the period spanning 1980 to 1986 and 11,000 per year from 1985 to 1999 (DeNormandie 2009). There were negligible changes in agricultural land during this time. Timber harvesting rates were moderate during this time, with 25,000 acres harvested annually (less than 1% of the forest), mostly in the western part of the state (McDonald et al 2006). Sprawl Frontier Town
Suburban Town
Rural Town
Forest
Agriculture
Mixed-Use
Residential
Water
Maps not to scale.
Towns in 2060 Recent Trends Scenario
Ac
res
of
Ch
an
ge
200,000
0
400,000
Suburban
Town
Sprawl Frontier
Town
Rural
Town
Conserved
Forest
Mixe
d-Use
Agriculture
ResidentialHarvested
0 10 20 30 50 miles
Massachusetts in 2060 Recent Trends Scenario
LAND-USE SCENARIOSLAND-USE SCE-
NARIOS LAND-USE SCENARIOS | PAGE 9
ForestAgricultureMixed-UseResidentialWaterMajor Roads

LAND-USE SCENARIOS | PAGE 10
SCENARIO #2 | Opportunistic Growth
The Opportunistic Growth scenario envisions a future of dramatic economic growth and few environmental constraints. State government is rolling back environmental regulations, land-use
planning, and business taxes while incentivizing new commercial development and expanded markets for natural resources. The surging economy is driving up the rates at which forests are converted to development beyond that of the boom times of the 1990s and twice that of Recent Trends. By 2020, forest conversion reaches and plateaus at a rate of 15,000 acres per year. The most intensive development is occurring along the “sprawl frontier” (DeNormandie 2009), which is advancing westward. Overall, development is highly dispersed and many rural areas are experiencing development for commuters and second homes. Large commercial development is five times as common as it was in the 1990s (i.e., new development that removes 2.5 acres or more of trees now equals 10% of the total developed land area). Residential housing is often constructed in large-lot subdivisions. To reduce government’s influence, some of the state-owned conservation land is sold back to private owners, mostly in the eastern part of the state where development pressure is most intense. In addition, the courts are allowing private conservation easements to be nullified and roughly 600 acres per year of previously protected forest are converted to developed uses. Wetland protections are lifted in 2020, opening most to new development. There are few new conservation easements on private land and these tend to be small and disaggregated. Forest harvesting is affected, too. Biomass energy and associated large-scale power and dispersed heating plants are initially incentivized, which results in more frequent and more intense timber harvests, particularly in rural western Massachusetts. However, by 2025, an influx in of wood from outside the region and a surplus of wood coming from forest conversion to development eventually depresses woody biomass markets, resulting in lower levels of forest harvesting than in 2010.
Forest
Agriculture
Mixed-Use
Residential
Water
Rural Town
Sprawl Frontier Town
Suburban Town
Maps not to scale.
Towns in 2060 Opportunistic Growth Scenario
Forest
Mix
ed-U
se
Agriculture
Residential
Conserved
Ac
res
of
Ch
an
ge
0
400,000
200,000
600,000
Suburban
Town
Sprawl Frontier
Town
Rural
Town
Harvested
0 10 20 30 50 miles
Massachusetts in 2060 Opportunistic Growth Scenario
LAND-USE SCENARIOS | PAGE 11
ForestAgricultureMixed-UseResidentialWaterMajor Roads
LAND-USE SCENARIOS | PAGE 12
SCENARIO #3 | Regional Self-Reliance
The Regional Self-Reliance scenario envisions a future that, with oil prices soaring and Midwestern farmlands increasingly dedicated to biofuel production, food prices reach historic
highs — indeed, the local food movement is moving from quaint to commonplace. To meet demand, forests are being cleared for agriculture, resulting in 300,000 acres of new farmland by 2060. The state’s population continues to grow as people flee the rising heat and drought of the southern states, but this is not increasing the rate of forest conversion. To the contrary, record-high gas prices are encouraging compact mixed-use development in town centers and existing urban areas in order to reduce commuting expenses. As a result, 4,000 acres of forest are cleared annually for residential housing, one-third the 1990s rate and just over half the rate in Recent Trends. The largest land-use change occurring within the forest landscape is increased timber harvesting. Spurred by soaring prices for woody biomass to fuel powerplants and heat homes, the rate of timber harvest rises to 61,000 acres per year, approximately two and a half times the level in Recent Trends. The average harvest is now twice as intense as it was during the 1980s and 90s and little if any slash or branches are left on-site. Timber harvesting has expanded beyond rural communities to the suburbs and to smaller woodlots.
Forest
Agriculture
Mixed-Use
Residential
Water
Rural Town
Sprawl Frontier Town
Suburban Town
Maps not to scale.
Towns in 2060 Regional Self-Reliance Scenario
Forest
Mix
ed-U
se
Agriculture
Residential
Conserved
Ac
res
of
Ch
an
ge 200,000
0
400,000
Suburban
Town
Sprawl Frontier
Town
Rural
Town
Harvested
0 10 20 30 50 miles LAND-USE SCENARIOS | PAGE 13
ForestAgricultureMixed-UseResidentialWaterMajor Roads
Massachusetts in 2060 Regional Self-Reliance Scenario

LAND-USE SCENARIOS | PAGE 14
SCENARIO #4 | Forests as Infrastructure
The Forests as Infrastructure scenario envisions a future in which policies, markets, state and local planning, and incentives focus on growing the Commonwealth’s living
“infrastructure.” Deforestation for new housing is at half of 1990 levels but nearly the same as Recent Trends (i.e., 7,000 acres per year). The rate of forestland conservation increases to 15,000 acres per year (representing 20,000 acres per year of total land conserved), and the goals in the original Wildlands and Woodlands vision (2.5 million acres of forestland conserved) are achievable by the end of the century. Conservation acquisition follows the priorities of the state conservation plan, BioMap2 (i.e., 66% of all new conservation is within BioMap2 core and critical habitat zones). Redevelopment of former mill towns is successful and most new development is clustered, consistent with the “smart growth” goals set forth by the state Climate Action Plan. In addition, state policies are more favorable to biomass energy for local heating at the household and community scale. Forestry in the state is characterized by “improvement forestry” that removes small, previously non-merchantable material and promotes the growth of large oaks, white pines, sugar maple, and other tree species beneficial to both forest ecosystems and the economy. In keeping with the emphasis on forests as a renewable local resource, the rate of forest harvesting is increasing steadily — reaching 45,000 acres per year compared to 25,000 acres in Recent Trends.
Forest
Agriculture
Mixed-Use
Residential
Water
Rural Town
Sprawl Frontier Town
Suburban Town
Maps not to scale.
Towns in 2060Forests as Infrastructure Scenario
Forest
Mixe
d-Use
Agriculture
Residential
Ac
res
of
Ch
an
ge
0
400,000
200,000
Conserved
Suburban
Town
Sprawl Frontier
Town
Rural
Town
Harvested
0 10 20 30 50 miles
Massachusetts in 2060Forests as Infrastructure Scenario
LAND-USE SCENARIOS | PAGE 15
ForestAgricultureMixed-UseResidentialWaterMajor Roads

LAND-USE SCENARIOS | PAGE 16
LAND USE MATTERS: CONSEQUENCES FOR PEOPLE AND NATURE
The consequences of our land-use choices will be profound, exceeding some impacts of climate change. But the expansive and relatively young forests of the Commonwealth offer tremendous opportunities for maintaining and enhancing forest benefits while providing for development and sustainable harvesting.
Ranking the Land-Use Scenarios
e compared the impacts of the four land-use scenarios on a suite of nine land-based measures. We ranked the scenarios by quantifying how much of each “benefit” is provided in the year 2060 (1st = highest benefit, 4th = lowest benefit) (Table 3). For example, the scenario with the least amount of forest fragmented into small parcels in year 2060 ranks 1st; the scenario with the most fragmentation ranks 4th. The comparison shows that the Forests as Infrastructure scenario ranks 1st for six out of nine benefits. The Recent Trends scenario ranks 2nd for five benefits. The substantial expansion of biomass clear-cutting and forest-clearing for conventional agriculture in the Regional Self-Reliance scenario results in low rankings for carbon storage, forest composition, forest habitat, and phosphorus export to streams. The Opportunistic Growth scenario, with its extensive and dispersed development, ranks last for five out of nine benefits.
The rankings show that the Recent Trends scenario and associated forest policies and practices would yield many important benefits in the future such as more acres of protected forestland, increased carbon storage, and relatively high forest habitat quality. However, the continued dispersed land development undermines those forest benefits and increases adverse impacts water and habitat. The rankings for Forests as Infrastructure reveal that, given the current extent and condition of Massachusetts’ forests, the potential exists to conserve large expanses of forest, support nearly the same amount of development as Recent Trends, and expand sustainable forestry while enhancing many forest benefits and minimizing the impacts of growth (Table 3).
The specific benefits of the Forests as Infrastructure scenario, which ranked 1st among the four scenarios, are many and varied:
• In the woods, the Forests as Infrastructure scenario yields a 20% increase in tree species with high commercial and wildlife value, twice as much local wood harvested, and a 35% increase in the amount of carbon stored in forests from the 2010 baseline (nearly the same as Recent Trends).
• For water resources, Forests as Infrastructure results in less impervious area than Recent Trends, protects water quality, and holds increases in average annual runoff to less than 10% in 26 of the state’s 27 major watersheds.
• In terms of habitat, Forests as Infrastructure results in 25% less forest fragmentation, conserves 750,000 acres of forest for a variety of uses including forestry, and protects 280,000 more acres of priority forest habitat than Recent Trends.
W

LAND-USE SCENARIOS | PAGE 17
TABLE 3: Land-Use Scenario Results
Year 2010 Results in 2060
Recent Trends Opportunistic Regional Forests as Growth Self-Reliance Infrastructure
Note: The numbers in bold represent the top-ranked result for each of the benefits. The underlined numbers are second, the italicized numbers are third, and numbers in plain text are fourth.
LAND COVER & LAND USE
Forest area (million acres) 3.22 2.85 2.54 2.70 2.91
Conserved forest (million acres) 0.98 1.48 1.12 1.19 1.73
Developed area (million acres) 0.98 1.35 1.65 1.19 1.29
Timber harvest (million acres harvested at least once) NA 0.91 0.92 1.83 1.57
Farmland (acres) 239,843 239,843 239,843 539,843 239,843
NATURE-BASED BENEFITS
Forest Harvested wood NA 44.5 62.6 119.0 87.3 measures (thousand metric tons)
High-value tree species 81.0 95.5 82.6 63.6 116.0 (million metric tons)
Forest carbon 105.8 148.8 124.7 102.7 142.7 (million metric tons)
Water Impervious Watersheds 18/8 20/12 25/14 20/10 20/11 measures cover >7% & 12%
Annual Statewide 4,934 5,381 5,534 5,388 5,356 water average runoff (thousand acre-feet)
Nutrient Annual 2.9/0.24 3.8/0.25 4.7/0.27 3.9/0.27 3.5/0.25 export N & P export – statewide average (kg/ha/yr)
Habitat Priority forest habitat NA 265,432 57,066 96,750 547,575 measures conserved (acres)
Small forest patches NA 69% 150% 77% 34% (<5 acres; percent increase from 2010)
The differences between Forests as Infrastructure and Recent Trends (and starker differences with Opportunistic Growth) have important implications for confronting climate change. By retaining carbon storage, forests will continue to offset a portion of heat-trapping carbon dioxide emissions that would otherwise contribute to climate change. By reducing the number of watersheds with elevated surface water runoff, forests lower the vulnerability of communities to increased flooding associated with climate change. Conserving more priority forest habitat and achieving lower levels of fragmentation improves the potential for wildlife and natural systems to adapt as climate changes.
The results of the scenario rankings suggest that land conservation alone is not sufficient to fully protect critical natural assets. Much greater benefits accrue when land conservation is coupled with land-use planning and smart-growth practices that use land efficiently by clustering new residential development and achieving a higher proportion of development as compact mixed use development. The economic benefits of this approach were not quantified in this study, but are likely to include the avoided costs of cleaning up impaired waters and repairing storm damage; more rural jobs in the forestry and wood processing sectors; and more liveable cities enriched by the shade, beauty, and enjoyment offered by protected forests and open space.
Land Use and Forest Effects
he four land-use scenarios have distinct impacts on forest cover, composition, carbon storage, and local wood production. The results vary widely depending on the amount, intensity and distribution of forest conversion and forest harvesting. In all scenarios, the conversion of forestland to developed uses (including agriculture) has the greatest impact on forest benefits because it both removes most of the trees and prevents their future. In contrast, forest harvesting only temporarily reduces the amount of living trees and affects the composition of the remaining and future forests. The scenarios employ a wide range of forestry practices, as discussed in “Focus on Forestry” (Box 2). The results demonstrate that harvesting practices strongly influence the establishment and growth of particularly tree species and forest carbon storage.
Studies show that forests of the Northeast are among the largest available land-based sinks for atmospheric carbon dioxide (Lu et al. in prep). Massachusetts’ forests currently offset 8 to 10% of the state’s annual carbon dioxide emissions that would otherwise contribute to climate change; which is equivalent to emissions from 700,000 average homes each year (EPA 2012). Forest loss and timber harvesting alters how much carbon
LAND-USE SCENARIOS | PAGE 18
T
Ha
rve
ste
d w
oo
d(t
ho
us
an
d m
etr
ic t
on
s/y
ea
r)
Ca
rbo
n i
n l
ive
tre
es
(mil
lio
n m
etr
ic t
on
s i
n 2
06
0)
Regional Self-Reliance
Opportunistic Growth
0
50
500
1,000
1,500
2,000
2,500
100
150
Forests as InfrastructureRecent Trends
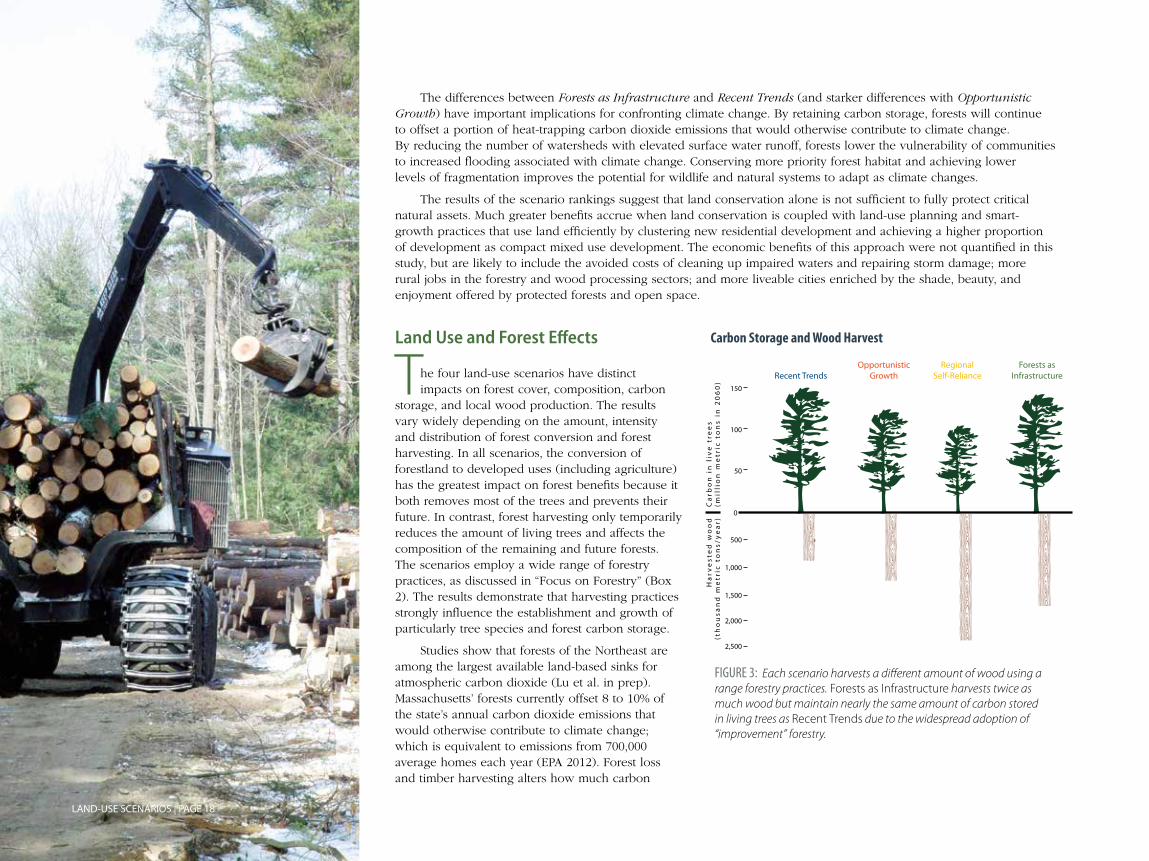
FIGURE 3: Each scenario harvests a different amount of wood using a range forestry practices. Forests as Infrastructure harvests twice as much wood but maintain nearly the same amount of carbon stored in living trees as Recent Trends due to the widespread adoption of “improvement” forestry.
Carbon Storage and Wood Harvest
LAND-USE SCENARIOS | PAGE 19
is taken up and stored the forest. For example, when forests are cleared for development, most of the stored carbon is released into the atmosphere; though some remains stored in long-lived wood products such as furniture and homes. When forests are replaced by suburban development, the land shifts from a net sink to a net source of heat-trapping carbon dioxide. Of the major land cover types in Massachusetts, suburban development usually has the highest net carbon dioxide emissions per capita due to high fossil fuel use for transportation and limited forest regrowth (Lu et al. in prep, Raciti et al. 2012).
The following section and Table 3 report the changes in forest area, wood harvested, and the resulting changes in carbon storage and tree species composition for each of the four scenarios.
Results1. Forests as Infrastructure results in the lowest forest loss (10%) over
the 50-year simulation period, followed by Recent Trends (13%), Regional Self-Reliance (16%), and Opportunistic Growth (27%).
2. Accounting for conversion to developed uses and harvesting, the Recent Trends scenario removes the least amount of wood. The Regional Self-Reliance scenario removes, by far, the most wood, primarily from harvesting for biomass energy production, but also from agricultural clearing.
3. Carbon stored in live trees increases over the 50-year period in all scenarios, except Regional Self-Reliance. The combination of widespread intense harvesting and permanent agricultural clearing in this scenario results in a long-term decline of carbon stored in trees.
4. The Forests as Infrastructure scenario harvests twice as much wood than Recent Trends but results in only 4% less carbon stored in live trees at the end of the 50-year period (Figure 3).
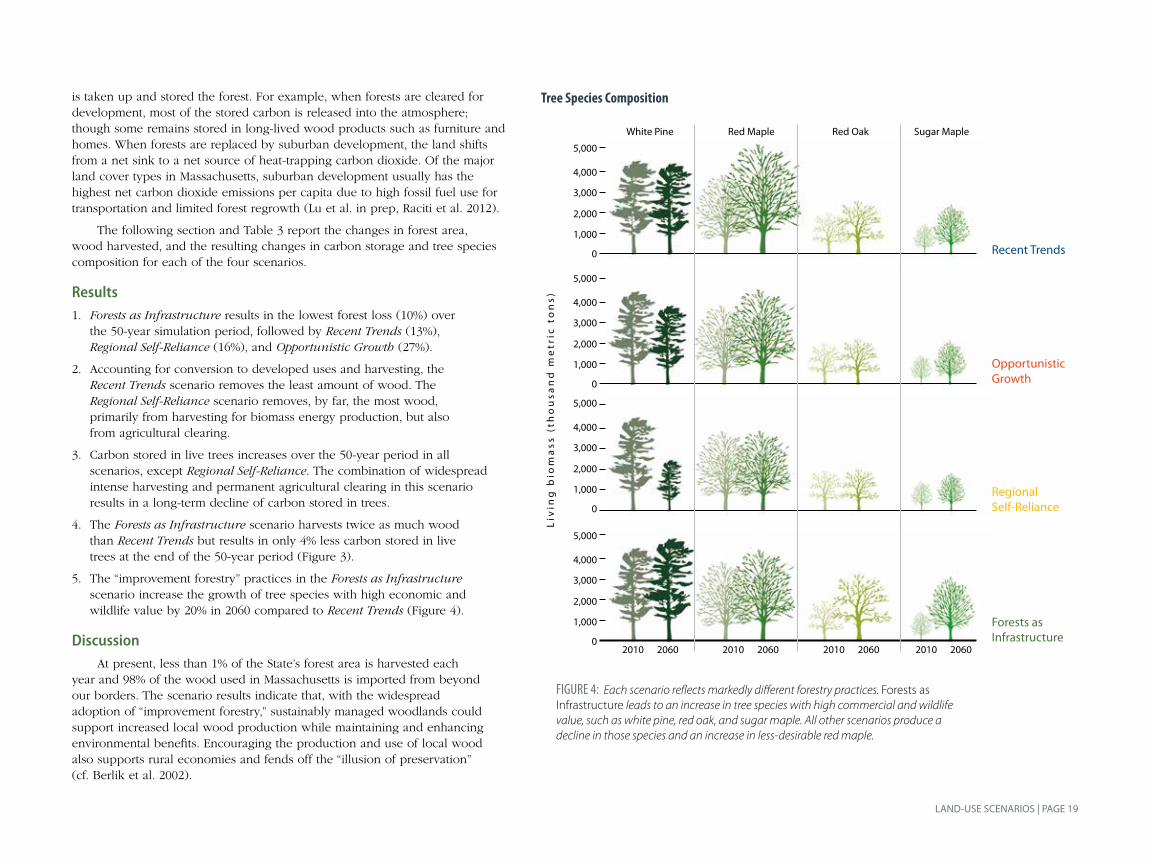
5. The “improvement forestry” practices in the Forests as Infrastructure scenario increase the growth of tree species with high economic and wildlife value by 20% in 2060 compared to Recent Trends (Figure 4).
Discussion At present, less than 1% of the State’s forest area is harvested each year and 98% of the wood used in Massachusetts is imported from beyond our borders. The scenario results indicate that, with the widespread adoption of “improvement forestry,” sustainably managed woodlands could support increased local wood production while maintaining and enhancing environmental benefits. Encouraging the production and use of local wood also supports rural economies and fends off the “illusion of preservation” (cf. Berlik et al. 2002).
2010 2060 2010 2060 2010 2060 2010 2060
FIGURE 4: Each scenario reflects markedly different forestry practices. Forests as Infrastructure leads to an increase in tree species with high commercial and wildlife value, such as white pine, red oak, and sugar maple. All other scenarios produce a decline in those species and an increase in less-desirable red maple.
Tree Species Composition
LAND-USE SCENARIOS | PAGE 20
The Forests as Infrastructure scenario doubles the amount of wood harvested from forests in Massachusetts, but this should not be construed as a recommendation of this report. Exactly how much more harvesting should occur is a function of many other factors including landowner objectives, forest economics, air and water quality trade-offs, and social concerns, to name a few.
An important barrier to expanding sustainable forestry is the fragmentation of forests which limits access to the woods for harvesting (Kittredge et al. 1996). Interestingly, the same sprawling development that impedes forestry also contributes to higher per capita greenhouse gas emissions. Therefore, synergy exists between land-use planning to mitigate climate change (e.g., compact mixed-use development near transit) and conservation of large expanses of forestland to support forestry.
BOX 2: Focus on Forestry
orestry plays an important role within all the land-use scenarios that were developed by the natural resource professionals in the project. Each scenario uses a range of forestry practices to achieve specific objectives (Table 2). The practices used in the Recent Trends scenario were based on Massachusetts harvest permit records and an understanding of landowner tendencies (see Thompson et al. 2011). Two-thirds of all harvests in this scenario use “long-term forestry” practices, which remove mature white pine, red oak, red maple, and sugar maple that are more than 80 years old. The remaining one-third of harvests employ “short-term revenue” practices, which remove only the most valuable trees — mature white pine, red oak and sugar maple — and leave the less desirable species behind. Individual harvest areas for these different forestry practices range in size from 20 acres to 50 acres. The forestry experts on the team crafted three additional prescriptions that were consistent with the themes of the scenarios. The “short-term revenue with biomass” practices are used extensively within the Opportunistic Growth and Regional Self-Reliance scenarios. This type of forestry removes the most valuable timber species, plus it removes 30% of all other trees to be chipped and used for biomass energy. Harvest units range in size from 20 to 50 acres. “Biomass clearcut” is the most intense forestry practice; it harvests all trees within a 25 to 40 acre stand, regardless of species or age class. Twenty percent of harvests within the Opportunistic Growth and Regional Self-Reliance scenarios use this prescription. The “improvement forestry” practices were defined by the forestry experts in the project and are consistent with the principles of ecological forestry (Kohm and Franklin 1997). The objective of improvement forestry, which is prevalent in Forests as Infrastructure, is to improve the quality and value of timber by promoting forests comprised of large trees of species that have high economic and ecosystem value (Figure 4). To achieve that, it retains 100% of the white pine, red oak, and sugar maple that are less than 130 years old, and retains 20% of those older than 130 years. It removes 70% of all non-desirable species older than 40 years, thereby freeing up growing space for the desired species. Importantly, improvement forestry requires that a landowner return to the site every 20 years to repeat the harvest, showing a continued commitment to the land and the management objectives. These different forestry practices influence the composition and structure of the future forest and determine the amount of wood that can be harvested while still sustaining critical forest benefits (see Table 3 and “Results” above).
F
LAND-USE SCENARIOS | PAGE 21
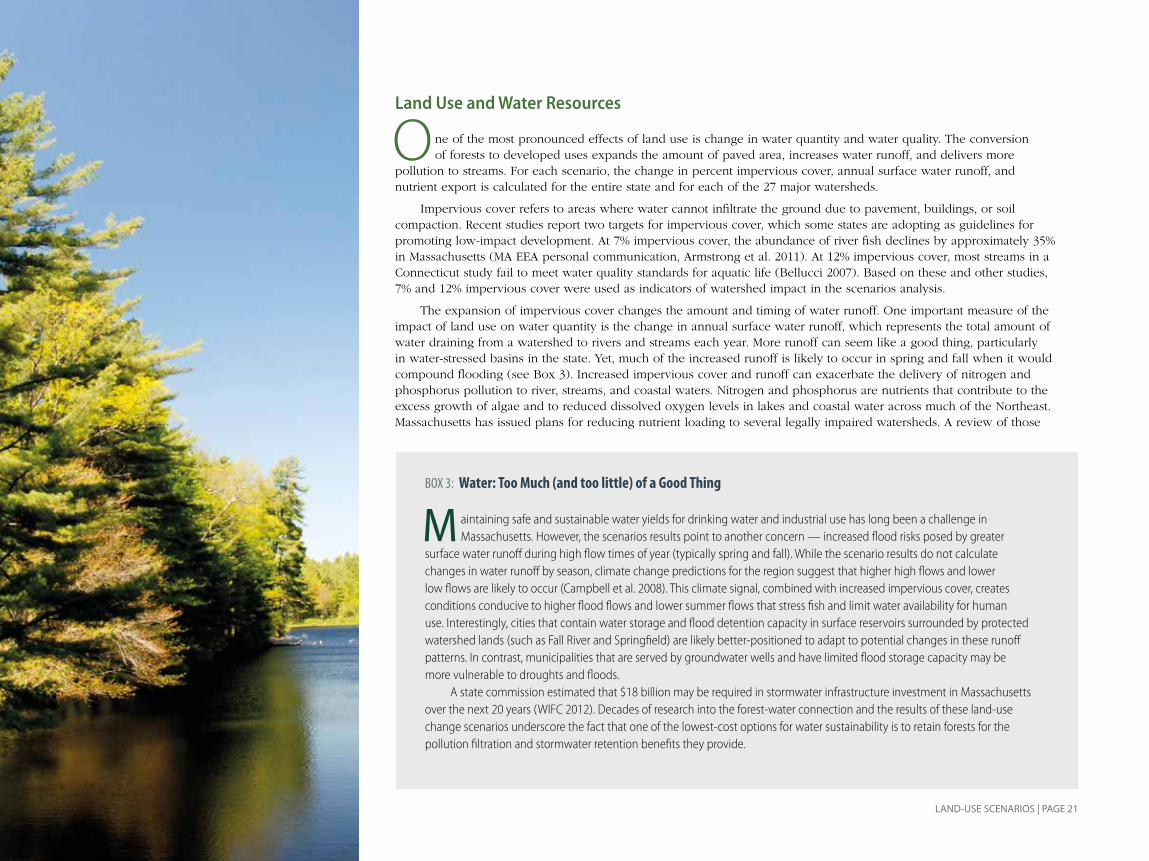
Land Use and Water Resources
ne of the most pronounced effects of land use is change in water quantity and water quality. The conversion of forests to developed uses expands the amount of paved area, increases water runoff, and delivers more pollution to streams. For each scenario, the change in percent impervious cover, annual surface water runoff, and nutrient export is calculated for the entire state and for each of the 27 major watersheds.
Impervious cover refers to areas where water cannot infiltrate the ground due to pavement, buildings, or soil compaction. Recent studies report two targets for impervious cover, which some states are adopting as guidelines for promoting low-impact development. At 7% impervious cover, the abundance of river fish declines by approximately 35% in Massachusetts (MA EEA personal communication, Armstrong et al. 2011). At 12% impervious cover, most streams in a Connecticut study fail to meet water quality standards for aquatic life (Bellucci 2007). Based on these and other studies, 7% and 12% impervious cover were used as indicators of watershed impact in the scenarios analysis.
The expansion of impervious cover changes the amount and timing of water runoff. One important measure of the impact of land use on water quantity is the change in annual surface water runoff, which represents the total amount of water draining from a watershed to rivers and streams each year. More runoff can seem like a good thing, particularly in water-stressed basins in the state. Yet, much of the increased runoff is likely to occur in spring and fall when it would compound flooding (see Box 3). Increased impervious cover and runoff can exacerbate the delivery of nitrogen and phosphorus pollution to river, streams, and coastal waters. Nitrogen and phosphorus are nutrients that contribute to the excess growth of algae and to reduced dissolved oxygen levels in lakes and coastal water across much of the Northeast. Massachusetts has issued plans for reducing nutrient loading to several legally impaired watersheds. A review of those
BOX 3: Water: Too Much (and too little) of a Good Thing
aintaining safe and sustainable water yields for drinking water and industrial use has long been a challenge in Massachusetts. However, the scenarios results point to another concern — increased flood risks posed by greater surface water runoff during high flow times of year (typically spring and fall). While the scenario results do not calculate changes in water runoff by season, climate change predictions for the region suggest that higher high flows and lower low flows are likely to occur (Campbell et al. 2008). This climate signal, combined with increased impervious cover, creates conditions conducive to higher flood flows and lower summer flows that stress fish and limit water availability for human use. Interestingly, cities that contain water storage and flood detention capacity in surface reservoirs surrounded by protected watershed lands (such as Fall River and Springfield) are likely better-positioned to adapt to potential changes in these runoff patterns. In contrast, municipalities that are served by groundwater wells and have limited flood storage capacity may be more vulnerable to droughts and floods. A state commission estimated that $18 billion may be required in stormwater infrastructure investment in Massachusetts over the next 20 years (WIFC 2012). Decades of research into the forest-water connection and the results of these land-use change scenarios underscore the fact that one of the lowest-cost options for water sustainability is to retain forests for the pollution filtration and stormwater retention benefits they provide.
M
O
LAND-USE SCENARIOS | PAGE 22
Imp
ervi
ous
Cov
erW
ater
Run
off
Phos
pho
rus
Exp
ort
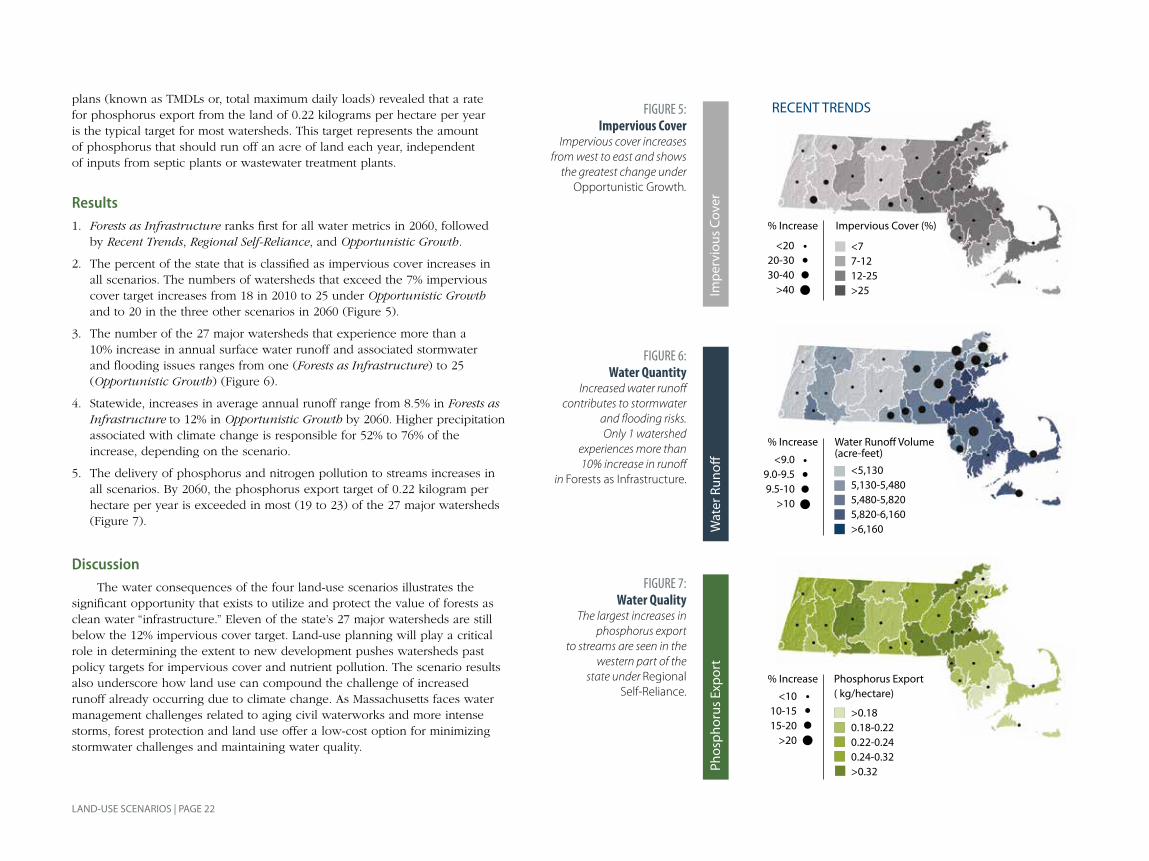
plans (known as TMDLs or, total maximum daily loads) revealed that a rate for phosphorus export from the land of 0.22 kilograms per hectare per year is the typical target for most watersheds. This target represents the amount of phosphorus that should run off an acre of land each year, independent of inputs from septic plants or wastewater treatment plants.
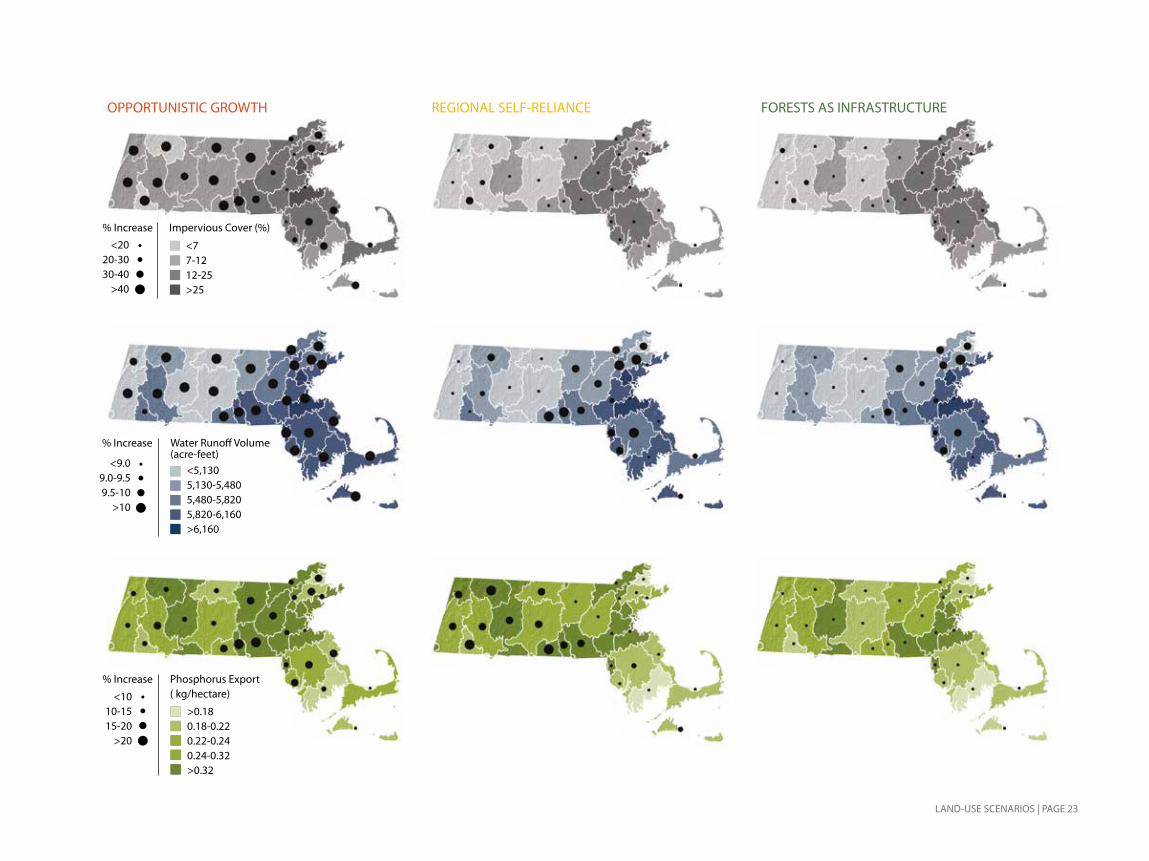
Results1. Forests as Infrastructure ranks first for all water metrics in 2060, followed
by Recent Trends, Regional Self-Reliance, and Opportunistic Growth.
2. The percent of the state that is classified as impervious cover increases in all scenarios. The numbers of watersheds that exceed the 7% impervious cover target increases from 18 in 2010 to 25 under Opportunistic Growth and to 20 in the three other scenarios in 2060 (Figure 5).
3. The number of the 27 major watersheds that experience more than a 10% increase in annual surface water runoff and associated stormwater and flooding issues ranges from one (Forests as Infrastructure) to 25 (Opportunistic Growth) (Figure 6).
4. Statewide, increases in average annual runoff range from 8.5% in Forests as Infrastructure to 12% in Opportunistic Growth by 2060. Higher precipitation associated with climate change is responsible for 52% to 76% of the increase, depending on the scenario.
5. The delivery of phosphorus and nitrogen pollution to streams increases in all scenarios. By 2060, the phosphorus export target of 0.22 kilogram per hectare per year is exceeded in most (19 to 23) of the 27 major watersheds (Figure 7).
Discussion The water consequences of the four land-use scenarios illustrates the significant opportunity that exists to utilize and protect the value of forests as clean water “infrastructure.” Eleven of the state’s 27 major watersheds are still below the 12% impervious cover target. Land-use planning will play a critical role in determining the extent to new development pushes watersheds past policy targets for impervious cover and nutrient pollution. The scenario results also underscore how land use can compound the challenge of increased runoff already occurring due to climate change. As Massachusetts faces water management challenges related to aging civil waterworks and more intense storms, forest protection and land use offer a low-cost option for minimizing stormwater challenges and maintaining water quality.
<1010-1515-20
>20
RECENT TRENDS
<7 7-12 12-25 >25
Impervious Cover (%)
<2020-3030-40
>40
% Increase
Phosphorus Export ( kg/hectare)
>0.18 0.18-0.22 0.22-0.24 0.24-0.32 >0.32
% Increase
<5,130 5,130-5,480 5,480-5,820 5,820-6,160 >6,160
Water Runoff Volume (acre-feet)
% Increase
<9.0 9.0-9.59.5-10
>10
FIGURE 5: Impervious Cover
Impervious cover increases from west to east and shows
the greatest change under Opportunistic Growth.
FIGURE 6: Water Quantity
Increased water runoff contributes to stormwater
and flooding risks. Only 1 watershed
experiences more than 10% increase in runoff
in Forests as Infrastructure.
FIGURE 7: Water Quality
The largest increases in phosphorus export
to streams are seen in the western part of the
state under Regional Self-Reliance.
LAND-USE SCENARIOS | PAGE 23
REGIONAL SELF-RELIANCEOPPORTUNISTIC GROWTH FORESTS AS INFRASTRUCTURE
<7 7-12 12-25 >25
Impervious Cover (%)
<2020-3030-40
>40
% Increase
<5,130 5,130-5,480 5,480-5,820 5,820-6,160 >6,160
Water Runoff Volume (acre-feet)
% Increase
<9.0 9.0-9.59.5-10
>10
Phosphorus Export ( kg/hectare)
>0.18 0.18-0.22 0.22-0.24 0.24-0.32 >0.32
% Increase
<1010-1515-20
>20

LAND-USE SCENARIOS | PAGE 24
Land Use and Habitat
assachusetts forests provide habitat to diverse fish and wildlife species. The quantity and quality of future forest habitat will be determined by the amount, intensity, and configuration of land-use change. Of particular importance is interior forest habitat that is far from the forest’s edge. These lands are resistant to invasive species, allow movement of wildlife, and permit a range of ecosystem processes to occur unfettered by human influence. Unfortunately, interior forests are extremely vulnerable to changes in land use (Forman and Deblinger 2000). Over time, forest conversion to developed and agricultural uses fragments and perforates large forest blocks, which both reduces the total habitat area and degrades the quality of what remains. Small isolated forest fragments of less than five acres, while better than pavement, provide the lowest quality forest habitat. Of course, forest conservation can counter habitat degradation, but the right areas must be protected and they must be secured before the largest blocks are fractured.
This section compares the scenarios’ impacts on forest habitat. For each scenario, changes in habitat quality and quantity across the Commonwealth were measured. To rate habitat quality, each acre of forest was given a score based on the distance to the nearest non-forest edge, with “hard edges,” such as where forest meets large commercial development,
M
Total Acreage in the State
Rural
Town
0 10 20 30 50 miles
Conserved Priority Habitat
High-Threat Priority Habitat
Low-Threat Priority Habitat
Not Priority Habitat
Rural Town
Development Threat to Priority Habitat
FIGURE 8: This map combines two Biomap2 zones and TNC climate change resilience zones into one map of “Priority Habitat.” Lands most threatened by future development based on Recent Trends are red and lands with low threat of future development are yellow. The resulting development threat map can inform land conservation priorities.

LAND-USE SCENARIOS | PAGE 25
degrading further into the forest than “soft edges,” such as a forest to agriculture boundary. A case study of a suburban town in an urbanizing area compares forest habitat conditions in 2010 with those expected in 2060 under the Forests as Infrastructure and Opportunistic Growth scenarios (see Box 4). The results illustrate the impacts of different patterns and amounts of land development on forest habitat quality. Next the total area in small forest patches (less than 5 acres) was measured at the beginning and end of the simulations as an estimate of overall forest fragmentation.
The land-use impacts of the four scenarios on “priority habitat” were also assessed. Priority habitat was mapped by combining forest habitat identified in the Commonwealth of Massachusetts’ 2010 BioMap2 report (Woolsey et al. 2010) and lands identified by The Nature Conservancy’s as “resilient” (Anderson et al. 2012). The BioMap2 report identified the “Core Habitat” and “Critical Natural Landscapes” in Massachusetts that are critical for supporting the long-term persistence of rare and other native species. The TNC report identified lands throughout the Northeast that they believe are highly resilient to climate change.
For each scenario, the amount of forested priority habitat that was conserved or converted to non-habitat by 2060 was calculated (see Table 3). In addition, a map depicting the development threat to priority habitat was created for the Recent Trends scenario (Figure 8). The development threat is based on the population density of the surrounding area and the distance from major roads and urban centers. Of the approximately 1.6 million acres of priority habitat within the state that is forested, 42% is already conserved, 21% faces a high threat from development, and 37% has a low threat of development.
Results1. The Forests as Infrastructure scenario, with its clustered development pattern, ranks 1st in terms forest
habitat benefits followed by Recent Trends, Regional Self-Reliance, and Opportunistic Growth.
2. Forest loss and forest harvesting within all scenarios degrade forest habitat quality somewhat, but Forests as Infrastructure produces the least overall decline.
3. The Forests as Infrastructure scenario has nearly 25% less area in small forest fragments than Recent Trends in 2060.
4. Targeted conservation in the Forests as Infrastructure scenario protects more than twice as much priority forest habitat as Recent Trends (547,475 compared to 265,432 acres).
5. New agricultural lands in the Regional Self-Reliance scenario eliminate the largest amount of priority forest habitat. The intensity, permanence, and dispersed pattern of development in the Opportunistic Growth scenario, particularly in western Massachusetts, results in the largest decrease in quality of priority forest habitat.
Discussion Over the past several decades, Massachusetts citizens have witnessed the return of diverse wildlife species, like moose, fisher, and bald eagle, which are dependent on intact forest habitat. The scenario results show just how much our land-use choices can impact the state’s future capacity to conserve biodiversity. Sustaining large blocks of high quality habitat is particularly important in the face of climate change. It is expected that large intact forests will help plants and animals adapt to changing conditions or migrate to areas with suitable climate (Travis 2003). The benefits of clustered development are particularly clear, with the Forests as Infrastructure providing the fewest forest fragments and the highest overall habitat quality. The scenarios also show that all forest conversion is not equal: agricultural development, while more prevalent in areas with priority habitat, had a lower impact on habitat quality than conversion to developed uses. Finally, the map of development threats to all priority habitat show that considerable variability exists in the vulnerability of these lands. This information can help prioritize conservation activity to achieve the most habitat protection with limited conservation funding.
LAND-USE SCENARIOS | PAGE 26
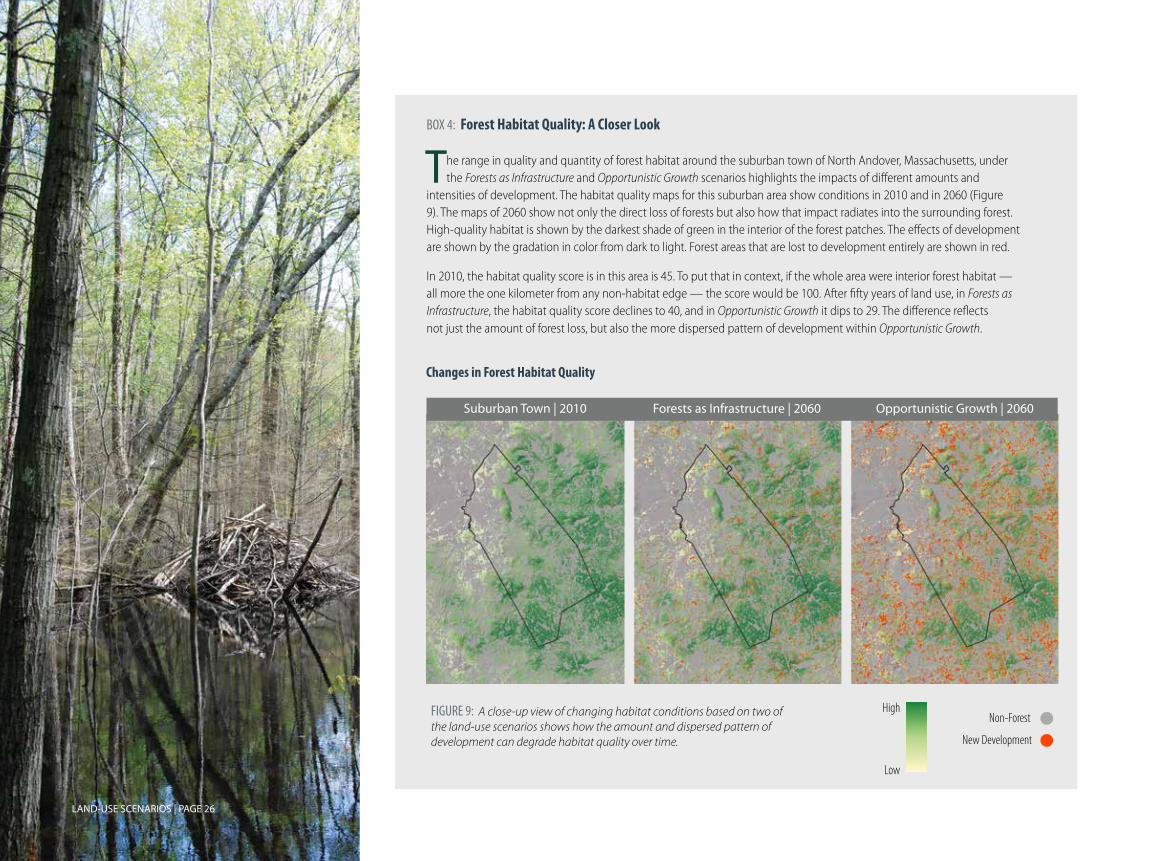
BOX 4: Forest Habitat Quality: A Closer Look
he range in quality and quantity of forest habitat around the suburban town of North Andover, Massachusetts, under the Forests as Infrastructure and Opportunistic Growth scenarios highlights the impacts of different amounts and intensities of development. The habitat quality maps for this suburban area show conditions in 2010 and in 2060 (Figure 9). The maps of 2060 show not only the direct loss of forests but also how that impact radiates into the surrounding forest. High-quality habitat is shown by the darkest shade of green in the interior of the forest patches. The effects of development are shown by the gradation in color from dark to light. Forest areas that are lost to development entirely are shown in red.
In 2010, the habitat quality score is in this area is 45. To put that in context, if the whole area were interior forest habitat — all more the one kilometer from any non-habitat edge — the score would be 100. After fifty years of land use, in Forests as Infrastructure, the habitat quality score declines to 40, and in Opportunistic Growth it dips to 29. The difference reflects not just the amount of forest loss, but also the more dispersed pattern of development within Opportunistic Growth.
High
Low
Non-Forest
New Development
T
Changes in Forest Habitat Quality
FIGURE 9: A close-up view of changing habitat conditions based on two of the land-use scenarios shows how the amount and dispersed pattern of development can degrade habitat quality over time.
Suburban Town | 2010 Forests as Infrastructure | 2060 Opportunistic Growth | 2060
LAND-USE SCENARIOS | PAGE 27
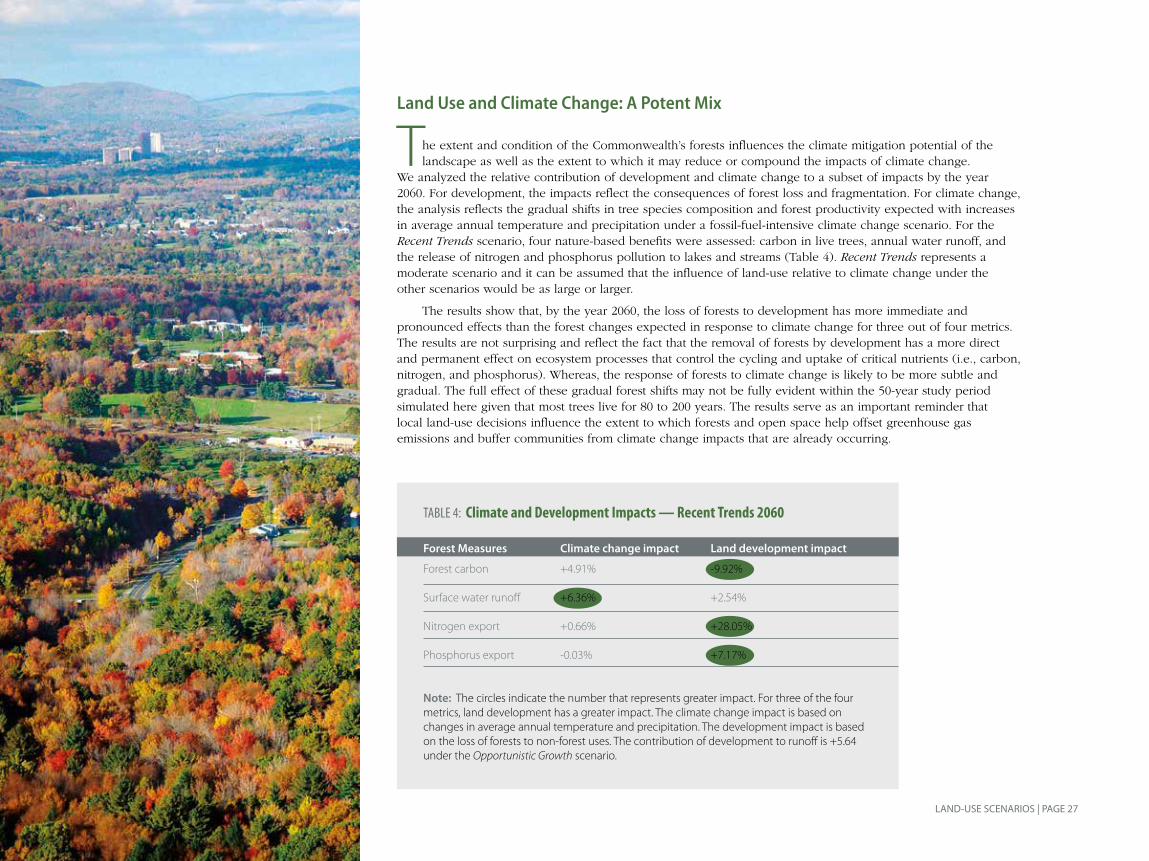
Land Use and Climate Change: A Potent Mix
he extent and condition of the Commonwealth’s forests influences the climate mitigation potential of the landscape as well as the extent to which it may reduce or compound the impacts of climate change. We analyzed the relative contribution of development and climate change to a subset of impacts by the year 2060. For development, the impacts reflect the consequences of forest loss and fragmentation. For climate change, the analysis reflects the gradual shifts in tree species composition and forest productivity expected with increases in average annual temperature and precipitation under a fossil-fuel-intensive climate change scenario. For the Recent Trends scenario, four nature-based benefits were assessed: carbon in live trees, annual water runoff, and the release of nitrogen and phosphorus pollution to lakes and streams (Table 4). Recent Trends represents a moderate scenario and it can be assumed that the influence of land-use relative to climate change under the other scenarios would be as large or larger.
The results show that, by the year 2060, the loss of forests to development has more immediate and pronounced effects than the forest changes expected in response to climate change for three out of four metrics. The results are not surprising and reflect the fact that the removal of forests by development has a more direct and permanent effect on ecosystem processes that control the cycling and uptake of critical nutrients (i.e., carbon, nitrogen, and phosphorus). Whereas, the response of forests to climate change is likely to be more subtle and gradual. The full effect of these gradual forest shifts may not be fully evident within the 50-year study period simulated here given that most trees live for 80 to 200 years. The results serve as an important reminder that local land-use decisions influence the extent to which forests and open space help offset greenhouse gas emissions and buffer communities from climate change impacts that are already occurring.
T
TABLE 4: Climate and Development Impacts — Recent Trends 2060
Forest Measures Climate change impact Land development impact
Forest carbon +4.91% -9.92%
Surface water runoff +6.36% +2.54%
Nitrogen export +0.66% +28.05%
Phosphorus export -0.03% +7.17%
Note: The circles indicate the number that represents greater impact. For three of the four metrics, land development has a greater impact. The climate change impact is based on changes in average annual temperature and precipitation. The development impact is based on the loss of forests to non-forest uses. The contribution of development to runoff is +5.64 under the Opportunistic Growth scenario.
LAND-USE SCENARIOS | PAGE 28
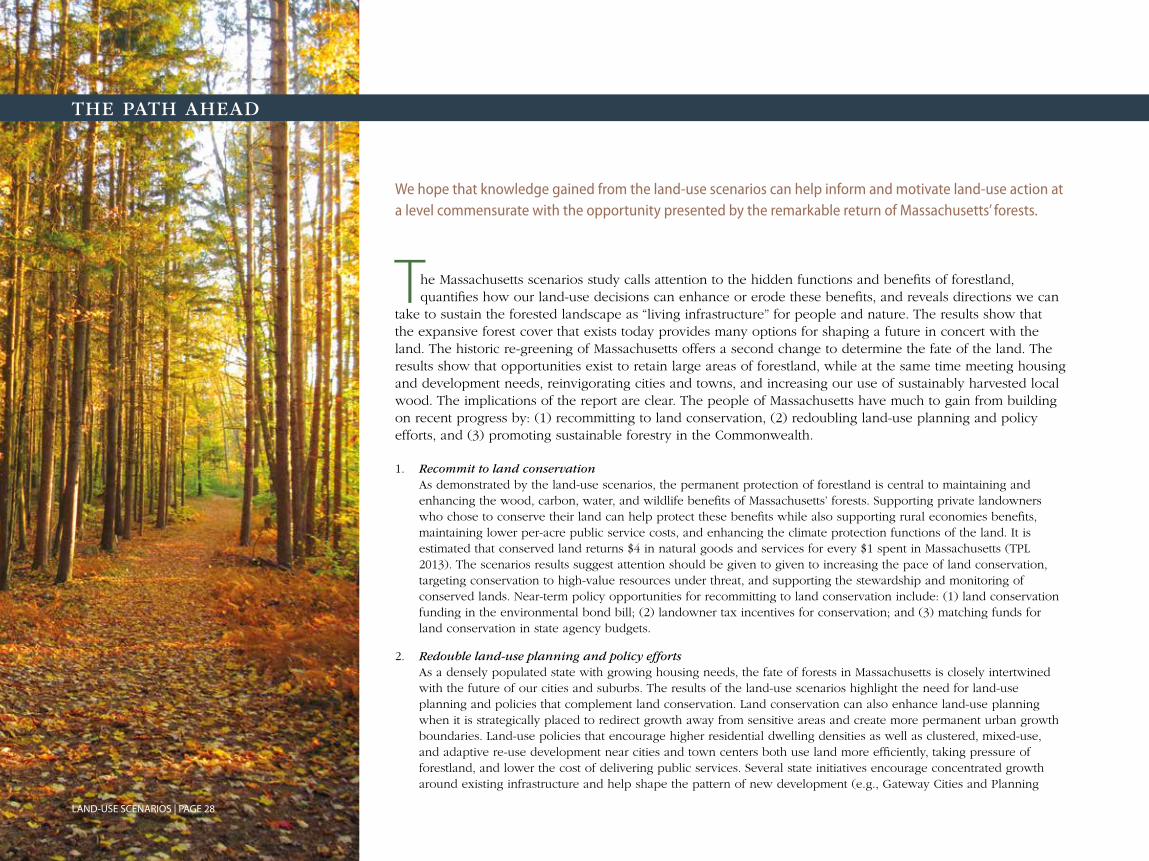
We hope that knowledge gained from the land-use scenarios can help inform and motivate land-use action at a level commensurate with the opportunity presented by the remarkable return of Massachusetts’ forests.
he Massachusetts scenarios study calls attention to the hidden functions and benefits of forestland, quantifies how our land-use decisions can enhance or erode these benefits, and reveals directions we can take to sustain the forested landscape as “living infrastructure” for people and nature. The results show that the expansive forest cover that exists today provides many options for shaping a future in concert with the land. The historic re-greening of Massachusetts offers a second change to determine the fate of the land. The results show that opportunities exist to retain large areas of forestland, while at the same time meeting housing and development needs, reinvigorating cities and towns, and increasing our use of sustainably harvested local wood. The implications of the report are clear. The people of Massachusetts have much to gain from building on recent progress by: (1) recommitting to land conservation, (2) redoubling land-use planning and policy efforts, and (3) promoting sustainable forestry in the Commonwealth.
1. Recommit to land conservation As demonstrated by the land-use scenarios, the permanent protection of forestland is central to maintaining and
enhancing the wood, carbon, water, and wildlife benefits of Massachusetts’ forests. Supporting private landowners who chose to conserve their land can help protect these benefits while also supporting rural economies benefits, maintaining lower per-acre public service costs, and enhancing the climate protection functions of the land. It is estimated that conserved land returns $4 in natural goods and services for every $1 spent in Massachusetts (TPL 2013). The scenarios results suggest attention should be given to given to increasing the pace of land conservation, targeting conservation to high-value resources under threat, and supporting the stewardship and monitoring of conserved lands. Near-term policy opportunities for recommitting to land conservation include: (1) land conservation funding in the environmental bond bill; (2) landowner tax incentives for conservation; and (3) matching funds for land conservation in state agency budgets.
2. Redouble land-use planning and policy efforts As a densely populated state with growing housing needs, the fate of forests in Massachusetts is closely intertwined
with the future of our cities and suburbs. The results of the land-use scenarios highlight the need for land-use planning and policies that complement land conservation. Land conservation can also enhance land-use planning when it is strategically placed to redirect growth away from sensitive areas and create more permanent urban growth boundaries. Land-use policies that encourage higher residential dwelling densities as well as clustered, mixed-use, and adaptive re-use development near cities and town centers both use land more efficiently, taking pressure of forestland, and lower the cost of delivering public services. Several state initiatives encourage concentrated growth around existing infrastructure and help shape the pattern of new development (e.g., Gateway Cities and Planning
T
THE PATH AHEAD
LAND-USE SCENARIOS | PAGE 29
Ahead for Growth initiatives). But progress on land-use zoning reform and the establishment of targets that retain the climate mitigation and adaptation potential of the landscape have lagged. Near-term policy opportunities to redouble land-use planning and policy include: (1) state land-use zoning reform, (2) town adoption of natural resource protection zoning, and (3) prioritization of land-use and smart-growth policies in the state’s climate action, climate adaptation, and water infrastructure plans.
3. Promoting sustainable forestry Well-managed forests provide tremendous economic and environmental benefits to society. The scenario results
reinforce conclusions from earlier studies that forestry practices determine the amount of harvesting that can be sustained without compromising benefits such as carbon storage, water quality, and habitat. Currently, less than 1% of the forestland in Massachusetts is harvested each year and 98% of our paper and timber products originate from beyond our border; diverting economic benefits from rural towns, transferring impacts to ecosystems elsewhere, and fueling the disconnect between resource use and production. The scenario results suggest that, with the widespread adoption of sustainable forestry, Massachusetts could support an increase in timber harvesting while protecting environmental quality. Existing programs and policies to promote sustainable forestry include: (1) landowner tax incentives including the “Chapter 61” property tax program and proposed tax credits for forest stewardship plans; (2) expanded markets for an array of timber and non-timber forest products; and (3) funding for landowner outreach and marketing of local sustainably harvested wood.
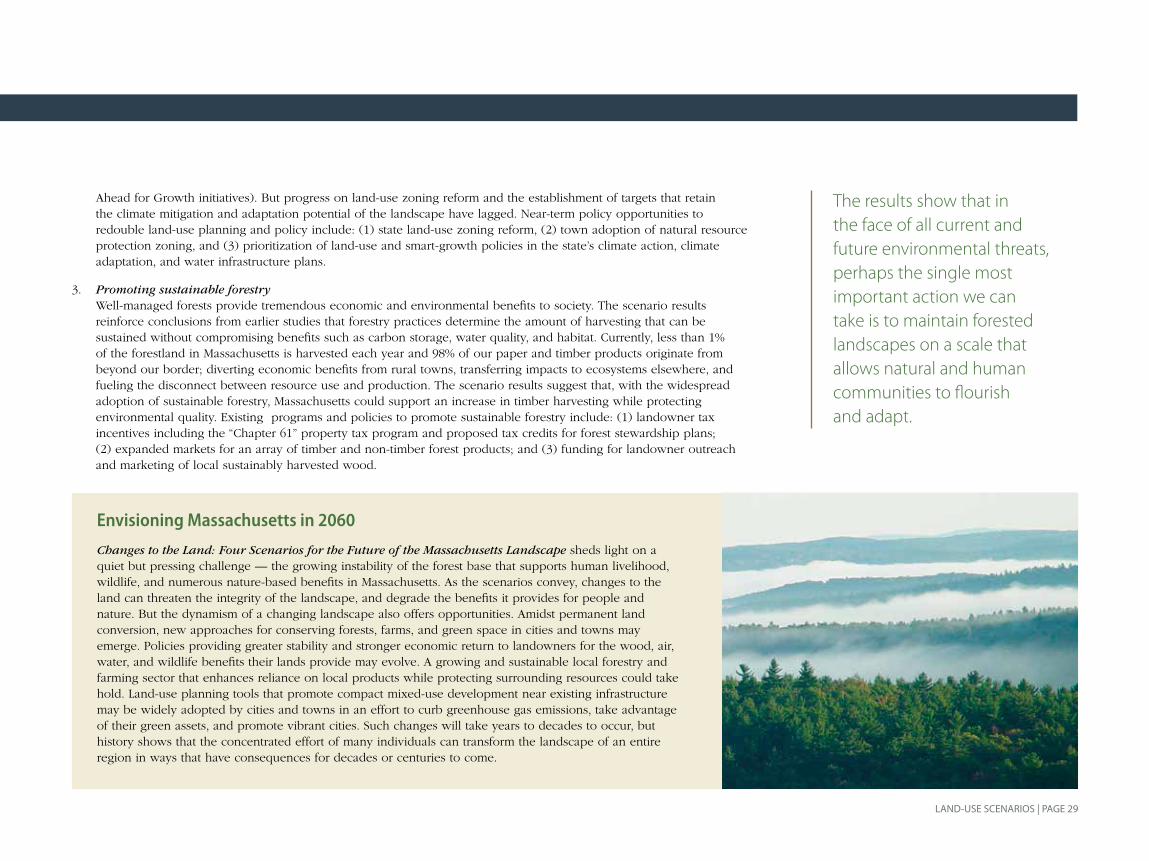
Envisioning Massachusetts in 2060
Changes to the Land: Four Scenarios for the Future of the Massachusetts Landscape sheds light on a quiet but pressing challenge — the growing instability of the forest base that supports human livelihood, wildlife, and numerous nature-based benefits in Massachusetts. As the scenarios convey, changes to the land can threaten the integrity of the landscape, and degrade the benefits it provides for people and nature. But the dynamism of a changing landscape also offers opportunities. Amidst permanent land conversion, new approaches for conserving forests, farms, and green space in cities and towns may emerge. Policies providing greater stability and stronger economic return to landowners for the wood, air, water, and wildlife benefits their lands provide may evolve. A growing and sustainable local forestry and farming sector that enhances reliance on local products while protecting surrounding resources could take hold. Land-use planning tools that promote compact mixed-use development near existing infrastructure may be widely adopted by cities and towns in an effort to curb greenhouse gas emissions, take advantage of their green assets, and promote vibrant cities. Such changes will take years to decades to occur, but history shows that the concentrated effort of many individuals can transform the landscape of an entire region in ways that have consequences for decades or centuries to come.
The results show that in the face of all current and future environmental threats, perhaps the single most important action we can take is to maintain forested landscapes on a scale that allows natural and human communities to flourish and adapt.
LAND-USE SCENARIOS | PAGE 30
Literature Cited
Alerich, C. L. 2000. Forest statistics for Massachusetts: 1985 and 1998. USDA Forest Service NE–148. 104pp.
Anderson, M.G., M. Clark, and A. Olivero Sheldon. 2012. Resilient Sites for Terrestrial Conservation in the Northeast and Mid-Atlantic Region. The Nature Conservancy, Eastern Conservation Science. 168 pp.
Armstrong, D.S., T.A. Richards, and S.B. Levin, S.B., 2011, Factors influencing riverine fish assemblages in Massachusetts: U.S. Geological Survey Scientific Investigations Report 2011–5193, 59 p. (Also available at http://pubs.usgs.gov/sir/2011/5193).
Bellucci, C. 2007. Stormwater and aquatic life: making the connection between impervious cover and aquatic life impairments for TMDL development in Connecticut streams. In Proceedings of the Water Environment Federation TMDL Conference, Bellevue, WA. Alexandria, VA: Water Environment Federation, 1003–1018.
Berlik, M. M., D. B. Kittredge, and D. R. Foster. 2002. The Illusion of Preservation. Journal of Biogeography. 29:1557–1568.
Campbell, J. L., L. E. Rustad, E. W. Boyer, S. F. Christopher, C. T. Driscoll, I. J. Fernandez, P. M. Groffman, D. Houle, J. Kiekbusch, A. H. Magill, M. J. Mitchell, and S. V. Ollinger. 2009. Consequences of climate change for biogeochemical cycling in forests of northeastern North America. Canadian Journal of Forest Research 39:264–284.
DeNormandie, J. 2009. Losing Ground: Patterns of development and their impacts on the nature of Massachusetts. Mass Audubon.
Donahue, B. 1999. Reclaiming the Commons: Community Farms and Forests in a New England Town. Yale University Press. New Haven, CT.
Donahue, B. 2004. The Great Meadow: Farmers and the Land in Colonial Concord. Yale University Press. New Haven, CT.
EPA 2013. Inventory of U.S. Greenhouse Gas Emissions and Sinks 1990-2011. U.S. Environmental Protection Agency, Washington, D.C. April 2013. EPA 430-R-13-001
Forman, R. T. T. and R. D. Deblinger. 2000. The Ecological Road-Effect Zone of a Massachusetts (U.S.A.) Suburban Highway. Conservation Biology. 14:36–46.
Foster, D. R. and J. Aber. 2004. Forest in Time: The Environmental Consequences of 1000 Years of Change in New England. Yale University Press. New Haven, CT.
Foster, D. R., D. B. Kittredege, B. Donahue, G. Motzkin, D. Orwig, A. Ellison, B. Hall, B. Colburn, A. D’Amato. 2005. Wildlands and Woodlands: A vision for the forests of Massachusetts. Harvard Forest. Petersham MA.
Foster, D., B. Donahue, D. B. Kittredge, K. F. Lambert, M. L. Hunter, B. Hall, L. C. Irland, R. J. Lilieholm, D. Orwig, A. W. D’Amato, E. A. Colburn, J. R. Thompson, J. N. Levitt, A. M. Ellison, W. S. Keeton, J. Aber, C. Cogbill, E. Colburn, C. Driscoll, T. J. Fahey, and C. Hart. 2010. Wildlands and Woodlands: A vision for the New England landscape. Page 40. Harvard University Press.
Foster, D. R. 1999. Thoreau’s Country. Harvard University Press. Cambridge, MA.
Hayhoe, K., C. Wake, B. Anderson, X. Liang, E. Maurer, J. Zhu, J. Bradbury, A. DeGaetano, A. Stoner, and D. Wuebbles. 2008. Regional climate change projections for the Northeast USA. Mitigation and Adaptation Strategies for Global Change. 13:1573–1596.
Kittredge, D.B., M.J. Mauri, and E.J.Mcguire. 1996. Decreasing woodlot size and the future of timber sales in Massachusetts: When is an operation too small? North J. Appl. For. 13(2):96–101.
Kohm, K. A. and J. F. Franklin. 1997. Creating a forestry for the 21st century: The science of ecosystem management. Island Press.
Levitt, J. and L. Youngblood. 2011. Report of the Massachusetts Commission on Financing Forest Conservation. pp. 91. http://www.mass.gov/eea/docs/eea/land/forest-consv-financing-rpt-jul15-2011.pdf.
Lu, X, D. Kicklighter, J.M. Melillo, P. Yang, B. Rosenzweig, C.J. Vörösmarty, B. Gross and R. J. Stewart. A Contemporary Carbon Balance for the Northeast Region of the United States. In preparation.
McDonald, R. I., G. Motzkin, M. S. Bank, D. B. Kittredge, J. Burk, and D. R. Foster. 2006. Forest harvesting and land-use conversion over two decades in Massachusetts. Forest Ecology and Management. 227:31–41.
McKibben, W. 1995, An explosion of green. Atlantic Monthly. April. pp. 61–83.
LAND-USE SCENARIOS | PAGE 31
MISER. 2002. Massachusetts Institute for Social and Economic Research. Retrieved from http://www.umass.edu/miser/.
Nakicenovic, N. 2000. Special Report on Emissions Scenarios. A Special Report of Working Group III of the Intergovernmental Panel on Climate Change. pp. 570. Cambridge University Press, UK.
Northeast Climate Impacts Assessment Group. 2013. www.northeastclimatedata.org.
Raciti, S. M., T. J. Fahey, R. Q. Thomas, P. B. Woodbury, C. T. Driscoll, F. J. Carranti, D. R. Foster, P. S. Gwyther, B. Hall, S. Hamburg, J. Jenkins, C. Neil, B. Peery, E. Quigley, R. Sherman, M. Vadeboncoeur, D. Weinstein, G. Wilson. 2012. Local-Scale Carbon Budgets and Mitigation Opportunities for the Northeastern United States. BioScience. 62:23–38.
Scheller, R. M., J. B. Domingo, B. R. Sturtevant, J. Williams, A. Rudy, E. J. Gustafson, and D. J. Mladenoff. 2007. Design, development, and application of LANDIS-II, a spatial landscape simulation model with flexible temporal and spatial resolution. Ecological Modeling. 201:409–419.
Tallis, H. T., T. Ricketts, A. D. Guerry, S. A. Wood, R. Sharp, E. Nelson, R. Griffin. 2013. InVEST 2.5.4 User’s Guide. The Natural Capitol Project.
Thompson, J. R., D. Foster, R. Scheller, and D. B. Kittredge. 2011. The influence of land use and climate change on forest biomass and composition in Massachusetts, USA. Ecological Applications. 21:2425–2444.
TPL (Trust for Public Land). 2013. The Return on Investment in Parks and Open Space in Massachusetts.
Travis, J. M. J. 2003. Climate change and habitat destruction: a deadly anthropogenic cocktail. Proceedings of the Royal Society London B. 270:467–73.
WIFC (Water Infrastructure Finance Commission). 2012. Massachusetts’ Water Infrastructure: Toward Financial Sustainability. pp. 128.
Woolsey, H., A. Finton, and J. DeNormandie. 2010. BioMap 2 pp. 64.
About the Authors
• Meghan Blumstein is a Research Assistant at the Harvard Forest.
• Eben Broadbent is a Post-doctoral Fellow at the Smithsonian Conservation Biology Institute.
• David Foster is the Director of the Harvard Forest, Harvard University.
• Kathy Fallon Lambert is the Science & Policy Integration Project Director of the Harvard Forest, Harvard University and Director of the Science Policy Exchange.
• Jonathan Thompson is a Senior Ecologist at the Harvard Forest, Harvard University. He was formerly a Research Ecologist at the Smithsonian Conservation Biology Institute.
• Angelica Almeyda Zambrano is a Post-doctoral Fellow at the Smithsonian Conservation Biology Institute.
LAND-USE SCENARIOS | PAGE 32
About The Harvard Forest, Harvard University
Located in the picturesque hill town of Petersham, Massachusetts, the Harvard Forest has served as Harvard University’s rural laboratory and classroom for ecology and conservation since 1907. The Forest is comprised of 3,750 acres of forests, ponds, streams, wetlands, and agricultural fields that provide diverse natural ecosystems and cultural landscapes for study and enjoyment. The Forest is protected from development and operates under a long-term
management plan designating specific areas for active forest management, long-term scientific experiments, and reserves. Since the Forest’s founding, its researchers have been pioneers in applying the lessons from human and natural history to the interpretation, conservation, and stewardship of landscapes. Harvard Forest scholars collaborate with conservation organizations and state and federal agencies to protect land locally, regionally, and globally. The Forest is home to the Fisher Museum, which contains the world-renowned dioramas depicting the history of landscape changes in New England since colonial settlement. Major support for the Forest comes from Harvard University and from the National Science Foundation through its Long Term Ecological Research Program (LTER), National Ecological Observation Network (NEON), and Research Experience for Undergraduates Program (REU). For additional information, please visit: http://harvardforest.fas.harvard.edu.
About the Smithsonian Conservation Biology Institute
The Smithsonian Conservation Biology Institute (SCBI) serves as an umbrella for the Smithsonian’s global effort to conserve species and train future generations of conservationists. The SCBI is headquartered in Front Royal, Virginia, at the facility previously known as the National Zoo’s Conservation and Research Center. The SCBI facilitates
and promotes research programs based at Front Royal, at the National Zoo in Washington, and at field-research and training sites around the world. Its efforts support one of the four main goals of the Smithsonian’s new strategic plan, which advances “understanding and sustaining a biodiverse planet.” SCBI conducts research to aid in the survival or recovery of species and their habitats, and to ensure the health and well-being of animals in captivity and in the wild. The SCBI consists of six centers: The Center for Animal Care Science, the Conservation Ecology Center, the Center for Conservation Education and Sustainability, the Center for Conservation and Evolutionary Genetics, the Migratory Bird Center, and the Center for Species Survival. Centers often collaborate with each other and with other Smithsonian Institution units and outside organizations. For additional information, please visit: http://nationalzoo.si.edu/scbi.
About the Science Policy Exchange
The Science Policy Exchange is a consortium of six research institutions formed in 2011 to increase the impact of long-term ecological research in conservation and environmental policy. The consortium undertakes scientific synthesis, policy engagement, and science communication to address environmental challenges in the northeastern U.S. Its three core issue areas are landscape change,
water sustainability, and energy use and impacts. The founding members of the Science Policy Exchange are Harvard Forest, Harvard University; Cary Institute of Ecosystem Studies; The Ecosystems Center at MBL; Hubbard Brook Research Foundation; University of New Hampshire; and Syracuse University.
Acknowledgements
We owe a great debt of gratitude to the group of eight collaborators who lent their time and expertise to develop the land-use scenarios for this project: Stephanie Cooper, Robert O’Connor, Kurt Gaertner, Kathleen Baskins, Robert Perschel, Andy Finton, James Levitt, and Lisa Vernegaard.
Many individuals reviewed early versions of the report and offered constructive and creative feedback. We thank them greatly for their efforts: Steve Long, Heidi Ricci, Karen Heyman, Keith Ross, Barbara Erickson, Aisling O’Shea, Prentice Zinn, Jack Clarke, Rob Warren, Matt Zeiper, Wes Ward, Laura Marx, Nancy Goodman, and Celia Reichel. We are also grateful for the many and varied intellectual contributions to understanding land-use change upon which this report is built, including the work of David Kittredge, Brian Donahue, Henry Foster, Brian Hall, Paul Catanzaro, Keith Ross, Leigh Youngblood, Ed Faison, and Bill Labich. Thank you to Eva Pell, Steve Monfort, and John Seidensticker at the Smithsonian Institution for their support and encouragement of the research by Jonathan Thompson and members of his lab.
We thank the team at O2 Planning & Design, Inc. for going above and beyond in the creation of maps and figures for this project, including: Doug Olson, Leif Olson, Andy Thomas, and Veronique Pelletier. A special thank you goes out to Linda Mirabile at RavenMark for her unrivaled patience and aesthetic. Assistance with outreach and communication was provided by Barbara MacLeod and Melissa Paly of CrossCurrent Communications. We deeply appreciate the efforts of Emily Bateson, Clarisse Hart, Meghan Blumstein, and Sarah Ganong for their tireless assistance with the project and their commitment to communicating science in service to society. Finally, thank you to Henry Lee and the Belfer Center for Science and International Affairs at the Harvard University Kennedy School of Government and to David Stier and the Springfield Science Museum for generously hosting outreach events.
Funding for this research and report has been provided by the New England Natural Resources Center, Highstead Foundation, the Jessie B. Cox Charitable Trust, the Long-Term Ecological Research program of the National Science Foundation, and the Smithsonian’s Grand Challenges Consortia.
Credits
Maps and figures: O2 Planning & Design, Inc., Alberta, Canada; Brian Hall, Harvard Forest
Graphic Design and layout: RavenMark, Inc., Montpelier, Vermont
Printing: Villanti Printers, Inc., Milton, Vermont
Photographs: David Foster (pp. 1-2, 4-5, 18, 20-1, 25-7, 29, 31); Clarisse Hart (pp. 1, 6-7, 17, 24, 28, 30); Rob Lilieholm (p. 1), Robert Morton (p. 16)

Four Scenarios for the Future of the Massachusetts Landscape