foundations for success
DESCRIPTION
April 03, 2002 Foundations for Success - which includes a set of challenging content expectations for the end of grade 8 that have been benchmarked to the best international and state standards in order to reflect the core mathematical knowledge and skills students will need for success in high school and beyond - was a report of an early initiative of Achieve, the Mathematics Achievement Partnership. http://www.achieve.orgTRANSCRIPT

Consultation Draft
Mathematics Expectations for the Middle Grades

Mathematics Expectations for the Middle Grades
Consultation Draft

FOUNDATIONS FOR SUCCESS: CONSULTATION DRAFT
Copyright © 2002 Achieve, Inc. All rights reserved.
No part of this publication may be reproduced or transmitted in any form or by any means, electronic or mechanical, including photocopy, recording or any information storage and retrieval system, without permission from Achieve, Inc.
E-mail: [email protected]
Editorial and design: KSA-Plus Communications, Inc.

Mathematics Achievement Partnership | 5
Achieve is an independent, bipartisan, nonprofit
organization created by governors and corporate
leaders to help raise standards and performance in
American schools. Achieve was founded at the 1996
National Education Summit and subsequently spon-
sored additional Summits in 1999 and 2001 that
brought together more than 100 governors, business
leaders and educators from around the nation.
Achieve’s principal purposes are to:
• provide sustained public leadership and advocacy
for the movement to raise standards and
improve student performance;
• help states benchmark their standards, assess-
ments and accountability systems against the
best in the country and the world;
• build partnerships that allow states to work
together to improve teaching and learning and
raise student achievement; and
• serve as a national clearinghouse on education
standards and school reform.
Achieve, Inc.Board of Directors, Achieve, Inc.
Co-chairsJohn Engler, GovernorState of Michigan
Louis V. Gerstner, Jr., Chairman and CEOIBM Corporation
Co-vice chairsPhilip M. Condit, Chairman and CEOThe Boeing Company
Gray Davis, GovernorState of California
Board membersKeith E. Bailey, Chairman, President and CEOWilliams
Roy E. Barnes, GovernorState of Georgia
Craig R. Barrett, President and CEOIntel Corporation
Frank Keating, GovernorState of Oklahoma
Gary Locke, GovernorState of Washington
Edward B. Rust Jr., Chairman and CEOState Farm Insurance
Arthur F. Ryan, Chairman and CEOPrudential
Bob Taft, GovernorState of Ohio
PresidentRobert B. Schwartz
Executive Vice PresidentMatthew Gandal
Project DirectorLaura E. McGiffert

Table of Contents
Achieve’s Mathematics Achievement Partnership . . . . . . . . . . . . . . . . . . . 7
Ackowledgments . . . . . . . . . . . . . . . . . . . . . . . . . . . . . . . . . . . . . . . . . . . . . . . 8
Achieve’s Mathematics Advisory Panel . . . . . . . . . . . . . . . . . . . . . . . . . . . . 9
Introduction . . . . . . . . . . . . . . . . . . . . . . . . . . . . . . . . . . . . . . . . . . . . . . . . . . . 11
Frequently Asked Questions About MAP . . . . . . . . . . . . . . . . . . . . . . . . . . 15
Expectations and Sample Problems . . . . . . . . . . . . . . . . . . . . . . . . . . . . . . 23
Expectations . . . . . . . . . . . . . . . . . . . . . . . . . . . . . . . . . . . . . . . . . . . . . . . . . . 25
Sample Problems . . . . . . . . . . . . . . . . . . . . . . . . . . . . . . . . . . . . . . . . . . . . . . 33I. Number . . . . . . . . . . . . . . . . . . . . . . . . . . . . . . . . . . . . . . . . . . . . . . . . . . 33II. Data . . . . . . . . . . . . . . . . . . . . . . . . . . . . . . . . . . . . . . . . . . . . . . . . . . . . . 51III. Geometry . . . . . . . . . . . . . . . . . . . . . . . . . . . . . . . . . . . . . . . . . . . . . . . . . 75IV. Algebra . . . . . . . . . . . . . . . . . . . . . . . . . . . . . . . . . . . . . . . . . . . . . . . . . . 115
Appendices . . . . . . . . . . . . . . . . . . . . . . . . . . . . . . . . . . . . . . . . . . . . . . . . . . 163Appendix A: Mathematical Topics for Grades 1–5 . . . . . . . . . . . . . . . . . . . . 163Appendix B: Mathematical Topics for Grades 9–11 . . . . . . . . . . . . . . . . . . . 164Appendix C: Explanation of Mathematical Subtleties . . . . . . . . . . . . . . . . . . 166
FOUNDATIONSSuccessfor

Mathematics Achievement Partnership | 7
FOUNDATIONSSuccessfor Achieve’s Mathematics
Achievement PartnershipSince the appearance of Sputnik in 1957, national
leaders and educators have focused on the impor-
tance of helping U.S. students stay competitive
internationally in mathematics and science. Today,
Achieve’s Mathematics Achievement Partnership
(MAP) is a comprehensive initiative dedicated to
helping states improve their middle-school students’
mathematics performance — so U.S. students can
measure up to the best in the world. Unique because
it is based in lessons from top-performing countries,
MAP is the most ambitious effort to date to create an
integrated system that enables states to compare
achievement and to provide schools with access to
world-class training and teaching materials.
At MAP’s core is Foundations for Success, a set of
challenging content expectations for the end of
grade 8 that have been benchmarked to the best
international and state standards in order to reflect
the core mathematical knowledge and skills students
will need for success in high school and beyond.
In partnership with other national organizations,
MAP will build off Foundations for Success to provide
states with concrete tools they can use to improve
mathematics instruction and student achievement,
including aligned materials and tools for high quality;
sustained professional development for teachers;
diagnostic tests for students coupled with guidance
for teachers on how to use assessment results to
improve and target instruction; and a common,
annual, internationally benchmarked eighth-grade
mathematics test whose results — reported at both
the school and student levels — will be comparable
across state lines.
At the time of this printing, 14 states are col-
laborating with Achieve on this initiative. By working
together, Achieve and its partner states are pooling
resources, information and energy to affect dramatic
gains in middle-school mathematics. The result will
be U.S. students who are equipped to compete with
the best in the world.
CaliforniaGeorgiaIllinoisIndianaMarylandMassachusettsMichigan
New HampshireNorth CarolinaOhioOregonVermontWashingtonWisconsin
MAP Partner States

8 | Achieve, Inc.
Achieve Contributors
AcknowledgmentsFOUNDATIONSSuccessfor
Foundations for Success is the result of the hard work
of numerous people. First and foremost, we acknowl-
edge with gratitude the members of our Mathematics
Advisory Panel, whose time, energy and agile minds
were invaluable to this project. We owe special thanks
to Ralph Raimi, William Schmidt and Lynn Steen for
their efforts that extended far beyond the call of duty.
We also would like to acknowledge individuals at
the National Center for Education and the Economy
for their role in helping to craft the mathematics expec-
tations: Phil Daro, director of assessment and develop-
ment, facilitated the meetings of the Mathematics
Advisory Panel; and Ann Shannon, director of mathe-
matics, worked with the panel to draft the expectations
and sample problems. We thank them for their hard
work, enthusiasm and patience.
We also would like to recognize a number of
individuals who provided Achieve with expert advice,
editorial assistance and/or moral support during the
development of these expectations: Nancy Belden of
Belden Russonello & Stewart; Kathy Delaney, Bill
Porter and Andrea Sussman of KSA-Plus Communi-
cations; Joseph Garcia from CommunicationWorks;
Mary Schaefer, mathematical consultant; Celia
Stevenson, graphic designer; and Malcolm Swan from
the University of Nottingham in Nottingham,
England. We are particularly grateful for the help of
Washington-based education writer Nancy
Henderson, who provided significant writing and edi-
torial assistance.
Finally, we extend special thanks to the Achieve
staff members who contributed to the creation of these
expections, as well as to the broader Mathematics
Achievement Partnership. Laura McGiffert, the princi-
pal manager of this project, assumed primary responsi-
bility for the development of Foundations for Success;
Robert Rothman provided editorial assistance; Jennifer
Vranek contributed to the initial research; Mark Faust
supplied additional research; and Vickie Barber and
Levon Saunders provided logistical support.
Agilent Technologies Foundation*The Annenberg FoundationAnonymousAT&T Foundation BellSouth FoundationBill & Melinda Gates FoundationThe Boeing CompanyBristol-Myers Squibb Foundation, Inc.Citicorp FoundationEastman Kodak CompanyE.I. DuPont de Nemours and CompanyIBM CorporationIntel*
The Pew Charitable Trusts*Phillips Petroleum CompanyThe Procter & Gamble FundThe Prudential FoundationState Farm Insurance CompaniesState Street FoundationThe UPS FoundationThe Washington Mutual FoundationThe William and Flora Hewlett FoundationWilliamsThe Xerox Foundation
* Provided special funding for the MAP Initiative

Achieve’s MathematicsAdvisory Panel
FOUNDATIONSSuccessfor
Chuck Allan Mathematics ConsultantMichigan Department of Education
Diane J. BriarsSenior Program Officer, Mathematics and SciencePittsburgh City Schools
Wade Ellis, Jr.Mathematics InstructorWest Valley College
Joan Ferrini-MundyAssociate Dean for Science and Mathematics
EducationCollege of Natural ScienceProfessor of Mathematics and Professor of
Mathematics EducationMichigan State University
Linda B. HuntMathematics Coordinator and
Middle Grades Mathematics TeacherChicago Public SchoolsSESAME Instructor and Curriculum WriterUniversity of Chicago
W. James LewisProfessor, MathematicsDepartment of Mathematics & StatisticsUniversity of Nebraska
Jim MilgramProfessorDepartment of MathematicsStanford University
Marge PetitSenior AssociateNational Center for the Improvement of Educational
Assessment
Ralph A. RaimiProfessor EmeritusDepartment of MathematicsUniversity of Rochester
Paul SallyProfessor of MathematicsUniversity of Chicago
William SchmidtUniversity Distinguished ProfessorMichigan State UniversityDirector and National Research CoordinatorU.S. TIMSS Research CenterMichigan State University
Lynn SteenProfessor of MathematicsSt. Olaf College
Uri TreismanProfessor of MathematicsDirector, Dana CenterUniversity of Texas
Norm WebbSenior Research ScientistWisconsin Center for Education ResearchUniversity of Wisconsin
Hung-Hsi WuProfessor of MathematicsUniversity of California at Berkeley
The development of Foundations for Success was led by
Achieve’s Mathematics Advisory Panel, an expert panel
of mathematicians, mathematics educators, curriculum
specialists, and state and local mathematics supervisors
representing a broad spectrum of perspectives about
mathematics education. This advisory panel reviewed
an analysis of standards from numerous states and
countries and, after considerable discussion, made
judgments about what mathematics in the middle
grades should entail. After vigorous debate and careful
compromise, the panel concluded that the set of expec-
tations included in Foundations for Success represents the
core knowledge and skills that students should learn
to be prepared for high school and beyond.
Mathematics Achievement Partnership | 9

Mathematics Achievement Partnership | 11
INTRODUCTION
To confront those challenges,
Achieve, Inc.’s Mathematics
Achievement Partnership (MAP) has
been working with its partner states
to strengthen U.S. mathematics educa-
tion. MAP recognizes that improving
student performance depends on a
comprehensive approach based on:
• supporting teachers by equipping them with
the knowledge and skills they need to help
raise student proficiency;
• measuring student proficiency on a regular
basis; and
• using assessment results to assist teachers and
improve classroom practice.
The first step in this approach is to identify the
knowledge and skills that students need to develop
to be successful. Foundations of Success: Mathematics
Expectations for the Middle Grades does just that.
These expectations are the outcome of extensive
efforts by Achieve’s Mathematics Advisory Panel, a
diverse group of classroom teachers, curriculum spe-
cialists, state and local supervisors of mathematics
education, prominent university mathematicians, and
mathematics educators. Representing a wide spectrum
of perspectives about mathematics education, mem-
bers of the Mathematics Advisory Panel have reached
general agreement on the knowledge, understanding
IntroductionFOUNDATIONSSuccessfor
From using a Palm Pilot to managing a retirement
portfolio, life in the 21st century is drenched in data,
dominated by computers and controlled by quantitative
information. The daily news is full of statistics, graphs
and percentages; political polls, election outcomes and
census counts are based on mathematical concepts
such as ratio, probability and sampling. Virtually all
workers — custodians, secretaries, farmers, electricians,
building contractors, store managers, architects,
lawyers, graphic designers and others — need to deal
with quantitative concepts and use reasoning skills
in their jobs. Indeed, those who lack mathematical
know-how face a very real threat of being left behind —
as citizens, as consumers and as workers.
Traditionally, it has been sufficient for only some of
us to be mathematically proficient. To fully participate
in the 21st century, however, all citizens must be com-
fortable and fluent with mathematics. In addition to
dealing with quantitative ideas in virtually any job,
today’s students will need mathematics to handle their
finances, evaluate medical risks and understand public
policy issues — from the future of Social Security to
the risks of genetically modified foods. As the
National Research Council (NRC) concludes in its
report Adding It Up: Helping Children Learn Mathematics,
“All young Americans must learn to think mathemati-
cally, and they must think mathematically to learn.”
While U.S. students do reasonably well at
straightforward calculations, numerous state, national
and international assessments conducted over the past
30 years indicate that far too few have a firm under-
standing of fundamental mathematical concepts.
Additionally, few students can use mathematics to
solve straightforward, real-life problems. These short-
comings limit individual opportunity and threaten
the nation’s future.

12 | Achieve, Inc.
FOUNDATIONS FOR SUCCESS: CONSULTATION DRAFT
and skills that students need to have before entering
high school. These unified standards provide a com-
mon target for states and establish a strong founda-
tion for the mathematical proficiency called for by
the NRC and other leading national organizations.
Building a New Foundation
MAP’s work is grounded in the 1995 Third
International Mathematics and Science Study (TIMSS).
This study and its 1999
follow-up, TIMSS-R,
present a sobering
picture of how U.S.
students perform when
compared with their
peers around the world.
While U.S. fourth
graders are among the
best prepared in mathe-
matics, American student achievement rapidly falls
off in the middle grades, trailing countries such as
Canada, England, Australia, the Czech Republic, Japan
and South Korea. By the end of high school, U.S.
students do even worse, performing near the bottom
internationally.
TIMSS data show that in too many U.S. class-
rooms, mathematics curricula in grades 6 through 8
simply repeat previously taught concepts and do not
provide deep study in any area. The data also show that
American mathematics curricula for the middle grades
generally do little to advance mathematics knowledge
beyond arithmetic computation. Meanwhile, students
in other countries are mastering arithmetic concepts by
the end of sixth grade and advancing to the fundamen-
tals of algebra and geometry in the seventh and eighth
grades. Thus, a far greater proportion of students in
other countries are preparing for substantial mathe-
matics courses in high school, while too many U.S.
students are getting left behind.
Achieve reaffirmed the TIMSS findings with
its own analysis of 21 state tests of fourth- and
eighth-grade students. It found that more than 60 per-
cent of the eighth-grade test items dealt with computa-
tion, whole numbers and fractions — procedures that
students in other countries master before the seventh
grade. In top-performing nations, seventh- and eighth-
grade curricula include proportionality and slope, con-
gruence and similarity, equations and functions, and
two- and three-dimensional geometry — topics that
most U.S. state tests address sparingly, if at all.
Fortunately, the United States does not have to
look far to find a road map for improvement. In 1989,
the National Council of Teachers of Mathematics
(NCTM) initiated the drive toward higher standards
in mathematics education by publishing K–12 stan-
dards that showed the breadth and depth of mathe-
matics proficiency required for the 21st century.
These standards, and NCTM’s revised version,
Principles and Standards for School Mathematics, published
in 2000, laid the groundwork for MAP. These docu-
ments, and the Achieve TIMSS analysis, make the
case that strong performance in mathematics requires
an emphasis on procedural skills, conceptual knowl-
edge and problem solving.
Following the TIMSS analysis, MAP asked math-
ematicians and mathematics educators to take a fresh
look at the mathematics expectations for the middle
grades. MAP blends its advisory panel’s conclusions
and the TIMSS findings in Foundations for Success, a
blueprint for mathematics in the middle grades that is
benchmarked to international standards. This set of
expectations is designed to be challenging yet realis-
tic, and eventually attainable by all students and
teachers who are given adequate support. With the
goal of providing all students with a strong founda-
tion in mathematics before they begin high school, it
aims to cultivate every student’s potential. Those who
master fundamental concepts in the middle grades
will have the tools they need to succeed in high
school, college and the workplace.
Students will need
mathematics to
handle their finances,
evaluate medical
risks and understand
public policy issues
— from the future of
Social Security to the
risks of genetically
modified foods.

Mathematics Achievement Partnership | 13
INTRODUCTION
A Coordinated Approach
MAP is creating tools to help states build an enduring
foundation for mathematics education: aligned expec-
tations, professional development, curriculum materi-
als and assessments. MAP’s comprehensive approach
is more than just “road repair.” MAP offers a bold,
forward-looking infrastructure for strengthening and
updating mathematics education in the middle grades.
These tools will provide students with the understand-
ing and skills they need to succeed in high school and
beyond.
1. World-class expectations. Foundations for Success is
a set of ambitious expectations for the end of
grade 8. It incorporates the fundamentals that
students in top-performing countries are learning
and the skills that U.S. students will need to suc-
ceed. It is a blueprint for reorienting mathematics
in the middle grades.
2. High-quality teacher support and curriculum
guidance. To ensure that teachers are fully pre-
pared to help students meet world-class stan-
dards, MAP will work with states to provide
teachers with extensive opportunities to improve
their mathematics knowledge and teaching prac-
tices. In addition, MAP will identify materials
such as sample teaching guides, ideas for study
units and recommended textbooks that are
aligned with the mathematics skills and under-
standing described in Foundations for Success.
3. Ongoing diagnostic tests and an end-of-eighth-
grade assessment. These two types of tests,
aligned with MAP’s standards, will reflect the
substance and scope of what students in the mid-
dle grades are learning in top-performing coun-
tries. Teachers will use the diagnostic tests in the
classroom to track student progress in grades 6
through 8 and adjust instruction accordingly. The
end-of-eighth-grade test will be offered each year
as part of each state’s assessment system.
In addition, it will provide results for individual
schools and students, allowing parents, educators
and policymakers to compare student achieve-
ment across state lines. That is not possible with
existing state tests because different tests measure
different skills and knowledge.
Setting World-Class Expectations
Foundations for Success offers guidelines and targets
for states to provide mathematics education that is
benchmarked to the best in the world. It identifies
the skills and knowledge that will underlie MAP’s pro-
fessional development, curriculum and assessment tools.
The expert panel of mathematicians, mathematics
educators, classroom teachers and curriculum special-
ists who have worked with Achieve to develop these
expectations represents a wide spectrum of perspec-
tives about mathematics education (Appendix A). Rich
with algebra, geometry and data analysis, Foundations for
Success represents a balanced and informed view of the
necessary emphases and scope of mathematics in the
middle grades. Students who have met these expecta-
tions will have strong computational and reasoning
skills, the ability to work with abstract ideas and com-
plex situations, and the ability to interpret data and
solve real-life problems.
To help illustrate what the MAP expectations
mean, a number of sample problems and methods
for solving these problems accompany the outline
of learning objectives. These problems do more than
show procedures and skills. They demonstrate the
depth of mathematical understanding and reasoning
skills implied by the expectations. The primary pur-
pose of these problems is to assist curriculum devel-
opers and teacher educators as they rethink their
learning objectives for students in the middle grades.
Teachers also may find them useful for classroom
discussion. The accompanying solutions do not
represent sample student-produced solutions, and
MAP does not intend that schools use the illustrative
problems to assess student performance.
MAP recognizes that Foundations for Success encom-
passes more mathematics than most U.S. students are

14 | Achieve, Inc.
FOUNDATIONS FOR SUCCESS: CONSULTATION DRAFT
currently learning by the end of the eighth grade. In
fact, it covers more than some students now learn by
the time they finish high school. There is no doubt,
however, that MAP’s expectations are realistic goals
for any 14-year-old who is provided with adequate
support, including strong preparation during grades
K–5.
These standards will not be achieved overnight,
but they are attainable, appropriate and necessary.
With thorough professional development for teachers
and comprehensive instruction for students in grades
K–8, U.S. students eventually will be able to perform
at the same level as their peers around the world.
FREQUENTLY ASKED QUESTIONS ABOUT MAP
FQ
FOUNDATIONSSuccessfor
THE NEED
Why is it so imp
become mathem
For life in the 21st cis as basic as literacand the economy lik
models undergird ro
puter graphics, cryp
scientific and techn
ing to construction
turing, data rule dec
ing with quantitativ
viduals confront ma
in managing person
risks and interpretin
such as exponential
now as important to
arithmetic of calcula
tainty about vote co
election is a prime e
is no simple matter.
tury democracy, all
matically proficient
What is mathem
Proficiency requires It involves a blend o
al understanding, to
mathematical proble
soning ability, logica
procedural skills. In
Helping Children Learn
five interrelated asp
Mathematics Achievement Partnership | 15
requently Askeduestions About MAP
FOR HIGH STANDARDS
ortant for all students to
atically proficient?
entury, mathematical proficiency y. Mathematics permeates society
e never before. Mathematical
botics, genetics research, com-
tography, and countless other
ological endeavors. From market-
and from agriculture to manufac-
isionmaking. In addition to deal-
e ideas in virtually any job, indi-
thematical and statistical concepts
al finances, evaluating medical
g public policy issues. Concepts
growth and margins of error are
the individual as the more basic
ting discounts or tips. The uncer-
unts in the recent presidential
xample of how dealing with data
To participate fully in a 21st cen-
students need to become mathe-
.
atical proficiency?
much more than just “the basics.”f basic knowledge with conceptu-
gether with the ability to solve
ms. Proficiency encompasses rea-
l thinking, problem solving and
its recent report Adding It Up:
Mathematics, the NRC identifies
ects of mathematical proficiency:
conceptual understanding, procedural fluency, strate-
gic competence, adaptive reasoning and productive
disposition. With these characteristics, mathematical
proficiency provides the ability to use mathematics in
a wide variety of situations — in school, at home and
on the job.
What’s new and different about MAP’s
expectations?
Foundations for Success builds on the widelyinfluential standards developed by the NCTM, as wellas a number of state standards documents. MAP’s lens
is, however, somewhat different: MAP focuses on
what countries with top-performing students expect
in the middle grades.
Educators will see many areas of overlap between
Foundations for Success, NCTM’s Principles and Standards
for School Mathematics and current state standards, but
they also will see important distinctions. In particular,
MAP focuses on what has given other countries an
advantage in the middle grades — fundamentals.
Moreover, the MAP expectations generally represent
a higher level of data analysis, geometry and algebra
than most states require by the end of eighth grade.
RAISING THE BAR
How much mathematics are U.S. students
currently learning?
Not enough. Evidence from state, national and inter-
national studies shows that many U.S. students fail to
meet even traditional goals for eighth-grade mathe-
matics — competence in arithmetic and readiness for
algebra. According to the National Assessment of

16 | Achieve, Inc.
FOUNDATIONS FOR SUCCESS: CONSULTATION DRAFT
Educational Progress, fewer than 30 percent of U.S.
fourth- and eighth-grade students achieve beyond the
“basic” level for their grade in mathematics. By 12th
grade, fewer than 20 percent achieve beyond “basic.”
Results from TIMSS confirm this finding: While
American fourth graders placed near the top of the 40
participating nations, U.S. eighth graders placed
below the international average. By
the end of high school, American students were near
the bottom of the performance charts.
If students already are having a difficult
time meeting existing standards, isn’t it
unrealistic to pursue more ambitious
expectations?
Students need to be prepared for the challenges they willface in college and on the job. Nearly one-third of stu-
dents who enter college immediately after high
school graduation enroll in remedial mathematics. In
addition, U.S. employers cannot find enough skilled
workers: A recent survey of more than 1,000 employ-
ers found that more than one-third of job applicants
are turned away because they lack mathematical and
verbal skills needed for the jobs they seek. The need
for skilled workers will only increase, as the U.S.
Bureau of Labor Statistics reports that the five fastest-
growing types of employment through 2008 will be
in fields that depend on mathematics.
MAP’s expectations are realistic goals for any 14-year-old student who is provided with adequate support.How do we know this? Students in other countries
routinely attain these goals. U.S. students are as capa-
ble as students anywhere, but they need the same
learning opportunities as their international peers. In
contrast with other nations, the United States simply
has not made effective use of the first eight years of
mathematics instruction.
But won’t higher expectations lead to a sit-
uation where even more students will fail?
Not if students are well prepared and if schools faith-fully monitor student progress, ensure that teachers arewell prepared and provide appropriate intervention to
make sure that students do not fall behind. MAP’s
approach combines high expectations with frequent
feedback on student performance and professional
development for teachers. Achieve realizes that it will
take time for schools to implement programs that
reflect MAP’s expectations and for students to reach
these high standards. It may take a generation to get
to the point where every student succeeds, but now
is the time to begin.
How will the MAP expectations and assess-
ments affect low-income students, racial
minorities, English language learners and
students with disabilities?
MAP’s approach will help ensure that all studentsreceive whatever support they may need to acquire astrong foundation. The bottom line is that high expec-
tations in mathematics will serve all students well —
including those who are disadvantaged. Experience has
shown that when students and teachers receive ade-
quate support, learning follows. Because the MAP
assessments will be diagnostic tools, they will help
identify which students need extra support and what
types of support they need. Schools then will know
just what they need to do to ensure that no student is
left behind.
Although performance gaps in mathematics are
evident at all levels of schooling, they widen signifi-
cantly in the middle grades, to the point where those
who are farthest behind have little chance of catching
up during the high school years. By focusing atten-
tion on the middle grades, Foundations for Success can
help ensure that everyone enters high school well
prepared for further learning.
Does Foundations for Success do more than just
introduce algebra and geometry in earlier
grades?
Yes, it differs from current practice in several importantways:
• It places special emphasis on reasoning — thelifeblood of mathematics. This emphasis signals
to schools that there is more to mathematics

Mathematics Achievement Partnership | 17
FREQUENTLY ASKED QUESTIONS ABOUT MAP
than procedural knowledge — even in learning
about numbers, and even in the elementary
school grades. The ability to reason mathemati-
cally is the one quality that scientists, engineers
and employers in the skilled trades find most
lacking among high school students and gradu-
ates. The lack of reasoning capability among
students is widely known. Traditionally, high
school geometry has been the place where stu-
dents have been introduced to rigorous think-
ing through formal proofs; in recent years,
however, this tradition has been on the wane.
Foundations for Success recommends not only an
emphasis on geometric reasoning, but also a
healthy emphasis on empirical geometric expe-
riences. This exposure is crucially important
because many of students’ difficulties with
abstract geometric proofs have roots in their
lack of empirical background in geometry.
Without empirical experience, many students
have great difficulty making sense of proofs.
• It emphasizes measurement and data analysis.Numbers form the bridge from elementary to
middle grades mathematics, not only as a step-
ping stone to the abstractions of algebra, but
also as a pathway to the practical tools of risk
analysis and statistical reasoning. Students in
middle grades need to extend the hands-on
experiences of elementary school arithmetic to
increasingly realistic experiences with measur-
ing and sampling. They need to gain apprecia-
tion for the inaccuracies of measurement, the
uncertainties of sampling and the risks associated
with drawing inferences from situations where
information is only partially known. Wisely cho-
sen examples help develop these experiences and
link them with concepts in algebra and geometry.
• It introduces the foundations of algebra in anage-appropriate way. Foundations for Success
expects students not just to learn to apply
formulas, but to become fluent in the use of
symbolic notation and in solving linear equa-
tions. The expectations also include quadratic
functions and their related parabolic graphs,
but they omit the quadratic formula itself for an
important pedagogical reason: It is more impor-
tant for students to focus on general procedures
than on any particular formula.
THE MIDDLE GRADES
Why does Foundations for Success focus on the
middle grades?
There are several important reasons for reorientingmathematics in the middle grades:
• The middle grades are the period when Americanstudents clearly begin to fall behind their international peers. According to evidence from
TIMSS, the
drop-off in mathe-
matics achieve-
ment among
U.S. students
between fourth
and eighth
grades reflects
a weakening in
curriculum and
instruction. This downward slide continues, and
American students rank near the bottom inter-
nationally by the end of high school. TIMSS
did more than just rank students internationally.
It included a curriculum study that found the
mathematics curriculum in U.S. middle grades
to be far less challenging and less coherent than
the curriculum in other countries, especially
countries with the highest levels of achieve-
ment. While other nations concentrate on fun-
damental mathematical subjects such as algebra
and geometry in the middle grades, most U.S.
students are still doing elementary arithmetic.
While American fourth
graders placed near the
top of the 40 participating
nations, U.S. eighth
graders placed below the
international average.
By the end of high school,
American students were
near the bottom of the
performance charts.
18 | Achieve, Inc.
FOUNDATIONS FOR SUCCESS: CONSULTATION DRAFT
• By giving all students a solid foundation in themiddle grades, Foundations for Success sup-ports equity and opportunity for all. Students
who are mathematically well prepared by the
end of eighth grade are much more likely to
take challenging mathematics courses in high
school and then go on to college. Students who
meet MAP’s expectations will be well prepared
in the basic mathematical tools required for
work and for further study, notably algebra,
geometry and data analysis.
• The middle grades are where students’ minds andcareer options are most flexible. While demand
for U.S. scientists and engineers is rising rapid-
ly, the number of U.S. college graduates in
engineering, mathematics and computer science
has been on the wane since 1986. The middle
grades are the place to begin reversing this
trend. To pursue a career in science or technol-
ogy, students need a significant program of
high school mathematics, which requires the
foundations of alge-
bra, geometry and
data analysis in the
middle grades.
Giving U.S. students
a world-class mathe-
matics education is
the only way to pro-
duce enough highly
skilled U.S. workers. To strengthen middle
school mathematics is to invest in the future
of America.
• Focusing on the middle grades is a strategic first step toward improving the entire K–12mathematics curriculum. Even if time, money
and energy were limitless, trying to revamp
the entire K–12 curriculum all at once would
be fraught with overwhelming difficulties.
The middle grades are the crossroads where
students ready themselves to acquire advanced
mathematical skills and knowledge. By focusing
first on the middle grades, MAP hopes not only
to give students a firm foundation during a cru-
cial period of their academic development, but
also to help frame the goals for high school and
elementary school mathematics. The MAP
expectations set the stage for high school math-
ematics and give elementary schools clear indi-
cation of the kind of mathematical achieve-
ments to which they should aspire.
Why do all students need to learn algebra,
geometry and data analysis in the middle
grades? What’s wrong with learning at a
slower pace?
Nothing is wrong with students who learn at a slowerpace. What’s wrong are school systems that force
many of their students to learn too slowly. We know
from international studies and from high-achieving
school districts in the United States that MAP’s
expectations are realistic goals for any 14-year-old
student who is provided with adequate support.
Students who learn algebra, geometry and data
analysis in the middle grades will be able to pursue
the kind of mathematics in high school that will leave
them well prepared for success both in college and in
their future jobs. Not every student must learn at this
same pace, but all students must have the opportunity
and encouragement to do so. Students who do not
meet these standards by the end of eighth grade sim-
ply will have more limited opportunities in high
school and beyond.
In the middle grades, it is important to teach all
students as if they may pursue an ambitious high
school and college curriculum. Tracking young ado-
lescents into a curriculum that ignores their potential
or puts college out of reach is unconscionable.
Students who are
mathematically well
prepared by the end
of eighth grade are
much more likely to
take challenging
mathematics courses
in high school and
then go on to college.

Mathematics Achievement Partnership | 19
FREQUENTLY ASKED QUESTIONS ABOUT MAP
SUPPORTING TEACHERS
Why do teachers like Foundations for Success?
It includes illustrative problems and sample solutionsthat focus on concepts that need clarification or are dif-ficult to teach. Teachers find these examples especially
helpful as they prepare for class discussions. In addi-
tion, Foundations for Success includes supplementary
notes that call attention to potential pitfalls involving
subtleties in mathematical language (Appendix C).
Students and teachers can find it difficult to grasp
some concepts — equality and equation, linearity and
proportion, abstraction and generality — because
these terms are used in confusing and contradictory
ways in mainstream textbooks and in common dis-
course. The illustrative problems also include specific
examples that help to clarify subtleties in terminology.
It offers the chance to teach more meaningful math-ematics. Experienced teachers know that too often
mathematics curricula in the seventh and eighth
grades offer students little opportunity to advance
beyond the mathematics taught in the sixth grade.
Teachers who are frustrated by review, review and
more review — a spiral curriculum gone flat — will
be excited by the chance to teach meaningful skills
and concepts. And their students will benefit from the
chance to replace mind-numbing review with interest-
ing and relevant mathematics.
What kinds of support can teachers expect?
First, they will get numerous opportunities to improvetheir mathematics knowledge and teaching practices.Currently, few states require teachers to have a license
that is specific to the middle grades, and few require a
specific mathematics background. As a result, many
teachers in grades 6 through 8 do not have the math-
ematical knowledge that they need to teach the fun-
damentals of data analysis, geometry and algebra.
To help teachers acquire the necessary knowledge
and skills, MAP will help states provide ongoing
professional development. Rather than the customary
elementary introduction to advanced mathematics,
however, teachers in the middle grades will receive
opportunities for sustained lessons that provide a deep
and rich understanding of the mathematics that stu-
dents should learn before entering high school.
Further-more, the leverage of coordinated action
among participating states will be a powerful force in
the success of their professional development programs.
Teachers also will get a wealth of useful teachingtools. MAP will identify sample teaching guides, ideas
for study units, textbooks and other materials that
address the mathematics skills and understanding out-
lined in Foundations for Success. Thus, in addition to pro-
fessional development, teachers and schools in partici-
pating states will have access to a plethora of resources,
including:
• MAP’s world-class expectations;
• examples and clarifications — the illustrative
problems and supplementary notes in Foundations
for Success clarify important concepts and sub-
tleties in mathematical language (Appendix C),
so these will be useful tools for professional
development;
• a “consumer guide” to curriculum materials and
textbooks currently available;
• juried lessons prepared by teachers for use in
professional development and in student
instruction;
• diagnostic tests for classroom use; and
• an Internet-based practice version of the MAP
eighth-grade assessment for teachers to use in
the classroom and for parents to use with stu-
dents at home.
How will teachers know that their students
are meeting MAP’s expectations?
Through ongoing embedded assessments and an end-of-eighth-grade test. MAP’s classroom diagnostic
tests will allow teachers to track students’ progress
throughout grades 6, 7 and 8, and adjust instruction

20 | Achieve, Inc.
FOUNDATIONS FOR SUCCESS: CONSULTATION DRAFT
in accordance with the results. In addition, MAP will
offer an end-of-eighth-grade assessment annually,
which will measure individual student performance
with respect to the MAP expectations.
THE K–12 CONTINUUM
What mathematics do students need to
learn in the elementary grades?
Students need to enter the middle grades with confidencethat mathematics is a source of useful tools for solvinginteresting problems. To build confidence and enthusi-
asm, students need strong preparation from kinder-
garten to grade 5, including:
• fluency with manual computation and mental
estimation;
• experience visualizing and drawing geometric
objects;
• practice formulating mathematical questions
from various contexts; and
• plenty of opportunities to explain and critique
mathematical thinking and use mathematics to
solve problems.
Elementary school students need to become
fluent with the basic computations of arithmetic,
and they also need to understand why these proce-
dures are valid and what concepts they represent.
Thorough understanding grows best from extensive
hands-on experience — in measuring and counting,
in exploring common geometric objects, and in repre-
senting data in different forms. It is not enough to
focus just on computational and procedural skills,
because students’ ability to reason mathematically
depends on a deep understanding of central mathe-
matical concepts. In turn, procedural skills provide
firm support for conceptual understanding.
No short list of topics alone can encompass all
the skills and knowledge required for such deep
understanding, but Appendix A lists many topics that
students need to learn before beginning a program
for the middle grades based on the MAP expectations.
It is important that students encounter topics in a
sequence that respects the inherent logic of mathe-
matics and in ways that suit students’ development of
mathematical understanding.
If students enter high school already know-
ing the fundamentals of algebra, geometry
and data analysis, what is left for them to
learn?
Plenty. Whether students are heading toward college,technical training or a job after high school, they willneed advanced mathematics. Following a significant
curriculum in the middle grades, all students should
complete three years of high school mathematics cov-
ering advanced topics in statistics, geometry and alge-
bra. (Appendix B shows one of the many ways in
which that may be accomplished.) These subjects
form not only the foundation of mathematics, but also
of science, economics, business, medicine and many
other fields of study. By making understanding of fun-
damental mathematical ideas an expectation of high
school entry, Foundations for Success will encourage high
school classes in all subjects to start employing the
powerful tools and concepts of mathematics. Strength-
ening high school students’ mathematics and quantita-
tive thinking skills will help to reduce significantly the
number of students who leave school with no better
option than a dead-end job.
ILLUSTRATIVE PROBLEMS
What is the purpose of the problems and
solutions?
The primary purpose of the problems and sample solu-tions is to illustrate the scope, depth and meaning of theexpectations. For example, an expectation that stu-
dents should be able to “analyze verbal problems and
generate appropriate algebraic expressions” can mean
many different things — from writing A = lw in order
to calculate the area of a rug, to writing formulas that
represent the costs of different cell phone contracts.
Mathematics Achievement Partnership | 21
FREQUENTLY ASKED QUESTIONS ABOUT MAP
Whenever curricular goals are interpreted simplis-
tically, students pay the price of lowered expectations.
In calibrating the broad language of expectations to
high standards, the illustrative problems and sample
solutions are an integral part of Foundations for Success.
Why isn’t each problem matched directly to
a specific expectation?
Although some problems do align with particularexpectations (for example, understanding square rootsor greatest common divisors), most involve several expectations. These problems often cut across the
major strands of number, data, geometry and algebra.
This is because mathematics itself is highly intercon-
nected, and most real problems that depend on math-
ematical thinking for
solutions draw on
several parts of mathe-
matics. Although
narrow problems
designed to reinforce
individual learning
objectives may have
a place in mathemat-
ics instruction, most
of them are too limited in depth and connections
to convey adequately the intentions of the MAP
expectations.
Aren’t these problems too sophisticated for
middle school students?
Like the expectations themselves, the illustrative prob-lems are intended for adults, not students. They are
designed to help teachers, curriculum developers,
administrators, school board members and parents
understand what mathematics instruction in the mid-
dle grades should aim for. Although many of these
problems could serve well as catalysts for classroom
discussion, they were not written in the language and
style most suitable for middle school students.
Do these problems represent the kind of
questions that will be on MAP assessments?
MAP intends to provide assessments that will helpteachers monitor students’ progress in comprehensionand performance at the depth implied by these illustra-tive problems. Questions that accomplish this goal in
the context of a broad-scale test will undoubtedly be
more limited in scope and complexity than those used
here to illustrate the expectations. However, the depth
of understanding required for adequate performance
will be comparable.
Why do so many solutions provide elabo-
rate technical details?
What appear to be technical details are in almost allcases logical distinctions required for correct mathemat-ical inference. The difference between and 3.1416,
while small, is of crucial difference in mathematical
thinking. So is the difference between rational and
irrational numbers, between equations and functions,
and between ratios and percentages. An important
role played by the sample solutions is to bring these
distinctions to the foreground for teachers and
curriculum developers.
By making understanding
of fundamental mathe-
matical ideas an expecta-
tion of high school entry,
Foundations for Success
will encourage high
school classes in all sub-
jects to start employing
the powerful tools and
concepts of mathematics.

Mathematics Achievement Partnership | 23
EXPECTATIONS AND SAMPLE PROBLEMS
Expectations andSample Problems
Foundations for Success identifies the mathematical
knowledge and skills that students need before enter-
ing high school. It primarily focuses on the mathe-
matical content of the middle grades (6 through 8),
with the assumption that students have completed a
strong program of elementary school mathematics in
grades 1 through 5 (Appendix A). Students who suc-
cessfully meet these expectations for the middle
grades will be well prepared for a strong mathematics
program in grade 9 and beyond (Appendix B), and
for high school subjects such as science and social
studies that increasingly depend on mathematical
skills and knowledge.
These expectations comprise four strands, each
of which encompasses three primary topics (see box
below).
Each strand contains a brief introduction to clarify
its purpose; a summary to convey its scope; and a set
of expectations concerning what students need to
know, understand and be able to do in each topic area.
In addition, each strand is accompanied by a num-
ber of sample problems designed to help illustrate the
scope, depth and meaning of the expectations. These
problems show more than just procedures and skills.
They demonstrate the depth of mathematical under-
standing and reasoning skills that students need in
order to become engaged citizens and productive
employees in the 21st century. They illustrate, at the
eighth-grade level, many aspects of mathematical pro-
ficiency that the NRC identifies in its recent report
Adding It Up: Helping Children Learn Mathematics (e.g., con-
ceptual understanding, procedural fluency, strategic
FOUNDATIONSSuccessfor
Strands Topics
I. Number A. Whole numbers
B. Rational numbers
C. Real numbers
II. Data A. Measurement and approximation
B. Data analysis
C. Probability
III. Geometry A. Common figures
B. Measurements
C. Transformations
IV. Algebra A. Symbols and operations
B. Functions
C. Equations

24 | Achieve, Inc.
FOUNDATIONS FOR SUCCESS: CONSULTATION DRAFT
competence and adaptive reasoning). The Mathema-
tics Achievement Partnership’s use of the term “under-
stand” refers to these interrelated aspects of mathe-
matical proficiency.
MAP does not intend that schools use the illus-
trative problems to assess student performance.
Furthermore, the accompanying solutions do not rep-
resent sample student-produced solutions. Rather, the
problems and solutions are intended to assist teach-
ers, curriculum developers and teacher educators as
they rethink their learning objectives for students in
the middle grades. The sample problems focus on
concepts that need clarification or are difficult to
teach. (Appendix C discusses some of the subtle
mathematical issues confronting teachers in the mid-
dle school grades, which the illustrative problems
seek to clarify. Future reports from Achieve will
include sample exercises for use in professional devel-
opment programs and sample problems for student
assessment.)
Although Foundations for Success presents the middle
grades expectations in the context of distinct strands
and topics, it is important to recognize that the funda-
mental concepts in each strand of mathematics are
inherently interconnected. Indeed, each strand uses
tools from other strands, and each can serve to help
introduce or review skills in other strands. Many of
the expectations could fit naturally under two or three
different strands, and many of the illustrative problems
can be solved using tools from various strands. For this
reason, many different curricula can be used to teach
to these expectations; MAP does not intend to suggest
that topics necessarily should be taught in the order in
which they appear
in this document.
Because these expectations focus on the mathe-
matical competence to be expected of students enter-
ing high school, they rarely make any reference to
the role of calculators (or other pedagogical aids) in
classroom instruction. With few exceptions, students
should be able to carry out most calculations implied
by these expectations without the aid of a calculator.
Although it is appropriate for students to use calcula-
tors to learn mathematics and to help solve problems,
they should be able to demonstrate understanding
and competence both with and without the aid of
calculators.

ExpectationsFOUNDATIONS
Successfor
I. Number
Conceptual depth and computational fluency in the
arithmetic of rational numbers is the backbone of
mathematics in daily life and the foundation of quan-
titative thinking in science and business. It also is of
critical importance for the further study of mathe-
matics. Data analysis, geometry and algebra all
depend on an understanding of the real number
system for working with measurements, coordinate
systems and functions.
Students should enter the middle grades being
fluent with the standard operations of arithmetic. By
the time they complete eighth grade, they need to
understand the concept of irrational numbers and the
real number system. They also need to be able to
compute with ratios, percentages, square roots and
exponents. In order to acquire a strong foundation for
studying the mathematics contained in these expecta-
tions, students will need to accomplish much of the
work in the number strand early in their middle
school years.
A. Whole numbers
Well before the end of grade 8, students need to
understand and be able to use relationships among
whole numbers to solve a variety of problems. As
soon as possible in the middle grades, students need
to understand factors, multiples and primes, and be
able to solve problems using those concepts.
Students should understand:
• that the number zero is an integer that is
neither negative nor positive;
• the concepts of factor (or divisor), common
factors and greatest common divisor;
• the concepts of multiple, common multiples
and least common multiple;
• the concepts of prime and composite num-
bers; and
• that each whole number can be factored
into the product of primes.
Students should be able to:
• use zero appropriately in arithmetic
calculations;
• use the uniqueness of prime factorization to
solve problems;
• find factors and multiples of three-digit pos-
itive integers;
• identify all two-digit prime numbers; and
• find the prime factors of any three-digit
positive number.
B. Rational numbers
In order to be able to use numbers routinely and flex-
ibly, all students need a thorough grounding in the
decimal number system, the arithmetic of rational
numbers and the concept of ratio.
Students should understand:
• that rational numbers are quotients of inte-
gers (positive or negative) with a nonzero
denominator;
• ratio as a comparison of two quantities by
division (as difference is their comparison
by subtraction); and
• percentages as standardized ratios with
denominators of 100.
Students should be able to:
• order rational numbers and place them on
the number line;
Mathematics Achievement Partnership | 25
EXPECTATIONS

26 | Achieve, Inc.
FOUNDATIONS FOR SUCCESS: CONSULTATION DRAFT
• perform accurately manual multistep cal-
culations involving addition, subtraction,
multiplication and division of rational
numbers;
• estimate results before performing
computations;
• demonstrate understanding of the proce-
dures used in computations;
• represent rational numbers as fractions or
decimals and translate between these repre-
sentations; and
• calculate percentages and use them to solve
common problems about sales tax, tips,
interest, discounts and compound interest.
C. Real numbers
In order to work comfortably with functions and
graphs, students need a working knowledge of the
entire real number system, its visual representation
as a number line, other ways of representing rational
numbers and some common examples of irrational
numbers.
Students should understand:
• concepts of square root, cube root and nth
root;
• why it is that, when converted to decimal
form, rational numbers either terminate or
eventually repeat;
• that any number whose decimal expansion
is either finite or repeating represents a
rational number; and
• that irrational numbers are those which by
definition cannot be expressed as quotients
of integers.
Students should be able to:
• estimate square roots and cube roots;
• use integer exponents to express numbers in
scientific notation; and
• name some common examples of irrational
numbers (e.g., 8 , M2) and locate them on
the number line.
II. Data
From questions of medical risk to political polls and
stock market indices, numerical data often convey
critical information. Gathering, measuring, counting,
representing, summarizing, transforming, projecting
and interpreting data are essential mathematical skills.
Students’ exposure to the complexity of measurement
is their first step toward becoming skeptical and criti-
cal users of data.
Since data derived from measurements are
approximate and uncertain, the topics of measure-
ment, approximation, data and probability fit naturally
under a single strand. They also provide important
support for other strands. Probability is both derived
from data and used for predicting future events; it is
a natural application of ratios and provides a founda-
tion for the study of statistics in high school and
beyond. Similarly, much of the foundation needed
to solve geometry problems rests on concepts of
measurement.
A. Measurement and approximation
Students at all grade levels need to practice working
with physical measurements and estimating quantities.
In the middle grades, students need to enlarge their
experience from simple physical measurements, such
as length and weight, to more subtle measurements,
such as speed, density, inflation and stock market
indices. These indirect and derived quantities are used
widely to measure physical, social, medical, political
and economic phenomena. Experience with measure-
ment forms a concrete basis for understanding concepts
such as proportionality in algebra and similarity in
geometry.
Students should understand:
• the relation between measurements and
units (e.g., that all measurements require
units and that a quantity accompanied by a
unit represents a measurement);

Mathematics Achievement Partnership | 27
EXPECTATIONS
• that most measurements are approximations;
• common metric and English units of mea-
surement for length, area, volume, time and
weight;
• indirect and derived quantities such as den-
sity, velocity and weighted averages;
• how the precision of measurement influ-
ences the accuracy of derived quantities cal-
culated from measured quantities; and
• the role of significant digits in signaling the
accuracy of measurements.
Students should be able to:
• use common measuring tools accurately and
select appropriate units when measuring;
• give answers to a reasonable degree of preci-
sion in the context of a given problem;
• convert between basic units of measurement
within a single measurement system (e.g.,
square inches to square feet) and between
common measurement systems (for example,
inches to centimeters);
• solve problems that involve ratio units, such
as population density (persons per square
mile), air pressure (pounds per square inch),
and speed (miles per hour);
• calculate weighted averages such as course
grades, consumer price indices and sports
ratings;
• convert ratio quantities between different
systems of units, as, for example, feet per
second to miles per hour; and
• judge reasonableness of answers by mental
estimation.
B. Data analysis
Data analysis especially is appropriate for the middle
grades because it forms a natural bridge from the con-
crete arithmetic of elementary school to the more
abstract mathematics of high school. It also provides
rich opportunities to develop or refresh mathematical
skills such as computation, graphing, percentages and
estimation.
Students should understand:
• the uses and limitations of common graphs
and charts;
• relative and cumulative frequencies and
associated ratios or decimals;
• appropriate and inappropriate uses of mean
and median;
• the difference between correlation and cau-
sation; and
• the relation of correlation to the estimation
of the line of best fit in a scatter plot.
Students should be able to:
• collect, organize and analyze both single-
variable and two-variable data;
• represent and interpret data using a variety
of graphs and charts, including box plots
and stem-and-leaf plots;
• calculate relative and cumulative frequencies;
• find and interpret the median, upper quar-
tile, lower quartile and inner-quartile range
of a set of data;
• interpret main features of the graph of the
normal distribution; and
• create and interpret scatter plots, visually
estimating correlation and lines of best fit.
C. Probability
Beginning in early childhood, students’ engagement
with games and sports creates intuitive ideas about
probability, some correct and some not. In the middle
grades, students need to begin more systematic study
of probability, both as preparation for living intelli-
gently in a world of risks and as a foundation for high
school and college courses in science and statistics.
The relation between probability and ratio provides
an ideal setting to begin more structured analysis that
also has broad links with data analysis.

28 | Achieve, Inc.
FOUNDATIONS FOR SUCCESS: CONSULTATION DRAFT
Students should understand:
• the relation of probability to relative fre-
quency;
• different ways of expressing probabilities
(e.g., as decimals, percentages, odds);
• why the probability of an event is a number
between zero and one; and
• common misconceptions about probabilities
associated with dependent and independent
events; (e.g., lotteries, “hot streaks” in
sports).
Students should be able to:
• solve simple problems involving probability
and relative frequency;
• compare the probability of two or more
events and recognize when certain events
are equally likely; and
• compute probabilities of events from simple
experiments with equally probable outcomes
(e.g., tossing dice, flipping coins, spinning
spinners).
III. Geometry
Since ancient times, geometry has been an integral
part of mathematics and a common vehicle for teach-
ing deductive reasoning, which is a defining charac-
teristic of mathematics. Geometry provides the foun-
dation for many common uses of mathematics, from
architecture and manufacturing to computer graphics
and telecommunications.
In the middle grades, students need to move
beyond just describing shapes to gain an understand-
ing of quantitative geometric relationships in two-
and three-dimensional space. They also need to rec-
ognize the many connections between geometry and
various concepts of number, measurement and alge-
bra. Indeed, measurement is integral to geometry (the
root meaning of which is “measuring the earth”).
Moreover, similar right triangles underlie the defini-
tion of slope and play a role in many problems
involving proportionality.
A. Geometric figures
Both before and during the middle grades, students
need to become familiar with common types of two-
and three-dimensional figures. They need to learn basic
facts about lines, angles, circles and spheres; and under-
stand basic properties of common triangles, quadri-
laterals, cubes, prisms, cylinders, pyramids and cones.
Students also need to be able to use their knowledge of
two- and three-dimensional figures to solve problems.
For two-dimensional figures, students should
understand:
• that angles around a point add to 360º and
angles on one side of a line add to 180º;
• that the sum of the interior angles of a
triangle is 180º;
• the triangle inequality;
• the relationships of vertical (opposite), adja-
cent and supplementary angles;
• that if a line intersects two parallel lines,
then the corresponding angles and the alter-
nate interior angles are equal;

Mathematics Achievement Partnership | 29
EXPECTATIONS
side), picture views (projective or isometric)
and nets (plane figures that can be folded to
form the surface of the solid); and
• use two-dimensional representations to
solve problems (for example, use nets to cal-
culate surface area).
B. Measurement
Calculating lengths, areas and volumes is a fundamental
mathematical skill students learn in the middle grades
and apply in numerous venues thereafter. Carrying out
geometric calculations provides a useful application
(and review) of arithmetic. Moreover, the formulas for
geometrical measurements provide important examples
of functions and equations studied in algebra.
Students should understand:
• the concepts of length, area, volume and
surface area;
• the relationships among one-, two- and
three-dimensional units of measurement;
• how to represent and calculate areas for tri-
angles, quadrilaterals, circles and other
shapes built from these basic forms; and
• the formulas for volumes for common solids
such as cylinders, cones and hemispheres:
• a cylinder of height h whose base has
area A, V p Ah;
• a cone of height h whose base has area
A, V p @ #Ah; and
• a hemisphere of height h whose base
has area A, V p@ #Ah.
Students should be able to:
• find lengths of line segments in geometric
figures in terms of other given lengths;
• find the length of a circular arc in terms of
its radius and central angle;
• use the Pythagorean theorem and its con-
verse to solve perimeter, area and volume
problems and to find distances between
points in the Cartesian coordinate system;
• that, conversely, if a line intersects two
other lines and the corresponding or alter-
nate interior angles are equal, then the two
lines are parallel;
• that polygons can be divided into triangles,
which can be used to find areas, angles and
sums of interior angles;
• that the sum of the exterior angles of a
polygon is 360º;
• that a triangle inscribed on the diameter of
a circle is a right triangle; and
• that a tangent to a circle forms a right angle
with the diameter at the point of tangency.
Students should be able to:
• work flexibly with common types of two-
and three-dimensional figures;
• prove the Pythagorean theorem using an
area dissection argument; and
• use their understanding of lines, angles, cir-
cles, triangles and simple quadrilaterals to
solve reasoning problems that involve these
figures.
For three-dimensional figures, students should
understand:
• properties of spheres (diameters, cross sec-
tions and great circles);
• properties and common examples of cylin-
ders (cubes, circular cylinders and prisms);
• properties and common examples of cones
(circular cones and pyramids); and
• the names and characteristics of other spe-
cial solids (e.g., regular polyhedra).
Students should be able to:
• solve problems that require knowledge of
common solids;
• describe the shapes of two-dimensional sec-
tions that result when a cube, cylinder, cone
or sphere is cut with a plane at various angles;
• sketch a variety of two-dimensional repre-
sentations of three-dimensional solids; for
example, orthogonal views (top, front and
13
23

30 | Achieve, Inc.
FOUNDATIONS FOR SUCCESS: CONSULTATION DRAFT
• solve problems involving areas of triangles,
quadrilaterals and circles;
• find the surface area of prisms, cylinders and
other rectangular solids; and
• solve problems involving the volumes of
cylinders, cones and spheres.
C.Transformations
The study of shape and size comes together in deal-
ing with ideas of congruency, similarity and transfor-
mations of geometric objects. To be able to make use
of geometry as a tool for solving problems, students
need to be familiar with the consequences of trans-
forming geometric figures by translation, rotation,
reflection, expansion and contraction.
Students should understand:
• that two-dimensional figures having the
same shape and size are congruent;
• that two-dimensional figures having the
same shape are similar;
• the effects of reflecting, rotating, translating,
expanding and contracting simple two-
dimensional figures; and
• that in similar figures, the ratios of corre-
sponding lengths are equal and the corre-
sponding angles have equal measures.
Students should be able to:
• use similar triangles to measure distances
indirectly;
• investigate symmetries of two- and three-
dimensional figures;
• determine from side and angle conditions
when triangles are similar or congruent;
• find the lengths of sides in a figure, given
the scale factor and dimensions of a similar
figure; and
• create, interpret and use scale drawings to
help solve problems.
IV. Algebra
The middle grades provide a crucial and challenging
transition from the concrete mathematics of elemen-
tary school to the more abstract and conceptual
mathematics of high school. Nowhere is this chal-
lenge more striking or more important than in the
transition from arithmetic to algebra — from calcu-
lating with numbers to using letters, which at first
represent numbers and are later treated as entities in
their own right.
In the middle grades, students learn to represent
mathematical relationships symbolically and to trans-
late real-world relationships into algebraic expres-
sions, equations or inequalities. They learn that the
familiar rules of arithmetic remain valid when letters
are used to represent numbers and that these rules
can be used to simplify algebraic expressions and
solve algebraic equations. The basic tools of algebra
provide the necessary underpinnings for high school
science, social studies and mathematics.
In addition to using symbols that represent
quantities, algebra introduces the concepts of func-
tions and equations to represent relationships.
Students need to learn to think about formulas such
as A p r2 as representing a functional relationship
between two quantities. For understanding functional
relationships, facility with graphing is as important as
working with algebraic expressions. By the end of
the eighth grade, students should be able to translate
among symbolic, graphic, numerical and verbal repre-
sentations of functions. They should also be able to
analyze algebraically the properties of lines, circles
and triangles. In the middle grades, students should
study linear equations in depth to the point of mas-
tery. Students also need an introduction to common
nonlinear functions, especially quadratics, as a foun-
dation for further study in high school.
A. Symbols and operations
In the middle grades, students need to learn to use
letters as symbols for variables, just as they have been

Mathematics Achievement Partnership | 31
EXPECTATIONS
using numbers in arithmetic. In particular they need to
learn to use variables flexibly, to manipulate algebraic
expressions accurately and to generate their own alge-
braic expressions to represent real-world problems.
Students should understand:
• the various contexts in which letters are
used to represent numbers — to represent
an unknown value, a placeholder for some-
thing not yet known or a constant;
• the conventions for writing algebraic
expressions (e.g., omitting the symbol for
multiplication and writing numbers before
letters in multiplication); and
• the meanings of constant, variable and para-
meter, and relations among them.
Students should be able to:
• use variables to represent the value of quan-
tities in a variety of contexts;
• analyze verbal problems and generate
appropriate algebraic expressions;
• use properties of the real number system
(e.g., distributive and associative laws) to
simplify expressions; and
• recognize, represent geometrically and
apply the common formulas:
@a c b#2 p a2 c 2ab c b2;
@a i b#2 p a2 i 2ab c b2; and
@a c b#@a i b# p a2 i b2.
B. Functions
Functions are fundamental to mathematics and need
to be studied in conjunction with equations. It is
important, however, to distinguish functions from
equations. In the middle grades, students primarily
need to gain experience with linear functions in order
to work with them routinely and flexibly. In these
grades, students also need to become familiar with sim-
ple examples of some common nonlinear functions.
For linear functions, students should understand:
• that linear functions are characterized by
constant rates of change;
• that in a graph of y = kx + b, the slope k is
the rate of change and the parameter b is
the value of y when x = 0; and
• that a proportional relationship y = kx is
a special type of linear function in which
the parameter b = 0 and k is the constant
of proportionality.
Students should be able to:
• recognize whether information given in a
table, graph or formula suggests a propor-
tional, linear or nonlinear relationship;
• represent linear functions using verbal
descriptions, tables, graphs and formulas,
and translate between these representations;
• recognize common linear phenomena, for-
mulate and graph corresponding linear func-
tions, and interpret the graph’s slope and
intercepts as properties of the original situa-
tion; and
• work fluently with common linear functions
that represent the relationships between:
• the diameter and circumference of a
circle;
• the height and volume of a container
with uniform cross-section;
• the sum of a polygon’s interior angles
and the number of sides;
• distance and time under constant speed;
• measurement units in different systems,
such as pounds and kilograms; and
• total cost of a purchase, cost per unit,
and the number of units purchased.
For nonlinear functions, students should understand:
• quadratic functions and their graphs by
expressing them in various forms; and
• the concept of a nonlinear function through
examples of:
• simple rational functions, such as
f@x# p ; 1 xi1

32 | Achieve, Inc.
FOUNDATIONS FOR SUCCESS: CONSULTATION DRAFT
• quadratic functions, such as
f@x# p 2x2 c 4x c 1;
• simple cubic functions, such as
V@r# p r3;
• simple square root functions, such as
f@x# p 5Mx; and
• exponential functions with an integer
base, such as f@n# p 2n.
Students should be able to:
• recognize simple nonlinear functions that
arise in problem contexts (e.g, quadratic,
cubic, rational, exponential) and represent
them using tables, graphs and formulas;
• transform and graph quadratic functions by
factoring and completing the square; and
• work fluently with common nonlinear func-
tions that represent relationships between:
• the area and radius of a circle;
• the volume and radius of a sphere;
• the number of diagonals and the number
of sides of a polygon;
• the areas of simple plane figures and
their linear dimensions;
• the surface areas and volumes of simple
three-dimensional solids and their linear
dimensions; and
• the value of a bank deposit, the interest
rate, compounding period and time
elapsed.
C. Equations
The concept of an equation and its solutions is a
central idea in algebra and opens the door to further
study of mathematics, science, business and many
other subjects. Equations are related to but different
from functions, and it is important that students
in the middle grades gain enough experience with
both to recognize their similarities and differences.
Students also need to learn how to translate problem
contexts (presented in words, symbols or “real life”
situations) into equations, to solve the resulting
equations and then interpret the solution thoughtfully
in terms of the original problem context.
Students should understand:
• that to solve the equation f@x# p g@x#means to find all values of x for which the
equation is true;
• that the solution to a linear equation corre-
sponds to the point at which the graph of the
associated linear function crosses the x axis;
• why the solution of two simultaneous equa-
tions is given by the coordinates of the
intersection of the graphs of the two corre-
sponding functions; and
• why identical manipulations carried out on
both sides of an equation create new equa-
tions that have the same solutions as the
original (as well as possibly some additional
solutions).
Students should be able to:
• use properties of the real number system
(e.g., distributive and associative laws) to
simplify expressions and solve equations;
• keep equations “balanced” by carrying out
the same operations on each side;
• generate and solve linear equations of the
form ax c b p c and ax c b p cx c d;
• generate linear equations that represent sim-
ple problem contexts, manipulate and solve
these equations, and interpret these equa-
tions in terms of the original context;
• set up and solve simultaneous linear equa-
tions in two variables;
• recognize and express correctly the connec-
tions between equations and functions;
• use graphs to estimate solutions and check
algebraic approaches when solving linear
equations;
• relate the solutions of a quadratic equation
to the graph of the corresponding quadratic
function; and
• solve a quadratic equation by factoring,
finding where the graph of the function
meets the x axis and completing the square.
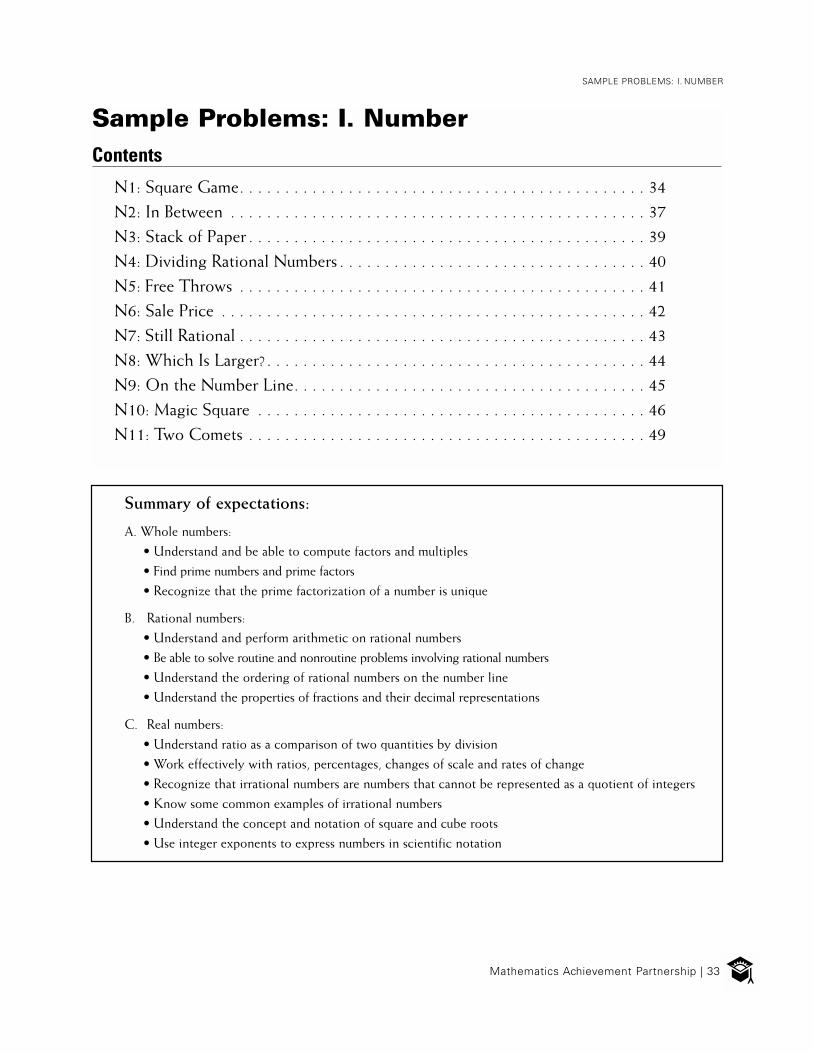
Mathematics Achievement Partnership | 33
SAMPLE PROBLEMS: I. NUMBER
Sample Problems: I. NumberContents
N1: Square Game. . . . . . . . . . . . . . . . . . . . . . . . . . . . . . . . . . . . . . . . . . . . . 34
N2: In Between . . . . . . . . . . . . . . . . . . . . . . . . . . . . . . . . . . . . . . . . . . . . . . 37
N3: Stack of Paper . . . . . . . . . . . . . . . . . . . . . . . . . . . . . . . . . . . . . . . . . . . . 39
N4: Dividing Rational Numbers . . . . . . . . . . . . . . . . . . . . . . . . . . . . . . . . . . 40
N5: Free Throws . . . . . . . . . . . . . . . . . . . . . . . . . . . . . . . . . . . . . . . . . . . . . 41
N6: Sale Price . . . . . . . . . . . . . . . . . . . . . . . . . . . . . . . . . . . . . . . . . . . . . . . 42
N7: Still Rational . . . . . . . . . . . . . . . . . . . . . . . . . . . . . . . . . . . . . . . . . . . . . 43
N8: Which Is Larger? . . . . . . . . . . . . . . . . . . . . . . . . . . . . . . . . . . . . . . . . . . 44
N9: On the Number Line. . . . . . . . . . . . . . . . . . . . . . . . . . . . . . . . . . . . . . . 45
N10: Magic Square . . . . . . . . . . . . . . . . . . . . . . . . . . . . . . . . . . . . . . . . . . . 46
N11: Two Comets . . . . . . . . . . . . . . . . . . . . . . . . . . . . . . . . . . . . . . . . . . . . 49
Summary of expectations:
A. Whole numbers:
• Understand and be able to compute factors and multiples
• Find prime numbers and prime factors
• Recognize that the prime factorization of a number is unique
B. Rational numbers:
• Understand and perform arithmetic on rational numbers
• Be able to solve routine and nonroutine problems involving rational numbers
• Understand the ordering of rational numbers on the number line
• Understand the properties of fractions and their decimal representations
C. Real numbers:
• Understand ratio as a comparison of two quantities by division
• Work effectively with ratios, percentages, changes of scale and rates of change
• Recognize that irrational numbers are numbers that cannot be represented as a quotient of integers
• Know some common examples of irrational numbers
• Understand the concept and notation of square and cube roots
• Use integer exponents to express numbers in scientific notation

34 | Achieve, Inc.
FOUNDATIONS FOR SUCCESS: CONSULTATION DRAFT
In a party, the following game is played: Each player is given a rectangular piece of graph paper that
is 56 centimeters long and 84 centimeters wide. The horizontal and vertical lines are spaced one
centimeter apart.
The paper is to be cut along the grid (graph) lines into square pieces that are all the same size without
having any paper left over. The winner is the one who cuts the largest square pieces of paper. What
would be the length in centimeters of the side of each winning square?
A SOLUTION
The problem is not simply to cut the paper into congruent square pieces with no paper left over, but to
cut the paper into the largest possible congruent square pieces with no paper left over. This can be
accomplished by finding the largest number that divides evenly into the length 84 centimeters and the
width 56 centimeters.
Since 56 and 84 are both even, we could, for example, cut the paper into squares with length of sides at
2 centimeters. We would get 28 rows each with 42 squares.
But both 56 and 84 are also divisible by 4. Cutting the paper into squares that are 4 centimeters on a
side would give 14 rows each with 21 squares.
We need to find the largest number that divides both 56 and 84 evenly.
The numbers that divide 56 evenly are the factors for 56. The factors can be found by trying the
numbers 1, 2, 3, 4, 5 and so on, until the pairs of factors start to repeat.
For example: Try 1. 1 x 56 p 56, so 1 and 56 are factors.
Try 2. 2 x 28 p 56, so 2 and 28 are factors.
Try 3. 3 does not divide 56 evenly, so 3 is not a factor.
N1: Square Game

Mathematics Achievement Partnership | 35
SAMPLE PROBLEMS: I. NUMBER
Continuing in this way, we find that 4 and 14 are factors, and 7 and 8 are factors. After we try 7,
the factors begin to repeat. Therefore, the factors of 56 are 1, 2, 4, 7, 8, 28 and 56. The factors of 84
can be found similarly: 1 x 84 p 84; 2 x 42 p 84; 3 x 28 p 84; 4 x 21 p 84; 5 does not go into 84
evenly; 6 x 14 p 84; and 7 x 12 p 84. Therefore, the factors of 84 are 1, 2, 3, 4, 6, 7, 12, 21, 28, 42
and 84.
The numbers that divide both 56 and 84 are common factors of 56 and 84. The greatest number that
divides both is the greatest common factor of 56 and 84. From the lists above, we see that the common
factors of 56 and 84 are 1, 2, 4 and 28. Thus, the greatest common factor is 28.
Since 28 is the greatest number that divides both 56 and 84, the largest squares that can be cut from
the rectangle with no paper left over are squares with sides of 28 centimeters.
The 56-centimeter side of the paper would have squares along its edge.
The 84-centimeter side would have squares along its edge.
So a total of 2 x 3, or 6, squares can be cut from the paper.
The greatest common factor of 56 and 84 can also be found using prime factorization: 56 p 23 x 7,
and 84 p 22 x 3 x 7. The greatest common factor contains the common prime factors of the two
numbers: 22 x 7 p 28.
84 p 328
56 p 228

36 | Achieve, Inc.
FOUNDATIONS FOR SUCCESS: CONSULTATION DRAFT
ANOTHER SOLUTION
Let’s look at the 56-centimeter side and the 84-centimeter side of the paper separately. Inspecting these
tables shows that the largest square that works in both cases is 28 cm on a side.
The 56-centimeter side of the paper would have squares along its edge.
The 84-centimeter side of the paper would have squares along its edge.
So there would be a total of 2 x 3 p 6 squares.
Comment: 28 is called a common factor of 56 and 84, since it is a factor of both 56 and 84. It is also the
greatest number that is a common factor of 56 and 84.
56 p 228
84 p 328
2 3 4 5 6The 56-cm side could be divided into this many equal pieces:
7 8 ... ...
28 18 14 11.2 9 8 7 ... ...Doing this would require squares of this size in cm.
23
13
2 3 4 5 6The 84-cm side could be divided into this many equal pieces:
7 8 ... ...
42 28 21 16.8 14 12 10.5 ... ...Doing this would require squares of this size in cm.
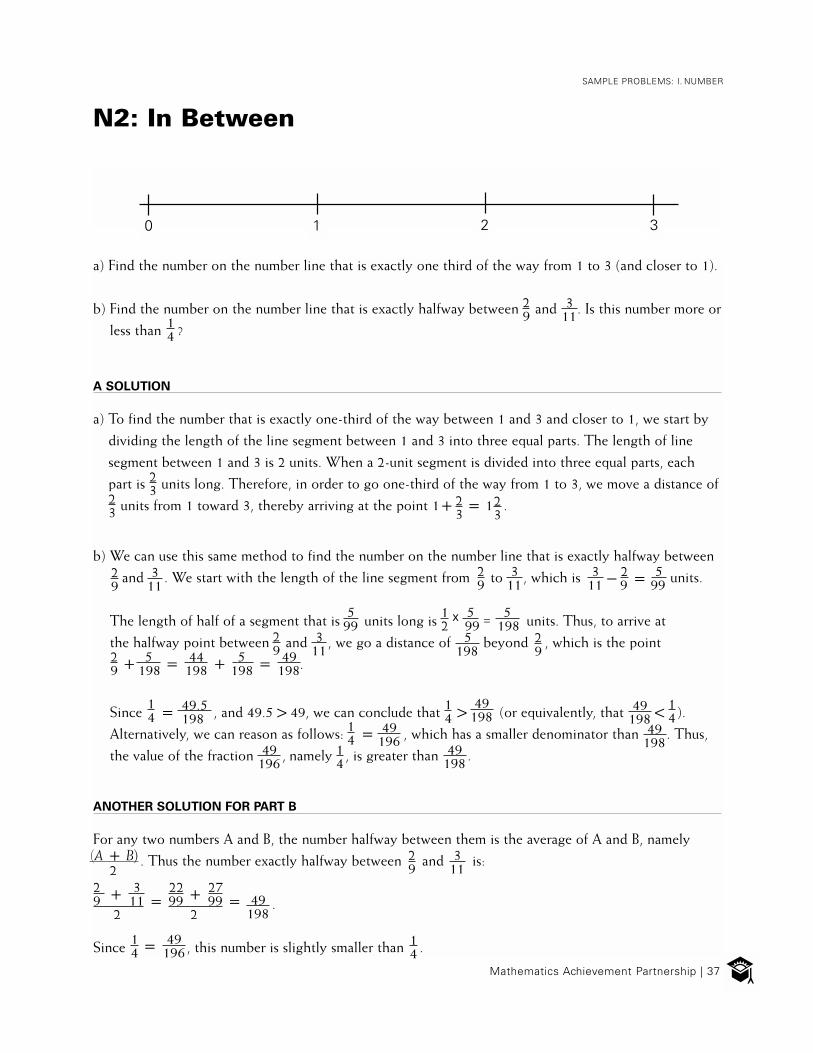
Mathematics Achievement Partnership | 37
SAMPLE PROBLEMS: I. NUMBER
N2: In Between
a) Find the number on the number line that is exactly one third of the way from 1 to 3 (and closer to 1).
b) Find the number on the number line that is exactly halfway between and . Is this number more or
less than ?
A SOLUTION
a) To find the number that is exactly one-third of the way between 1 and 3 and closer to 1, we start by
dividing the length of the line segment between 1 and 3 into three equal parts. The length of line
segment between 1 and 3 is 2 units. When a 2-unit segment is divided into three equal parts, each
part is units long. Therefore, in order to go one-third of the way from 1 to 3, we move a distance of
units from 1 toward 3, thereby arriving at the point 1c p 1 .
b) We can use this same method to find the number on the number line that is exactly halfway between
and . We start with the length of the line segment from to , which is units.
The length of half of a segment that is units long is units. Thus, to arrive at
the halfway point between and , we go a distance of beyond , which is the point
.
Since p , and 49.5 1 49, we can conclude that 1 (or equivalently, that ! ).
Alternatively, we can reason as follows: p , which has a smaller denominator than . Thus,
the value of the fraction , namely , is greater than . .
ANOTHER SOLUTION FOR PART B
For any two numbers A and B, the number halfway between them is the average of A and B, namely
. Thus the number exactly halfway between and is:
.
Since , this number is slightly smaller than .
23
23
23
23
29
3 11
14
3 11
29
3 11
29
3 i 2 p 5 11 9 99
5 99
1 x 5 = 5 2 99 198
29
3 11
5 198
29
49 198
0 1 2 3
2 c 5 p 44 c 5 p 49 9 198 198 198 198
3 11
29
2 c 3 p
22 c 27p9 11 99 99
2 2 49 198
1 p 49 4 196
14
$A c B#2
14
14
49.5 198
49 198
49 198
14
14
49 196
49 198 49
19614
38 | Achieve, Inc.
FOUNDATIONS FOR SUCCESS: CONSULTATION DRAFT
In general, the distance between A and equals the distance between and B. If A ^ B:
A similar calcuation works if A6B.
A c B i A p $A c B# i 2A p B i A , and2 2 2
B i A c B p 2B i $A c B# p B i A2 2 2 .
$A c B#2
$A c B#2
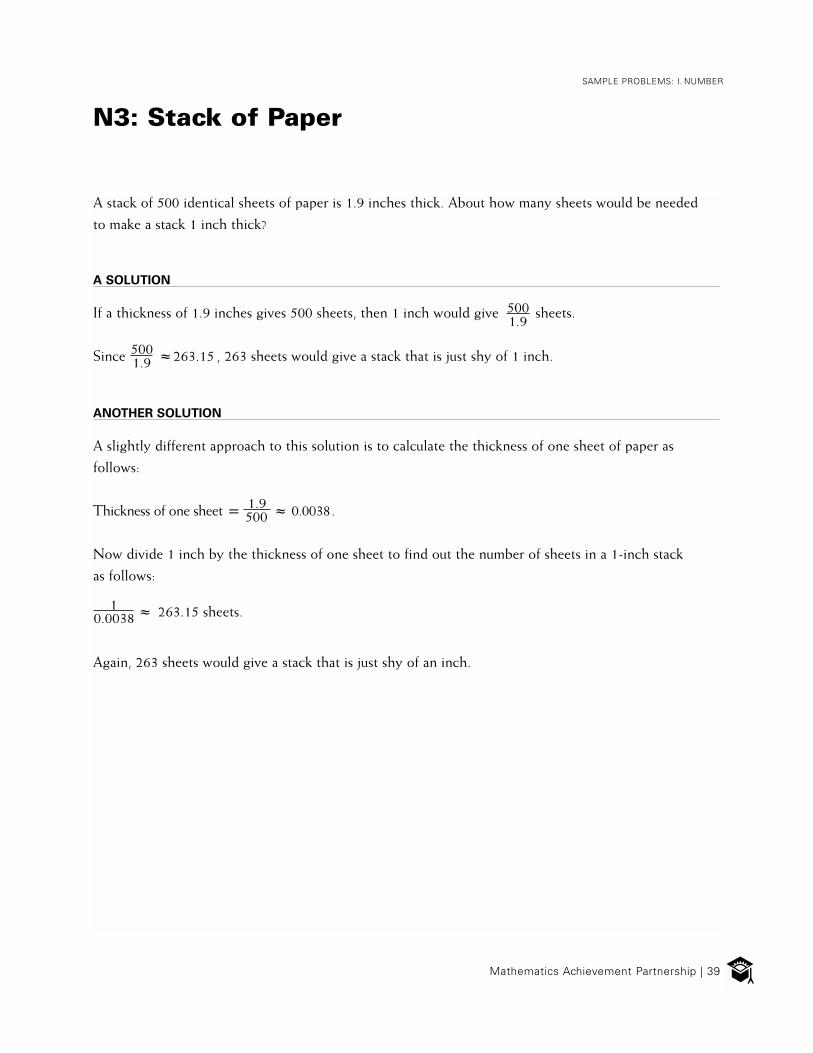
Mathematics Achievement Partnership | 39
SAMPLE PROBLEMS: I. NUMBER
N3: Stack of Paper
A stack of 500 identical sheets of paper is 1.9 inches thick. About how many sheets would be needed
to make a stack 1 inch thick?
A SOLUTION
If a thickness of 1.9 inches gives 500 sheets, then 1 inch would give sheets.
Since ; , 263 sheets would give a stack that is just shy of 1 inch.
ANOTHER SOLUTION
A slightly different approach to this solution is to calculate the thickness of one sheet of paper as
follows:
Thickness of one sheet p ; 0.0038.
Now divide 1 inch by the thickness of one sheet to find out the number of sheets in a 1-inch stack
as follows:
Again, 263 sheets would give a stack that is just shy of an inch.
5001.9
500 263.151.9
1 ; 263.15 sheets.0.0038
1.9 500
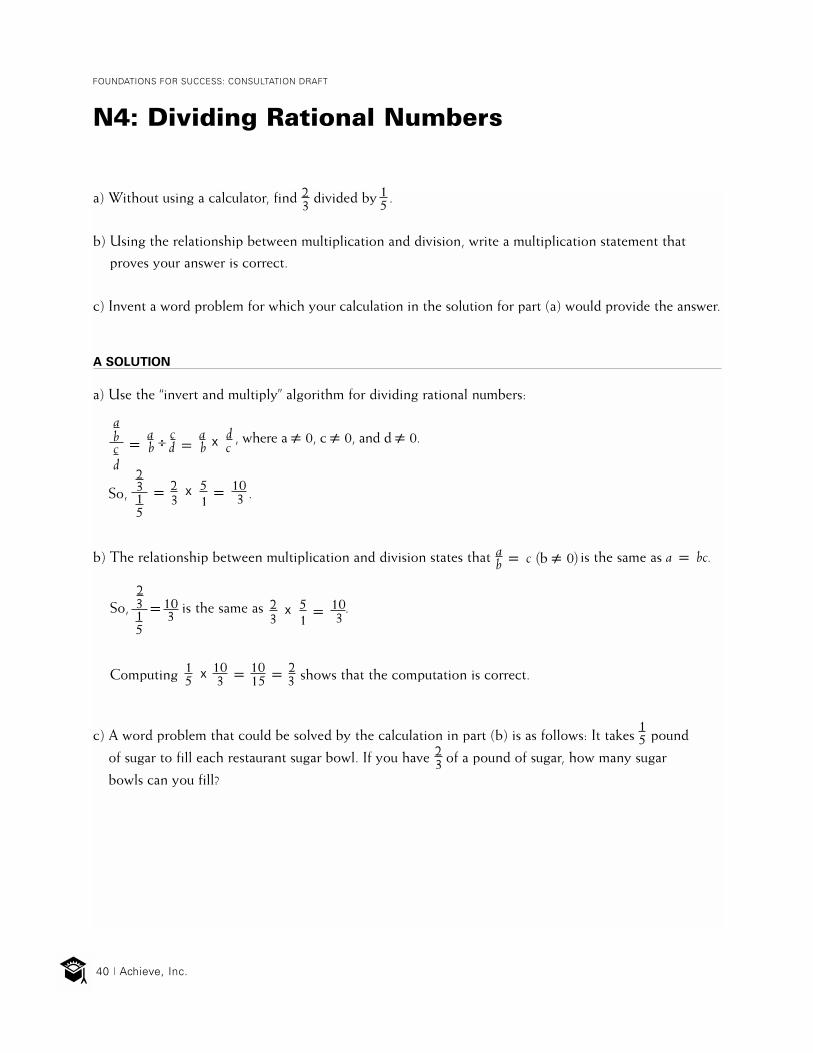
40 | Achieve, Inc.
FOUNDATIONS FOR SUCCESS: CONSULTATION DRAFT
N4: Dividing Rational Numbers
a) Without using a calculator, find divided by .
b) Using the relationship between multiplication and division, write a multiplication statement that
proves your answer is correct.
c) Invent a word problem for which your calculation in the solution for part (a) would provide the answer.
A SOLUTION
a) Use the “invert and multiply” algorithm for dividing rational numbers:
, where a 0 0, c 0 0, and d 0 0.
So, .
b) The relationship between multiplication and division states that is the same as a p bc.
So, is the same as .
Computing shows that the computation is correct.
c) A word problem that could be solved by the calculation in part (b) is as follows: It takes pound
of sugar to fill each restaurant sugar bowl. If you have of a pound of sugar, how many sugar
bowls can you fill?
23
15
2p 2 x 5 p 10 3
3 1 315
a p c @b 0 0#b
2p 3
315
1 x 10 p 10 p 25 3 15 3
23
15
a
pa
÷cp
a x d b b d b c c
d
÷
2 x 5 p 103 1 3
10

Mathematics Achievement Partnership | 41
SAMPLE PROBLEMS: I. NUMBER
N5: Free Throws
Juan made 13 out of 18 free throws. If Bonita shoots 25 free throws, what’s the minimum number she
has to make in order to have a better free-throw percentage than Juan?
A SOLUTION
If Bonita makes S shots out of 25 free throws, her shooting percentage would be . We want
, the latter being Juan’s success ratio. If we multiply both sides of an inequality by a positive
number, the direction of the inequality is preserved. So let’s multiply by 25 to clear the denominator:
.
Therefore, Bonita needs at least 19 successful free throws (18 is not quite enough) to have a better
free-throw percentage than Juan.
ANOTHER SOLUTION
, so Juan made about 72% of his free throws.
Let S = the number of successful free throws Bonita needs to make to have the same percentage asJuan. Then,
.
Thus, Bonita needs 18.05 successful free throws to have the same percentage as Juan, so she needs more
than this to have a better percentage. Therefore, she needs to make 19 successful free throws.
S 25
S 1
1325 18
S 1
1325 18
S x 25 1 13 x 25 25 18
S 1 13 x 2518
13 ; 0.72218
S p 0.72225
S x 25 p 0.722 2525
S p 18.05
S 1 18 1 18
x

42 | Achieve, Inc.
FOUNDATIONS FOR SUCCESS: CONSULTATION DRAFT
N6: Sale Price
A store is having a sale. Items costing $30 or more are discounted by 15%, and items costing less than
$30 are discounted by 10%. Suppose Juanita buys four items costing over $30, which together cost $140,
and five items for under $30 each, which together cost $120. Assuming a sales tax of 5%, how much will
Juanita have to pay?
A SOLUTION
Juanita bought $140 worth of items that are discounted by 15%. So the price after the discount is taken
is $119. (15% of $140 is $21, and $140 i $21 p $119.)
She also bought $120 worth of items that are discounted by 10%. So the price after the discount is taken
is $108. (10% of $120 is $12 and $120 i $12 p $108.)
The total price for the items will be $227 ($119 c $108).
But there is a 5% sales tax on $227, which comes to $227 x 0.05 p $11.35. Therefore, the amount she
pays, including tax, is $227c $11.35 p $238.35.
The amounts can also be found directly. Since 100% i 15% p 85%, the cost of an item discounted by
15% is 85% of the original price: $140 x 0.85 p $119. Similarly, the cost of an item discounted by 10%
is 90% of the original price: $120 x 0.9 p $108.
Since the sales tax is 5%, the amount paid including sales tax is 100%c5%, or 105%, of the purchase
price. $227 x 1.05 p $238.35.

Mathematics Achievement Partnership | 43
SAMPLE PROBLEMS: I. NUMBER
N7: Still Rational
Show that the product of any two nonzero rational numbers is also rational.
A SOLUTION
Pick any two nonzero rational numbers and , where a, b, c and d are integers, and b 0 0 and d 0 0.
The product of these two rational numbers is .
The product of any two integers is an integer. So this means that the products ac and bd are both
integers.
So is the quotient of two integers. Therefore must be rational.
ab
cd
a x c p acb d bd
acbd
acbd

44 | Achieve, Inc.
FOUNDATIONS FOR SUCCESS: CONSULTATION DRAFT
N8: Which Is Larger?
Without using a calculator, decide which is larger: the cube root of 63 or the square root of 18.
A SOLUTION
Since 64 p 4 x 4 x 4, 3M64 p 4. However, 63 ! 64. Therefore, 3M63 ! 4.
Now, 16 p 4 x 4, so M16 p 4. Since 18 1 16, M18 1 4.
Thus, 3M63 ! 4, while 4 ! M18. Hence, 3M64 ! M18.
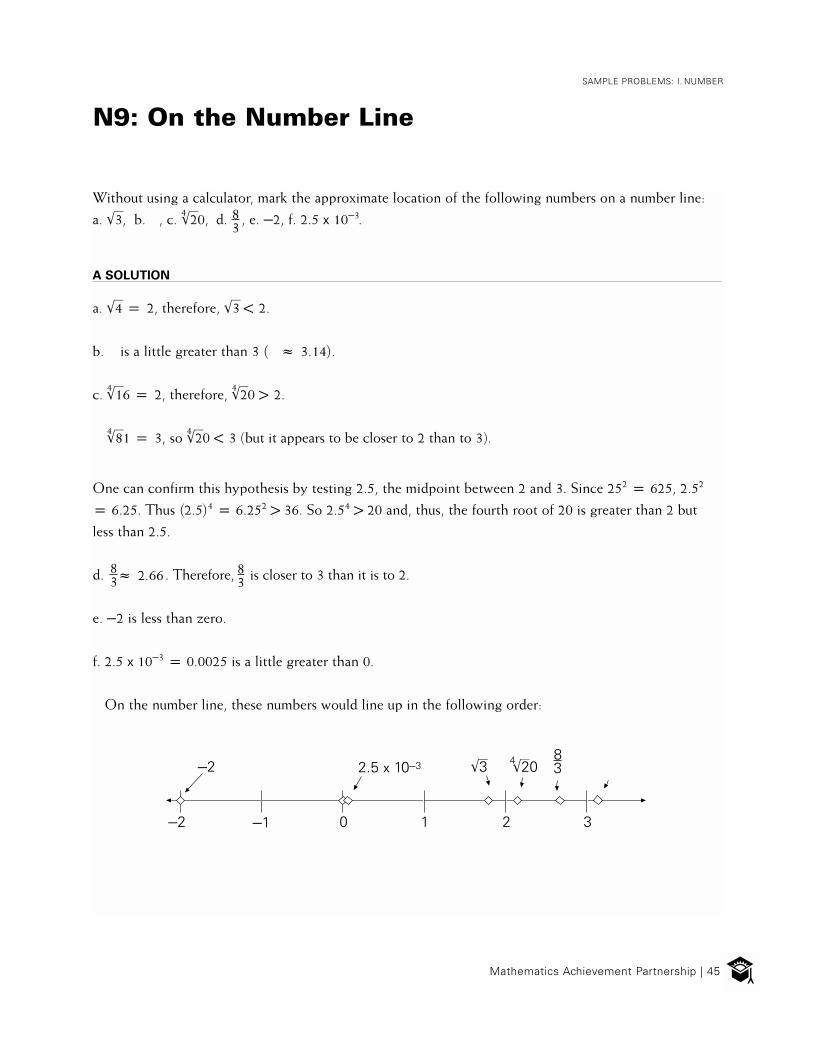
Mathematics Achievement Partnership | 45
SAMPLE PROBLEMS: I. NUMBER
N9: On the Number Line
Without using a calculator, mark the approximate location of the following numbers on a number line:
a. M3, b. , c. 4M20, d. , e. i2, f. 2.5 x 10i3.
A SOLUTION
a. M4 p 2, therefore, M3 ! 2.
b. is a little greater than 3 @ ; 3.14#.
c. 4M16 p 2, therefore,
4M20 1 2.
4M81 p 3, so 4M20 ! 3 (but it appears to be closer to 2 than to 3).
One can confirm this hypothesis by testing 2.5, the midpoint between 2 and 3. Since 252 p 625, 2.52
p 6.25. Thus @2.5#4 p 6.252 1 36. So 2.54 1 20 and, thus, the fourth root of 20 is greater than 2 but
less than 2.5.
d. . Therefore, is closer to 3 than it is to 2.
e. i2 is less than zero.
f. 2.5 x 10i3 p 0.0025 is a little greater than 0.
On the number line, these numbers would line up in the following order:
i2 i1 0 1 2 3
i2 2.5 x 10i383M3 4M20
83
8; 2.66383

The square above is a magic square. Each row, column and diagonal adds up to the same number. This
number is called the magic total.
a) Complete this magic square:
b) The magic square below should have a magic total of 36. The number in the center square is represented by x. Express each of the other numbers in the square in terms of x.
c) Write an equation that can be used to find x, and solve it.
46 | Achieve, Inc.
FOUNDATIONS FOR SUCCESS: CONSULTATION DRAFT
N10: Magic Square
3
15
Magic Total = 24
1
15
13ix x
7
Magic Total = 36
23
8
1
Magic Total = 15
9
3 4
5
6 7 2
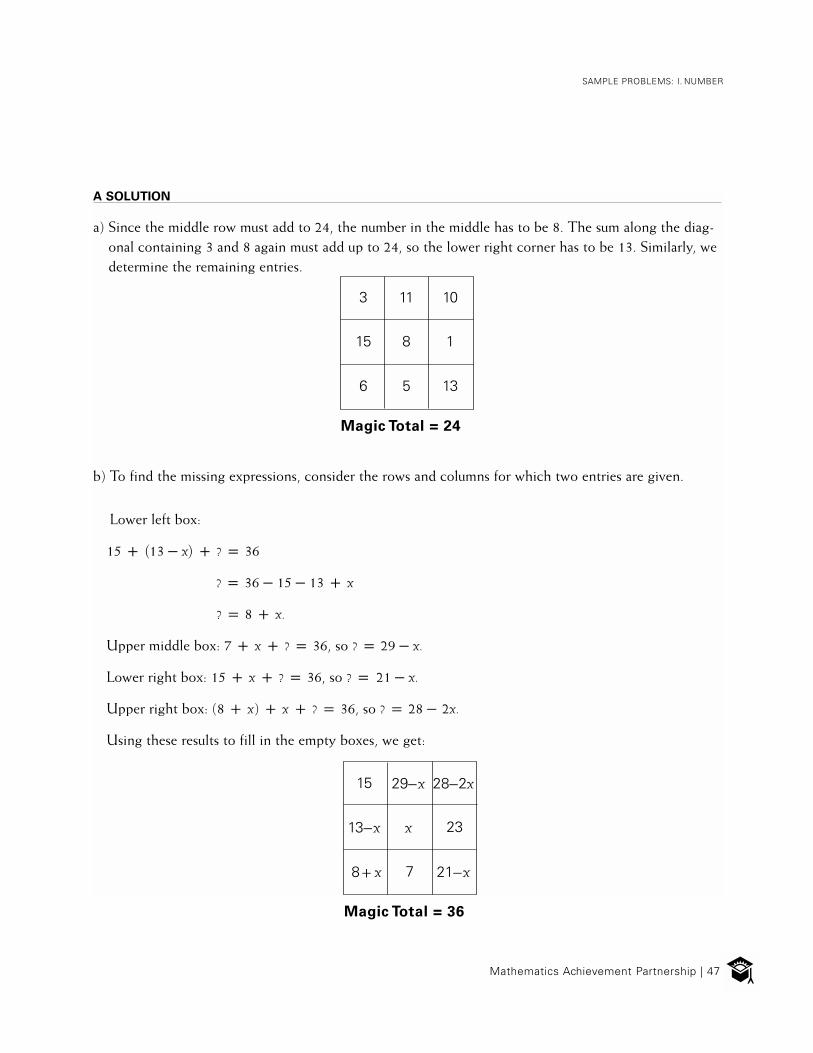
Mathematics Achievement Partnership | 47
SAMPLE PROBLEMS: I. NUMBER
A SOLUTION
a) Since the middle row must add to 24, the number in the middle has to be 8. The sum along the diag-onal containing 3 and 8 again must add up to 24, so the lower right corner has to be 13. Similarly, wedetermine the remaining entries.
b) To find the missing expressions, consider the rows and columns for which two entries are given.
Lower left box:
15 c @13 i x# c ? p 36
? p 36 i 15 i 13 c x
? p 8 c x.
Upper middle box: 7 c x c ? p 36, so ? p 29 i x.
Lower right box: 15 c x c ? p 36, so ? p 21 i x.
Upper right box: (8 c x) c x c ? p 36, so ? p 28 i 2x.
Using these results to fill in the empty boxes, we get:
3 11 10
15 8 1
6 5 13
Magic Total = 24
15 29ix 28i2x
13ix x 23
8cx 7 21ix
Magic Total = 36

48 | Achieve, Inc.
FOUNDATIONS FOR SUCCESS: CONSULTATION DRAFT
c) Let’s take one row (the top one, in this example) and see if we can make an equation:
15 c (29 i x) c (28 i 2x) p 36.
To solve, we combine terms and simplify:
72 i 3x p 36
3x p 36
x p 12.
If we substitute the value x p 12 into the magic square, we get:
15 17 4
1 12 23
20 7 9
Magic Total = 36

Mathematics Achievement Partnership | 49
SAMPLE PROBLEMS: I. NUMBER
N11: Two Comets
There are two comets, A and B. A comes close enough to the earth to be observed every 76 years.
B comes close enough to the earth to be observed every 12 years.
If we can observe both of the comets from the earth this year, how many years will it be before we
can again see them both in the same year?
A SOLUTION
If both comets are visible this year:
Comet A will be visible again in 76 years, in 2 x 76 p 152 years, in 3 x 76 p 228 years, in
4 x 76 p 304 years, and so on; 76, 152, 228, 304 … are multiples of 76.
Comet B will be visible again in 12 years, in 2 x 12 = 24 years, in 3 x 12 p 36 years, in
4 x 12 p 48 years, and so on; 12, 24, 36, 48 … are multiples of 12.
The comets will be visible at the same time in the first year that is both a multiple of 12 and a multiple
of 76. Multiples of both 12 and 76 are common multiples of 12 and 76. The first common multiple of the
two numbers is the least common multiple of 12 and 76.
One way to find the least common multiple of 12 and 76 is to list multiples of each number until we
find the first common multiple.
Sun
EarthB
A

50 | Achieve, Inc.
FOUNDATIONS FOR SUCCESS: CONSULTATION DRAFT
Multiples of 76: 76, 152, 228, 304, 380 …
Multiples of 12: 12, 24, 36, 48, 60, 72, 84, 96, 108, 120, 132, 144, 156, 168, 180, 192, 204, 216, 228 …
228 is the least common multiple of 12 and 76, so the next time both comets will appear together
is in 228 years. Future appearances after that will occur in years that are multiples of 228 (i.e., in
2 x 228 p 456 years, in 3 x 228 p 684 years, and so on).
Another way to find the least common multiple of 12 and 76 is to list the multiples of the greater
number, 76, and test each to see if it is divisible by 12 (if it is divisible by 12, it is also a multiple of 12).
The first multiple of 76 that is divisible by 12 is 228.
The least common multiple of 12 and 76 can also be found using prime factorization: 12 p 22 x 3
and 76 p 22 x 19. The least common multiple must contain each prime factor the greatest number
of times it occurs in each number, so the least common multiple is 22 x 3 x 19 p 228.
ANOTHER SOLUTION
If we divide the period of A by the period of B, we get 76 ÷ 12 p 6 .
This means that:
• when A makes its first return, B has completed 6 revolutions.
• when A makes its second return, B has completed 12 revolutions.
• when A makes its third return, B has completed 18 p 19 revolutions.
This is the first time that a return of A coincides with a whole number of revolutions of B.
But that is just what is required for A and B to be seen together at the earth. This happens after
3 x 76 p 19 x 12 p 228 years.
13
13
23
33
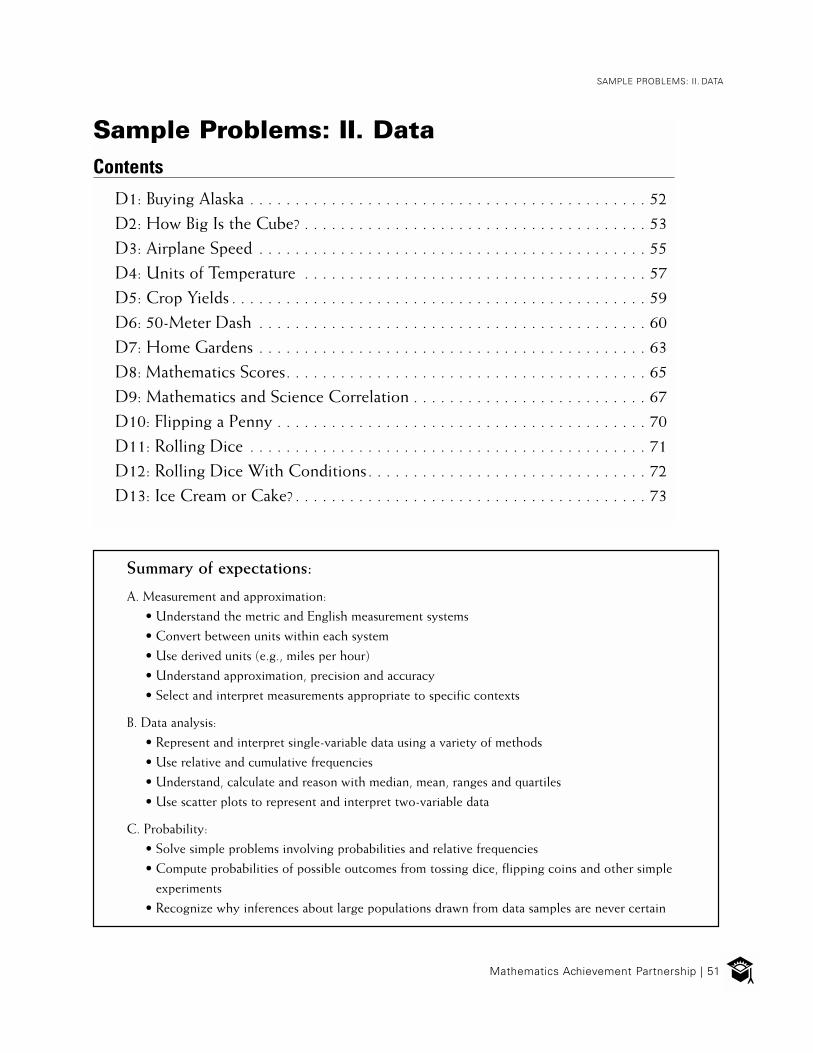
Mathematics Achievement Partnership | 51
SAMPLE PROBLEMS: II. DATA
Sample Problems: II. DataContents
D1: Buying Alaska . . . . . . . . . . . . . . . . . . . . . . . . . . . . . . . . . . . . . . . . . . . . 52
D2: How Big Is the Cube? . . . . . . . . . . . . . . . . . . . . . . . . . . . . . . . . . . . . . . 53
D3: Airplane Speed . . . . . . . . . . . . . . . . . . . . . . . . . . . . . . . . . . . . . . . . . . . 55
D4: Units of Temperature . . . . . . . . . . . . . . . . . . . . . . . . . . . . . . . . . . . . . . 57
D5: Crop Yields . . . . . . . . . . . . . . . . . . . . . . . . . . . . . . . . . . . . . . . . . . . . . . 59
D6: 50-Meter Dash . . . . . . . . . . . . . . . . . . . . . . . . . . . . . . . . . . . . . . . . . . . 60
D7: Home Gardens . . . . . . . . . . . . . . . . . . . . . . . . . . . . . . . . . . . . . . . . . . . 63
D8: Mathematics Scores. . . . . . . . . . . . . . . . . . . . . . . . . . . . . . . . . . . . . . . . 65
D9: Mathematics and Science Correlation . . . . . . . . . . . . . . . . . . . . . . . . . . 67
D10: Flipping a Penny . . . . . . . . . . . . . . . . . . . . . . . . . . . . . . . . . . . . . . . . . 70
D11: Rolling Dice . . . . . . . . . . . . . . . . . . . . . . . . . . . . . . . . . . . . . . . . . . . . 71
D12: Rolling Dice With Conditions. . . . . . . . . . . . . . . . . . . . . . . . . . . . . . . 72
D13: Ice Cream or Cake? . . . . . . . . . . . . . . . . . . . . . . . . . . . . . . . . . . . . . . . 73
Summary of expectations:
A. Measurement and approximation:
• Understand the metric and English measurement systems
• Convert between units within each system
• Use derived units (e.g., miles per hour)
• Understand approximation, precision and accuracy
• Select and interpret measurements appropriate to specific contexts
B. Data analysis:
• Represent and interpret single-variable data using a variety of methods
• Use relative and cumulative frequencies
• Understand, calculate and reason with median, mean, ranges and quartiles
• Use scatter plots to represent and interpret two-variable data
C. Probability:
• Solve simple problems involving probabilities and relative frequencies
• Compute probabilities of possible outcomes from tossing dice, flipping coins and other simple
experiments
• Recognize why inferences about large populations drawn from data samples are never certain

52 | Achieve, Inc.
FOUNDATIONS FOR SUCCESS: CONSULTATION DRAFT
In 1867, the United States purchased the 586,412 square miles of Alaska from Russia for $7.2 million.
a) There are 640 acres in one square mile. About how much did Alaska cost per acre?
b) There are 5,280 feet in one mile. About how much did Alaska cost per square foot?
A SOLUTION
a) There are 586,412 square miles in Alaska, and there are 640 acres in each square mile. Multiplying
these two numbers gives us 375,303,680, which is the total number of acres in Alaska. If 375,303,680
acres cost $7,200,000, then 1 acre cost dollars.
Therefore, it cost about 2 cents per acre to purchase Alaska.
b) Multiplying the 586,412 square miles that make up Alaska by 5,2802 gives us the size of Alaska in
square feet: 586,412 x @5,280#2 ; 1.635 x 10¹³ square feet.
If 1.635 x 10¹³ square feet cost $7,200,000, then one square foot cost
; .
Expressed in decimal notation, this is 0.00000044 dollars, or 0.000044 cents per square foot.
D1. Buying Alaska
7,200,000 375,303,680
7,200,000 ; 7 1 , or 0.02.375,303,680 350 50
$7,200,000 p 1.635 x 10¹³
$7.2 x 10⁶$4.4 x 10 i7
1.635 x 10¹³
p
;

Mathematics Achievement Partnership | 53
SAMPLE PROBLEMS: II. DATA
D2. How Big Is the Cube?
Suppose we measure the length, width and height of a cube, and we get 2 inches on each side. We
conclude that the volume of the cube is 8 cubic inches. However, we know that the instrument we used
to measure the lengths has an error of at most 3%.
a) Between what values could the lengths of the sides actually be?
b) Between what values could the volume of the cube actually be?
c) If the error was the worst possible — a full 3% — what will be the percentage error in measuring
the volume of the cube?
A SOLUTION
a) 3% of 2 inches is 0.06 inches. If there is an error of at most 3% when measuring a 2-inch edge of the
cube, then the largest possible error is 0.06 inches. From this, the simple conclusion is that the true
size of an edge of the cube is between 1.94 inches and 2.06 inches.
However, the true length of an edge of the cube may be more or less than 2 inches (the 2 inches is
what we measured, not the true length of the side), so the 3% should really be b3% of the true size,
not of the measurement. So, to find the maximum and minimum true size, let L be the true length
and solve these equations:
and
So the true length of the cube edge could be between 1.942 inches and 2.062 inches.
b) Using the smallest true length for the edge of the cube, 1.942 inches, the smallest possible volume
would be (1.942)3 ; 7.324 in3. Using the largest true length for the edge of the cube, 2.062 inches,
the largest possible volume would be (2.062)3 ; 8.767 in3.
Therefore, the volume could be between 7.324 in3 and 8.767 in3.
1.03 Lmin p 2
Lmin p 2 ; 1.942 inches1.03
0.97 Lmax p 2
Lmax p 2 ; 2.062 inches.0.97

54 | Achieve, Inc.
FOUNDATIONS FOR SUCCESS: CONSULTATION DRAFT
c) In calculating the largest possible percentage error in measuring the volume of the cube, we need to
write a ratio to compare the largest and smallest possible volumes with the measured volume of 8 in3.
, so 7.324 in3 is about 8.4% smaller than 8 in3.
, so 8.767 in3 is about 9.6% bigger than 8 in3.
Thus, the percentage error in measuring the volume of the cube would be about 9% in either direction.
7.324 ; 91.6%88.767 ; 109.6%8

Mathematics Achievement Partnership | 55
SAMPLE PROBLEMS: II. DATA
D3. Airplane Speed
In Canada, they measure distances in kilometers. One kilometer is about 60% of one mile.
a) An airplane going 300 miles per hour is going S kilometers per hour. Using the information above,
estimate S.
b) Estimate this same speed measured in both meters per hour and meters per second.
c) On graph paper, draw a graph that shows the relationship between miles per hour and meters per
second using the conversion factor 1 km = 0.6 mi. Label the axes and indicate the scales clearly.
d) From the graph, estimate how many meters per second correspond to 125 miles per hour.
e) This graph represents a proportional relationship between miles per hour and meters per second.
What is the constant of proportionality? (This is the slope of the line defined by the given data
points and the origin.)
A SOLUTION
a) 300 is 60% of 500, so 300 miles per hour is about the same speed as 500 kilometers per hour.
b) In order to convert 500 km per hour into meters per hour, we need to know that there are 1,000
meters in each kilometer. So we multiply by 1,000 to convert. Notice how we can make the
dimensions cancel:
.
To convert 500 km per hour into meters per second, we begin with the previous result: 500 km per hour
is the same speed as 500,000 meters per hour. Dividing by 60 (because there are 60 minutes for every
hour) gives us the speed in meters per minute. Notice how, in the calculation, we’re multiplying by 1.
.
speed p 500 km x 1000 mi p 500,000 mih km h
speed p 500,000 mi x 1 h h 60 min p 500,000 m
60 min

56 | Achieve, Inc.
FOUNDATIONS FOR SUCCESS: CONSULTATION DRAFT
Dividing once again by 60 (because there are 60 seconds in a minute) gives us the speed in meters per
second.
.
c) To draw the graph that shows the relationship between miles per hour and meters per second, we need to
see that the relationship is linear, that zero miles per hour corresponds to the point (0, 0) on this
graph, and that 300 miles per hour is about 139 meters per second, giving us the point (300, 139)
on the graph. We can connect the origin through this point to make our graph (below).
d) Finding 125 miles per hour on the horizontal axis and following the grid line up, we can see that 125
miles per hour is nearly halfway between 50 and 75 meters per second. 62 would be a good estimate.
e) We see from the graph and from the calculations in problems part (a) and (b) that 300 miles per hour
on the horizontal axis corresponds to 139 meters per second on the vertical axis. So the equation for
the line is , where k is speed in meters per second and m is speed in miles per hour. (This
way, when m is 300, k is 139, which is what we want.)
The slope of the line, which is the constant of proportionality, is ; 0.46.
MILES PER HOUR VS. METERS PER SECOND
250
200
150
100
50
00 100 200
Miles per hour
Mete
rs p
er
seco
nd
300 400 500
k p 139 m300
139300
speed p 500,000 m x 1 min 60 min 60 sec ; 139 m
secp 500,000 m
3,600 sec

Mathematics Achievement Partnership | 57
SAMPLE PROBLEMS: II. DATA
D4. Units of Temperature
Temperatures are usually measured in degrees Celsius (C) or degrees Fahrenheit (F). The relationship
between C and F is linear. When the temperature is 0º C, it is 32º F. When the temperature is 100º C,
it is 212º F.
a) Make a graph that shows the relationship between F and C. Don’t forget that there are negative
temperatures, too.
b) When we say, “It is below zero outside,” we usually mean, “below 0° F.” What range of Celsius tem-
peratures correspond to “below zero Fahrenheit?”
c) If we make a mistake in measurement by 9º F, how much of a mistake is this in degrees C?
A SOLUTION
a) Since the relationship between degrees Celsius (C) and degrees Fahrenheit (F) is linear, we need
only find the two different points that lie on the graph. When the temperature is 0 degrees Celsius
(the freezing point of water) it is 32 degrees Fahrenheit, so (0, 32) is one point on the graph.
When the temperature is 100 degrees Celsius (the boiling point of water) it is 212 degrees
Fahrenheit. Hence (100, 212) is another point on the graph. The straight line connecting these
points appears in the figure below.
250
200
150
100
50
0
-50
-100
-20-40 0 20 40 60 80 100 120
Deg
rees F
ah
ren
heit
Degrees Celsius
TEMPERATURES

58 | Achieve, Inc.
FOUNDATIONS FOR SUCCESS: CONSULTATION DRAFT
b) Looking carefully at the graph shows that Fahrenheit temperatures are below zero when Celsius temperatures
are less than about i18 degrees. To find this value exactly it is easiest to first find the equation of the line.
The line has slope .
Since the line goes through the point (0,32), its equation (in point-slope form) is
.
Solving for C gives the equation:
From this last equation, setting p 0 gives us , or about i17.7 degrees Celsius.
F is less than 0 if and only if C is less than i17.77.
c) We can see from the graph that every difference of 9° F corresponds to a difference of 5° C. A mistake of
9° F means a rise (or fall) of 9° on the vertical scale of the graph, which corresponds to a rise (or fall) of 5°
on the horizontal scale because the slope of the graph is . So a 9° error in F produces a 5° error in C.
212 i 32 p 180 p 9100 i 0 100 5
F i 32 p 9 @C i 0# or F p 9 C c 325 5
C p 5 @F i 32#.9
C p i 5 @32#p i 1609 9
95
F

Mathematics Achievement Partnership | 59
SAMPLE PROBLEMS: II. DATA
D5. Crop Yields
A tomato farmer can get five pounds of tomatoes from each square yard planted in her vegetable garden.
At that rate, how many tons of tomatoes would she get per acre? (There are 2,000 pounds in a ton, and
4,840 square yards in an acre.)
A SOLUTION
Start with the given ratio of 5 pounds of tomatoes for every square yard. If we multiply that ratio by
4,840 (because there are 4,840 square yards in an acre), we get the number of pounds of tomatoes per
acre:
.
Divide this 24,200 by 2,000 (because there are 2,000 pounds in a ton) to get the number of tons of
tomatoes per acre:
.
5 pounds x 4,840 square yardssquare yard acre
24,200 poundsp 24,200 pounds 1 ton acre
1 acre 2,000 pounds2,000 poundston
p 12.1 tons per acre
p 24,200 poundsacre
x
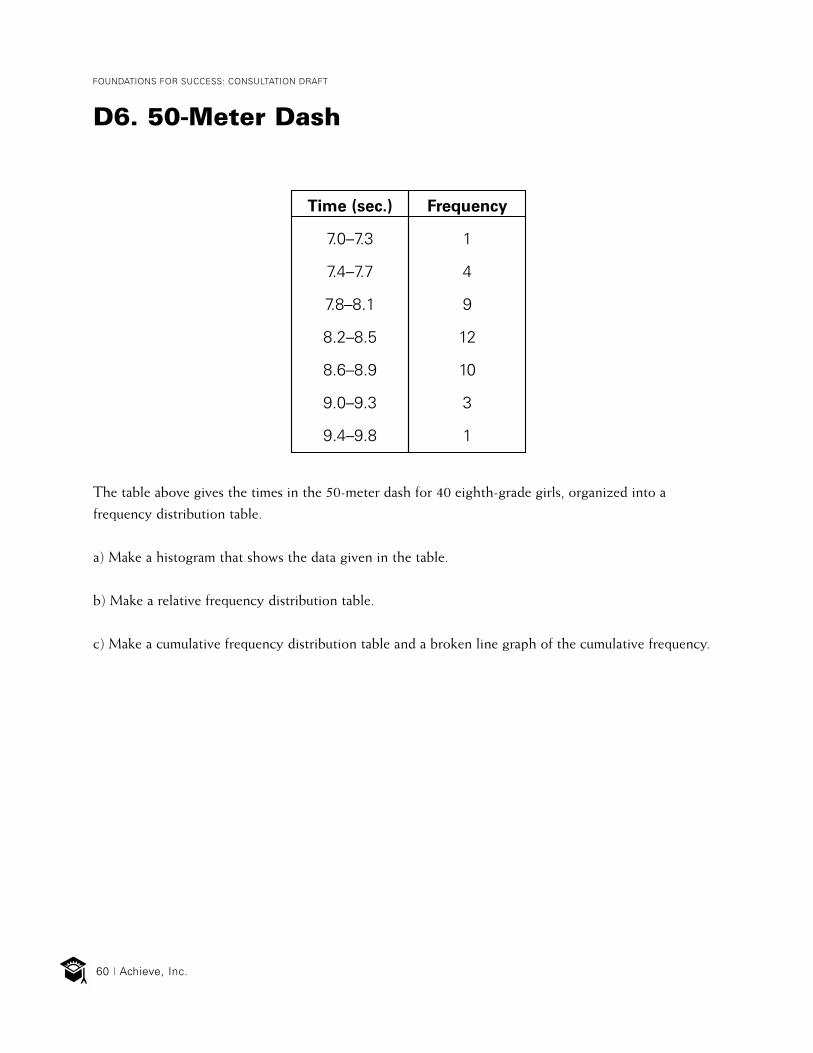
60 | Achieve, Inc.
FOUNDATIONS FOR SUCCESS: CONSULTATION DRAFT
D6. 50-Meter Dash
The table above gives the times in the 50-meter dash for 40 eighth-grade girls, organized into a
frequency distribution table.
a) Make a histogram that shows the data given in the table.
b) Make a relative frequency distribution table.
c) Make a cumulative frequency distribution table and a broken line graph of the cumulative frequency.
Frequency
1
4
9
12
10
3
1
Time (sec.)
7.0–7.3
7.4–7.7
7.8–8.1
8.2–8.5
8.6–8.9
9.0–9.3
9.4–9.8

Mathematics Achievement Partnership | 61
SAMPLE PROBLEMS: II. DATA
A SOLUTION
a) This histogram shows the number of girls who ran the 50-meter dash in each of seven different time
intervals. The intervals are all the same, namely 0.4 seconds.
b) To add the relative frequency column, we use the fact that there are 40 recorded running times.
In the relative frequency column, we write each frequency as a percentage of 40; for example one
runner out of 40 recorded a running time in the interval 7.0–7.3 seconds. One out of 40 is 2.5%.
RUNNING TIMES IN THE 50-METER DASH
Time (sec.) FrequencyRelative
Frequency
7.0–7.3
7.4–7.7
7.8–8.1
8.2–8.5
8.6–8.99.0–9.3
9.4–9.8
Total
1
4
9
12
10
3
1
40
2.5%
10.0%22.5%
30.0%
25.0%
7.5%2.5%
Fre
qu
en
cy
Time (sec.)
RUNNING TIMES IN THE 50-METER DASH
14
12
10
8
6
4
2
0
7.0–7.3 7.4–7.7 7.8–8.1 8.2–8.5 8.6–8.9 9.0–9.3 9.4–9.8
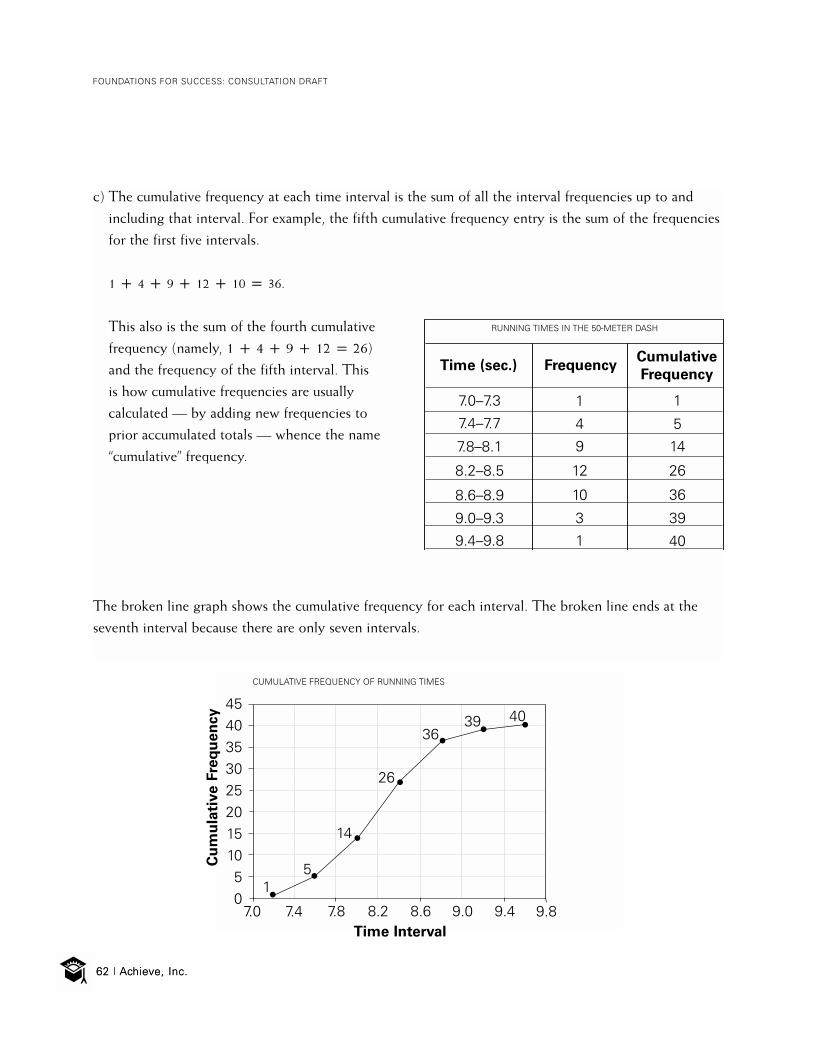
62 | Achieve, Inc.
FOUNDATIONS FOR SUCCESS: CONSULTATION DRAFT
62 | Achieve, Inc.
Cu
mu
lati
ve F
req
uen
cy
Time Interval
CUMULATIVE FREQUENCY OF RUNNING TIMES
454035302520151050
7.0
15
14
26
3639 40
c) The cumulative frequency at each time interval is the sum of all the interval frequencies up to and
including that interval. For example, the fifth cumulative frequency entry is the sum of the frequencies
for the first five intervals.
1 c 4 c 9 c 12 c 10 p 36.
This also is the sum of the fourth cumulative
frequency (namely, 1 c 4 c 9 c 12 p 26)
and the frequency of the fifth interval. This
is how cumulative frequencies are usually
calculated — by adding new frequencies to
prior accumulated totals — whence the name
“cumulative” frequency.
The broken line graph shows the cumulative frequency for each interval. The broken line ends at the
seventh interval because there are only seven intervals.
RUNNING TIMES IN THE 50-METER DASH
Time (sec.) FrequencyCumulative
Frequency
7.0–7.3
7.4–7.7
7.8–8.1
8.2–8.5
8.6–8.9
9.0–9.3
9.4–9.8
1
4
9
12
10
3
1
1
5
14
26
36
39
40
7.4 7.8 8.2 8.6 9.0 9.4 9.8

Mathematics Achievement Partnership | 63
SAMPLE PROBLEMS: II. DATA
D7. Home Gardens
In the Statistical Abstract of the United States (1981, p. 232), the median size of a home garden is listed as
663 square feet.
a) Explain what it means to say that the median size of a home garden is 663 square feet.
b) Why do you think they reported the median size of a home garden instead of the mean?
c) Is it possible for the upper-quartile home garden size to be less than the mean home garden size?
A SOLUTION
a) It means that half the home gardens are 663 square feet or smaller, and half are 663 square feet
or larger.
To find the median size, arrange all the garden sizes in numerical order from least to greatest. Then
find the number that is exactly in the middle of this list. In this case, it was 663 square feet. (If there
are two numbers in the middle, the median would be the average of these two numbers.)
b) It is likely they reported the median because there were a few unusual gardens in the distribution —
that is, extremely large — making the mean rather large and not typical. If one has a list of gardens
in more or less the same range of sizes, and then adds one or two “gardens” the size of New York’s
Central Park, the mean size of the new list of gardens has increased appreciably, while the median
is unchanged. However, it is a matter of judgment which measure — median or mean — is more
“typical,” and the choice depends on the use one wishes to make of the number.
c) Yes, this is possible, as the following example shows. Use these garden sizes:
2100, 110, 120, 130, 150, 170, 180, 190, 200, 600, 8003
The median is 170 (the middle number when the data are placed in numerical order). The upper
quartile is the median of the numbers above 170, in this case 200.
The upper quartile is 200, while the mean is:
100 c110 c120 c130 c150 c170 c 180 c190 c200 c600 c 800 p 250.11

64 | Achieve, Inc.
FOUNDATIONS FOR SUCCESS: CONSULTATION DRAFT
The median is 170, even farther below the mean than the upper quartile, but it is not correct to say
that 170 is more or less valid than 250 as a measure of a “typical” garden.
Because medians and quartiles are determined only by their position on the list when in numerical
order, the magnitude of the largest and smallest values — which influence the mean — have no effect
on medians or quartiles.
Mathematics Achievement Partnership | 65
SAMPLE PROBLEMS: II. DATA
D8. Mathematics Scores
Suppose all of the students in your school are given the same mathematics exam, and the following data
are reported:
a) Give a range of scores so that 50% of the students at your school scored within that range.
b) Give another range different from the one above that contains 50% of the students’ scores.
c) Suppose 522 students at your school scored between 24 and 56 on the exam. How many total
students took the exam at your school?
d) Suppose your friend got a score of 46 on the exam. What can you say about your friend’s
performance on the exam relative to the other students at your school?
A SOLUTION
a) The two quartiles and the median separate the range of mathematics scores into four intervals, each
having an equal number of test scores. Choosing any two adjacent groups would give a range of
scores with 50% of all test scores within that range.
Thus, because 44 is the lower quartile and 56 the upper quartile, a range of 44 through 56 would
represent 50% of all the test scores.
b) Other ranges that would also represent 50% of the scores would be all the scores at or below the
median, or all the scores at or above the median. By definition, the median is the score exactly in the
middle of all the test scores when placed in numerical order. Thus, the range 48 through 62, or 24
through 48, would represent 50% of the scores.
Low score: 24
Mean: 42
Lower quartile score: 44
Median: 48
Upper quartile score: 56
High score: 62

66 | Achieve, Inc.
FOUNDATIONS FOR SUCCESS: CONSULTATION DRAFT
The illustration below shows three possible answers to parts (a) and (b) as gray bands.
c) Simple answer: The range of 24 to 56 represents all the test scores from the lowest score to the upper
quartile. That means this range represents of all the students.
Since 522 students is of all the students, we can find the total number of students by solving the fol-
lowing equation, where x is the total number of students.
.
Attending to more complicated issues: We cannot exactly calculate the number of students. The
above answer, 696, is a possibility. But if we added another student right at the top score, the upper
quartile might not change. Then we’d have 697 students and exactly the same situation!
Or, suppose that there are 523 students in the school, but among the top 131 scores, 130 students
score 56, and one student scores 62. Then it’s possible that the upper quartile is at the “bottom” end of
the clump of 56s, and all of the statistics are the same. So there is a range of answers, running from
523 at least to 697.
d) A student scoring 46 has placed a little below the median, or one might say, rather high in the bot-
tom half of the class. Sometimes people might say that for this class 46 is “below average.” We must be
careful, though. “Average” usually means “mean.” In that case, saying 46 was “below average” would be
wrong, since the mean is actually 42.
low score24
mean median high score
lower quartile upper quartile
3 x p 5224
x p 522 x 43
x p 696 students
42 44 48 56 62
34
34

Mathematics Achievement Partnership | 67
SAMPLE PROBLEMS: II. DATA
D9. Mathematics and Science Correlation
The scatter plot above shows the average test scores on two different tests — one for mathematics and
one for science — for 9-year olds from 26 different countries. (Note that the origin of the graph is at
(200, 200) instead of (0, 0), since the scale of these tests runs from 200 to 800).
a) Is there a positive association, a negative association or no association between mathematics scores
and science scores?
b) Draw in the line that you feel best represents the data in the scatter plot, and find an equation for
the line.
c) Suppose another country’s children averaged 460 on their mathematics scores, but the data are not
shown in the scatter plot. What would you expect the average science test score to be for children in
this country?
d) Suppose someone said, “The scatter plot above shows that being good at mathematics causes you to
have high science scores as well.” Do you think this is a valid conclusion from the scatter plot?
AVERAGE TEST SCORES FOR 9-YEAR OLDS FROM 26 COUNTRIES800
700
600
500
400
300
200 300 400 500 600 700
Avera
ge T
est
Sco
res o
n S
cie
nce T
est
Average Test Scores on Mathematics Test
200
800

68 | Achieve, Inc.
FOUNDATIONS FOR SUCCESS: CONSULTATION DRAFT
A SOLUTION
a) There is a positive association between the mathematics and science scores in that, by and large,
points showing higher scores for mathematics also show higher scores for science.
b) In “eyeballing” a line of best fit, there is no perfect answer. The graph below shows one possibility.
The line drawn on the graph represents the data about as well as a line drawn by a visual estimate
can, in that it seems to have roughly as much “error” represented by points of the scatterplot above
it as below it.
To find the equation of this line, we begin with the slope-intercept formula, y p mx c b, where x
represents the mathematics score and y represents the science score. We need to find the values of m
and b, where m represents the slope of the line and b represents the y-intercept of the line.
The easiest way to find the slope of this line is to find two points that lie on the line, whether or not
those points are part of the scatterplot, and use them to calculate the slope. It appears, for example,
that the points (300, 445) and (600, 670) lie on this line.
AVERAGE TEST SCORES FOR 9-YEAR OLDS FROM 26 COUNTRIES
800
600
500
400
300
200
200 300 400 500 600
Avera
ge T
est
Sco
res o
n S
cie
nce T
est
Average Test Scores on Mathematics Test
800
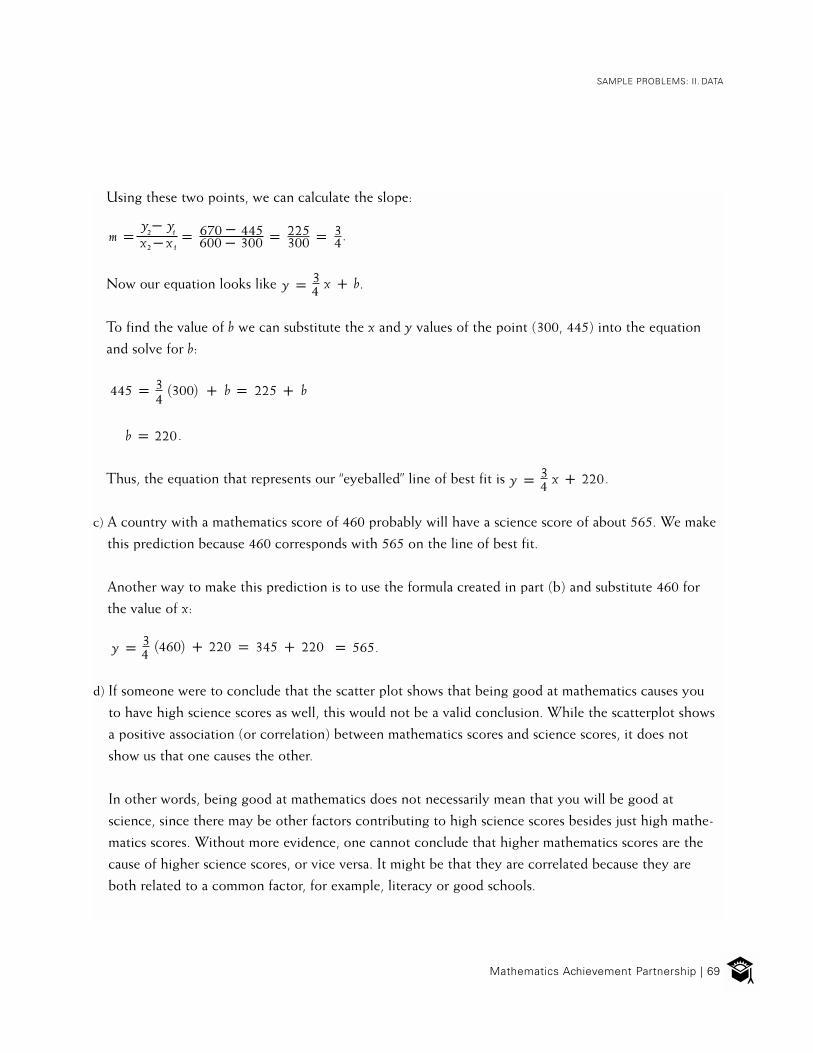
Mathematics Achievement Partnership | 69
SAMPLE PROBLEMS: II. DATA
Using these two points, we can calculate the slope:
.
Now our equation looks like .
To find the value of b we can substitute the x and y values of the point (300, 445) into the equation
and solve for b:
.
Thus, the equation that represents our “eyeballed” line of best fit is .
c) A country with a mathematics score of 460 probably will have a science score of about 565. We make
this prediction because 460 corresponds with 565 on the line of best fit.
Another way to make this prediction is to use the formula created in part (b) and substitute 460 for
the value of x:
.
d) If someone were to conclude that the scatter plot shows that being good at mathematics causes you
to have high science scores as well, this would not be a valid conclusion. While the scatterplot shows
a positive association (or correlation) between mathematics scores and science scores, it does not
show us that one causes the other.
In other words, being good at mathematics does not necessarily mean that you will be good at
science, since there may be other factors contributing to high science scores besides just high mathe-
matics scores. Without more evidence, one cannot conclude that higher mathematics scores are the
cause of higher science scores, or vice versa. It might be that they are correlated because they are
both related to a common factor, for example, literacy or good schools.
y p 3 x c b4
445 p 3 @300# c b p 225 c b4
b p 220
y p 3 x c 2204
y p 3 @460# c 2204 p 345 c 220 p 565
m py i y
p 670 i 445 p 225 p 3x2 i x1 600 i 300 300 4
2 1

70 | Achieve, Inc.
FOUNDATIONS FOR SUCCESS: CONSULTATION DRAFT
D10. Flipping a Penny
You conduct an experiment by flipping a penny twice to see if you get two heads. You do this a total of
25 times, and seven times you get two heads.
a) Based on your experiment, what appears to be the relative frequency of getting two heads when you
flip a coin twice?
b) Assuming that the relative frequencies are equal for heads and tails, (which is not what the experi-
ment in part (a) showed, but which is true in the long run for “fair” coins), and that the result of a
second toss is independent of the result of the first, what is the probability of getting two heads when
you flip a coin twice?
A SOLUTION
a) Based on our experiment, the fraction of the time that we get two heads is of the time. If we want
the relative frequency of getting two heads, we need to change into a percent, which gives a
relative frequency of 28% of the time.
b) Let’s make a tree diagram to identify all the possible outcomes when flipping a coin twice. In the first
column, we write down the only two possibilities for the first flip: The coin can either land on a head
or a tail.
In the second column, we need to record the two possibilities of the second flip, first for the first flip
being a head and then again for the first flip being a tail.
The third column shows the results.
As we can see in the result column, there are
four possible outcomes, one of which has heads
showing up twice. Therefore, the probability of
getting two heads when flipping a coin twice is
, or 25%.
7 25
7 25
14
First Second ResultFlip Flip
HH
T
HH
HT
TH
T
TH
TT

Mathematics Achievement Partnership | 71
SAMPLE PROBLEMS: II. DATA
D11. Rolling Dice
You roll a pair of fair six-sided dice.
a) What is the probability that the sum of the numbers on the uppermost faces of the dice will be 6?
b) What is the probability that you will roll doubles?
c) Are “rolling a sum of 6” and “rolling doubles” equally likely events?
A SOLUTION
a) To find the probability of getting a sum of 6 when rolling two dice, we need to first identify the total
number of possible outcomes. Since both die are six-sided, the total number of possible outcomes is
6 x 6 p 36.
Now we need to identify which of the 36 outcomes have a sum of 6. Listing the outcomes as ordered
pairs, they are (1, 5), (2, 4), (3, 3), (4, 2) and (5, 1). That is, there are five combinations with a sum of 6.
When calculating the probability of an event, the numerator is the number of favorable outcomes, and
the denominator is the total number of possible outcomes. Thus,
b) From part (a) we know that there are 36 possible outcomes.
There are six combinations in which doubles are rolled: (1, 1), (2, 2), (3, 3), (4, 4), (5, 5) and (6, 6).
Hence,
c) “Rolling a sum of 6” and “rolling doubles” are not equally likely events because
P@sum of 6# p number of outcomes with a sum of 6 ptotal number of outcomes when rolling two dice
P@rolling doubles# p number of combinations involving doubles total number of outcomes when rolling two dice
p 6 p 136 6 .
5 0 136 6 .
5 36.
72 | Achieve, Inc.
FOUNDATIONS FOR SUCCESS: CONSULTATION DRAFT
D12. Rolling Dice With Conditions
a) Suppose you were rolling a pair of dice and had just rolled the “double” (2, 2) and the “double”
(4, 4). On your next roll, what is the probability of rolling another “double”?
b) Suppose you rolled the dice into a place you couldn’t see, but your friend looked and reported that
the total of the two dice was an even number. What is the probability, given that information, that
you had rolled a “double”?
c) Suppose instead that your friend reported that the total of the two dice was an odd number. What is
the probability, given this information, that you had rolled a “double”?
A SOLUTION
a) Assuming an honest pair of dice, the probability of “doubles” is the same as it would have been if the
preceding two rolls had been anything else. That is, it would be , or , because there are six possi-
ble “doubles” and 36 equally likely possible outcomes of a roll. The future behavior of honest dice is
independent of their past behavior.
b) Here the answer is different. Knowing that the outcome is even means that you have rolled one of the
following 18 possible even outcomes: (1, 1), (1, 3), (1, 5), (2, 2), (2, 4), (2, 6), (3, 1), (3, 3),
(3, 5), (4, 2), (4, 4), (4, 6), (5, 1), (5, 3), (5, 5), (6, 2), (6, 4) and (6, 6). Of these, six are “doubles.”
So the probability is , or , that — given an even roll — the roll is a double.
(Recall that in part (a), where all outcomes are regarded as equally likely, the probability of a double
was only . Advance knowledge that the outcome is even improves the probability of a double.)
c) Every time you roll a double, the sum is even. So the probability that the roll is a double, given that it
is odd, is zero.
16
6 36
16
13
6 18

Mathematics Achievement Partnership | 73
SAMPLE PROBLEMS: II. DATA
D13. Ice Cream or Cake?
Suppose you survey all the students at your school to find out whether they like ice cream or cake better
as a dessert, and you record your results in the contingency table below:
a) What percentage of students at your school prefers ice cream over cake?
b) At your school, are those preferring ice cream more likely to be boys or girls?
c) At your school, are girls more likely to choose ice cream over cake than boys are?
A SOLUTION
a) We know that there are 303 students at the school and 167 of them prefer ice cream. Since
, this means that about 55% of the students prefer ice cream.
b) Those who prefer ice cream are more likely to be girls since, in this survey, there are more girls who
like ice cream than boys.
ice cream cake totals
boys
girls
totals
82 63 145
1587385
167 136 303
167 ; 55%303

74 | Achieve, Inc.
FOUNDATIONS FOR SUCCESS: CONSULTATION DRAFT
c) To identify the group more likely to choose ice cream over cake, we first find the percentage of girls
who prefer ice cream and the percentage of boys who prefer ice cream.
There are 158 girls total, and 85 of them prefer ice cream. Let’s calculate a percentage:
of the girls prefer ice cream.
There are 145 boys total, and 82 of them prefer ice cream; again, we calculate a percentage:
of the boys prefer ice cream.
Therefore, boys (57%) are more likely than girls (54%) to prefer ice cream.
Even though an ice cream lover is more likely to be a girl than a boy, we cannot conclude that the
chance of preferring ice cream is greater among girls than among boys. (This sort of false conclusion
is common in public discourse.)
85 ; 54%158
82 ; 57%145

Mathematics Achievement Partnership | 75
SAMPLE PROBLEMS: III. GEOMETRY
Sample Problems: III. GeometryContents
G1: Where Polygons Collide . . . . . . . . . . . . . . . . . . . . . . . . . . . . . . . . . . . . 77
G2: Sketch It if You Can . . . . . . . . . . . . . . . . . . . . . . . . . . . . . . . . . . . . . . . 79
G3: Name That Common Solid . . . . . . . . . . . . . . . . . . . . . . . . . . . . . . . . . . 81
G4: Right or Almost Right? . . . . . . . . . . . . . . . . . . . . . . . . . . . . . . . . . . . . . 83
G5: Tiles . . . . . . . . . . . . . . . . . . . . . . . . . . . . . . . . . . . . . . . . . . . . . . . . . . . 85
G6: Leaning Ladders . . . . . . . . . . . . . . . . . . . . . . . . . . . . . . . . . . . . . . . . . . 87
G7: Milling Hexagons . . . . . . . . . . . . . . . . . . . . . . . . . . . . . . . . . . . . . . . . . 89
G8: Chord . . . . . . . . . . . . . . . . . . . . . . . . . . . . . . . . . . . . . . . . . . . . . . . . . . 90
G9: Milk Tanker. . . . . . . . . . . . . . . . . . . . . . . . . . . . . . . . . . . . . . . . . . . . . . 91
G10: Two Circles . . . . . . . . . . . . . . . . . . . . . . . . . . . . . . . . . . . . . . . . . . . . . 93
G11: Yard Cover . . . . . . . . . . . . . . . . . . . . . . . . . . . . . . . . . . . . . . . . . . . . . 95
G12: Rain. . . . . . . . . . . . . . . . . . . . . . . . . . . . . . . . . . . . . . . . . . . . . . . . . . . 97
G13: Prisms . . . . . . . . . . . . . . . . . . . . . . . . . . . . . . . . . . . . . . . . . . . . . . . . . 99
G14: Increasing Volume . . . . . . . . . . . . . . . . . . . . . . . . . . . . . . . . . . . . . . . . 100
G15: Tennis Balls . . . . . . . . . . . . . . . . . . . . . . . . . . . . . . . . . . . . . . . . . . . . . 102
G16: Cone, Sphere, Cylinder. . . . . . . . . . . . . . . . . . . . . . . . . . . . . . . . . . . . 103
G17: From the Cross-Section. . . . . . . . . . . . . . . . . . . . . . . . . . . . . . . . . . . . 105
G18: Similar Polygons . . . . . . . . . . . . . . . . . . . . . . . . . . . . . . . . . . . . . . . . . 106
G19: Circle Transformations . . . . . . . . . . . . . . . . . . . . . . . . . . . . . . . . . . . . 107
G20: Two Tetrahedra . . . . . . . . . . . . . . . . . . . . . . . . . . . . . . . . . . . . . . . . . . 109
G21: Length of Rope . . . . . . . . . . . . . . . . . . . . . . . . . . . . . . . . . . . . . . . . . . 110
G22: Right Triangle . . . . . . . . . . . . . . . . . . . . . . . . . . . . . . . . . . . . . . . . . . . 112

76 | Achieve, Inc.
FOUNDATIONS FOR SUCCESS: CONSULTATION DRAFT
Summary of expectations:
A. Geometric figures:
• Understand the concepts of length, area, volume and surface area
• Understand the concept of angle measure and basic properties of angles
• Know the definitions of radius, diameter and circumference of a circle, and the relationships
among them
• Be thoroughly familiar with the properties of triangles (isosceles, equilateral, right), rectangles,
parallelograms, trapezoids and other convex polygons
• Recognize two classes (cones and cylinders) of common three-dimensional solids
• Be able to represent three-dimensional figures accurately in two-dimensions
B. Measurement:
• Solve problems involving length, area and volume of common geometric objects
• Understand, prove and use the Pythagorean theorem
C. Transformations:
• Understand the meaning of terms such as rotation, reflection, translation, expansion, contraction and
scale factors
• Know how to decide whether two figures are similar or congruent
• Use congruence and similarity in solving problems
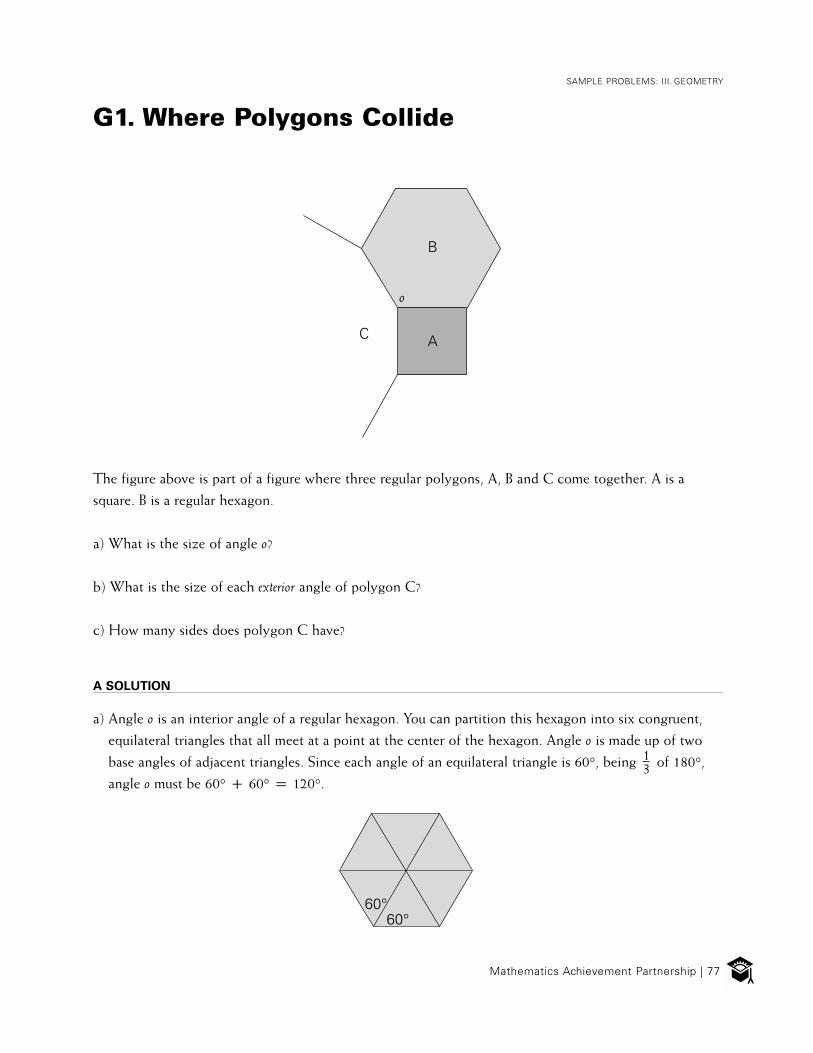
Mathematics Achievement Partnership | 77
SAMPLE PROBLEMS: III. GEOMETRY
G1. Where Polygons Collide
The figure above is part of a figure where three regular polygons, A, B and C come together. A is a
square. B is a regular hexagon.
a) What is the size of angle o?
b) What is the size of each exterior angle of polygon C?
c) How many sides does polygon C have?
A SOLUTION
a) Angle o is an interior angle of a regular hexagon. You can partition this hexagon into six congruent,
equilateral triangles that all meet at a point at the center of the hexagon. Angle o is made up of two
base angles of adjacent triangles. Since each angle of an equilateral triangle is 60°, being of 180°,
angle o must be 60° c 60° p 120°.
o
B
C A
60°60°
13

78 | Achieve, Inc.
FOUNDATIONS FOR SUCCESS: CONSULTATION DRAFT
b) The exterior angle of polygon C is the angle e, formed by extending one side. Since angle o is
120° and o p 90° c e , it follows that e p 30°.
Thus, each exterior angle of the regular polygon c is 30°.
c) The sum of the exterior angles of a polygon is 360°. C is a regular polygon, where each exterior
angle equals 30°. Since the number of sides in C is equal to the number of exterior angles,
the number of sides p 360° p 12.30°
e90°
C
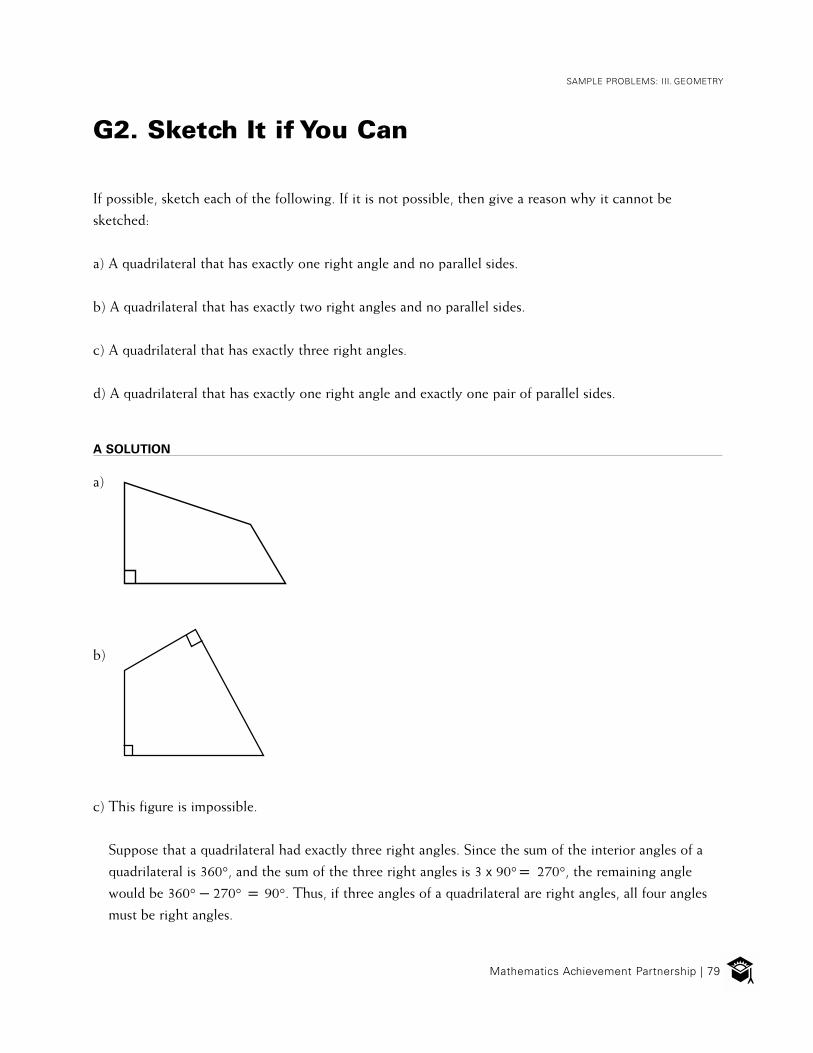
Mathematics Achievement Partnership | 79
SAMPLE PROBLEMS: III. GEOMETRY
G2. Sketch It if You Can
If possible, sketch each of the following. If it is not possible, then give a reason why it cannot be
sketched:
a) A quadrilateral that has exactly one right angle and no parallel sides.
b) A quadrilateral that has exactly two right angles and no parallel sides.
c) A quadrilateral that has exactly three right angles.
d) A quadrilateral that has exactly one right angle and exactly one pair of parallel sides.
A SOLUTION
a)
b)
c) This figure is impossible.
Suppose that a quadrilateral had exactly three right angles. Since the sum of the interior angles of a
quadrilateral is 360°, and the sum of the three right angles is 3 x 90°p 270°, the remaining angle
would be 360° i 270° p 90°. Thus, if three angles of a quadrilateral are right angles, all four angles
must be right angles.

80 | Achieve, Inc.
FOUNDATIONS FOR SUCCESS: CONSULTATION DRAFT
d) This figure is impossible.
Let’s try to construct the figure. We’ll start with two parallel lines, AB and DC. The right angle has to
be somewhere; we’ll put it at C. We extend a ray perpendicular to DC to make the right angle.
Wherever it hits line AB, that’s where we put point B.
Since ray CB crosses both DC and AB, and AB is parallel to DC, the angles ABC and BCD are
supplementary angles. Therefore, ABC c BCD p 180°.
But BCD p 90°, so ABC must equal 90° also. Thus, any quadrilateral with two parallel sides
and one right angle must have at least two right angles.
A B?
CD

Mathematics Achievement Partnership | 81
SAMPLE PROBLEMS: III. GEOMETRY
G3. Name That Common Solid
Here we describe some top, front and side views of familiar solids; that is, cones, cylinders, pyramids
and cubes. In each case, identify a solid whose views match the given description, and sketch a view of it
that shows its principal features.
a) Side view and front view are triangles. Top view is a circle.
b) Side view and front view are rectangles. Top view is a circle.
c) Side view and front view are triangles. Top view is a square.
d) Side view and front view are triangles. Top view is a rectangle.
e) Side view and front view are rectangles. Top view is a rectangle.
f) Side view, front view and top view are all congruent squares.
g) Side view, front view, and top view are all congruent, and all triangles.
A SOLUTION
a) Cone
b) Cylinder

82 | Achieve, Inc.
FOUNDATIONS FOR SUCCESS: CONSULTATION DRAFT
c) Square pyramid
d) Rectangular pyramid
e) Rectangluar prism
f) Cube
g) Triangular pyramid
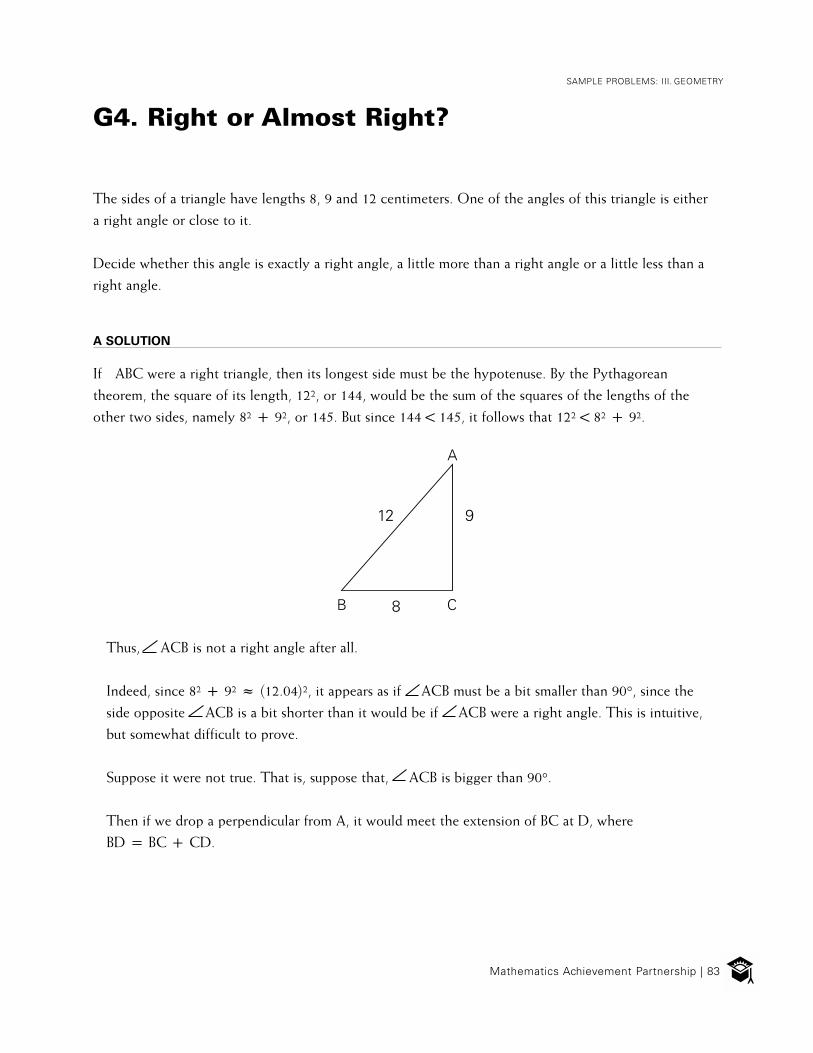
Mathematics Achievement Partnership | 83
SAMPLE PROBLEMS: III. GEOMETRY
G4. Right or Almost Right?
The sides of a triangle have lengths 8, 9 and 12 centimeters. One of the angles of this triangle is either
a right angle or close to it.
Decide whether this angle is exactly a right angle, a little more than a right angle or a little less than a
right angle.
A SOLUTION
If ABC were a right triangle, then its longest side must be the hypotenuse. By the Pythagorean
theorem, the square of its length, 122, or 144, would be the sum of the squares of the lengths of the
other two sides, namely 82 c 92, or 145. But since 144 ! 145, it follows that 122 ! 82 c 92.
Thus, ACB is not a right angle after all.
Indeed, since 82 c 92 ; @12.04#2, it appears as if ACB must be a bit smaller than 90°, since the
side opposite ACB is a bit shorter than it would be if ACB were a right angle. This is intuitive,
but somewhat difficult to prove.
Suppose it were not true. That is, suppose that, ACB is bigger than 90°.
Then if we drop a perpendicular from A, it would meet the extension of BC at D, where
BD p BC c CD.
12
8
9
A
B C

84 | Achieve, Inc.
FOUNDATIONS FOR SUCCESS: CONSULTATION DRAFT
By the Pythagorean theorem,
AB2 p BD2 c AD2
p @BC c CD#2 c AD2
p BC2 c CD2 c AD2 c 2@BC#@CD#.
But ADC is also a right triangle, so the Pythagorean theorem also implies that CD2 c AD2 p AC2.
By substituting this into the expression for AB2, we see that: AB2 p BC2 c AC2 c 2@BC#@CD#.
This means that 122 p 82 c 92 c 2@BC#@CD#, (i.e., 144 p 145 c 2@BC#@CD#), which is impossible
since 2@BC#@CD# 1 0, and 144 ! 145.
This shows that ACB must be less than 90°.
A
B C D

Mathematics Achievement Partnership | 85
SAMPLE PROBLEMS: III. GEOMETRY
A store sells tiles in four different designs. Three tiles are square and the other is a right-angled triangle.
The tiles will be used to make patterns. Here are two ways they can be fitted together:
a) Explain how you know that the two figures above are squares.
b) Suppose that a p 10 cm and b p 20 cm. Calculate the area of each tile and the length of side c.
A SOLUTION
a) To conclude that each figure is a square we need to verify that, in each figure, all four sides are
straight lines of equal length and all four angles are right angles. By inspection we can see that each
corner is a right angle and each side has length a c b. So all that we need to prove is that the sides
of each figure are straight lines.
Proving that something is straight amounts to showing that the angles along the way are straight
angles — measuring 180°.
Tile A
a
a
b
b
c
c
b
ac
Tile B Tile C Tile D
G5. Tiles
a
a b
c
c
b
a
b
a
b
b
b
b
b
c c
c c
a
a
a
a

86 | Achieve, Inc.
FOUNDATIONS FOR SUCCESS: CONSULTATION DRAFT
For the figure on the left, two sides (upper and right) are clearly straight lines, since they are formed by
two right angles. The left and lower sides are created from three angles that, differently arranged, are
the angles of the triangular tile D. Since the interior angles of a triangle add up to 180°, so do the
angles that create those two sides of the figure. Hence both sides are straight lines, so the figure is a
square.
The same argument shows that each side of the other figure is also a straight line. The angles at the
point where the tiles come together are the same as the interior angles of triangular tile D. Thus they
form a straight line.
b) The area of tile A is 102 cm2 p 100 cm2, the area of tile B is 202 cm2 p 400 cm2 and the area of tile
D is @ #@10#@20# cm2 p 100 cm2. Thus, the area of tile C can be calculated by subtraction from the
composite figure:
@10+20#2 i 4@100# p 302 i 400 p 900 i 400 p 500 cm2.
The area of tile C is 500 cm2, so the length of a side is M500 p 10M5 .
12
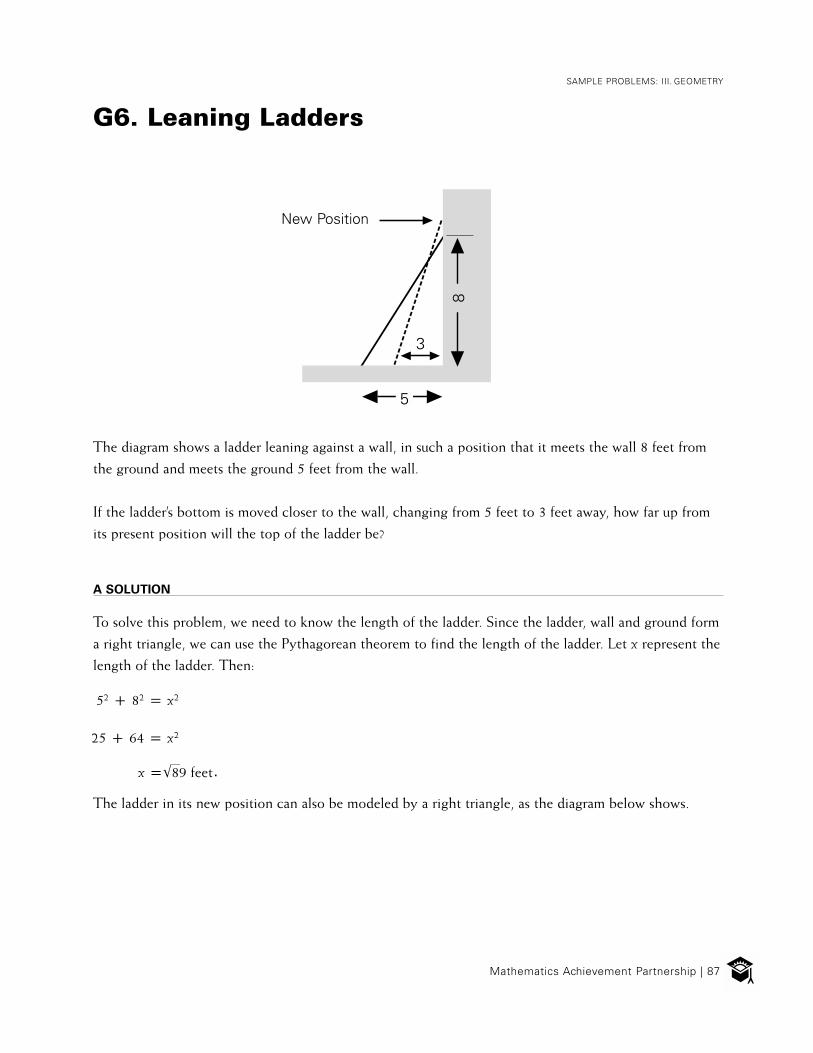
Mathematics Achievement Partnership | 87
SAMPLE PROBLEMS: III. GEOMETRY
G6. Leaning Ladders
The diagram shows a ladder leaning against a wall, in such a position that it meets the wall 8 feet from
the ground and meets the ground 5 feet from the wall.
If the ladder’s bottom is moved closer to the wall, changing from 5 feet to 3 feet away, how far up from
its present position will the top of the ladder be?
A SOLUTION
To solve this problem, we need to know the length of the ladder. Since the ladder, wall and ground form
a right triangle, we can use the Pythagorean theorem to find the length of the ladder. Let x represent the
length of the ladder. Then:
.
The ladder in its new position can also be modeled by a right triangle, as the diagram below shows.
3
5
New Position
8
52 c 82 p x2
25 c 64 p x2
x pM89 feet

88 | Achieve, Inc.
FOUNDATIONS FOR SUCCESS: CONSULTATION DRAFT
Let d represent the new height of the top of the ladder above the ground. Then:
To find the change in position of the ladder, we subtract the original position of the top of
the ladder from the new position. This yields M80 i 8, which, since 92 = 81, is a little less than
1 foot. M80 i 8 ; 8.944 i 8 p 0.944.
32 c d2 p 89
9 c d2 p 89
d pM80.
d2 p 80
d
3
kl89

Mathematics Achievement Partnership | 89
SAMPLE PROBLEMS: III. GEOMETRY
G7. Milling Hexagons
A machinist mills round steel rods so that all cross-sections are regular hexagons, as shown in the
diagram above.
One of the hexagonal pieces needs to be 9 inches on a side. What is the diameter of the rod that is
needed?
A SOLUTION
Join the vertices of the hexagon to the center of the circle, as shown.
Because of symmetry, the six central angles are all equal, and each
measure p 60°. Since the radii are equal, we know that each of
these six triangles is an isosceles triangle.
Therefore, the base angles of each triangle are equal. Since the sum of
the angles of a triangle is 180°, the measure of each base angle is
p 60°. This means that the measure of each of the angles
of each triangle is 60°, which therefore means that all six triangles are equilateral.
This implies that the radius of the rod is 9 inches. Therefore, the diameter is 18 inches.
9 inches
9 inches
360°6
@180° i 60°#2

90 | Achieve, Inc.
FOUNDATIONS FOR SUCCESS: CONSULTATION DRAFT
8
10 - x
8
10
1010
x
D
B
C
A
G8. Chord
The diagram shows a circle with diameter 20 meters that is cut by a chord of length 16 meters.
Find the length x of the segment (shown in the diagram) that is perpendicular to the chord and
intersects the chord at its midpoint.
A SOLUTION
Since the diameter of the circle is 20 meters, the radius is 10 meters.
The segment BD is the perpendicular bisector of the chord. We can extend it to form a radius of the
circle CD, which has a length of 10 meters. Since B is the midpoint of the chord, AB is half the length
of the chord: 8 meters.
The radius AC is also 10 meters long, and ABC is a right triangle. Therefore by the Pythagorean theorem,
BC2 c 82 p 102, so that BC = 6 meters. It follows that x p DB p CD i BC p 10 i 6 = 4 meters.
Another way to see this is to observe that ABC is a right triangle with the hypotenuse and a leg equal
to 10 and 8. Thus, it is double the size of the common 3-4-5 right triangle, which is a 6-8-10 right
triangle. Hence BC p 6, so DB p 4 meters.
16 meters
x
20 meters

Mathematics Achievement Partnership | 91
SAMPLE PROBLEMS: III. GEOMETRY
G9. Milk Tanker
A stainless steel milk tanker in the shape of a right circular cylinder is 38 feet long and 5 feet in diameter.
Determine the amount of stainless steel material needed to construct the tanker, assuming that 12% of
the material you start with will be wasted in the construction process.
A SOLUTION
To find the amount of stainless steel material needed to build the tank, we need to first find the surface
area of a right circular cylinder that is 38 feet long and 5 feet in diameter (shown in the diagram).
The net for this cylinder would look like the diagram above and have the given dimensions. The height
of the rectangle, c, is the same as the circumference of the cylinder base.
Thus:
c p d p 5 ; 15.7.
38 Feet
5 Fe
et
c
5 5
38
92 | Achieve, Inc.
FOUNDATIONS FOR SUCCESS: CONSULTATION DRAFT
We can find the surface area of the tanker by finding the total area of the two circles and the rectangle.
Atotal p 2Acircle c Arectangle
p 2 x @ #2c 38 x 5
p 202.5 square feet.
Since we know that 12% of the materials will be wasted during the construction of the tanker, we can
think of the 202.5 ft2 (approximately 636 ft2) required at the end of the construction process as 88%
of the materials at the start of the construction process.
Let m represent the amount of materials needed at the start of construction.
Hence, @0.88#m p 202.5
m p 202.5
52
p50 c1904
.88; 723 square feet.

Mathematics Achievement Partnership | 93
SAMPLE PROBLEMS: III. GEOMETRY
G10. Two Circles
One circle has a circumference of exactly 22 centimeters. A second circle has a diameter of exactly
7 centimeters.
a) Which circle has a smaller radius?
b) Using the value of on your calculator, find the area of the ring created when the smaller circle is
placed inside the larger one. Give the answer to 4 decimal places.
c) Repeat part (b) using the approximation 3.14 for .
d) Repeat part (b) using the approximation 3.1416 for .
e) Repeat part (b) using the approximation for .
A SOLUTION
a) Let’s say that circle 1 is the one with the 22-cm circumference, and circle 2 has the diameter of 7 cm.
First, find their radii. For circle 1, C p 2 r p 22, so .
For circle 2, the diameter p 7, so . Thus circle 2 is smaller, but not by much.
b) We could compute the area of circle 1 by using the approximate value r 3.5032, but it is better to
use the exact value of . Thus, the area of circle 1 is
A1 p @ #2 p .
Similarly, the area of circle 2 is A2 p @ #2 p .
The area of the ring between the circles is the difference between these two areas.
Aring p A1 i A2
r p 11 ; 3.5032
p 3.5000r p 72
11
121
72
494
11
p 121 i 494 .
227

94 | Achieve, Inc.
FOUNDATIONS FOR SUCCESS: CONSULTATION DRAFT
Using this formula for the area of the ring and the 8-digit value of on a calculator, we find that the
area of the ring is approximately equal to 0.0310 cm2.
c) Using 3.14 for , the area of the ring appears to be 0.0700 cm2.
d) Using 3.1416 for , the area of the ring appears to be 0.0308 cm2. Note how this is closer to the
“calculator” value.
e) Using for , the calculated area of the ring is 0 cm2:227
x
227
227121 49
4
11 11 7 7 x x x x42 11x
p 11 7 11 7 x i2 2
x
p 0.
( )i
p 2 11i
121 7 7x x422
p (7 7)i
2 11xx

Mathematics Achievement Partnership | 95
SAMPLE PROBLEMS: III. GEOMETRY
G11. Yard Cover
How many square yards of grass are required to cover the yard above?
A SOLUTION
To find the area of the grass required to cover the yard, we will first find the area of the entire rectangle.
Then we’ll subtract the portions of the rectangle that are not grass. All areas are measured in square feet.
Area of entire rectangle p 51.5 x 64.5 p 3321.75 ft2.
Area of driveway p 29 x 10 p 290 ft.
YardHouse
Dri
ve
way
29’
51’ 6
”
17‘ 6
”35’
29’ 6”
64’ 6”
31’
10’
19’
YardHouse
Missing Corner
Dri
vew
ay
29’
51’ 6
”
17‘ 6
”
32’ 6
”
19’
35’
29’ 6”
64’ 6”
31’
10’

96 | Achieve, Inc.
FOUNDATIONS FOR SUCCESS: CONSULTATION DRAFT
Area of house p 17.5 x 31 p 542.5 ft2.
Area of missing corner p 19 x 29.5 p560.5 ft2.
Area of yard p [area of entire rectangle] i [all the portions that are not grass]
p 3321.75 i 290 i 542.5 i 560.5
p 1928.75 ft2.
But we are asked to give the area of the grass in square yards. There are 9 square feet in a square yard.
By dividing the area of the grass in square feet by 9, we get the area of the grass in square yards:
.1928.75 ; 214.3 square yards9
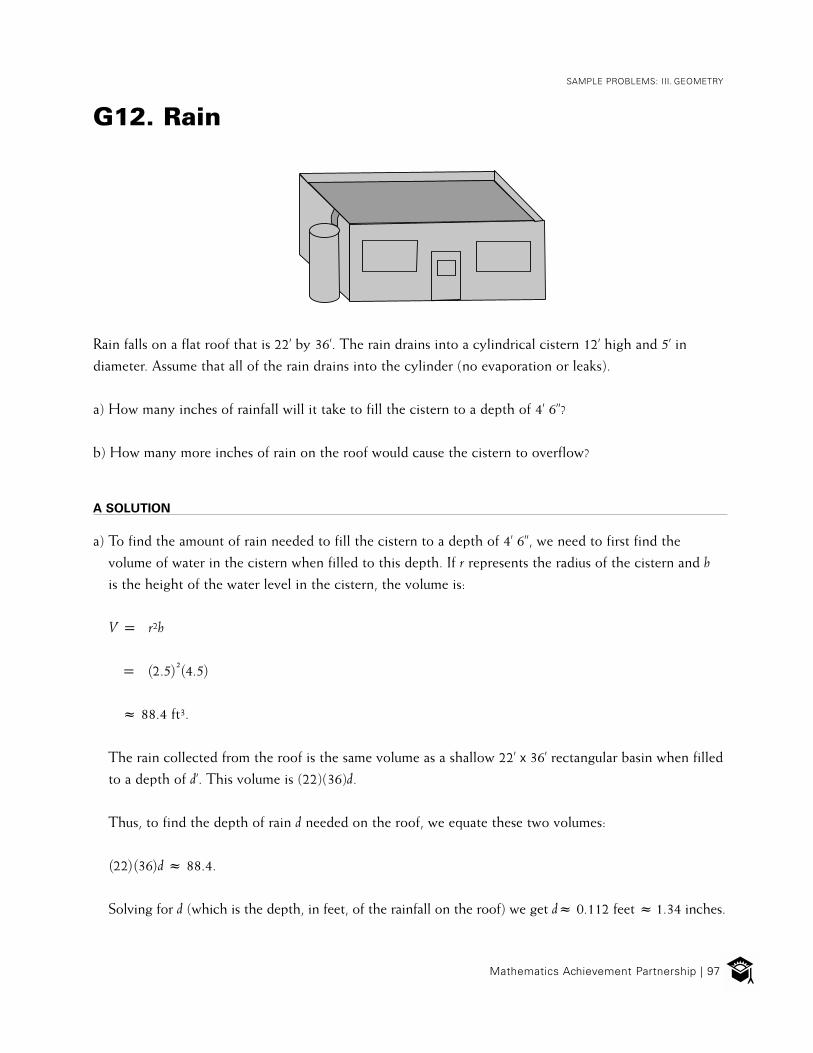
Mathematics Achievement Partnership | 97
SAMPLE PROBLEMS: III. GEOMETRY
G12. Rain
Rain falls on a flat roof that is 22’ by 36’. The rain drains into a cylindrical cistern 12’ high and 5’ in
diameter. Assume that all of the rain drains into the cylinder (no evaporation or leaks).
a) How many inches of rainfall will it take to fill the cistern to a depth of 4’ 6”?
b) How many more inches of rain on the roof would cause the cistern to overflow?
A SOLUTION
a) To find the amount of rain needed to fill the cistern to a depth of 4’ 6’’, we need to first find the
volume of water in the cistern when filled to this depth. If r represents the radius of the cistern and h
is the height of the water level in the cistern, the volume is:
V p r2h
p @2.5#[email protected]#
; 88.4 ft3.
The rain collected from the roof is the same volume as a shallow 22’ x 36’ rectangular basin when filled
to a depth of d’. This volume is (22)(36)d.
Thus, to find the depth of rain d needed on the roof, we equate these two volumes:
@22#@36#d ; 88.4.
Solving for d (which is the depth, in feet, of the rainfall on the roof) we get d; 0.112 feet ; 1.34 inches.

98 | Achieve, Inc.
FOUNDATIONS FOR SUCCESS: CONSULTATION DRAFT
b) To find the volume of additional rain needed to overflow the cistern, we need to find the volume of
the remaining space in the cistern, which is 12 i 4.5 p 7.5 feet tall.
We compute the volume as before.
V p r2h
p @2.5#[email protected])
; 147.3 ft3.
And, as before, we find the depth d of the rain on the roof that would yield this volume:
@22#@36#d ; 147.3.
This gives d ; 0.186 ft, or approximately 2.23 inches. More than this amount of rainfall will cause
the cistern to overflow.
AN ALTERNATE SOLUTION
Since the volume of the cistern is proportional to its height, the extra depth of rain sought is
proportional to that calculated in part (a):
Thus, d p 2.23 inches.
d 7.51.34 4.5
p

Mathematics Achievement Partnership | 99
SAMPLE PROBLEMS: III. GEOMETRY
G13. Prisms
The prism pictured above has height h.
a) Draw a sketch of a different prism with the same base and volume as the prism above.
b) If the area of the base of the prism is 10 square feet, what is the volume of this prism?
A SOLUTION
a) One picture would be a right prism with the same base and the same height. Since volume is just base
area times height, the volume remains the same.
b) Volume p [base area] x [height]. We are given that the base area is 10 square feet and the height is h,
therefore, the volume is 10h in square feet.
A = 10 square feet
h
A = 10 square feet
h

100 | Achieve, Inc.
FOUNDATIONS FOR SUCCESS: CONSULTATION DRAFT
G14. Increasing Volume
A rectangular box measures 4.3 centimeters by 6.81 centimeters by 14.007 centimeters. Suppose you
can increase just one of these dimensions by exactly 1 centimeter. Which one would you increase if
you wanted the largest possible increase in volume?
A BRUTE FORCE SOLUTION
We could solve this first question by trial and error, increasing each dimension by 1 centimeter and
finding the dimension that increases the volume the most.
Volume with the original dimensions: 4.3 x 6.81 x 14.007 p 410.2 cm3.
Volume after increasing the first dimension by 1 centimeter: 5.3 x 6.81 x 14.007 p 505.6 cm3.
Volume after increasing the second dimension by 1 centimeter: 4.3 x 7.81 x 14.007 p 470.4 cm3.
Volume after increasing the third dimension by 1 centimeter: 4.3 x 6.81 x 15.007 p 439.4 cm3.
So increasing the smallest edge length by 1 centimeter results in the largest increase in volume.
A THOUGHTFUL SOLUTION
Although “brute force” calculations such as those above produce an answer, they don’t really reveal
what’s going on. Thinking about it, we see that the additional volume is a (thin) rectangular box.
One dimension of this box will be 1 cm, and the other two dimensions will be those of the sides not
increased. Since we want the largest possible volume, we want to keep the largest two numbers and
increase the smallest one. In other words, add 1 centimeter to the side that is just 4.3 centimeter.
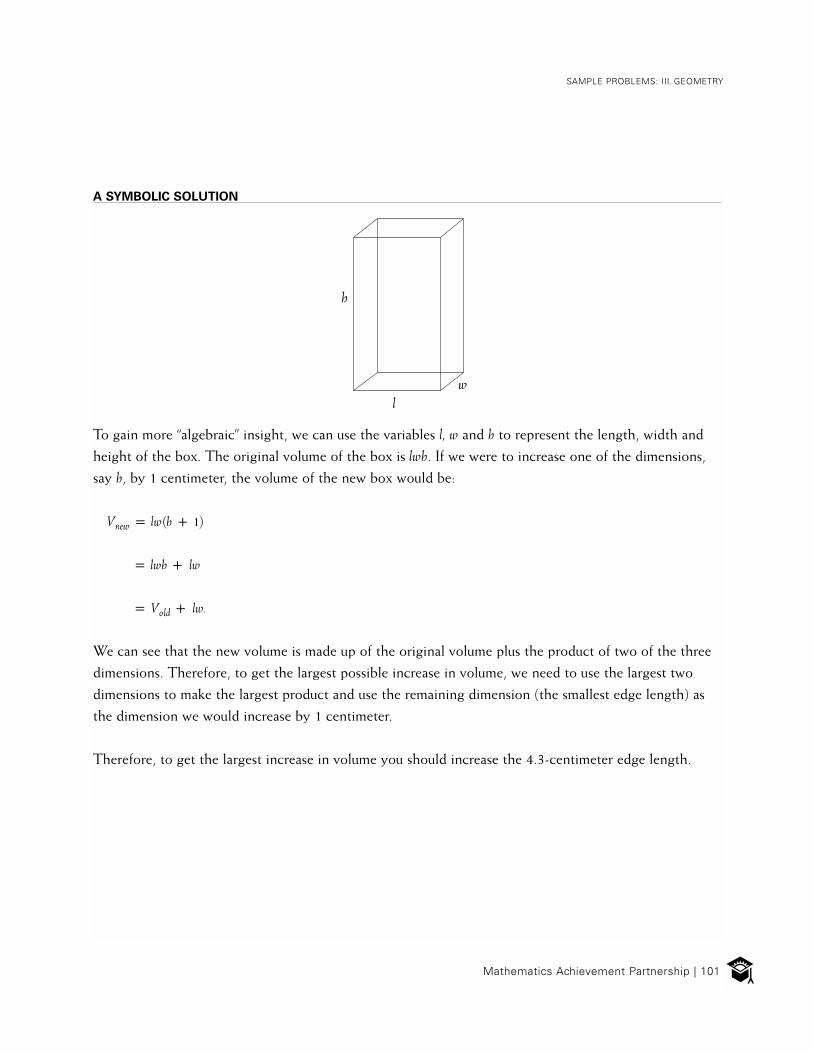
Mathematics Achievement Partnership | 101
SAMPLE PROBLEMS: III. GEOMETRY
A SYMBOLIC SOLUTION
To gain more “algebraic” insight, we can use the variables l, w and h to represent the length, width and
height of the box. The original volume of the box is lwh. If we were to increase one of the dimensions,
say h, by 1 centimeter, the volume of the new box would be:
Vnew p lw@h c 1#
p lwh c lw
p Vold c lw.
We can see that the new volume is made up of the original volume plus the product of two of the three
dimensions. Therefore, to get the largest possible increase in volume, we need to use the largest two
dimensions to make the largest product and use the remaining dimension (the smallest edge length) as
the dimension we would increase by 1 centimeter.
Therefore, to get the largest increase in volume you should increase the 4.3-centimeter edge length.
h
lw

102 | Achieve, Inc.
FOUNDATIONS FOR SUCCESS: CONSULTATION DRAFT
G15. Tennis Balls
Tennis balls are often packed snugly three to a can.
What percent of the volume of the can do the tennis balls occupy?
A SOLUTION
If we let r represent the radius of each tennis ball, then the radius of the can is r, the height of the
can is 6r and the area of the base is r2. Thus the volume of the can is @6r#@ r2# p 6 r3, while the
volume of each tennis ball is . So the percent of the volume occupied by the tennis balls is 4 r33
3Vball pVcan
3 x 4 r33
6 r3 p 4 26 r3 3
; 67%.pr3

Mathematics Achievement Partnership | 103
SAMPLE PROBLEMS: III. GEOMETRY
G16. Cone, Sphere, Cylinder
Imagine a cone inscribed in a cylinder of the same size, so that the base of the cone is the same as the
base of the cylinder and the top of the cone touches the top of the cylinder. Imagine also a sphere
inscribed in a cylinder so that the sphere touches the cylinder at the north and south poles and all the
way around the equator.
Show that the ratio Volume of cone : Volume of sphere : Volume of cylinder is 1 : 2 : 3.
A SOLUTION
Let’s use r to denote the radius of the cylinder. This is then the same as the radius of the sphere and the
radius of the base of the cone. Therefore, the height of the cylinder is the same as the sphere’s diameter,
that is, h p 2r. This is also the height of the cone. So we’ll apply the various formulas for volume and
substitute 2r for h where appropriate:

104 | Achieve, Inc.
FOUNDATIONS FOR SUCCESS: CONSULTATION DRAFT
Sketching and labeling the cross section
makes clear the dimensions of each volume.
The volume of each figure is calculated from
the area of the base A and the height h.
In each case A p r2 and h p 2r.
Simplification yields:
To find the ratios, divide by the common
factor of r3.
Thus the ratios of the volumes are 1 : 2 : 3.
1 r2 x 2r32 r2 x 2r3
r2 x 2r
2 r33
4 r33
6 r33
2 4 613
1 Ah32 Ah3 Ah
r r
r
h
r
h
r
h
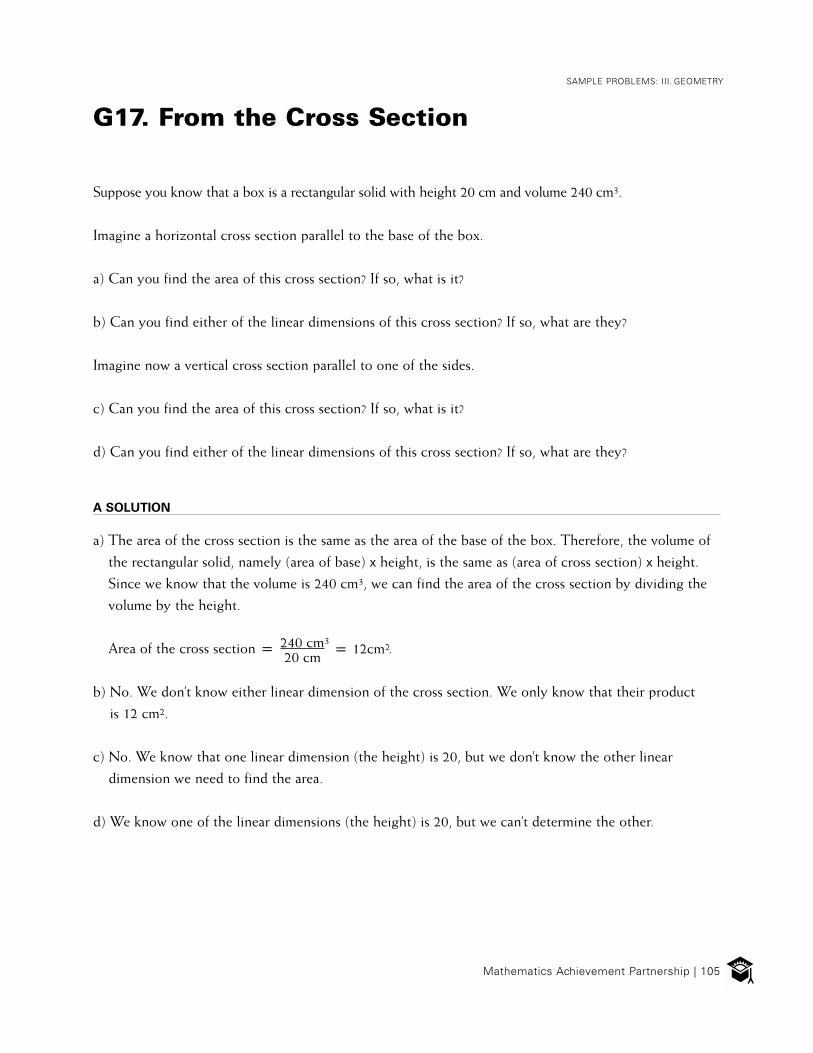
Mathematics Achievement Partnership | 105
SAMPLE PROBLEMS: III. GEOMETRY
G17. From the Cross Section
Suppose you know that a box is a rectangular solid with height 20 cm and volume 240 cm3.
Imagine a horizontal cross section parallel to the base of the box.
a) Can you find the area of this cross section? If so, what is it?
b) Can you find either of the linear dimensions of this cross section? If so, what are they?
Imagine now a vertical cross section parallel to one of the sides.
c) Can you find the area of this cross section? If so, what is it?
d) Can you find either of the linear dimensions of this cross section? If so, what are they?
A SOLUTION
a) The area of the cross section is the same as the area of the base of the box. Therefore, the volume of
the rectangular solid, namely (area of base) x height, is the same as (area of cross section) x height.
Since we know that the volume is 240 cm3, we can find the area of the cross section by dividing the
volume by the height.
Area of the cross section p .
b) No. We don’t know either linear dimension of the cross section. We only know that their product
is 12 cm2.
c) No. We know that one linear dimension (the height) is 20, but we don’t know the other linear
dimension we need to find the area.
d) We know one of the linear dimensions (the height) is 20, but we can’t determine the other.
240 cm3p 12cm2
20 cm

106 | Achieve, Inc.
FOUNDATIONS FOR SUCCESS: CONSULTATION DRAFT
G18. Similar Polygons
ABCD and PQRS are similar polygons whose perimeters are 40 inches and 30 inches, respectively.
The area enclosed by ABCD is 8 square inches.
a) What area is enclosed by PQRS?
b) Is it possible for the straight-line distance from point A to point C to be 20 inches?
A SOLUTION
a) The perimeter of PQRS is 30, and the perimeter of ABCD is 40. Therefore the ratio of the linear
dimensions of the polygons is . So the ratio of the areas of the polygons will be given by the square
of the ratio of the linear dimensions, that is, @ #2p . So:
b) No. If the distance from A to C were 20, then by the triangle inequality, AD c DC 1 20 and
AB c BC 1 20, which would make the perimeter greater than 40.
B
Q
R
C
DA P
S
34
34 9
16
APQRS p 9 AABCD p 9 x 8 p 9 p 4.5 in2.16 16 2

Mathematics Achievement Partnership | 107
SAMPLE PROBLEMS: III. GEOMETRY
G19. Circle Transformations
The circle above will be dilated by a factor of 0.3, with the center of dilation being the point O shown.
a) Use a ruler to plot several points on the new image, and then sketch the new image.
b) Will the new image be a circle?
A SOLUTION
a) To form a 0.3 dilation of any figure, use a ruler to connect the center of dilation O with different
points on the figure, say P’, Q’, R’, S’, T’, etc. The point P’ that is 30% of the way from O to P along
the straight line that connects O with P is a point on the dilated figure. By finding several such
points, it is possible to sketch the dilated figure.
O C
OP
Q
R
S
T
C
Q’
T’S’
R’
P’
30%
70%
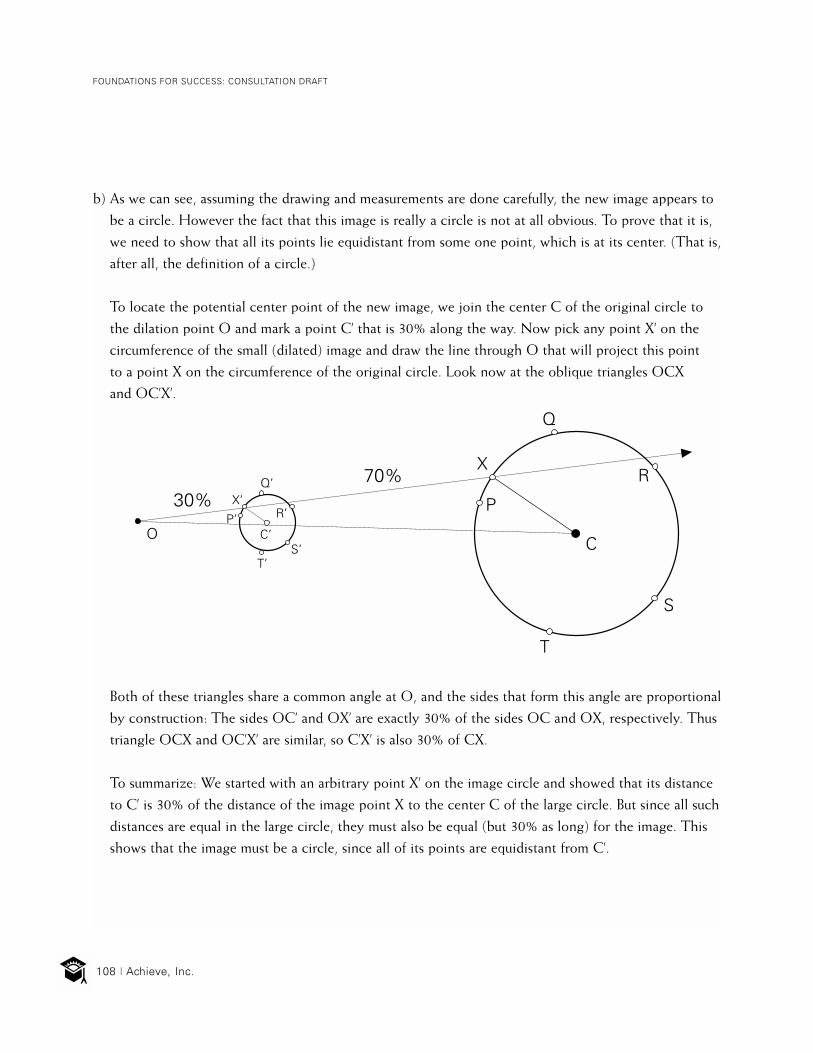
108 | Achieve, Inc.
FOUNDATIONS FOR SUCCESS: CONSULTATION DRAFT
b) As we can see, assuming the drawing and measurements are done carefully, the new image appears to
be a circle. However the fact that this image is really a circle is not at all obvious. To prove that it is,
we need to show that all its points lie equidistant from some one point, which is at its center. (That is,
after all, the definition of a circle.)
To locate the potential center point of the new image, we join the center C of the original circle to
the dilation point O and mark a point C’ that is 30% along the way. Now pick any point X’ on the
circumference of the small (dilated) image and draw the line through O that will project this point
to a point X on the circumference of the original circle. Look now at the oblique triangles OCX
and OC’X’.
Both of these triangles share a common angle at O, and the sides that form this angle are proportional
by construction: The sides OC’ and OX’ are exactly 30% of the sides OC and OX, respectively. Thus
triangle OCX and OC’X’ are similar, so C’X’ is also 30% of CX.
To summarize: We started with an arbitrary point X’ on the image circle and showed that its distance
to C’ is 30% of the distance of the image point X to the center C of the large circle. But since all such
distances are equal in the large circle, they must also be equal (but 30% as long) for the image. This
shows that the image must be a circle, since all of its points are equidistant from C’.
30%70%
O
P
X
Q
R
S
T
C
Q’
T’
C’S’
R’P’
X’

Mathematics Achievement Partnership | 109
SAMPLE PROBLEMS: III. GEOMETRY
G20. Two Tetrahedra
The two tetrahedra shown above are similar. The edges of the larger tetrahedron are each three times
as long as the corresponding edges of the smaller tetrahedron.
The surface area of the smaller tetrahedron is 48 in2.
The volume of the smaller tetrahedron is 16 in3.
a) What is the surface area of the larger tetrahedron?
b) What is the volume of the larger tetrahedron?
A SOLUTION
a) The edges of the larger tetrahedron are each three times as long as the edges of the smaller tetra-
hedron. The ratio of the linear dimensions is 1 : 3. So the ratio of the area is 1 : 9. Hence the surface
of the larger tetrahedron is 48 X 9 p 432 in2.
b) The ratio of the volumes of these two similar figures will be the cube of the ratio of their linear
dimensions. That is, the ratio of the volumes is 1 : 27. So the volume of the larger tetrahedron is
16 X 27 p 432 in3. (That the numbers are the same is a coincidence that depends on the units.)

110 | Achieve, Inc.
FOUNDATIONS FOR SUCCESS: CONSULTATION DRAFT
G21. Length of Rope
Three cylinders of the same radius r are tied together snugly by a rope. The diagram above shows a
cross-sectional view.
What is the length of the rope around the cylinders?
A SOLUTION
The details of this solution are shown in the diagram below. The diagram shows that the rope is made
up of a section that fits snugly around some portion of each circle and three line segments that do not
actually touch the circles (except at points of tangency). The problem here is to find the length of each
line segment and the portion in each circle that is snugly surrounded by the rope.
60º
120ºr
r r
rrr r
r
90º 90º2r2r
2r
2 r/3

Mathematics Achievement Partnership | 111
SAMPLE PROBLEMS: III. GEOMETRY
From the diagram, we can see that each line segment begins and ends at a point of tangency. At each
of these points of tangency, the line segment and the radius of the circle are perpendicular.
If we join the centers of each pair of circles with a straight line, we can see from the diagram that we
have created three rectangles of length 2r and width r. The length of each rectangle gives the length
of each line segment of rope as 2r.
Joining the centers of the circles creates an equilateral triangle with each side equal to 2r. The part
of each circle snugly surrounded by rope can be measured by computing the central angle subtended
by this part of the circle. Looking at the diagram, we see that this central angle is 120° because it is
360° minus two right angles (coming from two rectangles) and an angle of the equilateral triangle.
In other words, 360° i @2 x 90°# i 60° p 120°. Thus the part of each circle snugly surrounded by
rope is of the circumference. Since there are three such pieces, the total length of these
pieces is the same as the circumference of the circle. So the length of the rope consists of the
circumference of one circle of radius r plus three lengths each 2r units long, that is, L p 2 r c 6r.
120° p 1360° 3

112 | Achieve, Inc.
FOUNDATIONS FOR SUCCESS: CONSULTATION DRAFT
G22. Right Triangle
60º30ºA D
C
B
Triangle ABC is a right triangle with ACB the right angle and A and B measuring 30º and 60º,
respectively. CD is perpendicular to AB.
a) If AB has length 4 inches, find the lengths of AC and BC.
b) Find the measurements of ACD and DCB.
c) List all pairs of similar triangles in the picture.
d) Find the lengths of CD, AD and DB.
A SOLUTION
a) In a 30-60-90 triangle, the short leg is half the length of the hypotenuse, and the long leg is M3 times
the short leg. (The sides are in the ratio 1 : 2: M3.) So:
BC p 1 AB p 2 inches, and2
AC p M3 BC p 2 M3 inches.

Mathematics Achievement Partnership | 113
SAMPLE PROBLEMS: III. GEOMETRY
b) Let’s look at ADC and CBD. We’re given one acute angle in each triangle. In addition, we know
that the angles at point D, namely ADC and CDB, are both right angles. So, since the sum of
the interior angles in a triangle is 180°,
ADC c 90° c 30° p 180°
ADC p 60°
BCD c 90° c 60° p 180°
BCD p 30°.
c) Because the corresponding angles are equal, the three triangles in the figure are all similar:
ACD f CBD f ABC.
d) Since the triangles are similar, the corresponding sides are proportional and in the same proportions
as the original large triangle.
So DB (the length of DB, the short leg of the small triangle) is half of CB (which was 2). So DB p1.
Therefore, AD p 3 (since AB p 4).
Finally, CD is M3 times DB (which is 1). So CD p M3. Or we could observe that CD is half of AC
to obtain the same result.
Mathematics Achievement Partnership | 115
SAMPLE PROBLEMS: IV. ALGEBRA
Sample Problems: IV. AlegbraContents
A1: Shaded Triangle. . . . . . . . . . . . . . . . . . . . . . . . . . . . . . . . . . . . . . . . . . . 117
A2: Adding Odds. . . . . . . . . . . . . . . . . . . . . . . . . . . . . . . . . . . . . . . . . . . . . 119
A3: Negative or Positive? . . . . . . . . . . . . . . . . . . . . . . . . . . . . . . . . . . . . . . . 120
A4: Rectangular Prism . . . . . . . . . . . . . . . . . . . . . . . . . . . . . . . . . . . . . . . . . 121
A5: Perimeter and Area . . . . . . . . . . . . . . . . . . . . . . . . . . . . . . . . . . . . . . . . 122
A6: The Difference of Two Squares . . . . . . . . . . . . . . . . . . . . . . . . . . . . . . . 123
A7: Perimeter and Area Redux . . . . . . . . . . . . . . . . . . . . . . . . . . . . . . . . . . . 125
A8: Fred and Jane. . . . . . . . . . . . . . . . . . . . . . . . . . . . . . . . . . . . . . . . . . . . . 127
A9: Tree Circumference . . . . . . . . . . . . . . . . . . . . . . . . . . . . . . . . . . . . . . . . 128
A10: Pamphlets in the Mail . . . . . . . . . . . . . . . . . . . . . . . . . . . . . . . . . . . . . 129
A11: Paper Cups . . . . . . . . . . . . . . . . . . . . . . . . . . . . . . . . . . . . . . . . . . . . . 130
A12: More Paper Cups. . . . . . . . . . . . . . . . . . . . . . . . . . . . . . . . . . . . . . . . . 132
A13: Fruit Punch . . . . . . . . . . . . . . . . . . . . . . . . . . . . . . . . . . . . . . . . . . . . . 134
A14: The Hot Tub . . . . . . . . . . . . . . . . . . . . . . . . . . . . . . . . . . . . . . . . . . . . 135
A15: Length and Width . . . . . . . . . . . . . . . . . . . . . . . . . . . . . . . . . . . . . . . . 136
A16: The Cylinder Company. . . . . . . . . . . . . . . . . . . . . . . . . . . . . . . . . . . . 137
A17: From the Graph of a Function to the Solution of an Equation . . . . . . . 139
A18: Understanding Quadratics by Completing the Square . . . . . . . . . . . . . 141
A19: Completing the Square to Solve a Quadratic Equation. . . . . . . . . . . . . 143
A20: Solving Equations . . . . . . . . . . . . . . . . . . . . . . . . . . . . . . . . . . . . . . . . 145
A21: Calling Plans . . . . . . . . . . . . . . . . . . . . . . . . . . . . . . . . . . . . . . . . . . . . 149
A22: Consecutive Integers . . . . . . . . . . . . . . . . . . . . . . . . . . . . . . . . . . . . . . 150
A23: Two Cylinders . . . . . . . . . . . . . . . . . . . . . . . . . . . . . . . . . . . . . . . . . . . 151
A24: Pencils and Erasers. . . . . . . . . . . . . . . . . . . . . . . . . . . . . . . . . . . . . . . . 152
A25: No Solution. . . . . . . . . . . . . . . . . . . . . . . . . . . . . . . . . . . . . . . . . . . . . 153
A26: Test Scores. . . . . . . . . . . . . . . . . . . . . . . . . . . . . . . . . . . . . . . . . . . . . . 154
A27: The Road Trip . . . . . . . . . . . . . . . . . . . . . . . . . . . . . . . . . . . . . . . . . . . 156
A28: Number Triangle . . . . . . . . . . . . . . . . . . . . . . . . . . . . . . . . . . . . . . . . . 157

116 | Achieve, Inc.
FOUNDATIONS FOR SUCCESS: CONSULTATION DRAFT
Summary of expectations:
A. Symbols and operations:
• Understand how letters are used to represent numbers
• Know the conventions for writing algebraic expressions
• Generate and use algebraic expressions and equations to solve problems
B. Functions:
• Recognize, represent, interpret and use linear functions in a variety of contexts
• Recognize and represent simple common nonlinear functions
• Translate among different representations of functions, including numeric, verbal, tabular, graphic
and algebraic
• Transform and graph quadratic functions by factoring and completing the square
• Understand the relation of quadratic functions to their graphs by expressing the functions in
various forms
C. Equations:
• Generate, solve and use single and simultaneous linear equations in one and two variables
• Use graphs to estimate or check solutions to single and simultaneous linear equations in one and
two variables
• Recognize that the solutions of a quadratic equation are the zeros, if any, of the corresponding
quadratic function

Mathematics Achievement Partnership | 117
SAMPLE PROBLEMS: IV. ALGEBRA
Write an expression for the area of the shaded triangle.
A SOLUTION
Decompose the rectangle into the shaded triangle plus three right triangles:
Top left-hand triangle, area T1:
p 2ab i 2b2
p 2b@a i b#cm2.
A1. Shaded Triangle
2b cm
2b c
m
b cm
2a cm
2b c
m
Area T1 p 1 x 2b@2a i 2b#2
(2ai2b)

118 | Achieve, Inc.
FOUNDATIONS FOR SUCCESS: CONSULTATION DRAFT
Top right-hand triangle, area T2:
.
Bottom right-hand triangle, area T3:
.
The area of the rectangle is Arectangle p 2a x 2b p 4ab cm2
So the shaded triangle’s area can be found as follows:
Tshaded p Arectangle i @T1 c T2 c T3#
p 4ab i @2b@a i b# c b2 c ab#
p 4ab i @2ab i 2b2 c b2 c ab#
p 4ab i @3ab i b2#
p ab c b2
Thus, the area of the shaded triangle is ab c b2 cm2
2b cm
bcm
b cm
2a cm
Area T2 p 1 x b x 2b p b2 cm22
Area T3 p 1 x b x 2a p ab cm22
.
.
.

Mathematics Achievement Partnership | 119
SAMPLE PROBLEMS: IV. ALGEBRA
Show that the sum of two odd numbers is always an even number.
A SOLUTION
Let the two given odd numbers be represented by 2k c 1 and 2m c 1, where k and m are integers.
Then their sum is @2k c 1# c @2m c 1# p 2@k c m c 1#, which is even because it is twice an integer.
ANOTHER SOLUTION
Every odd number is one more than an even number (e.g., 9 p 2@4# c 1), that is, one more than a
bunch of pairs. So if two odd numbers are added, the two extra 1s make up an extra pair. Thus, the sum
of the two odd numbers is just a larger bunch of pairs; thus, it is even.
A2. Adding Odds

120 | Achieve, Inc.
FOUNDATIONS FOR SUCCESS: CONSULTATION DRAFT
A3. Negative or Positive?
a) If a number A satisfies i5A ! 0, is A positive, negative or 0?
b) If a number B satisfies 2B ! 0, is B positive, negative or 0?
A SOLUTION
a) Suppose that A were negative. Then @i5# x @A# will be positive. But since i5A ! 0, A cannot be
negative. Suppose now that A is equal to zero. Then i5 x A p 0. Since i5A ! 0 , A is not zero. So A
is neither negative nor 0, and therefore A must be positive.
b) Suppose that B were positive. Then 2B 1 0. But 2B ! 0, so B is not positive. Suppose that B is equal to
zero. Then 2B p 0. But 2B ! 0, so B is not equal to zero. Therefore B is negative.

Mathematics Achievement Partnership | 121
SAMPLE PROBLEMS: IV. ALGEBRA
A4. Rectangular Prism
3b c
m
2a cm
5a cm
Write an expression for the surface area of a right rectangular prism that has dimensions 5a, 2a and
3b centimeters.
A SOLUTION
One way to think of surface area of this rectangular prism is to sketch a net to represent it in two
dimensions.
The net shows that the surface area can be decomposed into the area of three pairs of congruent
rectangles labeled as R1, R2, R3.
The area of rectangle R1: 2a x 3b p 6ab cm2.
The area of rectangle R2: 2a x 5a p 10a2 cm2.
The area of rectangle R3: 3b x 5a p 15ab cm2.
The total surface area is, therefore:
A p 2R1 c 2R2 c 2R3
p 2 x 6ab c 2 x 10a2 c 2 x 15ab
p 12ab c 20a2 c 30ab
p 20a2 c 42ab.
The total surface area of the rectangular prism is 20a2 c 42ab cm2.
R1 R1 R12a
3b
2a
3b
R22a
5aR3
R3
R2
R2
R3
3b
5a
5a

122 | Achieve, Inc.
FOUNDATIONS FOR SUCCESS: CONSULTATION DRAFT
A5. Perimeter and Area
Write expressions for the area and perimeter of the figure above in terms of the given lengths
p, q, r and s as indicated.
A SOLUTION
The perimeter of the quadrilateral is the sum of the lengths of the sides:
Pquadrilateral p p c q c r c s units.
To find the area of the quadrilateral, decompose it into two right triangles T1 and T2.
Thus, the area of the quadrilateral is given by square units.
p
s
q
r
pT1
T2
s
q
r
Area T1 p 1 x p x s p 1 ps2 2
Area T2 p 1 x r x q p 1 qr2 2
1 @qr c ps#2

Mathematics Achievement Partnership | 123
SAMPLE PROBLEMS: IV. ALGEBRA
A6. The Difference of Two Squares
5
5
Area: 52
5c3
5 i 3Area: 52 i 32
The drawings above show how 52 i 32 can be rewritten as (5 i 3) (5 c 3).
a) Create a drawing to show that A2 i B2 p @A c B#@A i B# for any positive numbers A and B, where A 1 B.
b) Use the result of part (a) to rewrite and evaluate @ #2i @ #2
.
c) Is the formula A2 i B2 p @A c B#@A i B# true when A ! B?
d) Use the result of part (a) to determine which is bigger, 299 x 301 or 300 x 300.
e) Use the result of part (a) to factor 396 into two whole numbers that are close to each other.
A SOLUTION
a)
A A BB
AB B
A
@Ac
B#
5
5
2
35
2 3
2
72
12
B
B
@Ai B#@Ai B#
@Ai B#@Ai B#
@Ai B#

124 | Achieve, Inc.
FOUNDATIONS FOR SUCCESS: CONSULTATION DRAFT
b) We apply the formula we derived in part (a).
@ #2i @ #2
p @ #@ #
p 4 x 3
p 12.
c) The formula is true for any A and B, because @A c B#@A i B# p A2 i AB c AB i B2 p A2 i AB.
In particular, it is true for A ! B, since nothing in this calculation depends on the sign of A or B,
or on any relationship between A and B. As an example, let A p 3 and B p 5. Then 32 i 52 p
@3 c 5#@3 i 5# because both sides equal i16.
d) Seeing that we can write the two numbers 299 and 301 as @300 i 1# and @300 c 1# respectively,
we can use the strategies of parts (a), (b) and (c) to write:
299 x 301 p @300 i 1#@300 c 1#
p 3002 i 12
p 89,999.
Hence, 299 x 301 is one less than 300 x 300.
e) Here we first notice that we can write the number 396 as the difference of two squares, namely,
400 i 4. Thus,
396 p 400 i 4 p 202 i 22 p @20 c2#@20 i2# p 22 x 18.
7 c12 2
12
72
7 i 12 2

Mathematics Achievement Partnership | 125
SAMPLE PROBLEMS: IV. ALGEBRA
A7. Perimeter and Area Redux
Write expressions for the area and perimeter of the figure above in terms of the given length t as
indicated. It consists of four semicircles of equal radius surrounding a square.
A SOLUTION
The perimeter of this shape is made up of four congruent semicircles. To write an expression for the
perimeter of this shape we need to express the radius of each semicircle in terms of t.
From this diagram we can see that the height of the figure t is equal to 4 times the radius of one of the
semicircles. So t p 4r, or .
The circumference of any circle is C p 2 r. This perimeter consists of four semicircles, equivalent to two
circles. Therefore, the distance around this figure is equal to 2 x 2 r or 4 r.
Since , the perimeter is units.
t
t
r
r
r
r r
r p t4
r p t 4
4 p tt 4

126 | Achieve, Inc.
FOUNDATIONS FOR SUCCESS: CONSULTATION DRAFT
The area of this shape is made up of the area enclosed by four semicircles each with radius and the
area of the square that they surround. From the diagram, we can see that the side of the square is .
Therefore, the area of this square is 2.
The area enclosed by the four semicircles is equal to the area of one circle enclosed by two
circles. The area of one circle is r2, so the area of the two circles is 2 r2 where , giving 2p p
2.
Thus, the total area of this shape is A p2 c
2p p t2 square units.
t 4 t
2 t 4
r p t 4
t 4
t8
2t c t 8
2 c28
22 ( t )4
2t16
t8

Mathematics Achievement Partnership | 127
SAMPLE PROBLEMS: IV. ALGEBRA
A8. Fred and Jane
Fred is 3 years older than Jane is.
a) Sketch a graph showing Fred’s age as a function of Jane’s age for the first 40 years of Jane’s life.
What is the slope of this graph?
b) Mark the point on the graph that corresponds to when Jane was born.
c) Mark the point on the graph when Fred is twice as old as Jane is.
d) If Fred was twice as old as Jane 10 years ago, how old is each of them now?
A SOLUTION
a) Fred is 3 years older than Jane, so if Jane’s age is x, then Fred’s age is x c 3. The slope of the graph is 1.
b) The vertical intercept @0, 3# represents the point on the graph when Jane was born.
c) The point on the graph when Fred is twice as old as Jane is @3, 6#.
d) Ten years ago their ages were @3, 6# so now they are @3 c 10, 6 c 10#. Thus, Jane is 13 and Fred is 16.
45
40
35
30
25
20
15
10
5
5 10 15 20 25 30 35 40 45
Fre
d’s
Ag
e
Jane’s Age

128 | Achieve, Inc.
FOUNDATIONS FOR SUCCESS: CONSULTATION DRAFT
A9. Tree Circumference
For a certain type of tree, the circumference of the trunk (in centimeters) can be estimated from the age y
of the tree (in years) by the formula C = 2.5y. Assume that the cross section of the tree trunk is a circle.
a) Estimate the age of a tree that has a circumference of 100 centimeters.
b) Find the radius of the trunk of a 20-year-old tree.
A SOLUTION
a) To estimate the age of a tree that has a circumference of 100 centimeters, we need to solve C p 2.5y
where C p100.
100 p 2.5y
y p 40 years.
Therefore, a tree with a circumference of 100 centimeters is about 40 years old.
b) To find the radius, we first need to find the circumference. To do so we evaluate C p 2.5y where y p 20:
C [email protected]#@20#
C p 50 cm.
The circumference of a tree is given by 2 r, where r is the radius. To find the radius when we know
the circumference, we solve the equation for r:
50 p 2 r
25 p r.
Therefore, the radius is , which is about 8 centimeters.
y p 1002.5
25
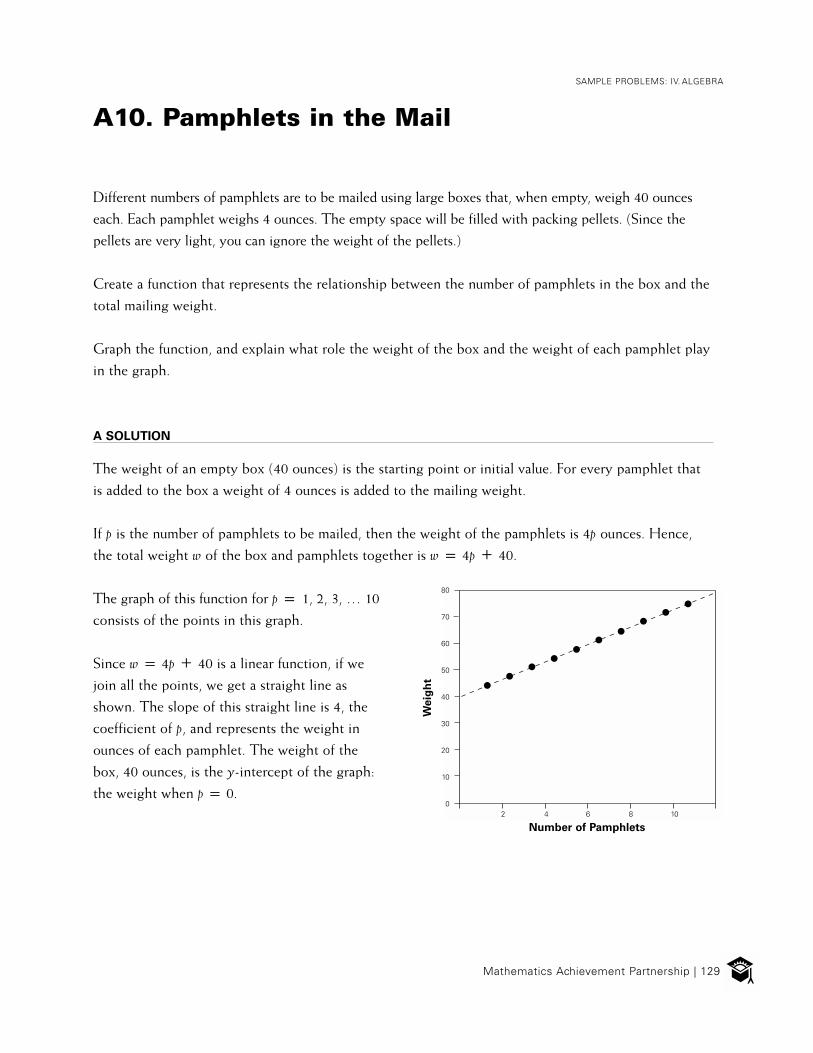
Mathematics Achievement Partnership | 129
SAMPLE PROBLEMS: IV. ALGEBRA
A10. Pamphlets in the Mail
Different numbers of pamphlets are to be mailed using large boxes that, when empty, weigh 40 ounces
each. Each pamphlet weighs 4 ounces. The empty space will be filled with packing pellets. (Since the
pellets are very light, you can ignore the weight of the pellets.)
Create a function that represents the relationship between the number of pamphlets in the box and the
total mailing weight.
Graph the function, and explain what role the weight of the box and the weight of each pamphlet play
in the graph.
A SOLUTION
The weight of an empty box (40 ounces) is the starting point or initial value. For every pamphlet that
is added to the box a weight of 4 ounces is added to the mailing weight.
If p is the number of pamphlets to be mailed, then the weight of the pamphlets is 4p ounces. Hence,
the total weight w of the box and pamphlets together is w p 4p c 40.
The graph of this function for p p 1, 2, 3, … 10
consists of the points in this graph.
Since w p 4p c 40 is a linear function, if we
join all the points, we get a straight line as
shown. The slope of this straight line is 4, the
coefficient of p, and represents the weight in
ounces of each pamphlet. The weight of the
box, 40 ounces, is the y-intercept of the graph:
the weight when p p 0.
80
70
60
50
40
30
20
10
02 4 6 8 10
Weig
ht
Number of Pamphlets

130 | Achieve, Inc.
FOUNDATIONS FOR SUCCESS: CONSULTATION DRAFT
A11. Paper Cups
The paper cups shown here are identical.
a) By making appropriate measurements, represent the relationship between the number of cups and the
height of the stack using a formula and a graph.
b) The graph, which could be a bar graph, can also be drawn as a set of discrete points on a coordinate
system. These points can be connected by a straight line. Why is the line straight?
c) What are the slope and intercept of this line? Interpret the meaning of the slope and intercept with
regard to the number and size of the cups, or parts of the cups.
A SOLUTION
a) The measurements in this problem will depend on the size of the paper cup.
Suppose that the height of the lip of each cup, found by direct measurement, is 7 millimeters, and the
base of each cup is 53 millimeters. Therefore, we can think of the height of a stack as consisting of
one base (53 millimeters) plus 7 millimeters for each cup lip in the stack.
Base of cup
Lip of cup
Height of stack
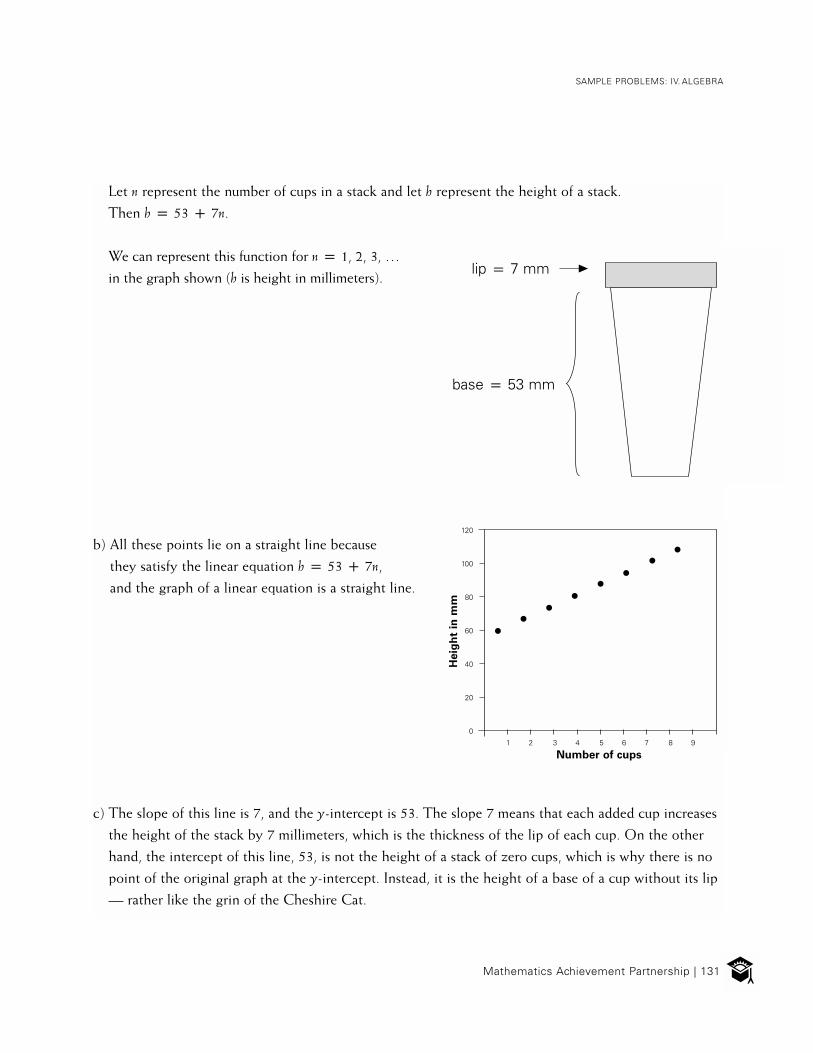
Mathematics Achievement Partnership | 131
SAMPLE PROBLEMS: IV. ALGEBRA
Let n represent the number of cups in a stack and let h represent the height of a stack.
Then h p 53 c 7n.
We can represent this function for n p 1, 2, 3, …
in the graph shown (h is height in millimeters).
b) All these points lie on a straight line because
they satisfy the linear equation h p 53 c 7n,
and the graph of a linear equation is a straight line.
c) The slope of this line is 7, and the y-intercept is 53. The slope 7 means that each added cup increases
the height of the stack by 7 millimeters, which is the thickness of the lip of each cup. On the other
hand, the intercept of this line, 53, is not the height of a stack of zero cups, which is why there is no
point of the original graph at the y-intercept. Instead, it is the height of a base of a cup without its lip
— rather like the grin of the Cheshire Cat.
120
100
80
60
40
20
0
1 2 3 4 5 6 7 8 9
Heig
ht
in m
m
Number of cups
lip p 7 mm
base p 53 mm
132 | Achieve, Inc.
FOUNDATIONS FOR SUCCESS: CONSULTATION DRAFT
A12. More Paper Cups
Suppose there is another set of paper cups that stack like those in the preceding problem. The only
difference is that these cups are bigger. You are told that the height of one cup (including the lip) is
15 millimeters, and the height of five stacked cups is 28 millimeters.
Find a formula that represents the functional relationship between the height of the stack and the
number of cups.
A SOLUTION
Let’s retrace the reasoning of the preceding problem, using variables. Let’s say the height of the lip is k
millimeters and the height of the base is b millimeters. Then, for a total number of n cups, the height of
the stack is h p kn c b.
If the height of an entire cup is 15 millimeters, then k c b p 15, so b p 15 i k. Thus,
h p kn c b
p kn c @15 i k#
p k @n i 1# c 15.
We are given that with five cups the total height is 28 millimeters. That is, when n p 5, h p 28. So,
28 p k@5 i 1# c 15
28 p 4kc 15
13 p 4k
k p 13 p 3.25 mm.4

Mathematics Achievement Partnership | 133
SAMPLE PROBLEMS: IV. ALGEBRA
So if k p 3.25 and b p 15 i k, b p 11.75. Therefore, h p 3.25n c 11.75. This yields what we were
asked to find: a functional relationship between the height of the stack and the number of cups.
Alternate strategy: We know the values of h for n p 1 and n p 5. Substitute these two sets of values
into the formula h p kn c b to get two equations, and then subtract.
28 p 5k c b
.
Now proceed as before, solving for k and using that to find b.
i 15 p k c b13 p 4k

134 | Achieve, Inc.
FOUNDATIONS FOR SUCCESS: CONSULTATION DRAFT
A13. Fruit Punch
John was making fruit punch for a party using crystals that you mix with water. He mixed four scoops
of crystals with nine cups of water and it tasted just right. His sister, Sarah, who likes sweet drinks,
walked by and dumped another scoop of crystals into the pitcher.
How much water does John need to add so that the fruit punch will taste exactly the same as it did before?
A SOLUTION
Let’s find out how much water John’s recipe needs per scoop. Let w be the number of cups of water and
s be the number of scoops of crystal. For the drink to taste right, we know from John’s original mixture
that .
But after Sarah adds the additional scoop of powder, s p 4 c 1 p 5. In this situation, .
So we solve for w:
This means he needs 11.25 cups of water total to make the punch taste just right. Since John originally
used nine cups of water, he will need to add 11.25 i 9 p 2.25 additional cups of water to restore the
original flavor.
w p 9s 4
w p 95 4
w p 5 x 9 p 45 p 11.25.4 4

Mathematics Achievement Partnership | 135
SAMPLE PROBLEMS: IV. ALGEBRA
A14. The Hot Tub
Amy wants to fill up her hot tub for a party. She has one hose that will fill the hot tub in three hours,
and she has another hose that will fill it in five hours.
If she turns on both hoses, and if the rate of water flow in each hose remains constant, how long will it
take her to fill the hot tub?
A SOLUTION
Let x represent the volume of water coming out of the first hose in one hour and let y represent the
volume of water coming out of the second hose in one hour. Then the total volume of water coming
out of the first hose in t hours will be tx, and the total volume coming out of the second hose in
t hours will be ty.
If v represents the volume of the hot tub, we know from the given information that 3x p v, and
5y p v. We need to find the number of hours t it takes to fill the tub with both hoses running at once.
In this situation, tx c ty p v.
Since and , this means that or t@ #p 1.
This yields t p p 1.875 hours p 112.5 minutes.
ANOTHER SOLUTION
We know that after one hour the first hose will have provided of the water that is needed. Also after
one hour, the second hose will have provided of the water that is needed. With both hoses going
together, after one hour the tub will hold of the required water. So with both hoses going
together:
is filled in 60 minutes.
is filled in minutes.
will be filled in minutes p 112.5 minutes, as before.
x p v3 y p v
5 tv c tv p v3 5
1 c 13 5
158
13
8 15
1 15
608
1515 15 x 60
8
15
1 c 1 p 83 5 15

136 | Achieve, Inc.
FOUNDATIONS FOR SUCCESS: CONSULTATION DRAFT
A15. Length and Width
ycm
x cm
12 cm2
Let x cm be the width and y cm be the possible lengths of a rectangle with area 12 cm2.
a) Express y as a function of x.
b) Use a graph to represent the relationship between x and y.
A SOLUTION
a) For any rectangle with width x and length y, the area A will be given by: A p xy cm2.
Here A p 12, so 12 p xy cm2. With y as a function of x, we have .
b)
12 p yx
12
10
8
6
4
2
0
20 4 6 8 10 12
Len
gth
(y)
Width (x)
LENGTH VS. WIDTH
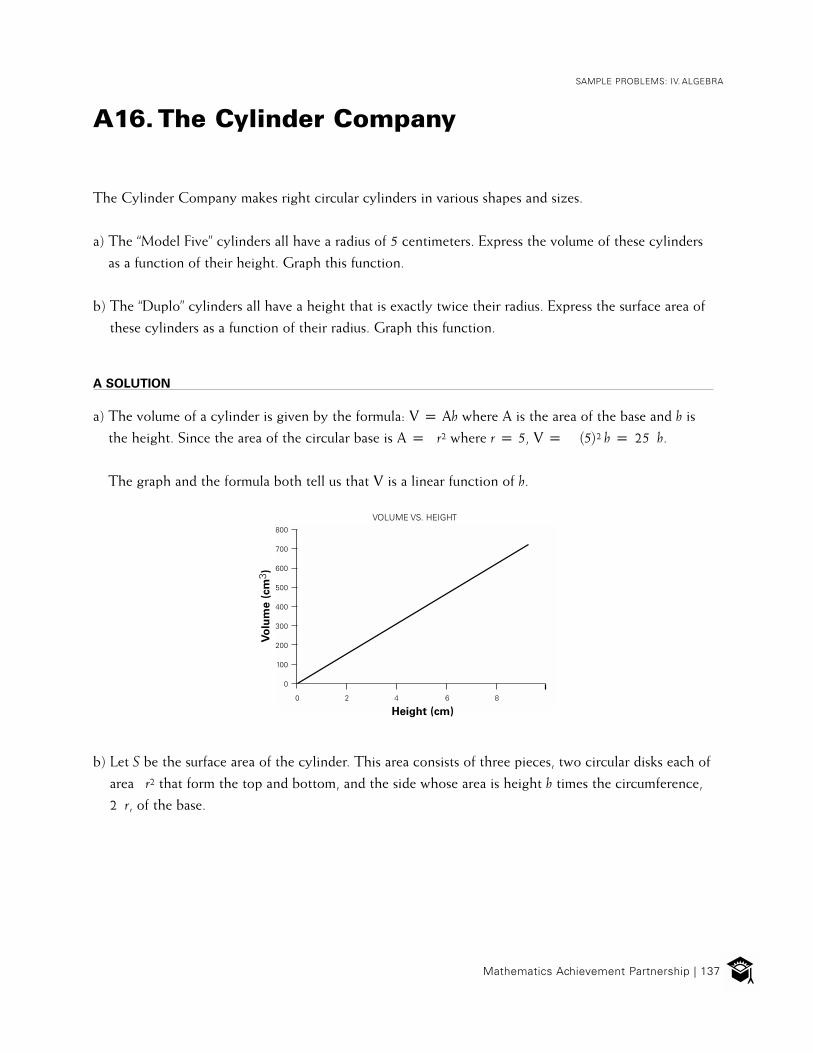
Mathematics Achievement Partnership | 137
SAMPLE PROBLEMS: IV. ALGEBRA
A16. The Cylinder Company
The Cylinder Company makes right circular cylinders in various shapes and sizes.
a) The “Model Five” cylinders all have a radius of 5 centimeters. Express the volume of these cylinders
as a function of their height. Graph this function.
b) The “Duplo” cylinders all have a height that is exactly twice their radius. Express the surface area of
these cylinders as a function of their radius. Graph this function.
A SOLUTION
a) The volume of a cylinder is given by the formula: V p Ah where A is the area of the base and h is
the height. Since the area of the circular base is A p r2 where r p 5, V p @5#2 h p 25 h.
The graph and the formula both tell us that V is a linear function of h.
b) Let S be the surface area of the cylinder. This area consists of three pieces, two circular disks each of
area r2 that form the top and bottom, and the side whose area is height h times the circumference,
2 r, of the base.
800
700
600
500
400
300
200
100
0
20 4 6 8
Vo
lum
e (
cm
3 )
Height (cm)
VOLUME VS. HEIGHT

138 | Achieve, Inc.
FOUNDATIONS FOR SUCCESS: CONSULTATION DRAFT
Thus,
S p 2 r2 c 2 rh
p 2 r2 c 2 r@2r# (since h p 2r)
p 2 r2 c 4 r2
p 6 r2.
As the formula and the graph show, S is a quadratic function of r.
1800
1600
1400
1200
1000
800
600
400
200
0
20 4 6 8
Su
rface A
rea
Radius
SURFACE AREA VS. RADIUS

Mathematics Achievement Partnership | 139
SAMPLE PROBLEMS: IV. ALGEBRA
A17. From the Graph of a Function to the Solution of an Equation
Sketch the graph of the function @2x c 3#@x i 1#. That is, sketch the graph of the equation
y p @2x c 3#@x i 1#.
A SOLUTION
The function @2x c 3#@x i 1#, or 2x2 c x i 3, is a quadratic, so its graph will be a parabola. Because
the coefficient of x2 is a positive, the graph will be concave up. To sketch a parabola we need to know:
• The intercepts on the x-axis (if any), or, equivalently, the zeros of the function.
• The coordinates of the vertex of the parabola.
Finding the x-intercepts: The graph of y p @2x c 3#@x i 1# will intercept the x-axis at the values of x
such that @2x c 3#@x i 1# p 0. If the product of two numbers is zero, then at least one of them must be
zero. So 2x c 3 p 0 or x i 1 p 0, so x p i1.5 or 1. Therefore, the graph passes through the points
(i1.5, 0) and (1, 0), which are the x-intercepts.
Finding the coordinates of the vertex of the parabola: Since a parabola has a vertical axis of symmetry,
the x-coordinate of the vertex will be halfway between the intercepts, x p i1.5 and x p 1. The dis-
tance between i1.5 and 1 is 2.5. Half of this distance is 1.25, so the point midway between the two
x-intercepts is 1 i 1.25 p i 0.25.
Therefore the line is the axis of symmetry.
To find the y-coordinate of the vertex, we evaluate y p @2x c 3#@x i 1# at .
y p @2@ #c 3#@@ #i 1#
p @ #
Thus, the coordinates of the vertex are @ , #.
x p i 14
x p i 14
i 14 i 1
4
104 i 5
4
p i 50 p i 25 p i 3 1 .16 8 8
i 14 i 3 1
8

140 | Achieve, Inc.
FOUNDATIONS FOR SUCCESS: CONSULTATION DRAFT
The sketch that we are looking for is shown below.
1
-1
-1-2 21
-2
-3
yp(2xc3)(xP1)

Mathematics Achievement Partnership | 141
SAMPLE PROBLEMS: IV. ALGEBRA
A18. Understanding Quadratics by Completing the Square
a) Show that can be rewritten as . .
b) Sketch the graph of g @x# p @x i 1#2.
c) On the same diagram, sketch the graph of .
d) What are the solutions of ?
A SOLUTION
a) can be rewritten as follows:
b) The graph of g@x# p @x i 1#2 is a parabola that intercepts the x-axis at (and only at) x p 1. Hence,
the vertex of the graph of @x i 1#2 is at (1, 0). To place the parabola on the graph, note that since
g(0) p 1 and g(2) p 1, the points (0, 1) and (2, 1) lie on the graph:
3
2
1
-1
-1
1 2 3
f@x# p x2 i 2x c 34 f@x# p @x i 1#
2i @1#
2
2
f@x# p x2 i 2x c 34
f@x# p @x2 i 2x c 1# i 1 c 34
p @x i 1#2i 14
p @x i 1#2i @1#
2.2
f@x# p @x i 1#2i @1#
2
2
x2 i 2x c 3 p 04

142 | Achieve, Inc.
FOUNDATIONS FOR SUCCESS: CONSULTATION DRAFT
c) The graph of is the same shape as the graph of g@x# p @x i 1#2, but lower
everywhere by @ #2p .
d) According to the result of part (a), the solutions for are the same as those of
. So we must solve .
We know that a2 i b2 p @a c b# @a i b#, so
(x i 1)2 i ( )2p[ ] [ ] 0.
This occurs when or
So the solutions of are or
g(x)p(x i1)2
f (x)p(x i1)2i ( )21
2
-1
2
1
-1 1 2 3 4
f@x# p @x i 1#2i @1#
2
212
14
x2 i 2x c 3 p 04f@x# p @x i 1#
2i @1#
2
2 @x i 1#2i @1#
2 p 02
@x i 1# c 12 @x i 1# i 1 p2
x i 1 p 02 x i 3 p 0.2
x2 i 2x c 3 p 04 x p 12
x p 3 .2
12

Mathematics Achievement Partnership | 143
SAMPLE PROBLEMS: IV. ALGEBRA
A19. Completing the Square to Solve a Quadratic Equation
a) Show how you can rewrite as 3[@x i 1#2 i ].
b) Show how to use the solution to part (a) to solve .
A SOLUTION
a) First factor out the 3:
@x2 i 2x i #
Now, inside the parentheses, the first two terms, x2 i 2x, suggest completing the square to get
x2 i 2x c 1 p @x i 1#2
Do this by adding and subtracting 1:
@x2 i 2x i #
p 3[@x2 i 2x c 1# i 1 i ]
p 3[@x i 1#2 i 1 i ]
p 3[@x i 1#2
i ].
3x2 i 6x i 473
3x2 i 6x i 4 p 3 43
3x2 i 6x i 4 p 3 43
43
43
3x2 i 6x i 4 p 0
73
.
.
144 | Achieve, Inc.
FOUNDATIONS FOR SUCCESS: CONSULTATION DRAFT
b) The calculation in part (a) shows that x is a solution of if and only if x is a solution
of 3[@x i 1#2
i ] p 0.
So we’ll start with that and proceed.
3[@x i 1#2
i ] p 0
@x i 1#2
i p 0
@x i 1#2p
x i 1 p vM
x p 1 v M .
73
3x2 i 6x i 4 p 0
73
73
73
73
73

Mathematics Achievement Partnership | 145
SAMPLE PROBLEMS: IV. ALGEBRA
A20. Solving Equations
Here are three equations:
i) 3x c 5 p 20 i x
ii) 3x i 5 p 3@x i #
iii) 3x c 5 p 3x c 10
For each equation, graph the linear functions represented by the left-hand side and the right-hand
side. (For example, in (i), graph y p 3x c 5 and y p 20 i x on the same coordinate system.) Then,
describe how the graphs you made can help you find solutions to the equation. For each equation,
list or describe all the solutions, and tell how you know you have them all.
A SOLUTION
Equation (i):
For the equation given in (i), the graphs of y p 3x c 5 and y p 20 i x appear below. They intersect
at a point that we denote by @u, v#.
(0, 20)
(20,0)
yp3x c5
y=20 -x
53
(u, v)
( i , 0)53
146 | Achieve, Inc.
FOUNDATIONS FOR SUCCESS: CONSULTATION DRAFT
Since @u, v# lies on both lines, v p 3u c 5 and v p 20 i u. Setting these equal to each other,
3u c 5 p 20 i u. If we solve for u, we will find the x-coordinate of the point of intersection — and the
solution of the original equation:
3u c 5 p 20 i u
4u p 15
u p .
Substituting for x in the original equation gives 3@ # c 5 p 20 i @ #, or p . So x p
is a solution. Since two lines can intersect in at most one point, there can be no more solutions.
The solution of the equation can also be obtained directly as follows (the same algebra, no graphical
reasoning):
3x c 5 p 20 i x
4x c 5 p 20
4x p 15
x p .
154
154
154
654
654
154
154
154

Mathematics Achievement Partnership | 147
SAMPLE PROBLEMS: IV. ALGEBRA
Equation (ii):
For the equation given in (ii), the graphs of y p 3x i 5 and y p 3@ #, shown below, coincide:
This shows that it is not possible to find a unique solution of the equation 3x i 5 p 3@ #. Every
value of x yields a solution.
If we look at it algebraically, we’d get:
3x i 5 p 3@ #
3x i 5 p 3x i 5
3x p 3x
0 p 0.
This result, 0 p 0, can be hard to interpret. The graph helps us see what it means, namely that the
original equation is true for all values of x.
x i 53
x i 53
x i 53
( ,0)
53yp3 (x i )
(0,-5)
y p 3x i 5
53

148 | Achieve, Inc.
FOUNDATIONS FOR SUCCESS: CONSULTATION DRAFT
Equation (iii):
For the equation given in (iii), the graphs of y p 3x c 5 and y p 3x c 10 are shown below.
Since these graphs are parallel, they have no point of intersection. Thus, it is not possible to find a
solution of the equation 3x c 5 p 3x c 10 .
Algebraically, if there were a solution, we would get:
3x c 5 p 3x c 10
5 p 10.
This is impossible, so there must have been no solution.
(0,10)
(0,5)
y p 3x c5
y p 3x c10

Mathematics Achievement Partnership | 149
SAMPLE PROBLEMS: IV. ALGEBRA
A21. Calling Plans
Long-distance company A charges a base rate of $5 per month, plus 4 cents per minute that you are on
the phone. Long-distance company B charges a base rate of only $2 per month, but they charge you 10
cents per minute used.
How much time per month would you have to talk on the phone before it would save you money to
subscribe to company A?
A SOLUTION
We can create cost functions to represent each of these calling plans.
Company A has a base rate or initial charge of $5 plus 4 cents per minute. A cost function in minutes for
company A is C p 500 c 4m where m represents the number of minutes used. (Note: We have chosen
cents for our units, hence the “500.” We could have used C p 5 c 0.04m. But an easy mistake is to use
C p 5 c 4m.)
Company B has a base rate or initial charge of $2 plus 10 cents per minute. A cost function in minutes
for company B is C p 200 c 10m where m represents the number of minutes used.
So if we set these two cost functions equal, we get the following equation:
500 c 4m p 200 c 10m.
If we solve this equation, we find the number of minutes
for which both plans cost the same amount of money.
4m c 500 p 10m c 200
300 p 6m
m p 50.
At 50 minutes the costs are equal, so company A saves you
money after 50 minutes. Here is a sketch of the situation:Time (in minutes)
20 40 60 80
200
400
600
800
1000
Co
st
(in
cen
ts)
Company B
C p 200 c 10m
Company A
C p 500 c 4m
0

150 | Achieve, Inc.
FOUNDATIONS FOR SUCCESS: CONSULTATION DRAFT
A22. Consecutive Integers
a) Suppose three consecutive integers have a sum of 195. If x denotes the middle of these numbers,write an equation in x that can be used to find them.
b) Show that the sum of any three consecutive integers is always a multiple of three.
A SOLUTION
a) If the middle number is x, then the first number is @x i 1# and the last number is @x c 1#. We can
write an equation for the sum and solve it.
@x i 1# c x c@x c 1# p 195
3x p 195
x p 65.
So the three numbers are 64, 65 and 66.
b) As above, if x is the middle of the consecutive numbers, the sum S of all three is
S p @x i 1# c x c@x c 1# p 3x, which is a multiple of 3.
Suppose that we started by naming the first integer n (rather than the middle one x). Then
the algebra will be a bit different, but the result will be the same:
S p n c @n c 1# c @n c 2#
p 3n c 3
p 3@n c 1#.
And since n is an integer, so is @n c 1#, and the sum, 3@n c 1#, is a multiple of 3.

Mathematics Achievement Partnership | 151
SAMPLE PROBLEMS: IV. ALGEBRA
A23. Two Cylinders
Two cylinders, A and B, share some dimensions. The height of cylinder A is the same as the radius of
cylinder B, and the height of cylinder B is the same as the radius of cylinder A.
a) Cylinder B has exactly twice the volume of cylinder A. What is the relation of the height to the radius
of cylinder B? Of cylinder A?
b) Draw these two cylinders approximately to scale.
A SOLUTION
a) The volume of cylinder B is twice that of cylinder A. Let a be the height and b be the radius of
cylinder B. Then b is the height and a the radius of cylinder A.
VB p r2h p b2a
VA p r2h p a2b
VB p 2VA
b2a p 2 a2b
@ ab#b p @ ab#2a
b p 2a.
For cylinder B, the radius is twice the height. For cylinder A, the height is twice the radius.
b) Perhaps the cylinders would look like this:
A B
a
ba
b
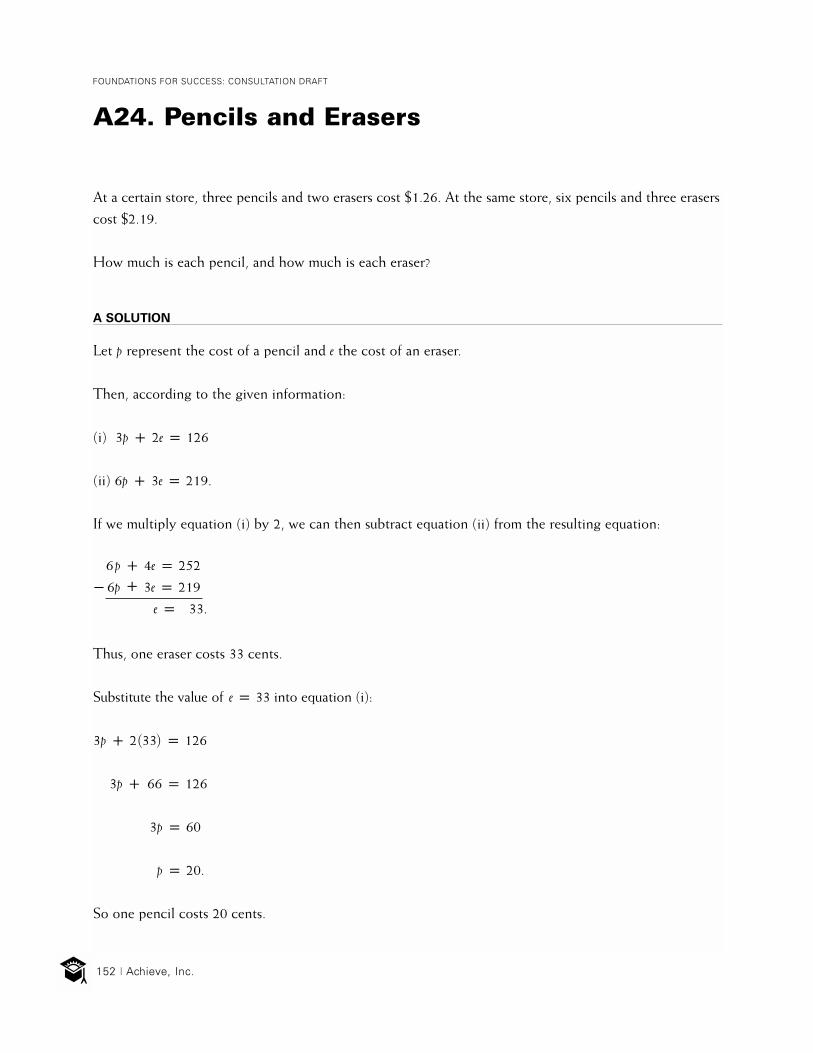
152 | Achieve, Inc.
FOUNDATIONS FOR SUCCESS: CONSULTATION DRAFT
A24. Pencils and Erasers
At a certain store, three pencils and two erasers cost $1.26. At the same store, six pencils and three erasers
cost $2.19.
How much is each pencil, and how much is each eraser?
A SOLUTION
Let p represent the cost of a pencil and e the cost of an eraser.
Then, according to the given information:
(i) 3p c 2e p 126
(ii) 6p c 3e p 219.
If we multiply equation (i) by 2, we can then subtract equation (ii) from the resulting equation:
Thus, one eraser costs 33 cents.
Substitute the value of e p 33 into equation (i):
3p c 2@33# p 126
3p c 66 p 126
3p p 60
p p 20.
So one pencil costs 20 cents.
6p c 4e p 252
6p c 3e p 219
e p 33.
i

Mathematics Achievement Partnership | 153
SAMPLE PROBLEMS: IV. ALGEBRA
A25. No Solution
The following pair of linear equations in two variables has no solution. Use graphs and algebra to show
why this is the case.
2x i 3y p 11
4x i 6y p 15.
A SOLUTION
The graph shows that the lines represented by 2x i 3y p 11 and
4x i 6y p 15 are parallel. For this pair to have a solution, the lines
would need to intersect.
We can use algebra to explore why this pair does not have a solution. Multiply
both sides of the top equation, 2x i 3y p 11, by 2 to get 4x i 6y p 22 .
Now subtract 4x i 6y p 15 from 4x i 6y p 22:
This contradiction shows that there is no solution to the pair of equations, since if there were any
numbers x and y that satisfied the equations, we would be forced to conclude that 0 p 7.
Instead of reasoning toward a contradiction, we can use algebra also to show that the lines are parallel.
First, we solve the original equations for y. This gives two equations in slope-intercept form.
2x i 3y p 11 4x i 6y p 15
Since the slopes are the same ( ), the lines are either parallel or identical. But since the y-intercepts are
different, they must be two different lines that, being parallel, never cross.
y p 2 x i 113 3 y p 4 x i 15
6 6
y p 2 x i 53 2
23
4x i 6y p 22
4x i 6y p 15
0 p 7.
2xc3yp11
4xc6yp15
i
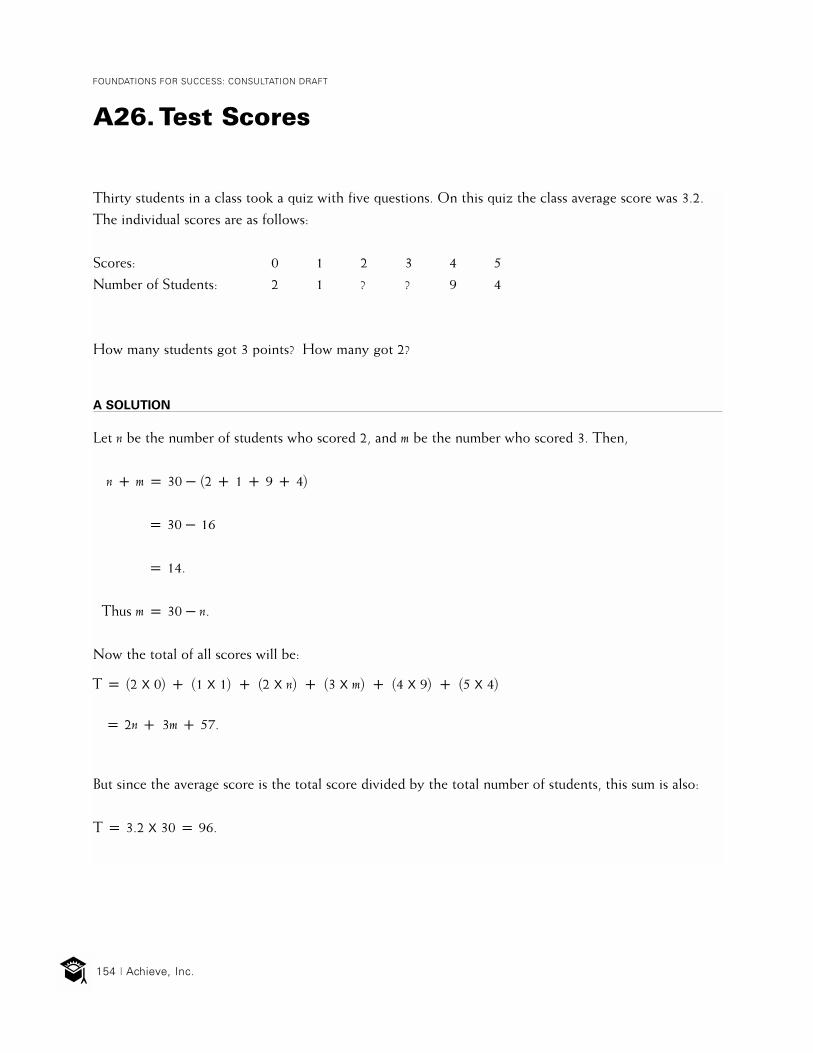
154 | Achieve, Inc.
FOUNDATIONS FOR SUCCESS: CONSULTATION DRAFT
A26. Test Scores
Thirty students in a class took a quiz with five questions. On this quiz the class average score was 3.2.
The individual scores are as follows:
Scores: 0 1 2 3 4 5
Number of Students: 2 1 ? ? 9 4
How many students got 3 points? How many got 2?
A SOLUTION
Let n be the number of students who scored 2, and m be the number who scored 3. Then,
n c m p 30 i @2 c 1 c 9 c 4#
p 30 i 16
p 14.
Thus m p 30 i n.
Now the total of all scores will be:
But since the average score is the total score divided by the total number of students, this sum is also:
T p 3.2 X 30 p 96.
T p @2 X 0# c @1 X 1# c @2 X n# c @3 X m# c @4 X 9# c @5 X 4#
p 2n c 3m c 57.

Mathematics Achievement Partnership | 155
SAMPLE PROBLEMS: IV. ALGEBRA
Combining the last two equations, and substituting m p 14 i n from above, we get:
2n c 3m c 57 p 96
2n c 3@14 i n# p 96 i 57
i n c 42 p 39
n p 3
m p 11.
So the number of students who scored 2 is 3, and the number who scored 3 is 11.

156 | Achieve, Inc.
FOUNDATIONS FOR SUCCESS: CONSULTATION DRAFT
A27. The Road Trip
Jennifer made a 100-mile trip by car on an interstate highway that was being repaired. She began at
noon and arrived at her destination at 3:30 p.m. Because of the construction zone, she was able to
average only 20 mph for a long stretch in the middle of the trip. The rest of the time she drove 70 mph.
How many miles long was the construction zone?
A SOLUTION
Let x denote the number of miles of construction (during which Jennifer drove 20 mph); then 100 i x
will be the number of miles when she drove 70 mph. The total time of the trip, 3.5 hours, consists of the
time she was driving 20 mph, namely , plus the time she was driving 70 mph, namely . Thus:
.
To simplify, multiply both sides by 20 X 70 p 140:
7x c 200 i 2x p 490
5x p 290
x p 58.
So, the length of the construction zone was 58 miles.
x c @100 i x# p 3.520 70
@100 i x#70
x 20
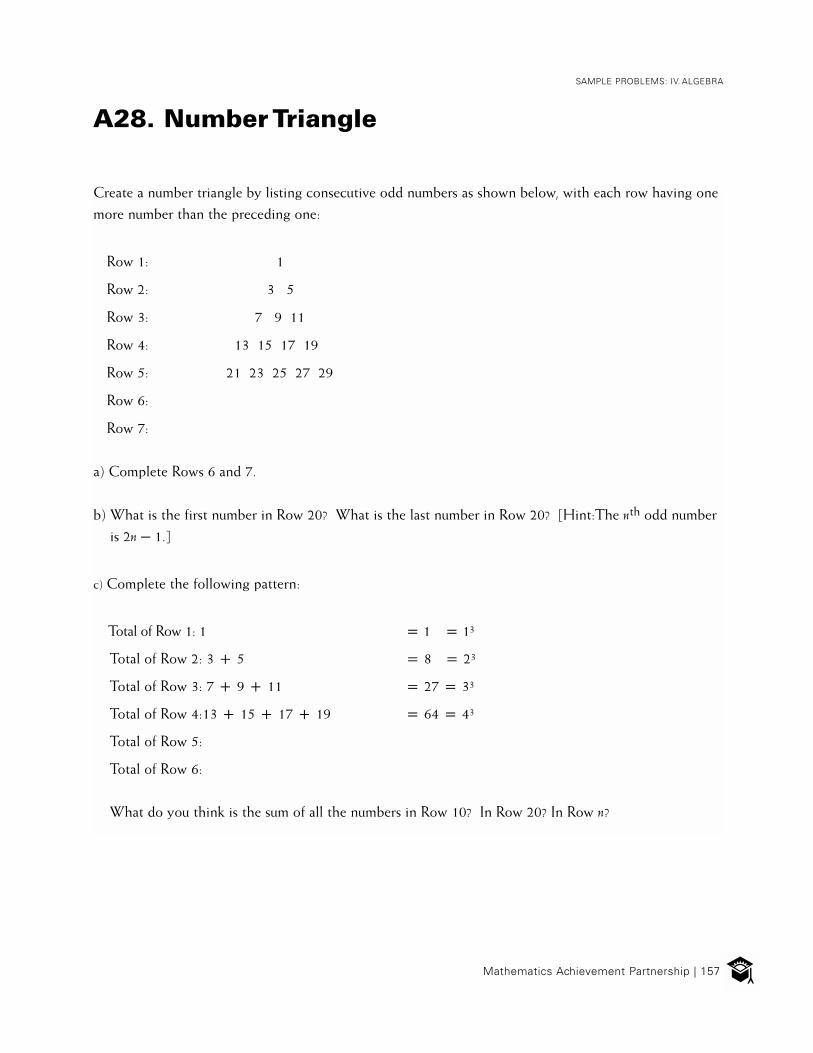
Mathematics Achievement Partnership | 157
SAMPLE PROBLEMS: IV. ALGEBRA
A28. Number Triangle
Create a number triangle by listing consecutive odd numbers as shown below, with each row having one
more number than the preceding one:
Row 1: 1
Row 2: 3 5
Row 3: 7 9 11
Row 4: 13 15 17 19
Row 5: 21 23 25 27 29
Row 6:
Row 7:
a) Complete Rows 6 and 7.
b) What is the first number in Row 20? What is the last number in Row 20? [Hint:The nth odd number
is 2n i 1.]
c) Complete the following pattern:
Total of Row 1: 1 p 1 p 13
Total of Row 2: 3 c 5 p 8 p 23
Total of Row 3: 7 c 9 c 11 p 27 p 33
Total of Row 4:13 c 15 c 17 c 19 p 64 p 43
Total of Row 5:
Total of Row 6:
What do you think is the sum of all the numbers in Row 10? In Row 20? In Row n?

158 | Achieve, Inc.
FOUNDATIONS FOR SUCCESS: CONSULTATION DRAFT
d) Using the information from step 3, complete the following table:
Entries Total Mean
Row 1: 1 13
Row 2: 3 5 23
Row 3: 7 9 11 33
Row 4: 13 15 17 19 43
Row 5:
Row 6:
Row 7:
Describe in words the pattern that you see. What do you conjecture is the mean of Row 20?
e) Compare the row means with the number of each row and the first number in each row. Describe the
pattern that you see. From this pattern, can you guess a formula for the first number in each row?
f) Can you prove that your guess is correct?
A SOLUTION
a) By just following instructions for constructing the number triangle, we get:
Row 5: 21 23 25 27 29
Row 6: 31 33 35 37 39 41
Row 7: 43 45 47 49 51 53 55
b) According to the way the number triangle is defined, if T is the total number of numbers in the first
19 rows, then the first number in Row 20 will be the @T c 1#st odd number. So we first need to find
T, and then find the @T c 1#st odd number.
13p 12
123
p 22233
p 32343
p 424

Mathematics Achievement Partnership | 159
SAMPLE PROBLEMS: IV. ALGEBRA
The number of numbers in each row increases by one each time a row is added. So the total number
T of numbers in the first 19 rows is:
T p 1 c 2 c 3 c 4 c … c 17 c 18 c 19.
If we repeat the same series in reverse order,
T p 19 c 18 c 17 c …c 4 c 3 c 2 c 1,
it is easy to see that the total of both series together is
which is just 20 added up 19 times, or 380. Since this is twice T, we find that T, the total number of
numbers in the first 19 rows, is p190.
So the first number in Row 20 will be the 191st odd number, which is 2 x 191 i 1 p 381.
Since there are 20 numbers in Row 20, the last number will be the 210th odd number, or
2 x 210 i 1 p 419.
c) The pattern for sums of the Rows is:
Sum of Row 4: 13 c 15 c 17 c 19 p 64 p 43
Sum of Row 5: 21 c 23 c 25 c 27 c 29 p 125 p 53
Sum of Row 6: 31 c 33 c 35 c 37 c 39 c 41 p 216 p 63
Sum of Row 7: 43 c 45 c 47 c 49 c 51 c 53 c 55 p 343 p73
So it appears as if the sum of all the numbers in Row 10 is 103, the sum of Row 20 is 203 and the sum of
Row n is n3. To check this conjecture for Row 20, we can add it all up (using the information above to
tell us what the first and last numbers are in this row). Notice that by pairing the numbers as shown, we
have 10 pairs, each with a sum of 800.
2T p @1 c 19# c @2 c 18# c @3 c 17# c @18 c 2# c @19 c 1#,
3802

160 | Achieve, Inc.
FOUNDATIONS FOR SUCCESS: CONSULTATION DRAFT
381 c 383 c 385 c … c 415 c 417 c 419
p @318 c 419# c @383 c 417# c @385 c 415# c … c @399 c 401#
p 800 c 800 c 800 c … c 800 p 8000 p 203.
d) Entries Total Mean
Row 1: 1 13
Row 2: 3 5 23
Row 3: 7 9 11 33
Row 4: 13 15 17 19 43
Row 5: 21 23 25 27 29 53
Row 6: 31 33 35 37 38 41 63
Row 7: 43 45 47 49 51 53 55 73
Since the row sums are the cube of the row number, and the number of entries in each row equals the
row number, the mean of each row will be the square of the row number.
Thus, the mean of Row 20 will be 202 p 400, and the mean of the nth row will be n2.
13p 12
123
p 22233
p 32343
p 42453
p 52563
p 62673
p 727

Mathematics Achievement Partnership | 161
SAMPLE PROBLEMS: IV. ALGEBRA
e) Using information from above, we can begin the following table:
Number of Entries First Term Row Mean
Row 1: 1 1 1
Row 2: 2 3 4
Row 3: 3 7 9
Row 4: 4 13 16
Row 5: 5 21 25
Row 6: 6 31 36
Row 7: 7 43 49
It appears from this table that the number of entries in each row (n) plus the first term is one more
than the mean (average) of the row, which we just discovered is n2. Said differently, the first term
appears to be n2 i n c 1.
f) Our conjecture is that the first term in row n is n2 i n c 1. To show that this conjecture is correct, we
imitate the calculations used to create the table above.
We know that the first term in each row is the (T c 1)st odd number, where T is the total number of
entries in all the previous rows. As the following simple table shows, the (T c 1)st odd number is
2 (T c 1) i 1:
Thus the first term in each row is 2@Tc1# i 1 p 2Tc1.
Now T, the total number of entries in rows 1 through n i 1, is given by:
1 c 2 c 3c ... c @n i 3# c @n i 2# c @n i 1#.
T: 1 2 3 4 5 6 7 8 … T (T+1) …
2T: 2 4 6 8 10 12 14 16 … 2T 2(T+1) …
2Ti 1: 1 3 5 7 9 11 13 15 … 2T i 1 2(T+1) i 1 …

162 | Achieve, Inc.
FOUNDATIONS FOR SUCCESS: CONSULTATION DRAFT
Using our earlier trick of repeating the series backwards and adding the two series together, we see that
T p [@1 c @n i 1## c @2 c @n i 2## c @3 c @n i 3## ... @@n i 1# c 1#]
p [n c n c n c... n ] @n i 1 times#
p n@n i 1#.
This the first number in row n is:
2T c 1 p 2 [ n@n i 1#] c 1 p n@n i 1# c 1 p n2 i n c 1, thus proving the conjecture.
12
12
12
12
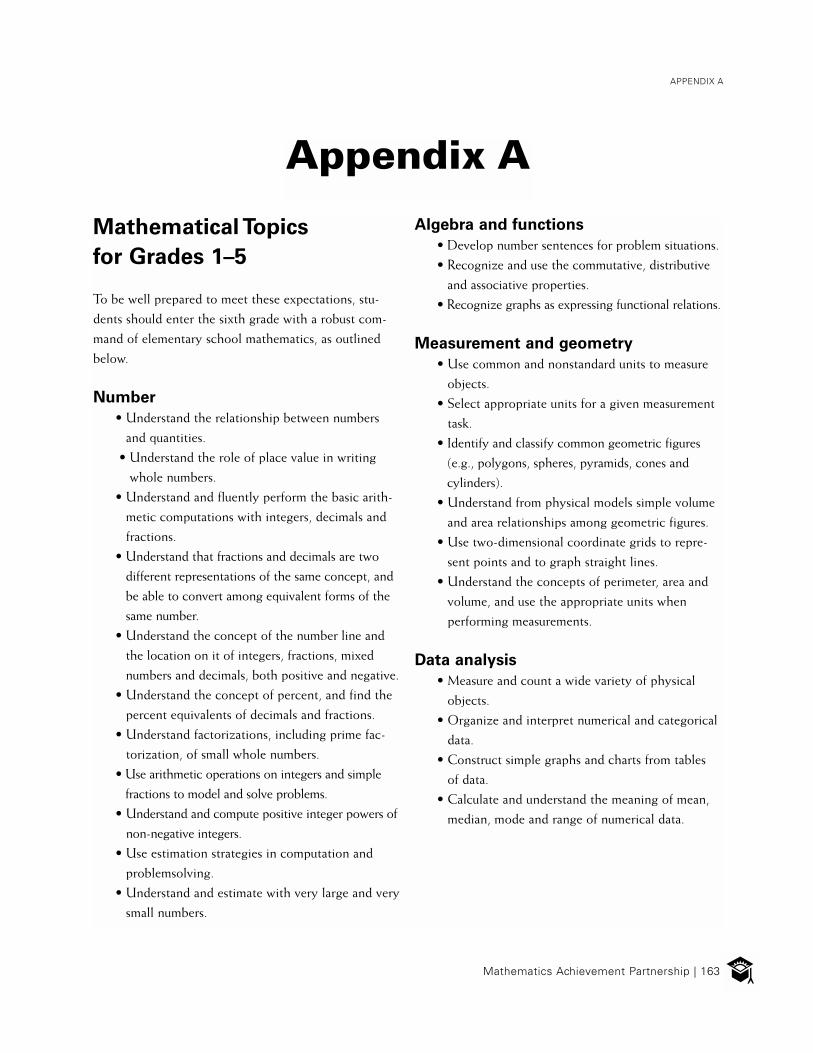
Mathematics Achievement Partnership | 163
APPENDIX A
Appendix A
Mathematical Topics
for Grades 1–5
To be well prepared to meet these expectations, stu-
dents should enter the sixth grade with a robust com-
mand of elementary school mathematics, as outlined
below.
Number
• Understand the relationship between numbers
and quantities.
• Understand the role of place value in writing
whole numbers.
• Understand and fluently perform the basic arith-
metic computations with integers, decimals and
fractions.
• Understand that fractions and decimals are two
different representations of the same concept, and
be able to convert among equivalent forms of the
same number.
• Understand the concept of the number line and
the location on it of integers, fractions, mixed
numbers and decimals, both positive and negative.
• Understand the concept of percent, and find the
percent equivalents of decimals and fractions.
• Understand factorizations, including prime fac-
torization, of small whole numbers.
• Use arithmetic operations on integers and simple
fractions to model and solve problems.
• Understand and compute positive integer powers of
non-negative integers.
• Use estimation strategies in computation and
problemsolving.
• Understand and estimate with very large and very
small numbers.
Algebra and functions
• Develop number sentences for problem situations.
• Recognize and use the commutative, distributive
and associative properties.
• Recognize graphs as expressing functional relations.
Measurement and geometry
• Use common and nonstandard units to measure
objects.
• Select appropriate units for a given measurement
task.
• Identify and classify common geometric figures
(e.g., polygons, spheres, pyramids, cones and
cylinders).
• Understand from physical models simple volume
and area relationships among geometric figures.
• Use two-dimensional coordinate grids to repre-
sent points and to graph straight lines.
• Understand the concepts of perimeter, area and
volume, and use the appropriate units when
performing measurements.
Data analysis
• Measure and count a wide variety of physical
objects.
• Organize and interpret numerical and categorical
data.
• Construct simple graphs and charts from tables
of data.
• Calculate and understand the meaning of mean,
median, mode and range of numerical data.

164 | Achieve, Inc.
FOUNDATIONS FOR SUCCESS: CONSULTATION DRAFT
Appendix BMathematical Topics
for Grades 9–11
Foundations for Success: Mathematics Expectations for theMiddle Grades provides a foundation for substantive
mathematics in high school that would leave all students
well prepared for college and careers. The following
topics might be included in grades 9–11 as part of a
program for most students regardless of future careers.
These topics could be sequenced or integrated accord-
ing to local priorities; they could be followed in grade
12 with any of a variety of courses, including statistics,
calculus and computer science.
Linear problems
Perpendicular lines (negative reciprocal slope,
orthogonal vectors); lines and planes in three
dimensions; and intersection of two planes as a line
and of three planes as a point.
Quadratics and other polynomials
Arithmetic and factoring of polynomials; complet-
ing the square in quadratic equations; quadratic
formula; graphs of quadratic and cubic poly-
nomials; and maxima, minima and zeroes.
Exploring data
Summarizing and interpreting graphical displays
of single-variable data; comparing distributions of
single variable data; and exploring two-variable
data and two-way tables.
Geometry
Properties of parallel lines and transversals, circles,
tangents and inscribed angles; equations of circles,
relation to Pythagorean theorem, equations of tan-
gent lines; congruence and similarity; and polygons
and their properties, sum of interior and exterior
angles.
Algebraic solutions
Solution by various methods of systems of two- and
three-linear equations; intersection of two lines in
the plane and two planes in space; relation of
degenerate systems to parallel lines and planes; sys-
tems of linear inequalities; equalities and inequali-
ties involving absolute value; and direct and inverse
proportion.
Probability
Relative frequency; independence; conditional
probability; standard deviation; normal distribution;
central limit theorem; and computer simulations.
Straightedge and compass constructions
Perpendicular bisectors; lines tangent to a circle;
parallel lines; angle bisectors; regular polygons; and
approximation to using perimeter of regular poly-
gon, partition of a line segment into n equal parts.
Surveys and experiments
Design of surveys; role of randomness in sampling;
sources of bias; limitations of observational studies;
and statistical significance.
Transformations in two and three
dimensions
Translations; simple rotations in two and three
dimensions using matrices (noting that rotations in
three dimensions fix a line); reflections through a
line in two dimensions and through coordinate
Mathematics Achievement Partnership | 165
APPENDIX B
planes in three dimensions; and scaling factors
(dilations).
Circular functions
Trigonometric functions, their graphs and simple
identities; relation to circular motion and connec-
tion with triangle trigonometry; Argand diagram
and DeMoivre’s formula; and relation to complex
numbers.
Functions, curves and analysis
Absolute value and greatest integer functions; expo-
nential functions and common applications; loga-
rithm as inverse function; curves of general qua-
dratics @Ax2 c Bxy c Cy2 c Dx c Ey pF #;and intersections with lines in the plane.

166 | Achieve, Inc.
FOUNDATIONS FOR SUCCESS: CONSULTATION DRAFT
Explanation of
Mathematical Subtleties
As the middle school curriculum moves from arithmetic
to more advanced mathematics, teachers regularly will
encounter subtle issues that have the potential to cause
considerable confusion. Here are some terms and issues
that the MAP Mathematics Advisory Panel found suffi-
ciently unclear to warrant special explanation.
Generality
Teachers and students often seem to believe that math-
ematicians primarily are interested in the most general
possible statements. This is a considerable misunder-
standing of mathematics. General statements are given
in mathematics only when they apply to a large num-
ber of important cases. Generalization or abstraction
for its own sake should not be encouraged. In particu-
lar, it usually is better to offer students examples of
how a statement is used rather than to focus instruction
on the general form of the statement.
For example, a geometric representation of a large
square, which has a small square cut out of one corner,
is commonly used to introduce the formula a2 i b2 p@a c b#@a i b#. Formal verification by algebraic means
typically comes next, along with explicit examples
showing how the formula can provide efficient strate-
gies (but certainly not the only ones) for certain calcu-
lations (e.g., 52 x 48 p 502 i 22 p 2500 i 4 p2496). Effective instruction will give equal weight to
all three aspects — geometric representation, algebraic
verification and numerical illustration — and not
emphasize any one aspect over another.
Equality
One notable source of difficulty in teaching mathemat-
ics is the many different ways in which the equal sign
is used. Despite what many believe, mathematical sym-
bols are at times ambiguous. For instance, the same
equal sign, “p”, can be used:
• to state a definition. In this instance, “p” means
“replaces” or “can be replaced by.” For example,
A p r2, A p bh, y p 2x i 1, or r2 p A,
bh p A, 2x i 1 p y. In each of these expres-
sions, the equal sign says that the symbol A or ycan be used in place of the expression on the
other side of the sign, or, conversely, one can
replace A or y by the expression on the other
side.
• to represent identity. In this instance, “p” means
“is the same as,” as in “two real numbers a and b
satisfy exactly one of the following three rela-
tions: a ! b, a p b, a 1 b.”
• to represent equivalence. In this instance, “p”
means “represents the same object as.” The most
common example is the notion of equivalent
fractions, e.g., p . In literal meaning, rep-
resents three copies of one-fourth of the whole,
while represents six copies of one-eighth of
the whole. These are distinct. When we call
them equal, we actually have made a significant
logical jump from literal objects to what mathe-
maticians call “equivalence classes.”
• to express a condition. In this instance, “p” estab-
lishes an equation that conveys a condition on
its variables. For example “p” in the equation
x2 i 3x c 1 p 2x c 1 establishes a condition
on x that is satisfied only when x is 0 or 5. Here
the condition on x conveyed by the equal sign can
Appendix C
34
68
34
68
Mathematics Achievement Partnership | 167
APPENDIX C
be thought of just as well as asserting the equal-
ity of the two functions f@x# p x2 i 3x c 1
and g@x# p 2x c 1.
Interpretation of the equal sign must be derived
from context. For students who are just learning, this is
often very confusing. To be entirely logical, we should
use different symbols for each distinctly different mean-
ing. Indeed, computer science uses the symbol “:p” to
signify equality with the first meaning, while the third
meaning is represented in advanced mathematics by the
equivalence symbol “ .” But tradition in school mathe-
matics is to use a single symbol for these several differ-
ent meanings. Consequently, the MAP expectations fol-
low common practice and use the same symbol for all
four meanings. However, careful attention to distin-
guishing among these different uses during instruction
almost certainly will be worthwhile.
Equations
Often in school mathematics, one hears teachers and
students talk about manipulating equations (in the
fourth meaning of equality). This is done by adding or
subtracting equal quantities from both sides of the
equation, or by multiplying or dividing both sides by
the same expression. That each of these steps creates a
new equation often is overlooked. None of these
manipulations replaces or modifies the original equa-
tion, which remains unchanged. The hope is that each
new equation will have the same solutions as the previ-
ous equation. In simple cases, this wish is fulfilled. But
some manipulations (e.g., squaring both sides) produce
an equation that may have more solutions than the
original equation.
Linearity
The study of mathematics begins with linear phenome-
na both because of their inherent simplicity and
because linear functions are the first approximation to
common nonlinear phenomena. For this reason, the
MAP expectations for middle school mathematics are
dominated by the study of linear functions. When a
linear function y p ax c b has no constant term, the
variables x and y are called “proportional,” and the
study of this special case @y p ax# is often referred
to as “proportional reasoning.” The equation y p axarises in many different contexts (for example, in study-
ing similar geometric figures, motion under constant
speed or revenues in relation to sales). Through this
one equation, therefore, students may begin to perceive
the unity of mathematics even on an elementary level.
Proportionality
Proportional relationships are at the heart of quantitative
understanding of the world, and their representation in
mathematics is of central importance. Yet the treatment
of proportionality in middle school textbooks often is
vague and confusing. One source of confusion is the
tradition of locating “proportionality” as a topic within
the number strand as if it were a property (like prime-
ness) of numbers when, in fact, it is a fundamental con-
cept of algebra, geometry and data analysis. A second
confusion arises by misappropriation of the term “lin-
ear” as a synonym for “proportional.” For example, the
relation y p 3x c 2 is linear but not proportional,
whereas y p 3x is both linear and proportional.
Finally, in many classrooms and curriculum guides, the
clear concept of a proportional relationship between
variables often morphs into muddy discussion of “pro-
portional reasoning,” as if this were some special kind
of inference.
Historically, proportionality has been approached
by studying the equality of two ratios. Alternatively,
and increasingly in middle school classrooms, it can be
approached through the study of linear functions. Both
interpretations are important for middle school, but the
two must be connected strongly.
168 | Achieve, Inc.
FOUNDATIONS FOR SUCCESS: CONSULTATION DRAFT
Quadratics
In Foundations for Success, the quadratic function and its
graph are considered to be far more fundamental than
the quadratic equation — which all too often is pre-
sented in textbooks as a canned technique topped off
with the quadratic formula — something to be memo-
rized and generally forgotten after the exams. The
strategy in Foundations for Success is to suppress the
actual formula but include all that leads up to its devel-
opment. In eighth grade, examples should be specific
and numerical. Literal coefficients such as a, b and cshould wait until the ninth grade, where their study
would be new and challenging. Presentation should
begin with factorable cases of increasing complexity,
then lay the foundation for completing the square
through specific examples. Each step can be reinforced
with graphing exercises that build through examples an
intuitive understanding of the relation between the
coefficients and zeros (roots) of the equation and the
position and shape of the associated parabolic graph.

What People Are Saying About the
Mathematics Achievement Partnership
“We are in a crisis educationally, and we need to make improvements more rapidly — especially in areas like mathematics. MAP is designed to help statesand schools accelerate their improvement efforts. For example, each state nowuses its own test to measure student performance. That makes no sense. With thenew eighth-grade assessment that MAP is developing, we’ll know our efforts aregauged against the best in the world. And states will be saving money by workingtogether and learning from each other — and not trying to reinvent the wheel.”
“Intel is committed to support efforts to strengthen middle school math curriculaand instruction to help our students achieve at world-class levels. MAP is de-signed to help states and school districts reach that goal. Intel is very pleased tobe a national sponsor of MAP, and particularly to sponsor California’s participa-tion in the program. We have high hopes that this endeavor will significantlybenefit both teachers and students in the country’s most populous state and therest of the nation.”
“It is imperative that states pool their intellectual and political capital to fashionthe improvements we all must make to raise achievement in our schools. The[MAP] math partnership is a model for collaboration.”
“We cheat American eighth graders if all we expect of them is what they them-selves call ‘dummy math,’ while students around the world get algebra and geom-etry. … These are the foundation skills our kids need to succeed in college and atwork. These math expectations, agreed upon by the states, and the teaching andtesting tools that will be developed from them will, at long last, give our childrena chance at a world-class math education.”
“Achieve recognizes that to improve student performance, it is necessary to aligncurricula, classroom lessons, professional development and assessment with rigor-ous mathematical goals. MAP is putting the pieces together to accomplish that.We urge states to participate in MAP, to involve local school districts and to pro-vide necessary funding, time and other assistance to make it work.”
John EnglerGovernor, State of Michigan
Louis Gerstner, Jr.Chairman and CEO, IBM Corporation
Sandra FeldmanPresident, American Federation of Teachers
Craig R. BarrettPresident and CEO, Intel
Roy RomerSuperintendent, Los Angeles Unified School District