formulation and evaluation of floating microcapsules of ... · pdf filehydroxy propyl methyl...
TRANSCRIPT
IOSR Journal of Pharmacy and Biological Sciences (IOSR-JPBS)
e-ISSN: 2278-3008, p-ISSN:2319-7676. Volume 10, Issue 4 Ver. V (Jul - Aug. 2015), PP 26-38
www.iosrjournals.org
DOI: 10.9790/3008-10452638 www.iosrjournals.org 26 | Page
Formulation and Evaluation of Floating Microcapsules of
Zolpidem Tartarate
1Sachin. S.Patil*.
2Dr. V.V.S.Rajendra Prasad,
3Dr .Beduin Mahanty,
4Dr. Vinay Rao.
1,2,3,4Sachin. S.Patil .Department of pharmaceutics, SND college of pharmacy, Yeola, Tal-Yeola District- Nasik ,
Pune university,Maharashtra[India].
Abstract: The hydro dynamically balanced modified release dosage form of ZOPLIDEM TARTARATE was
targeted to be developed using a unique microcapsules platform..Microcapsules were formulated using Ethyl
cellulose 7 cps as the controlled release polymer, HPMC 5 cps as the pore former and DCM and IPA as
solvents for the drug and polymers. Water with 1% Tween 80 was used as the continuous phase. The
formulation was optimized by using statistically designed 23 Design of experiments. The particle size, particle
yield, drug content, entrapment efficiency, buoyancy studies and in vitro dissolution profile were the measurable
parameters.The formulation showed that the particle size distribution, batch yield, drug content, entrapment
efficiency, buoyancy studies were not the dependent variable. There were no significant differences in any of the
above parameters in all the 8 experimental runs. However, in case of the in-vitro dissolution studies, the rate
and extent of the release profile was strongly dependent on the drug and polymer ratio as well as on the pore
forming concentration.[1,2]. A design space was defined within which an optimum formulation could be
successfully achieved with the in- vitro release profile matching to the Target product profile.[3]
Keywords: Zolpidem tartarate, Floating microcapsules, HPMC, Ethyl cellulose, DOE
I. Introduction The aim is to prepare gastro intestinal floating drug delivery system microcapsules using Zolpidem[ZT] as
a model drug.[5]
The aim of the system is to get the in vitro dissolution profile similar to Ambien CR tablets .
The concept selected for the current project is by formulating microcapsules.
The design is to have formulate ethyl cellulose (EC) based microcapsules of ZT which will float on the GI
content over a period of 4 to 6 hours.
The release profile shall be controlled by varying the concentration of EC and poreformer HPMC in the
microcapsules.
Zolpidem was proven as effective as benzodiazepine in the management of short-term insomnia.
Zolpidem is effective in reducing the time to sleep onset and increasing total sleep time. The hypnotic effects of
Zolpidem have been reported primarily in the first 3 hours post-dose which can lead to sub therapeutic effects
on sleep maintenance in the later portion of the night for some patients. In an effort to expand the coverage of
sleep complaints and overcome the lack of efficacy in sleep maintenance. The microcapsules were designed to
control release of drug and thus maintains a plasma concentration for a longer duration of time.[4,5]
Immediate release dosage forms of zolpidem provide a burst of drug substance shortly after ingestion,
to induce rapid onset of sleep. Whereas such dosage forms address the latency to sleep problem, unless the drug
substance has a long half life, in order to maintain effective blood plasma concentration levels over an extended
period of time, patients experiencing short sleep duration or frequent nocturnal awakening events will need to
take further dosage forms during the night to maintain sleep.[15]
The optimization shall be done using the Design Optimization and Experimentation that is DOE
concept.A batch of the optimized formulation shall be scaled up and subjected to 3 months accelerated stability
study. Factorial experimental designs investigate the effects of many different factors by varying them
simultaneously instead of changing only one factor at a time. Factorial designs allow estimation of the
sensitivity to each factor and also to the combined effect of two or more factors.[31]. By applying DOE for the
optimization of formulation variables, the critical concentration of the variables can be known, with which the
best formulation can be fabricated.DOE pro XL software was used for the present study.

“Formulation And Evaluation of Floating Microcapsules of Zolpidem Tartarate
DOI: 10.9790/3008-10452638 www.iosrjournals.org 27 | Page
II. Materials And Methods Materials- Table-1
Sr.No Drug/ Excipient/ Polymer/ Solvent Manufacturer
1. Zolpidem tartarate
Emco Industries, Hyderabad
2. Hydroxy propyl methyl cellulose (HPMC 5cps
S. D. Fine Chemicals
3. Ethyl cellulose 7cps S. D. Fine Chemicals
4. Dichloromethane S. D. Fine Chemicals.
5. Isopropyl alcohol S. D. Fine Chemicals.
6. Tween 80 Laboratory Grade
7. Hydrochloric acid Laboratory Grade
8. Sulphuric acid Laboratory Grade
Zolpidem Tartarate Powder
Colour: White fine powder
Melting point determination: The melting point of the obtained drug sample was found to be 196°C which is
the reported range of 196°C -197°C.It complies with the USP standards thus indicating the purity of the drug
soluble.
Solubility analysis: ZOPLIDEM TARTARATE sample was found to be soluble in water, 0.1 N Hcl, very
slightly soluble in ethanol, practically insoluble in acetone.
Compatibility studies.-
Fourier Transformation Infra-red (FTIR) analysis: Infra-red spectroscopy analysis was performed by
Fourier Transform Infrared Spectrophotometer.
Differential scanning calorimetry (DSC): DSC was performed in order to assess the thermotropic properties
and thermal behavior.
TABLE-2Spectral analysis:
Determination of λmax of ZOPLIDEM TARTARATE by using 0.1N HCL. The absorption
maximum of ZOPLIDEM TARTARATE in 0.1 N HCL was found to be 278 nm.
Figure1 :Calibration curve of ZOPLIDEM TARTARATE in 0.1N HCL

“Formulation And Evaluation of Floating Microcapsules of Zolpidem Tartarate
DOI: 10.9790/3008-10452638 www.iosrjournals.org 28 | Page
3.1 Experimental Design And Process Of Optimization
A full 2 3 factorial design
was introduced to optimize the formulation of Zolpidem loaded EC+ HPMC
microcapsules using the solvent evaporation technique (Table ).
Entrapment efficiency was considered as a measurable parameter for this study.
Doe Approach
Experimentation
A design matrix comprising of 8 experimental runs was constructed using DOE Pro XL Software to
investigate the effect of factors .
- Zolpidem concentration as (A),
- EC concentration as (B),
-HPMC concentration as (C)
-on the response variable i.e. % entrapment efficiency .
Experimental Design and Process Optimization
A full 23 factorial design was introduced to optimize the formulation of ZOLPI loaded EC+ HPMC
microcapsules using the solvent evaporation technique .
A design matrix comprising of 8 experimental runs was constructed using DOE Pro XL Software to investigate
the effect of 3 factors .
ZOLPI concentration as (A),
EC concentration as (B),
HPMC concentration as (C)
on the response variable i.e. % Drug released at 1 hour (D1) and % Drug release at 8 hours (D8) were
considered as measurable parameters.
Volume of solvent (50 ml), ratio of IPA and DCM (1:1) , volume of aqueous phase (500 ml)
concentration of Tween (2.5ml), stirring speed (500 rpm) and temperature (ambient) were kept constant.
TABLE-3 Formulation chart
TABLE-4 . Design of Experiment
Formulation Zolpidem
tartarate
Ethyl cellulose
7cps
HPMC 5cps
F1 L L L
F2 L L H
F3 L H L
F4 L H H
F5 H L L
F6 H L H
F7 H H L
F8 H H H
S.No. Ingredients LLL LLH LHL LHH HLL HLH HHL HHH
F1 F2 F3 F4 F5 F6 F7 F8
1 Zolpidem 250 250 250 250 1000 1000 1000 1000
2 Ethyl cellulose
7cps 250 250 1000 1000 250 250 1000 1000
3 HPMC 5cps 2 20 2 20 2 20 2 20
4
Isopropyl alcohol
(IPA) (ml) 25 25 25 25 25 25 25 25
5
Dichloromethane
(DCM) (ml) 25 25 25 25 25 25 25 25
6 Tween 80 (ml) 2.5 2.5 2.5 2.5 2.5 2.5 2.5 2.5
7 Water (ml) 500 500 500 500 500 500 500 500

“Formulation And Evaluation of Floating Microcapsules of Zolpidem Tartarate
DOI: 10.9790/3008-10452638 www.iosrjournals.org 29 | Page
FIGURE-2 Method of Preparation of Microcapsules
Percentage yield
Percentage yield of different formulations,F1-F8,were calculated
3.2characterization Of Microcapsules
Particle size analysis
Particle size distribution of microcapsules was determined by optical microscope fitted with an ocular
micrometer
Shape and surface morphology
Surface morphology and internal cross sectional structure of the floating microcapsules were investigated
with scanning electron microscope.
Drug loading & entrapment efficiency:
In vitro Buoyancy Studies:
The duration of floatation for all the batches of microcapsules was evaluated as follows:
Quantity of microcapsules equivalent to 12.5 mg of Zolpidem Tartarate was accurately weighed out for
each batch.
This amount was added to a 500 ml glass beaker containing 250 ml of 0.1N HCl (medium). A three blade
remi stirrer was fitted into the medium.
The mediuim was stirred at 50 rpm for a period of 12 hours
The behaviour of the microcapsules was observed at 2, 4, 8 and 12 hours interval and the visual
observations were noted.
In-vitro Dissolution Studies The Design space for the Zolpidem Tartarate, EC and HPMC is defined by DOE by feeding data of
entrapment efficiency.
In order to confirm the design space, 3 formulations [F optima 1, 2,3] within the space were fabricated at a
larger scale and evaluted for dissolution profile. Stability Studies
III. Results & Discussion A total of 8 formulations of Zolpidem Tartarate floating microcapsules were formulated by solvent
evaporation technique using DOE approach, which was already discussed in the previous chapter. The
formulations were subjected to evaluation parameters like particle size, surface morphology, drug entrapment
efficiency, In-vitro drug release studies.
“Formulation And Evaluation of Floating Microcapsules of Zolpidem Tartarate
DOI: 10.9790/3008-10452638 www.iosrjournals.org 30 | Page
4.1 Preformulation Studies- Identification Of Pure Drug
4.2 FT-IR Spectroscopy- The FT-IR spectrum of the pure drug was found to be similar to the standard
spectrum of Zolpidem Tartarate. The spectra of the drug and the cross linked microcapsules were shown in the
figures 8.1,8.2 respectively
.
4.3 Melting Point Determination-The melting point of the obtained drug sample was found to be 1960C which
is the reported range of 195 to 1970C.It complies with the USP standards thus indicating the purity of the drug
sample.
4.4 Solubility Analysis-Zolpidem Tartarate sample was found to be soluble in water (18.8 mg/ml), 2-propanol
and ethanol, sparingly soluble in acetone. Soluble in 0.1N NaOH .
4.5.Compatibility studies-From the FT-IR spectra of the pure drug and the combination spectra of drug with
the polymers, it was observed that all the characteristics peaks of Zolpidem Tartarate were present in the
combination spectra thus indicating the compatibility of the drug with the polymer used.
The IR spectrum of the Zolpidem Tartrate shows the peaks at following values which are characteristic of the
drug.
3380 cm-1 -O-H stretching,
1646 cm-1 - C=O stretching for carbonyl,
2900 cm-1 aliphatic C-H stretching
Differential Scanning Calorimetry(Dsc) Study -Differential scanning calorimetry (DSC) studies of drug-
polymer mixtures were performed using a Toledo DSC (Mettler Star SW 9.20) to determine the drug excipient
compatibility study.Thermograms of pure Zolpidem Tartrate showed sharp endothermic peak at 196 °C. Similar
peaks were obtained in the prepared drug-polymer mixtures. This clearly indicates the nil drug polymer
interaction.
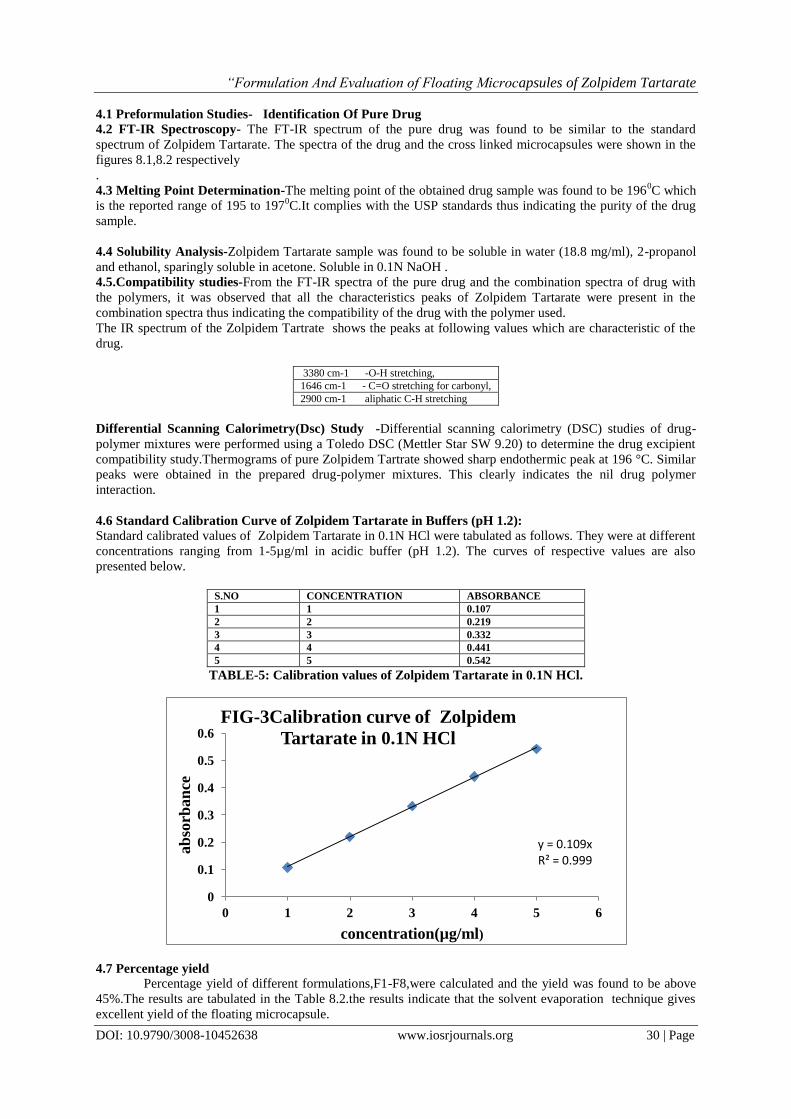
4.6 Standard Calibration Curve of Zolpidem Tartarate in Buffers (pH 1.2):
Standard calibrated values of Zolpidem Tartarate in 0.1N HCl were tabulated as follows. They were at different
concentrations ranging from 1-5µg/ml in acidic buffer (pH 1.2). The curves of respective values are also
presented below.
S.NO CONCENTRATION ABSORBANCE
1 1 0.107
2 2 0.219
3 3 0.332
4 4 0.441
5 5 0.542
TABLE-5: Calibration values of Zolpidem Tartarate in 0.1N HCl.
4.7 Percentage yield
Percentage yield of different formulations,F1-F8,were calculated and the yield was found to be above
45%.The results are tabulated in the Table 8.2.the results indicate that the solvent evaporation technique gives
excellent yield of the floating microcapsule.
y = 0.109x R² = 0.999
0
0.1
0.2
0.3
0.4
0.5
0.6
0 1 2 3 4 5 6
ab
sorb
an
ce
concentration(µg/ml)
FIG-3Calibration curve of Zolpidem
Tartarate in 0.1N HCl

“Formulation And Evaluation of Floating Microcapsules of Zolpidem Tartarate
DOI: 10.9790/3008-10452638 www.iosrjournals.org 31 | Page
Formulation Percentage Yield(%w/w)
F1 54.82
F2 59.45
F3 77.92
F4 80.23
F5 46.87
F6 48.57
F7 65.97
F8 68.97
TABLE-6: Percentage Yield of Formulation
4.8. Discussion:
The yield of microcapsules seems to depend on the concentration of polymer in the preparation. For
formulation F3 , F4, F7 and F8, where the EC concentration is 1000 mg, the yields are > 60%.
For formulations with low EC concetration, the yields are in the range of 45 to 55%.
9. Characterization Of Microcapsules
4.9.Particle size analysis Particle size distribution of microcapsules was determined by optical microscope fitted with an ocular
micrometer and stage micrometer.the particle sizes of the microcapsules were found in the range of(65-525µm)
for 8formulations(DOE).The particle size of the formulations were shown in the table
TABLE-7: Mean Particle Size of the Microcapsules of the Formulations.
Figure 4 : Mean Particle Size of the Microcapsules of the Formulations
IV. Discussion For all formulations, the microcapsules are in the average particle size range of 250 to 375 µm. The
particle size distribution is independent of the formulation and is dependent more on the process follows.
5.1Shape and surface morphology Surface morphology and internal cross sectional structure of the floating
microcapsules were investigated with scanning electron microscope.SEM photomicrographs of the blank
microcapsules, optimized formulation were shown in the figures. The microcapsules were smooth, spherical and
discrete particles. Very less particulate matter of the drug were seen on the surface of the microcapsules
indicating uniform distribution of the drug in the polymer
0
50
100
150
200
250
300
350
400
450
F1 F2 F3 F4 F5 F6 F7 F8
MEA
N P
SD (
MIC
RO
NS)
MEAN PARTICLE SIZE OF THE MICROCAPSULES USING OPTICAL MICROSCOPY
Series1
FORMULATION MEAN PARTICLE SIZE( D90) (µm)
LLL 355.86
LLH 344.86
HLL 278.98
LHH 330.77
HLL 357.29
HLH 288.86
HHL 386.55
HHH 289.26

“Formulation And Evaluation of Floating Microcapsules of Zolpidem Tartarate
DOI: 10.9790/3008-10452638 www.iosrjournals.org 32 | Page
Figure 5: SEM of Blank Figure 6: SEM of Foptima 1
Fig 7: SEM of F optima2
5.2.Discussion:
The SEM images show spherical microcapsules with a rough and porous surface. The microcapsules for the
scale up batch (Fig) shows that the microcapsules obtained for the scale up batch are reproducible in surface
characteristics.
TABLE-8 Drug loading & entrapment efficiency: . FORMULATION ENTRAPMENT EFFICIENCY
F1 67.39
F2 70.58
F3 94.00
F4 84.61
F5 74.97
F6 72.41
F7 89.27
F8 91.70
Figure 8: Entrapment Efficiency
Discussion:The drug entrapment efficiency is dependent on the level of EC in the formula. For formulations
with EC is 1000 mg, the entrappment efficiency is > 80%. For formulations with EC levels at 250 mg, the
efficiency is around 6o to 75%
0.00
20.00
40.00
60.00
80.00
100.00
F1 F2 F3 F4 F5 F6 F7 F8
ENTA
PM
ENT
EFFI
CIE
NC
Y R
AN
GE
FORMULATION
ENTRAPMENTEFFICIENCY
Series1

“Formulation And Evaluation of Floating Microcapsules of Zolpidem Tartarate
DOI: 10.9790/3008-10452638 www.iosrjournals.org 33 | Page
5.3 In Vitro Buoyancy Studies: The duration of floatation for all the batches of microcapsules was evaluated
as follows: -Quantity of microcapsules equivalent to 12.5 mg of Zolpidem Tartarate was accurately weighed out
for each batch.This amount was added to a 500 ml glass beaker containing 250 ml of 0.1N HCl (medium). A
three blade remi stirrer was fitted into the medium.The medium was stirred at 50 rpm for a period of 12 hours.
Table-9: In Vitro Buoyancy Studies
5.4. In-vitro Dissolution Studies:
In vitro release study of Zolpidem Tartarate floating microcapsules were performed in the following
pH media (pH 1.2) at 370C ±0.5
0C.
In vitro dissolution testing was conducted on microcapsules equivalent to
12.5mg of ZOLPIDEM TARTARATE.
Microcapsules were filled in hard gelatin capsules shells
USP Type I apparatus was used
Media 900 ml 0.1N HCl
RPM: 50 rpm
Time points: 0. 0.5, 1, 2, 4 and 8 hours
Estimation by UV spectrophotometry.
S. No. Formulation
No.
Time (Hours)
0 2 4 8 12
1 F1 Floating without
clumping
Floating without
clumping
Floating without
clumping
Floating without
clumping
The clumps of ethyl cellulose
are formed on
the surface
2 F2 Floating
without
clumping
Floating
without
clumping
Floating
without
clumping
Floating
without
clumping
The clumps of
ethyl cellulose
are formed on
the surface
3 F3 Floating
without
clumping
Floating
without
clumping
Floating
without
clumping
Floating
without
clumping
Floating
without
clumping
4 F4 Floating
without
clumping
Floating
without
clumping
Floating
without
clumping
Floating
without
clumping
Floating
without
clumping
5 F5 Floating without
clumping
Floating without
clumping
The clumps of ethyl cellulose
are formed on the surface
The clumps of ethyl cellulose
are formed on the surface
The clumps of ethyl cellulose
are formed on the surface
6 F6 Floating
without
clumping
Floating
without
clumping
The clumps of
ethyl cellulose
are formed on the surface
The clumps of
ethyl cellulose
are formed on the surface
The clumps of
ethyl cellulose
are formed on the surface
7 F7 Floating
without
clumping
Floating
without
clumping
Floating
without
clumping
Floating
without
clumping
The clumps of
ethyl cellulose
are formed on
the surface
8 F8 Floating
without clumping
Floating
without clumping
Floating
without clumping
Floating
without clumping
The clumps of
ethyl cellulose are formed on
the surface
“Formulation And Evaluation of Floating Microcapsules of Zolpidem Tartarate
DOI: 10.9790/3008-10452638 www.iosrjournals.org 34 | Page
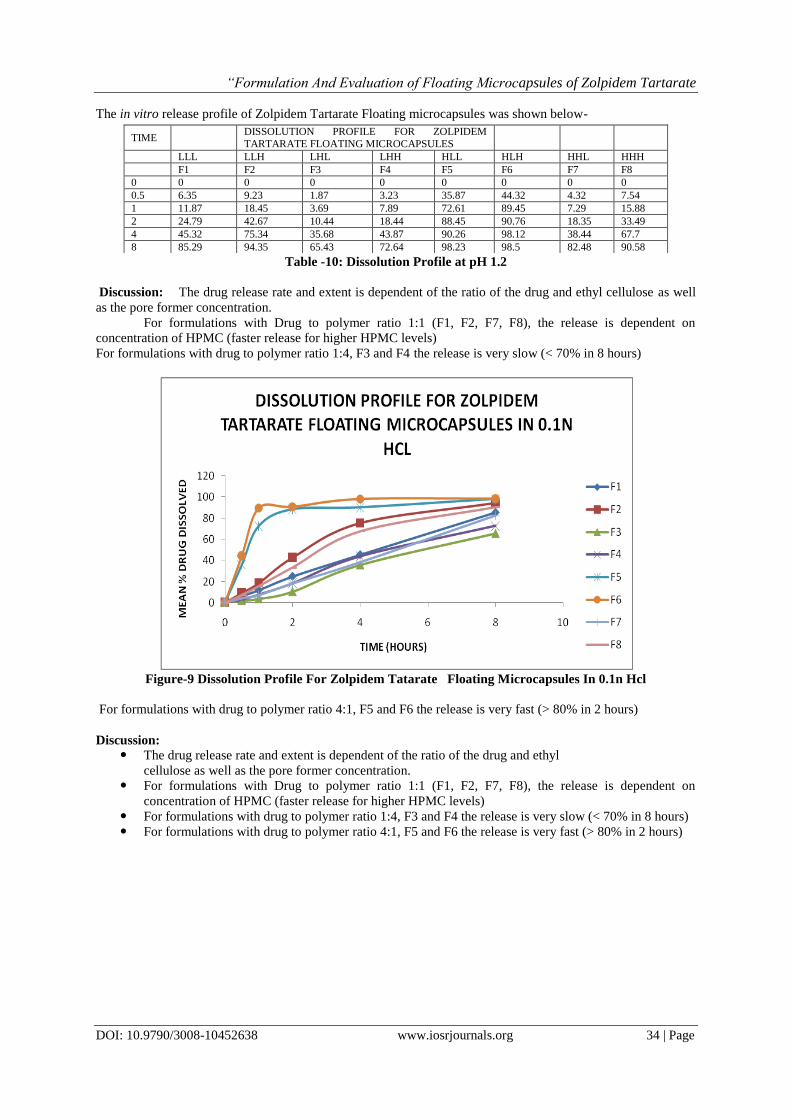
The in vitro release profile of Zolpidem Tartarate Floating microcapsules was shown below-
Table -10: Dissolution Profile at pH 1.2
Discussion: The drug release rate and extent is dependent of the ratio of the drug and ethyl cellulose as well
as the pore former concentration.
For formulations with Drug to polymer ratio 1:1 (F1, F2, F7, F8), the release is dependent on
concentration of HPMC (faster release for higher HPMC levels)
For formulations with drug to polymer ratio 1:4, F3 and F4 the release is very slow (< 70% in 8 hours)
Figure-9 Dissolution Profile For Zolpidem Tatarate Floating Microcapsules In 0.1n Hcl
For formulations with drug to polymer ratio 4:1, F5 and F6 the release is very fast (> 80% in 2 hours)
Discussion: The drug release rate and extent is dependent of the ratio of the drug and ethyl
cellulose as well as the pore former concentration.
For formulations with Drug to polymer ratio 1:1 (F1, F2, F7, F8), the release is dependent on
concentration of HPMC (faster release for higher HPMC levels)
For formulations with drug to polymer ratio 1:4, F3 and F4 the release is very slow (< 70% in 8 hours)
For formulations with drug to polymer ratio 4:1, F5 and F6 the release is very fast (> 80% in 2 hours)
TIME
DISSOLUTION PROFILE FOR ZOLPIDEM
TARTARATE FLOATING MICROCAPSULES
LLL LLH LHL LHH HLL HLH HHL HHH
F1 F2 F3 F4 F5 F6 F7 F8
0 0 0 0 0 0 0 0 0
0.5 6.35 9.23 1.87 3.23 35.87 44.32 4.32 7.54
1 11.87 18.45 3.69 7.89 72.61 89.45 7.29 15.88
2 24.79 42.67 10.44 18.44 88.45 90.76 18.35 33.49
4 45.32 75.34 35.68 43.87 90.26 98.12 38.44 67.7
8 85.29 94.35 65.43 72.64 98.23 98.5 82.48 90.58

“Formulation And Evaluation of Floating Microcapsules of Zolpidem Tartarate
DOI: 10.9790/3008-10452638 www.iosrjournals.org 35 | Page
5.5 Release kinetics
Table -11 :Release rate of Zolpidem Tartarate from formulations (F1 to F8)
In order to understand the mechanism of drug release from the microcapsules, the in vitro drug release
data were fitted to Korsmeyer and Peppas release model and interpretation of release exponent values enlightens
in understanding the release mechanism from the dosage form. The release exponents thus obtained were from
0.874 to 1.353 for the formulations F1 TO F4 and F7 TO F8.. Based on these values we can say that
formulations exhibited super case ii transport. The release exponents formulations F6 & F5 was found to be
0.244 & 0.322 Based on these values we can say that formulations exhibited anomalous diffusion mechanism
(non fickian transport).
The formulations F1 & F3 showed higher r values for Korsmeyer and Peppas release plot indicating
that the drug release from these formulations exhibited anomalous diffusion mechanism. Also the remaining
formulations showed higher r values for .first order plot indicating that the drug release followed first order
kinetics and also the drug release from the microcapsules were by both diffusion and erosion .
Discussion: The release of Zolpidem Tartarate at 1 hour and 8 hours time points were taken as the measurable
parameters for running the DOE experiments. The 1 hour time point indicates the rate of release and the 8 hours
time point is a measure the extent of release. The following are the observations from the DOE software output:
(1) For both 1 hour and 8 hours, there is a strong positive interaction between the drug to EC ratio and the rate
and extrent of drug release..
(2) HPMC 5 cps which is added as the pore former, does not show either positive or negative impact on drug
release. However, for formulations having HPMC in higher concentrations, the drug release is more complete
(at higher EC level) than formulations having low level of HPMC
(3) The design space for the Zolpidem Tartarate, EC and HPMC is defined as per Table .
(4) In order to confirm the design space, 3 formulations within the space were fabricated at a larger scale and
evaluted for dissolution profile.
(5) These formulations were subjected to accelerated stability studies after filling into hard gelatin capsules
shells.
V. Doe Charts: The DOE charts were obtained by feeding the entrapment efficiency data in to the DOE Pro XL
software and the design space values were calculated using residual analysis.Y-hat contour plots,Y-hat surface
plots,Y- hat interaction plots were plotted for independent variables that is Zolpidem Tartarate,Ethyl cellulose
and HPMC, . The charts reveal that there is strong positive interaction between Zolpidem Tartarate and EC and
HPMC.
By considering the below observations an optimized formula was designed, formulated and evaluated.
The Y-Contour plots specify the design space within which each formulation component can be varied without
compromising on the entrapment efficiencies. The design space values are tabulated in Table.
Formulation R2 Peppas
N Zero First Higuchi Peppas
F1 0.9981 0.9646 0.9272 0.9991 0.943
F2 0.9080 0.9964 0.9524 0.9659 0.874
F3 0.9867 0.9800 0.8689 0.9885 1.353
F4 0.9876 0.9918 0.9165 0.9915 1.146
F5 0.5225 0.9057 0.7911 0.7384 0.322
F6 0.4127 0.7461 0.6958 0.6188 0.244
F7 0.9981 0.9491 0.8834 0.9949 1.091
F8 0.9420 0.9946 0.9491 0.9803 0.927

“Formulation And Evaluation of Floating Microcapsules of Zolpidem Tartarate
DOI: 10.9790/3008-10452638 www.iosrjournals.org 36 | Page
TABLE-12: Design Space Range for entrappment efficiency > 77% for Zolpidem Tartarate
Based on the values given in the above table an F optimum formulation was fabricated and evaluated for
entrapment efficiency.Formulation composition and
Entrapment efficiency achieved are given in Table13-FORMULATION CHART
TABLE 14: Composition and Entrapment efficiency of Optimised Formulation
Discussion: The process used for the initial batches, is reproducible and scalable. The results for yield assay,
entrapment efficiency and particle size distribution are reproducible. This indicates that the selected solvent
evaopration techinque is suitable for formulation of floating microcapsules
Table15 Dissolution Profile For Optimized Formulations
S.No Indgredients (mg/unit) Lower Limit Higher Limit
1 ZOLPIDEM TARTARATE 50 70
2 Ethyl Cellulose 7cps 145 150
3 HPMC 6 cps 0.4 2.0
S.no Formulation No. Formulation Ingredients Mg/unit
1 Foptima 1 Zolpidem Tartarate 50
EC 145
HPMC 0.4
2 Foptima 2 Zolpidem Tartarate 60
EC 147
HPMC 1.0
3 Foptima 3 Zolpidem Tartarate 70
EC 150
HPMC 2
4
Tween 80 (ml) 100
5
IPA (ml) 500
6
DCM (ml) 500
7
Water (ml) 5000
TIME Foptima1 Foptima2 Foptima3
0 0 0 0
0.5 6.35 9.23 7.54
1 11.87 18.45 15.88
2 24.79 28.67 33.49
4 65.32 75.34 67.7
8 85.29 94.35 90.58

“Formulation And Evaluation of Floating Microcapsules of Zolpidem Tartarate
DOI: 10.9790/3008-10452638 www.iosrjournals.org 37 | Page
Figure10: Dissolution profile for optimized formulation of Zolpidem Tartarate microcapsules
VI. Discussion The dissolution profile for all three formulations fabricated within the design space are showing
Matching values. This indicates that any formulation fabricated within the design space will give a product
having dissolution profile in a very narrow range of acceptability.
Table 16: Release rate of Zolpidem Tartarate from optimized formulations
In order to understand the mechanism of drug release from the microcapsules, the in vitro drug release
data of the optimized formulations were fitted to Korsmeyer and Peppas release model and interpretation of
release exponent values enlightens in understanding the release mechanism from the dosage form. The release
exponents thus obtained were from 0.874, 0.996 and 0.927. Based on these values we can say that formulations
exhibited super case II transport
All the optimized formulations showed higher r values for first order plot indicating that the drug
release followed first order kinetics and also the drug release from microcapsules were by both diffusion and
erosion.
VII. Accelerated Stability Studies For Zolpidem Tartarate Floating Microcapsules: Three batches of optimized formulations were fabricated as per the table below:
S.no Formulation No. Formula Ingredients Mg/unit g/500 units
1 Foptima 1 Zolpidem Tartarate 50 25
EC 145 72.5
HPMC 0.2 0.1
2 Foptima 2 Zolpidem Tartarate 60 30
EC 147 73.5
HPMC 1.0 0.5
3 Foptima 3 Zolpidem Tartarate 70 35
EC 150 75
HPMC 2 1.0
Tween 80 (ml) 100
IPA (ml) 500
DCM (ml) 500
Water (ml) 5000
TABLE-17:Formulation chart of F optima 1,2,3
0
20
40
60
80
100
0 2 4 6 8 10
ME
AN
% D
RU
G
RE
LE
AS
ED
DISSOLUTION PROFILE FOR OPTIMIZED
FORMULATIONS
Foptima1
Foptima2
Foptima3
Formulation R2 Peppas
N Zero First Higuchi Peppas
F-optima1 0.9377 0.9843 0.9195 0.9797 0.996
F-optima2 0.9241 0.9846 0.9281 0.9746 0.874
F-optima3 0.9420 0.9946 0.9491 0.9803 0.927

“Formulation And Evaluation of Floating Microcapsules of Zolpidem Tartarate
DOI: 10.9790/3008-10452638 www.iosrjournals.org 38 | Page
The batches were fabricated by the process described in Materials and Methods. The process was
reproducible at this scale.
These batches were evaluated for assay, % entrapment efficiency , flow properties and in vitro
dissolution profile in 0.1N HCl. The results of the physical properties, assay an d% entrapment efficiency are
given in Table. The invitro dissolution profile for these 3 batches is given in Table.
The microcapsules were filled in size ‘1’ hard gelatin capsules shells, packed in 90 cc HDPE container
and subjected to accelerated stability studies at 40◦C/75% RH stability conditions. Samples were withdrawn at
1M, 2M and 3M intervals and evaluated for assay and in vitro dissolution testing. The results are given in Table-
26
Table-18: Stability Studies Of F Optima 1,2,3
Acknowledgements
The authors are thankful to Emco industries Hyderabad for providing a gift sample of Zolpidem
tartrate.
9 .Summary & Conclusion: In order to understand the mechanism of drug release from the microcapsules, the
in vitro drug release data of the optimized formulations were fitted to Korsmeyer and Peppas release model and
interpretation of release exponent values enlightens in understanding the release mechanism from the dosage
form. The release exponents thus obtained were from 0.874, 0.996 and 0.927. Based on these values we can say
that formulations exhibited super case II transport.All the optimized formulations showed higher r values for
first order plot indicating that the drug release followed first order kinetics and also the drug release from
microcapsules were by both diffusion and erosion.
References [1]. Swarbrick J. Encyclopedia of pharmaceutical technology. 3rd ed. NewYork-London: Informa Healthcare; 2007. Vol. 3. p. 1850-60. [2]. Brahmankar D.M. and Jaiswal S.B. Biopharmaceutis and Pharmakokinetics: A Tretise. 1st edition, Vallabh Prakashan, New
Delhi,2006,335-357.
[3]. Tortora G. P10rinciples of Anatomy and Physiology. 11thedition, John Wiley &Son’s Inc.,US.2006,911-915. [4]. Jain N. K. Progress in Controlled and Novel Drug Delivery Systems. 1st edition, C. B. S. publishers, New Delhi, 2008, 76-97.
[5]. Vyas S.and Khar R.K. Controlled Drug Delivery: Concepts and Advances. 1stedition, Vallabh Prakashan, New Delhi,2002,196-215.
[6]. Mona Semalty*, Shikha Yadav and Ajay semalty. Preparation and characterization of gastroretentive floating microspheres of ofloxacin Hcl. International journal of pharmaceutical sciences and nano technology vol 3, Issue 1 April-June 2010.
[7]. Nagesh C, venkatesh J S, Santhosh Raj M, Jagadish Rabadia, Sindhu Patil, Shankraiah M*. Intragastric Floating Drug Delivery
System of Levofloxacin: Formulation and Evaluation. J. Pharm. Sci. & Res. Vol.3(6), 2011, 1265-1268. [8]. GargR. and Ghanshyam D. S. Preparation and evaluation of Silymarin floating tablets.Chem. Pharm. Bull.2009, 57(6), 545-549.
[9]. GargR., and GuptaG. D. Progress in controlled gastro retentive delivery system.Tropical Journal of Pharmaceutical Research,2008,
7(3), 1055-1066. [10]. Indian Pharmacopoeia Published by govt. of India, ministry of health & family welfare, Ghaziabad, vol.II; 2007, 317-318.
[11]. Rowe R.C, Sheskey P.J. and Marian E Quinn. Handbook of Pharmaceutical Excipients. Pharmaceutical Press and American
Pharmacists Association London, 6th edn,2009, 110, 262, 404, 728. [12]. Rouge N, Buri P, Doelker E, Drug absorption sites in the gastrointestinal tract and dosage forms for site-specific 1089 delivery, Int. J.
Pharm, 136, 1996,117–139.
[13]. Desai S. A novel floating controlled release drug delivery system based on a dried gel matrix M.S. thesis. St. John’s,University, Jamaica, NY, (1984) 78-80.
Tests Specifications F optima1 F optima2 Foptima3
1M 2M 3M 1M 2M 3M 1M 2M 3M
Descriptio
n
White to off
white
microcapsules
filled in
transperant size ‘1’ capsules
shells
Comp
lies
Comp
Lies
Compli
es
Compli
es
Comp
Lies
Comp
lies
Compli
es
Comp
Lies
Comp
Lies
Assay
(mg/100mg)
between 20 to 35
mg/100 mg
25.40 24.98 25.00 24.77 24.89 24.64 28.79 27.68 27.54
Targeted
Dissolution profile
0 0 0 0 0 0 0 0 0 0 0
0.5 NMT 10% 6.00 5.99 6.28 8,76 8.57 8.01 7.54 7.00 7.04
1.0 10 – 20% 10.97 10.00 11.43 15,88 13.09 15.54 17.28 16.43 15.98
2.0 15 – 40% 24.78 23.51 27.84 25.32 27.12 28.25 34.08 32.15 35.04
4.0 55 – 75% 63,37 60.43 65.33 70.66 73.07 71.17 72.91 70.69 71.45
8.0 NLT80% (Q) 87.98 87.09 88.96 90.42 93.22 95,24 92.83 89.09 93.65