forest stand modelling as a tool to predict performance … · dynamics of the tree canopy layer...
TRANSCRIPT
479
www.metla.fi/silvafennica · ISSN 0037-5330The Finnish Society of Forest Science · The Finnish Forest Research Institute
SILVA FENNICA Silva Fennica 46(4) research articles
Forest Stand Modelling As a Tool to Predict Performance of the Understory Herb Cornus suecica
Eivind Meen, Anders Nielsen and Mikael Ohlson
Meen, E., Nielsen, A. & Ohlson, M. 2012. Forest stand modelling as a tool to predict performance of the understory herb Cornus suecica. Silva Fennica 46(4): 479–499.
Forest simulation models have been widely used to predict future stand structure. Generally these models do not include the understory vegetation and its response on stand structure change or other environmental factors. Previous simulation studies have shown that stand structure related variables, e.g. basal area, can explain diversity of the forest floor vegetation in boreal forests. We hypothesise that such variables also can be used to explain the performance of understory species and we conceptualise how plant ecology and forest modelling can be combined to predict the performance of understory plants in Norwegian boreal forests. We predict the performance of an understory plant species (Cornus suecica) over time using simu-lated values of forest variables as input to models expressing the relationship between forest environment variables and plant performance variables (viz. plant height, plant dry weight, number of flowers, number of branches and number of leaves). We also present relationships between plant performance and explanatory variables commonly used in basic ecological research, variables that currently not are readily compatible with forest simulators (e.g. soil chemical variables).We found basal area of canopy trees being the most important explana-tory variable explaining C. suecica performance. The performance variable dry weight was predicted by one single model whereas the other performance variables were best predicted by model averaging. Forest simulations for 150 years showed values of plant performance of C. suecica to be reduced during forest succession.
Keywords stand structure dynamics, forest simulator, composite models, field layer, canopy layer, Akaike’s information criterionAddresses Norwegian University of Life Sciences, Department of Ecology and Natural Resource Management, P.O. Box 5003, NO-1432 Ås, Norway E-mail [email protected] 27 February 2012 Revised 9 July 2012 Accepted 10 July 2012Available at http://www.metla.fi/silvafennica/full/sf46/sf464479.pdf
480
Silva Fennica 46(4), 2012 research articles
1 Introduction
Loss of biodiversity is seen as one of the major negative consequence of current forest manage-ment practices (Ohlson et al. 1997, Bengtsson et al. 2000, Wolfslehner and Vacik 2008). Most of the plant biodiversity in boreal forests is located in the understory (Gilliam and Roberts 2003, Halpern and Spies 1995, Økland and Eilertsen 1996) and the dynamics of the understory veg-etation is greatly influenced by the structure and dynamics of the tree canopy layer (Klinka et al. 1996, McKenzie et al. 2000, Miina et al. 2009). Understanding the relationship between forest canopy structure and understory dynamics is therefore important for sustainable forest man-agement and biodiversity conservation (Hart and Chen 2006, Miina et al. 2010). In particular, the species composition and primary production in the understory respond to changes in the availabil-ity of photosynthetically active radiation (PAR) at the forest floor, determined by the structure of the canopy layer (Kellomäki and Väisänen 1991, Van Couwenberghe et al. 2011). In addition, the tree canopy layer affect the understory vegetation through root competition and changed nutrient and water availability (Coomes and Grubb 2000, Légaré et al. 2001). Conversely, the understory community also affects tree growth and canopy succession through a broad range of interference mechanisms that impact tree seed germination and seedling establishment success (Zackrisson et al. 1995, Hörnberg et al. 1997) and nutrient availability (Zavitkovski 1976, Carleton and Read 1991).
Monitoring the relationship between stand structure succession and changes in the understory vegetation is labour intensive and time-consum-ing. In principle a combination of models predict-ing plant performance, viz. a measure of plant growth and reproduction which determine plant viability, and simulations of the forest environ-ment provided by a forest model can potentially be used as a supplement to vegetation monitoring in the field. Forest simulation models are models quantifying annual tree growth, tree establishment and death (Shugart and West 1980), providing information on the structural premises for forest dwelling species. However, Weisberg et al. (2003) point at a common lack of link between math-
ematical models of understory vegetation dynam-ics and forest simulation models. Changes in the understory vegetation can be simulated by gap models (see Peng 2000 for classifications of forest models) in the same way as for the tree canopy, but as stated by McKenzie et al. (2009) this has rarely been done. An operational framework of canopy-understory models may facilitate other ecological modelling issues. Current predictive habitat dis-tribution models relate geographical distribution of species or communities to the present environ-ment, hence, such models are static (Guisan and Zimmermann 2000). Forest simulation models linked to understory plant performance can make predictions of habitat distribution more dynamic by also including forest succession. McKenzie et al. (2009) suggest including empirical models for understory components in forest models until an explicit mechanistic framework is developed. A quantification of plant performance variables is thus important to understand how the under-story vegetation is affected by changes in the tree canopy layer. There is also a need for more knowl-edge about the relationships between understory plant performance and stand structure dynamics in order to develop forest management strategies that can sustain the biodiversity in the understory vegetation.
Based on one focal species, an understory forest plant, the aim for this study is to conceptualize how forest simulations and plant ecology can be combined to predict performance of understory vegetation in boreal forests. We use two types of model selection approaches to increase the under-standing of the relationship between variables describing the forest environment and variables describing the performance of the focal species. The first approach (approach I) is based on a small number of explanatory variables, corresponding to variables derived from the results generated by a chosen forest simulator. The selected plant per-formance models are connected with the derived variables from the forest simulations, predict-ing plant performance during 150 year of stand dynamics. The second approach (approach II) is based on all registered field variables, i.e. not only variables corresponding to the forest simulator results. Assessed on previous simulation studies where stand structure related variables have been found to explain diversity of ground vegetation
481
Meen, Nielsen and Ohlson Forest Stand Modelling As a Tool to Predict Performance of the Understory Herb Cornus suecica
in boreal forests (Kolström and Pitkänen 1999) we state the a priori hypothesis (Thompson III 2010) that stand structure related variables can be sufficient for explaining performance of a plant in the understory.
Our focal understory plant species is the Lap-land Cornel Cornus suecica (L.), which is wide-spread in NW European boreal forests (Hultén and Fries 1986). The general biology of C. suecica is reviewed by Taylor (1999), but surpris-ingly few studies have targeted the species and our knowledge about its ecology in relation to forest dynamics and management is very modest. Actu-ally we know of only a few studies of C. suecica with a forest ecological perspective. In Finland, Kujala (1964) found tree felling not to negatively affect the appearance of C. suecica and in Norway Nygaard and Ødegaard (1999) reported that the occurrence declined with increasing forest stand age. Consequently, by selecting C. suecica as focal species, we will also add to our knowledge about a forest species that has been only little studied so far.
2 Materials and Methods
2.1 Study Species
Cornus suecica has two separate distributions areas, one North Atlantic and one Pacific (Hultén and Fries 1986). In Europe it is mainly found in Scan-dinavia with extensions into Northern British Isles (mainly Scotland) and arctic and subarctic regions of Russia and Iceland. Outlying populations extend southwards to the coastal region of Estonia and Poland, Schleswig-Holstein in north-west Germany and the Netherlands. Outside Europe, the spe-cies occurs in western Greenland, Baffin Island, Quebec, Labrador, Newfoundland, north-eastern and north-western United States, Yukon, Alaska, Aleutian Islands and in far eastern Russia (after Hultén and Fries 1986 and Taylor 1999).
In Scandinavia C. suecica is common through-out the boreal zone, especially on relatively nutri-ent poor soils (Lid et al. 2005). In Norway the species is widespread in Vaccinium myrtillus forests and is a sub-dominant character species in the oceanic influenced Vaccinium myrtillus-
Cornus suecica forest type (Fremstad 1997, Moen 1998). In Finland C. suecica occurs mainly in northern Finland and at the sea coasts in western Finland (Kujala 1964) and is registered to be more frequent and abundant on herb-rich heath sites (V. myrtillus type) than on mesic ones (Lehtelä et al. 1996).
Cornus suecica is a rhizomatous herb with erect, annual stems growing 6–30 cm tall. Inflo-rescences are terminal umbel-like with 8–25 dark purple flowers, each with a short stalk 1–2 mm, surrounded by 4 white ovate involucral bracts (Taylor 1999). Stems and leaves die off in autumn and new shoots develop from buds next year. In the study area flowers of C. suecica are frequently visited by insects, mainly dipterans of the families Muscidae and Empididae (A. Nielsen unpub-lished data).
2.2 Study Area and Collection of Stand Structure Data
To assess relationships between the performance of C. suecica and variables describing the struc-ture of the forest canopy and other aspects of the forest environment (viz. soil chemistry and elevation) we used a study area situated (59°21´N, 9°45´E) in a boreal forest landscape in Telemark County, South Eastern Norway. The study area represents a typical intensively driven Norwegian boreal forest landscape with even aged forest stands consisting mainly of Norway spruce Picea abies (L.) Karst.
Within an area of approximately 3.5 × 2.5 km in size, we selected 25 forest stands, located approx-imately 440 to 530 meters above sea level, rep-resenting the full span in forest maturity classes found in the area; from clear cuts to old growth forest (> 100 years). The stands encapsulated a span in site index from 8 to 17, with the major-ity of plots in site index 14. The site index on each site was retrieved from stand maps made available by the forest owner (Fritzøe Skoger). Site index is the common productivity measure in Norwegian forestry and is defined as mean height at breast height of the dominant trees in a stand at 40 years of age at breast height, rang-ing from 8 to 26 meters for P. abies in Norway (Tveite 1977, Braastad 1980). The tree ages for
482
Silva Fennica 46(4), 2012 research articles
the different maturity classes are (for site index 11, with site index 14 in brackets): Maturity class 1 equals newly logged stands, with no trees of diameter > 5 cm at breast height (1.3 m above ground); maturity class 2: 15–35 (13–30) years; maturity class 3: 35–70 (30–60) years; maturity class 4: 70–100 (60–90) years; maturity class 5: > 100 (> 90) years.
Within each forest stand we selected a sampling plot based on the presence of three plant spe-cies, namely Vaccinium myrtillus (L.), Cornus suecica and Melampyrum pratense (L.). If a forest stand contained more than one appropriate study plot, one study plot was randomly selected. The forest surrounding the sampling plot was meas-ured in two separate ways. First, the number of trees within a radius of 5.6 meters (100 m2) was counted to quantify the density of the forest on a small scale. Second, the number of trees per spe-cies and their basal area on a 10 000 m2 scale was registered using a relascope (Bitterlich 1984). The trees selected by the relascope were also used to calculate average height weighted by basal area. At both scales only trees with diameter larger than 5 cm at 1.3 m breast height (dbh) were included. All sampling and measurements were done during the summer of 2003. See Nielsen et al. (2007) for further details on the study area.
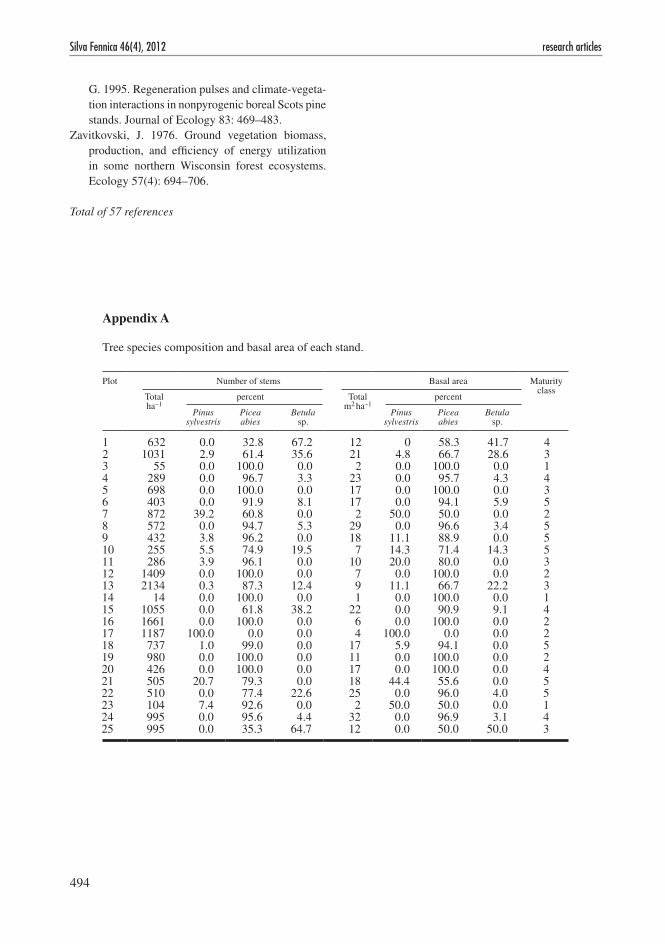
Picea abies was present in 24 out 25 stands, ranging from 33 percent to 100 percent in stem number of all trees, and ranging from 50 to 100 percent of total basal area (appendix A). In 18 stands P. abies counted for two thirds of the basal area. Pinus sylvestris (L.) was present in 9 plots with relatively higher proportion of basal area than number of trees. Betula sp. (B. pendula (L.) and B. pubescens (Ehrh.)) did not show a consistent pattern of high abundance in young stands. For instance, in 2 of 5 plots of maturity class 3 (young production forest) Betula sp. were not present. The heterogeneity in tree species composition was considered to be too small to be included as a biological meaningful variable in the data analysis.
2.3 Quantifying Plant Performance
Performance variables were measured by sam-pling 10 flowering stalks of C. suecica per study
site, selected at regular intervals along a 10 meter line. The line was laid out with approximately 5 m to each side of the plot, in the direction of the slope surrounding the plot. On each flower-ing stalk vegetative performance variables, i.e. number of branches, number of leaves, plant height and plant dry weight, and generative performance variables, i.e. number of flowers and number of berries, were registered. Only above ground plant parts were measured. Average values over the 10 flowering stalks were used for all estimates of plant performance within each plot. See Nielsen et al. (2007) for details on the sampling protocol.
2.4 Soil Analyses
Soil samples were collected for chemical analysis in October 2003. The samples included the whole organic topsoil down to the underlying mineral soil. A metal tube (5.5 cm in diameter) was used to collect 10 samples of soil along the 10 meter line used in the plant sampling. Living green plant parts (mainly bryophytes) and larger root and rhizome fragments were removed prior to analysis. The soil samples were analysed for loss-on-ignition (LOI), total carbon (C), total nitrogen (N), pH and extractable ammonium (NH4
+) and nitrate (NO3
–) at the Soil Science Laboratory at the Swedish University of Agricultural Sciences, Umeå, Sweden, using standard methods following Emteryd (1989).
2.5 Data Analysis
To establish the relationship between measure-ments of plant performance and forest environ-ment variables we used multiple linear regression. As explanatory variables describing the stand structure we used maturity class, number of trees on the 100 m2 scale, basal area of trees per hectare (basal area), basal area based mean tree height, basal area mean tree diameter (mean of diameters of trees registered by the relascope, hereafter termed diameter at breast height or dbh), site index (SI), stand density index (SDI) and the GINI coefficient. SDI is calculated as (basal area * number of trees)0.5 sensu Weisberg et al. (2003). The GINI coefficient is a measure of heterogene-
483
Meen, Nielsen and Ohlson Forest Stand Modelling As a Tool to Predict Performance of the Understory Herb Cornus suecica
ity quantifying the deviation from perfect equality (Gini 1912) and has been recommended as an objective measure to compare tree size diversity in different stands (Lexerød and Eid 2006). We used tree size expressed as diameter at breast height given by
∑
∑
( )
( )=
− −
−
=
=
n ba
ba nGINI
2 j 1
1(1)j
nj
jn
j
1
1
where j is the rank of a tree by diameter class in ascending order from 1, …, n; n is total number of trees, baj is basal area for tree with rank j (m2 ha−1). At the minimum value zero all trees are of equal size. At the theoretical maximum of one all trees except one have a value of zero (after Lexerød and Eid 2006).
In addition to variables describing stand struc-ture and soil properties, altitude (meters above sea level) was included as explanatory variable. We did not find interpretable biological reasons for including interactions among the independ-ent variables in our candidate models. Pearson’s correlation test revealed loos-on-ignition and total carbon, and basal area weighted tree height and dbh to be highly correlated (r = 0.98 and r = 0.94, respectively). Because basal area weighted tree height is calculated from dbh, dbh was considered the most relevant variable. Among total carbon and LOI, the latter was excluded from all analy-sis. Correlated variables (Pearson r > 0.5 with P < 0.05) were discounted.
We used visual inspection and numerical meth-ods provided by the Capability procedure in SAS 9.2 (SAS 2008) to assess whether the plant per-formance response variables followed a normal distribution. The vegetative performance variables (plant dry weight, number of leaves, plant height and number of branches) were considered to be normally distributed, except for number of ber-ries. Number of berries was therefore not included in the ordinary least square regression analysis. Model selection was performed by Akaike’s infor-mation criterion (Akaike 1974). Because the ratio of sample size (n = 25) and number of parameters is low (< 40) the models were ranked by second order AIC, named AICc (Sugiura 1978).
According to the two approaches described in the introduction, each response variable was
explained by two sets of AICc-ranged models. Approach I includes models with explanatory variables being compatible with the output vari-ables given by the forest simulator (see section 2.6). Here, each variable is a priori assumed to affect plant performance in the understory. Basal area and dbh of trees express continuity of the canopy and light conditions, stand density index express light conditions, site index reflects nutri-ent, moisture and climatic conditions and altitude is interpreted as a temperature gradient, affecting the start and extent of the of growing season. Approach II comprises models explaining the variation in C. suecica based on all 14 available parameters.
When the aim of AIC-ranked models is pre-diction, model averaging is recommended to increase precision and to reduce bias (Burnham 2002). For the model sets used with the forest simulator, where the objective was prediction of plant performance (approach I), models within ΔAICc ≤ 2 were included in a composite model, calculated by model averaging. The cut-off level for inclusion in the composite model was set where the ΔAICc value equals an evidence ratio of approximately 2.7. As the ΔAICc value exceeds two units the ratio augments rapidly. The evidence ratio between the highest ranked model and the ith model is given as
= = ( )( )−E w w e/ (2)high i high i.1/2 Δi
where whigh is the weight (Akaike weights) for the highest ranked model, wi is the weight for the ith model and Δi is the difference in ΔAICc value (Anderson 2008). The Akaike weight, estimate of the probability of model i being the Kullback-Leibler best model given the data and the model set (i.e. the set of models included in the com-posite model) is
∑
( )( )
=−
−=
wexp 1
2Δ
exp 12Δ
(3)ii
r r1R
where Δi and Δr are ΔAICc values for model i and all models in the model set, respectively (Anderson 2008).
Precision of estimators in the composite models was estimated by an unconditional variance estimator
484
Silva Fennica 46(4), 2012 research articles
incorporating both sampling variance, dependent on a given model, and a variance component for model selection uncertainty, expressed as
∑θ θ θ θ( ) ( )( )= + −=
var w gvar ˆ | ˆ (4)i
R
i i i1
2
where R is the number of models included in the composite model, θ̂ is the model estimate given gi, where gi is the ith model, θ̂i is the estimate for model i, and θ is the model averaged estimate and wi are the Akaike weights (Anderson 2008).
Analysis of covariance (ANCOVA) was used to assess whether plant height of C. suecica should be interpreted as normal growth or induced by reduced light availability. SAS version 9.2 (SAS 2008) was used for statistical analysis and model selection, while figures were generated in R 2.10.0 (R-Development Core Team 2010).
2.6 Ecological Forest Simulation Model
The ecological forest simulation model SIMA (Kellomäki et al. 1992a, 1992b) was used to simulate future stand structure. SIMA was chosen as it is one of few gap models that satisfactory pre-dicts basal area and volume increment of P. abies (Kolström 1998, Perry and Millington 2008). Tree data are entered into the model as diameter at breast height for single trees. Temperature and precipitation are entered as monthly means with standard deviations and the output of the model is given as yearly number of trees per diameter class (one cm intervals).
Transformation of tree data obtained in the field (relascope measurements on one hectare scale) into the input format required by the forest simulator (whole trees per diameter class on a 100 m2 scale) resulted in unwanted deviations from the original field data. Therefore, we decided not to use the tree data representing the plots. Hence, tree data and climate variables to the forest simu-lator were obtained from the permanent sample plots of the Norwegian National Forest Inventory (NFI, Tomter et al. 2010), collected by The Nor-wegian Forest and Landscape Institute, round 6 (year 1990). Among NFI stands in South Eastern Norway, where site index, vegetation type, tree species composition and altitude closely corre-
spond to the plots in the field study, six P. abies dominated stands were selected. The stands had intermediate production capacity (site index 14) with age around 35–40 years, i.e. younger produc-tion forest (maturity class 3). The development of the stands was simulated without any forest activ-ity, e.g. cuttings or fertilization, for 150 years. The stands were assumed to be naturally regenerated. From the output given by the forest simulator, yearly values of relevant explanatory variables were calculated and implemented in the selected regression models, enabling predictions of plant performance over a period of 150 years.
3 Results
3.1 Selection of Models Corresponding to the Forest Simulator (Approach I)
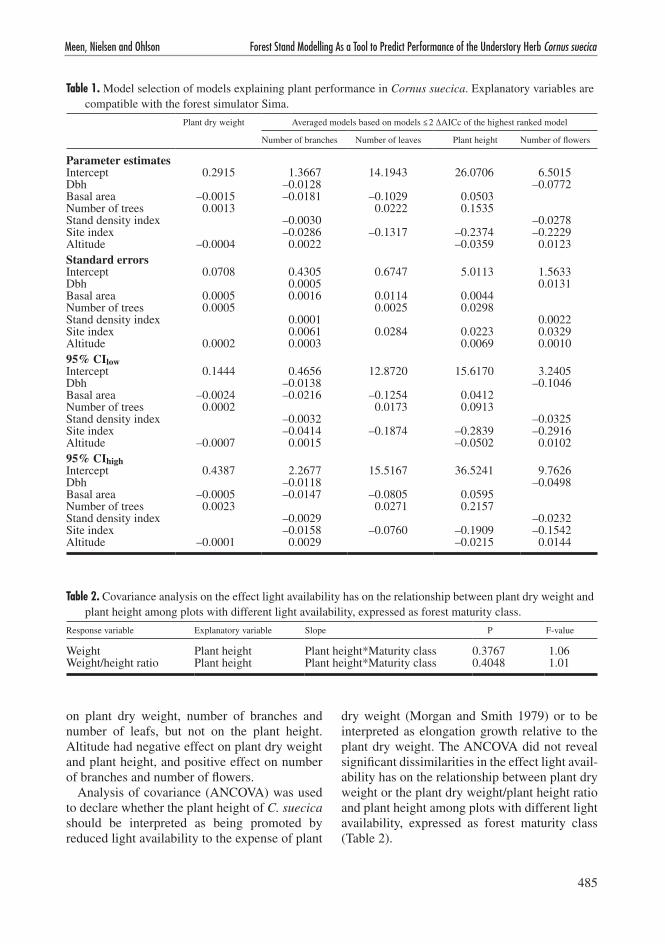
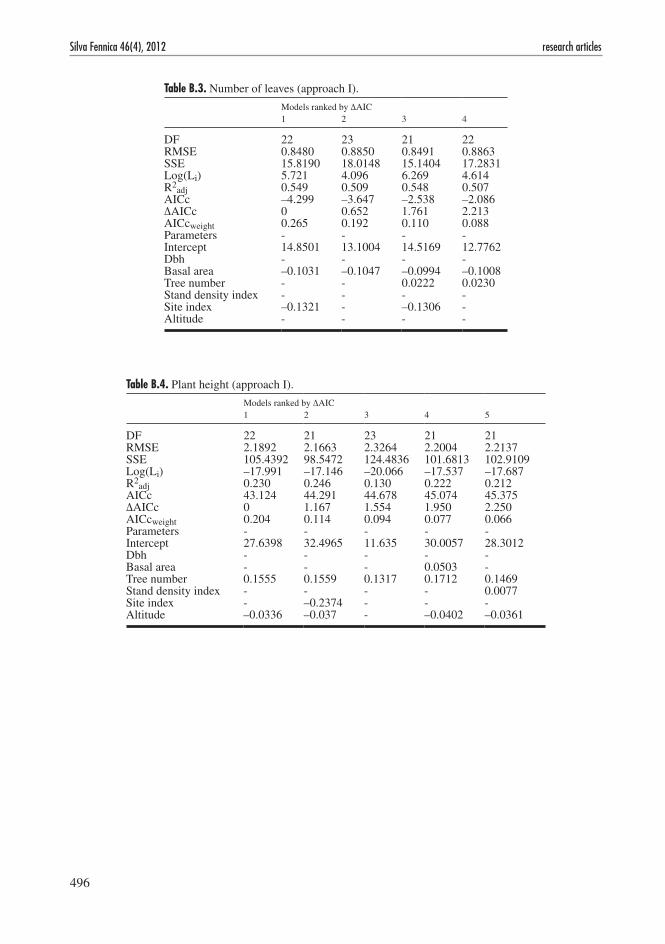
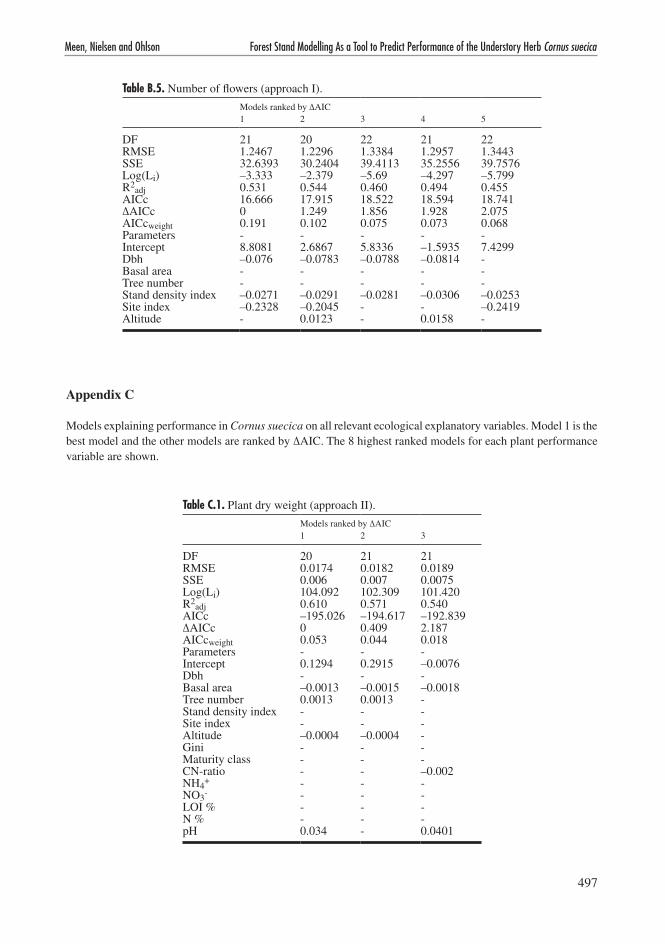
This approach is based on explanatory variables that correspond to variables produced by the forest simulator and variables that are constant for a given site (i.e. altitude and site index). The models were ranked by the AICc-scores (AIC-ranking is shown in appendix B). The highest ranked model explaining plant dry weight con-tained the variables altitude, number of trees and basal area (Table 1), and reasoned in the ΔAICc value of 2.34, model averaging was not performed (see section 2.5). Plant dry weight was the response variable being clearest predicted by one single model whereas the other response variables were predicted by composite models.
Number of leaves was explained by a composite model based on three models within ΔAICc ≤ 2 and an accumulated AICcweight of 0.567 (see section 2.5 for calculation of Akaike weights). A compos-ite model of four models explained the variation in number of flowers (AICcweight = 0.441), number of branches (AICcweight = 0.544) and plant height (AICcweight = 0.489).
In all selected models (highest ranked or com-posite models) where the variables were present the variables diameter at breast height, stand den-sity index and site index had negative effects. On the contrary, number of trees had positive effect in all models the variable was present. Increased basal area of trees per hectare had negative impact
485
Meen, Nielsen and Ohlson Forest Stand Modelling As a Tool to Predict Performance of the Understory Herb Cornus suecica
on plant dry weight, number of branches and number of leafs, but not on the plant height. Altitude had negative effect on plant dry weight and plant height, and positive effect on number of branches and number of flowers.
Analysis of covariance (ANCOVA) was used to declare whether the plant height of C. suecica should be interpreted as being promoted by reduced light availability to the expense of plant
dry weight (Morgan and Smith 1979) or to be interpreted as elongation growth relative to the plant dry weight. The ANCOVA did not reveal significant dissimilarities in the effect light avail-ability has on the relationship between plant dry weight or the plant dry weight/plant height ratio and plant height among plots with different light availability, expressed as forest maturity class (Table 2).
Table 1. Model selection of models explaining plant performance in Cornus suecica. Explanatory variables are compatible with the forest simulator Sima.
Plant dry weight Averaged models based on models ≤ 2 ΔAICc of the highest ranked model
Number of branches Number of leaves Plant height Number of flowers
Parameter estimatesIntercept 0.2915 1.3667 14.1943 26.0706 6.5015Dbh –0.0128 –0.0772Basal area –0.0015 –0.0181 –0.1029 0.0503Number of trees 0.0013 0.0222 0.1535Stand density index –0.0030 –0.0278Site index –0.0286 –0.1317 –0.2374 –0.2229Altitude –0.0004 0.0022 –0.0359 0.0123Standard errorsIntercept 0.0708 0.4305 0.6747 5.0113 1.5633Dbh 0.0005 0.0131Basal area 0.0005 0.0016 0.0114 0.0044Number of trees 0.0005 0.0025 0.0298Stand density index 0.0001 0.0022Site index 0.0061 0.0284 0.0223 0.0329Altitude 0.0002 0.0003 0.0069 0.001095% CIlowIntercept 0.1444 0.4656 12.8720 15.6170 3.2405Dbh –0.0138 –0.1046Basal area –0.0024 –0.0216 –0.1254 0.0412Number of trees 0.0002 0.0173 0.0913Stand density index –0.0032 –0.0325Site index –0.0414 –0.1874 –0.2839 –0.2916Altitude –0.0007 0.0015 –0.0502 0.010295% CIhighIntercept 0.4387 2.2677 15.5167 36.5241 9.7626Dbh –0.0118 –0.0498Basal area –0.0005 –0.0147 –0.0805 0.0595Number of trees 0.0023 0.0271 0.2157Stand density index –0.0029 –0.0232Site index –0.0158 –0.0760 –0.1909 –0.1542Altitude –0.0001 0.0029 –0.0215 0.0144
Table 2. Covariance analysis on the effect light availability has on the relationship between plant dry weight and plant height among plots with different light availability, expressed as forest maturity class.
Response variable Explanatory variable Slope P F-value
Weight Plant height Plant height*Maturity class 0.3767 1.06Weight/height ratio Plant height Plant height*Maturity class 0.4048 1.01
486
Silva Fennica 46(4), 2012 research articles
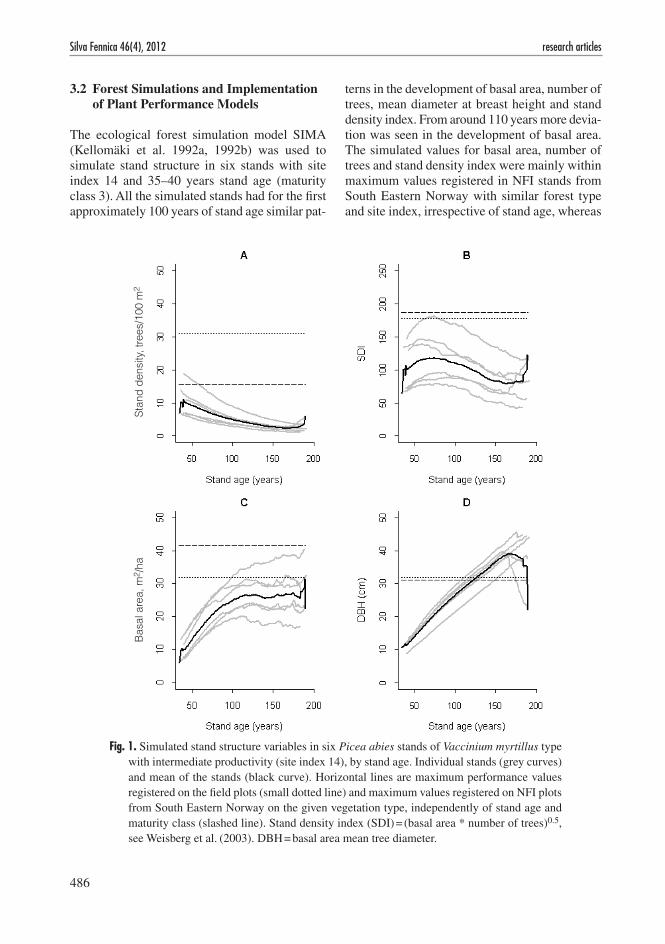
3.2 Forest Simulations and Implementation of Plant Performance Models
The ecological forest simulation model SIMA (Kellomäki et al. 1992a, 1992b) was used to simulate stand structure in six stands with site index 14 and 35–40 years stand age (maturity class 3). All the simulated stands had for the first approximately 100 years of stand age similar pat-
terns in the development of basal area, number of trees, mean diameter at breast height and stand density index. From around 110 years more devia-tion was seen in the development of basal area. The simulated values for basal area, number of trees and stand density index were mainly within maximum values registered in NFI stands from South Eastern Norway with similar forest type and site index, irrespective of stand age, whereas
Fig. 1. Simulated stand structure variables in six Picea abies stands of Vaccinium myrtillus type with intermediate productivity (site index 14), by stand age. Individual stands (grey curves) and mean of the stands (black curve). Horizontal lines are maximum performance values registered on the field plots (small dotted line) and maximum values registered on NFI plots from South Eastern Norway on the given vegetation type, independently of stand age and maturity class (slashed line). Stand density index (SDI) = (basal area * number of trees)0.5, see Weisberg et al. (2003). DBH = basal area mean tree diameter.
Basa
l are
a, m
2 /ha
Stan
d de
nsity
, tre
es/1
00 m
2

487
Meen, Nielsen and Ohlson Forest Stand Modelling As a Tool to Predict Performance of the Understory Herb Cornus suecica
diameter at breast height (basal area mean tree diameter) exceeded maximum registered NFI and field values when the simulated stands reached 100–150 years (Fig. 1).
Based on the output given by the forest simula-tor yearly values of explanatory variables were calculated and implemented into the selected regression models (section 3.1), enabling pre-dictions of the performance in C. suecica over a period of time. For the first 50–60 years of simulation (i.e. approximately 90–100 years stand
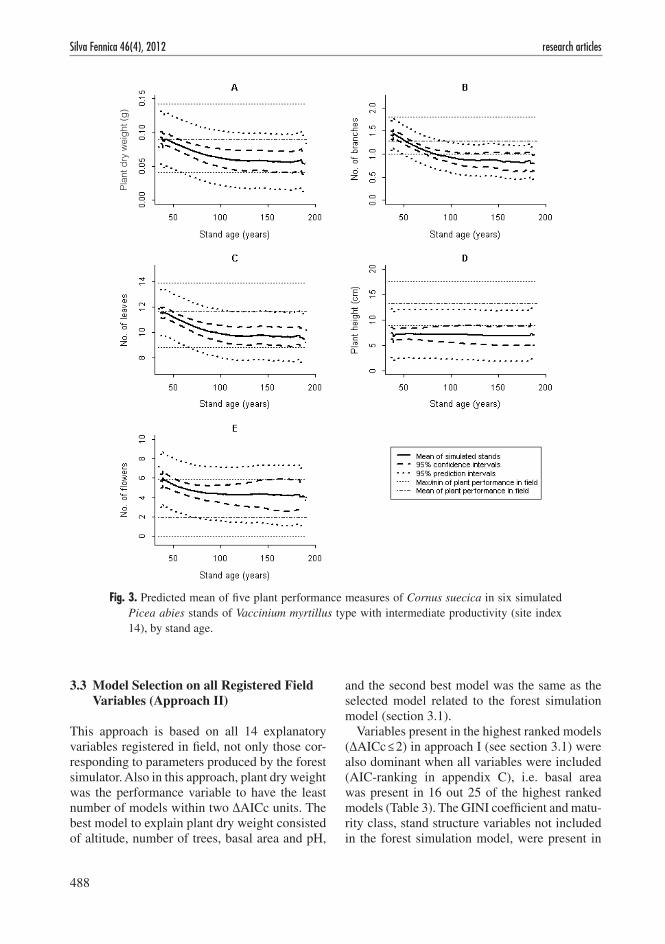
age) the development in stand structure implied generally a reduction in plant dry weight, number of leaves, number of branches and number of flowers.The following 50–60 years, i.e. up to stand age of approximately 190 years, the per-formance values generally fluctuated around a relatively stable level (Fig. 2). The uncertainty of predicted performance values, measured as confidence intervals on the mean, increased by simulation time (Fig. 3).
Fig. 2. Predicted development of five plant performance measures of Cornus suecica in six simulated Picea abies stands of Vaccinium myrtillus type with intermediate productivity (site index 14), by stand age.
Plan
t dry
wei
ght (
g)
488
Silva Fennica 46(4), 2012 research articles
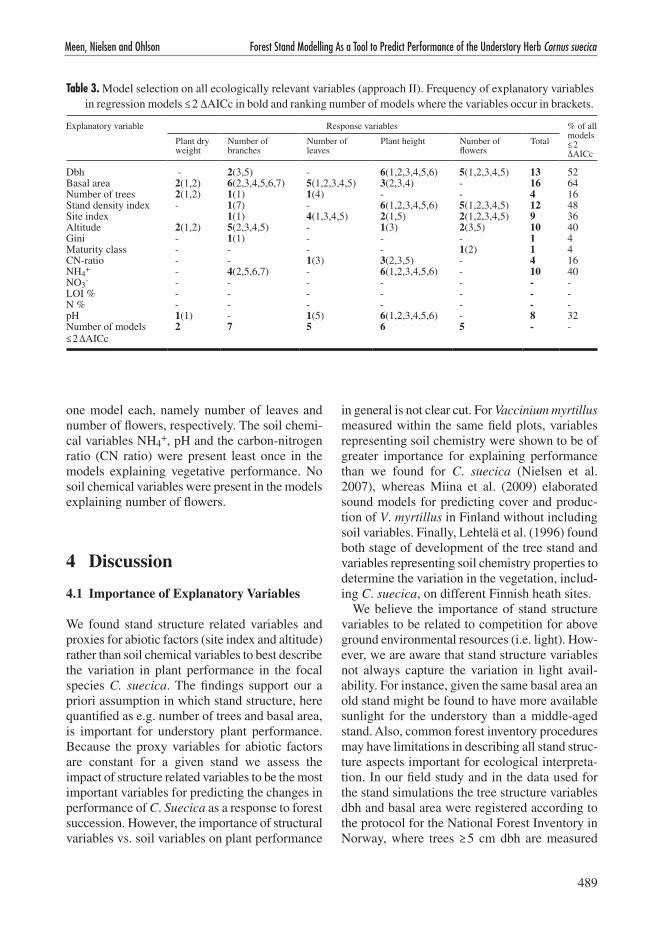
3.3 Model Selection on all Registered Field Variables (Approach II)
This approach is based on all 14 explanatory variables registered in field, not only those cor-responding to parameters produced by the forest simulator. Also in this approach, plant dry weight was the performance variable to have the least number of models within two ΔAICc units. The best model to explain plant dry weight consisted of altitude, number of trees, basal area and pH,
and the second best model was the same as the selected model related to the forest simulation model (section 3.1).
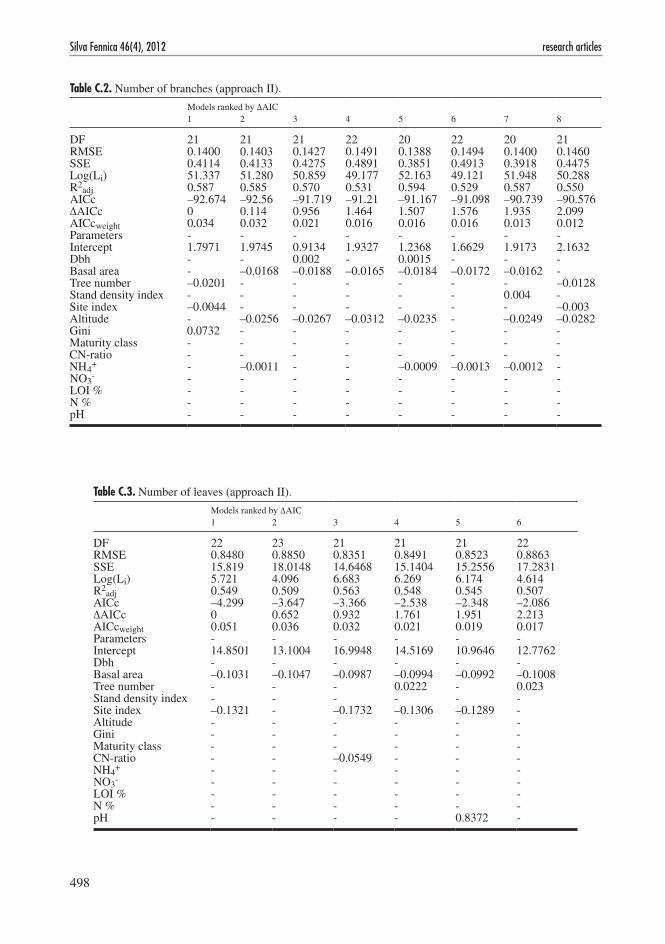
Variables present in the highest ranked models (ΔAICc ≤ 2) in approach I (see section 3.1) were also dominant when all variables were included (AIC-ranking in appendix C), i.e. basal area was present in 16 out 25 of the highest ranked models (Table 3). The GINI coefficient and matu-rity class, stand structure variables not included in the forest simulation model, were present in
Fig. 3. Predicted mean of five plant performance measures of Cornus suecica in six simulated Picea abies stands of Vaccinium myrtillus type with intermediate productivity (site index 14), by stand age.
Plan
t dry
wei
ght (
g)
489
Meen, Nielsen and Ohlson Forest Stand Modelling As a Tool to Predict Performance of the Understory Herb Cornus suecica
one model each, namely number of leaves and number of flowers, respectively. The soil chemi-cal variables NH4
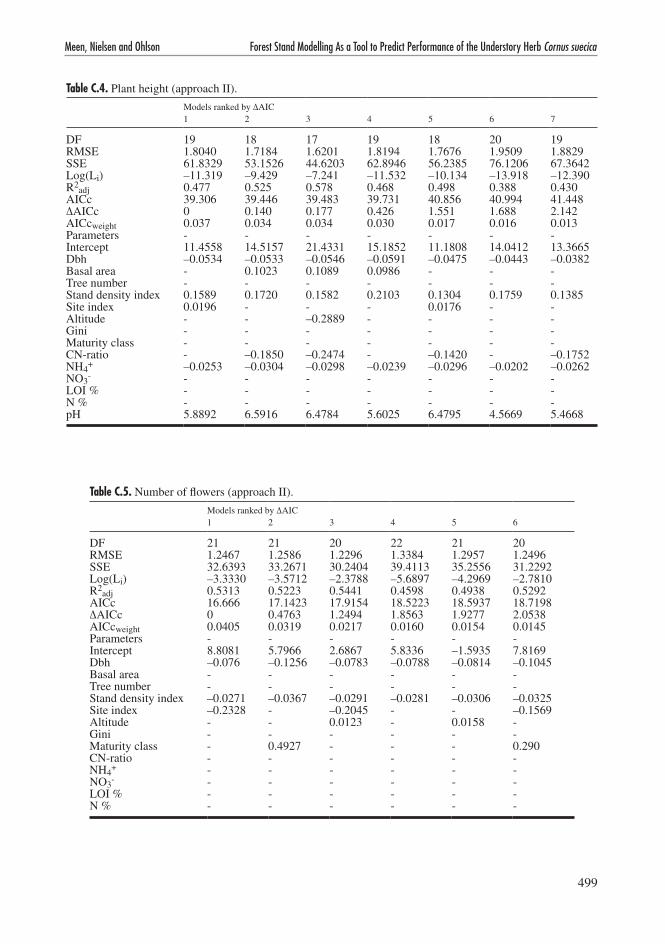
+, pH and the carbon-nitrogen ratio (CN ratio) were present least once in the models explaining vegetative performance. No soil chemical variables were present in the models explaining number of flowers.
4 Discussion
4.1 Importance of Explanatory Variables
We found stand structure related variables and proxies for abiotic factors (site index and altitude) rather than soil chemical variables to best describe the variation in plant performance in the focal species C. suecica. The findings support our a priori assumption in which stand structure, here quantified as e.g. number of trees and basal area, is important for understory plant performance. Because the proxy variables for abiotic factors are constant for a given stand we assess the impact of structure related variables to be the most important variables for predicting the changes in performance of C. Suecica as a response to forest succession. However, the importance of structural variables vs. soil variables on plant performance
in general is not clear cut. For Vaccinium myrtillus measured within the same field plots, variables representing soil chemistry were shown to be of greater importance for explaining performance than we found for C. suecica (Nielsen et al. 2007), whereas Miina et al. (2009) elaborated sound models for predicting cover and produc-tion of V. myrtillus in Finland without including soil variables. Finally, Lehtelä et al. (1996) found both stage of development of the tree stand and variables representing soil chemistry properties to determine the variation in the vegetation, includ-ing C. suecica, on different Finnish heath sites.
We believe the importance of stand structure variables to be related to competition for above ground environmental resources (i.e. light). How-ever, we are aware that stand structure variables not always capture the variation in light avail-ability. For instance, given the same basal area an old stand might be found to have more available sunlight for the understory than a middle-aged stand. Also, common forest inventory procedures may have limitations in describing all stand struc-ture aspects important for ecological interpreta-tion. In our field study and in the data used for the stand simulations the tree structure variables dbh and basal area were registered according to the protocol for the National Forest Inventory in Norway, where trees ≥ 5 cm dbh are measured
Table 3. Model selection on all ecologically relevant variables (approach II). Frequency of explanatory variables in regression models ≤ 2 ΔAICc in bold and ranking number of models where the variables occur in brackets.
Explanatory variable Response variables % of all models ≤ 2 ΔAICc
Plant dry weight
Number of branches
Number of leaves
Plant height Number of flowers
Total
Dbh - 2(3,5) - 6(1,2,3,4,5,6) 5(1,2,3,4,5) 13 52Basal area 2(1,2) 6(2,3,4,5,6,7) 5(1,2,3,4,5) 3(2,3,4) - 16 64Number of trees 2(1,2) 1(1) 1(4) - - 4 16Stand density index - 1(7) - 6(1,2,3,4,5,6) 5(1,2,3,4,5) 12 48Site index 1(1) 4(1,3,4,5) 2(1,5) 2(1,2,3,4,5) 9 36Altitude 2(1,2) 5(2,3,4,5) - 1(3) 2(3,5) 10 40Gini - 1(1) - - - 1 4Maturity class - - - - 1(2) 1 4CN-ratio - - 1(3) 3(2,3,5) - 4 16NH4
+ - 4(2,5,6,7) - 6(1,2,3,4,5,6) - 10 40NO3
- - - - - - - -LOI % - - - - - - -N % - - - - - - -pH 1(1) - 1(5) 6(1,2,3,4,5,6) - 8 32Number of models ≤ 2 ΔAICc
2 7 5 6 5 - -
490
Silva Fennica 46(4), 2012 research articles
and registered by species (Tomter 2010). The total number of trees per species might have been underreported and the common pattern of a higher fraction of deciduous trees in the early phases of succession is not clearly seen. For instance, all stands in the early succession stages (maturity class 2) were registered with only P. sylvestris and P. abies. Also two out of five stands in matu-rity class 3 had no presence of deciduous trees (appendix A). Because of generally low measured variation in tree species between stands tree spe-cies were not used as an explanatory variable. However, for this conceptual study we believe the stand structure variables have the quality to give basal information on performance of a little studied understory species.
4.2 Simulated Stand Structure
We have shown how temporal change in plant per-formance in an understory species, C. suecica, can be estimated through time by supplying models on plant performance with yearly site specific parameter values, produced by a forest simulator. The general reduction in measured plant perfor-mance (except for plant height) in spruce domi-nated stands, up to the stand age of around 100 years, is mainly driven by a decrease in number of trees and increase in basal area and mean dbh.
The simulated values for number of trees, site density index and basal area were mainly within maximum registered NFI and field values, whereas dbh (basal area mean tree diameter) exceeded the registered values after 100–150 years stand age. One reason for the deviations between simulated values and maximum regis-tered NFI and field values might be because the simulations were performed with natural genera-tion and without forest management, such as tree planting, thinning or cutting whereas forest stands registered in NFI and in the field are subject to forest management. In addition, imperfections in the forest simulator may have contributed to the observed deviations. However, validation of the forest modelling performance per se has not been focused in this study. Based on published model validation and simulation studies of this model (Kellomäki 1992a, 1992b, Kolström 1998, Kel-lomäki et al. 2006) we conclude that the simulated
values are realistic for the purpose of this study and therefore applicable for assessing the perfor-mance of an understory species in a Norwegian boreal forest ecosystem.
4.3 The Ecology of Cornus suecica
Increased basal area leads to denser crown cover and reduced light availability in the understory. The negative impact of basal area on the perfor-mance C. suecica found in this study is in line with Nygaard and Ødegaard (1999) who found the frequency of C. suecica to decrease by increas-ing living stem biomass of P. abies. We therefore conclude that basal area is an important measure of the ecological impact canopy trees have on the performance of C. suecica. Our results correspond also to those of Nielsen et al. (2007) on V. myrtil-lus in the same area, showing that most measures of performance peaked in early stages of forest succession. For V. myrtillus, the performance responses are however, ambiguous. Kardell and Erikson (1995) found optimal performance of V. myrtillus to increase with forest maturity in Swed-ish boreal forests and Parlane et al. (2006) found the same in Pinus sylvestris forests in Scotland, In Finland and Sweden Palviainen et al. (2005) found biomass of V. myrtillus to decrease rapidly after clear-cutting, whereas Miina et al. (2009) found the coverage of V. myrtillus to increase with increased basal area and stand age up to the age of 191 years and density of 25 m2 ha–1, after which the coverage gradually decreased. Because of few studies focusing on C. suecica related to stand structure the standard of reference is limited and similar specific reports as on V. myrtillus are not known.
Few available studies limit also the comparison of soil chemical parameters and we have only found references for pH. The measured range of pH 4.19–5.03 in our study is in line with Taylor (1999) where C. suecica usually was found on soils with pH < 4.5 whereas Sonesson (1974) measured pH to 4.0–5.1.
Cornus suecica has both vegetative and sexual propagation (Taylor 1999) and population sur-vival is not depending solely on seed produc-tion. Hence, we assess measures of vegetative performance to be as important indicators of
491
Meen, Nielsen and Ohlson Forest Stand Modelling As a Tool to Predict Performance of the Understory Herb Cornus suecica
the species’ performance as measures of sexual reproduction, as has been shown also for other plant species e.g. (Nielsen et al. 2007). We also assess measures of sexual production, particularly number of fruits, to be more affected by casual climate effects such as cold or rainy conditions. Because increased plant weight comes prior to branching we assess plant dry weight to be the performance variable with the most straight for-ward biological interpretation. Contrary, variation in plant height in understory species should gen-erally be interpreted with care, as reduced light availability may promote elongation growth to the expense of plant dry weight (Morgan and Smith 1979). However, forest maturity class, used as a proxy for crown cover and light availability, did not explain variations in plant dry weight or plant weight/height ratio with respect to plant height. We conclude that the measured plant height is not an artefact of elongation induced by reduced light availability but rather is an adequate measure of plant performance. Measured plant height is thus interpreted to be elongation growth accompanied by stable dry mass content and not elongation accompanied by relatively less dry mass.
In Norwegian forestry, P. abies stands with site index of 14, like the sites we have modelled, will likely be cut at around 100 years stand age. The subsequent increase in light availability, i.e. low basal area of trees, will lead to higher values of plant performance variables. Hofgaard et al. (1991) reported C. suecica to disappear from a permanent plot in an old growth forest in northern Sweden between 1938 and 1983 because of insuf-ficient light availability. The plots in our study are however, chosen on the presence of C. suecica, and hence we do not have appropriate data for predicting when the canopy is too dense for the presence of C. suecica.
5 Concluding Remarks
We draw four main conclusions from the results. First, we conclude that for our system models consisting only of stand structure related vari-ables suffice to explain and predict variation in the performance of forest floor species C. suecica. Second, we found evidence for reduced
plant performance of C. suecica during forest succession, simulated for 150 years. Third, the negative impact of basal area on the performance C. suecica found in this study is in line with a previous study on C. suecica. Fourth, traditional ecology and forest simulations can be combined to produce sound predictions on how plant perfor-mance might change as a response to changes in the overstory. To develop the concept further also data on species performance specifically related to measured stand structure specified by tree species < 5 cm dbh is recommended. A further step will be to include forest management strategies in the forest simulations, as has been done with biodi-versity indices (Kolström and Pitkänen 1999) and abundance and berry yields of V. myrtillus (Miina et al. 2009, Miina et al. 2010).
The current version of SIMA simulates growth of the understory as three aggregated groups, categorized by succession appearance (Kellomäki et al. 1992a, 1992b). This ensures that some of the competition between the trees and understory is accounted for, but not on a per species basis. Ideally, to improve the accuracy of simulations feedback mechanisms between understory spe-cies and the trees forming the canopy should be implemented in simulation models.
References
Akaike, H. 1974. A new look at the statistical model identification. IEEE Transactions on Automatic Control AC 19(6): 716–723.
Anderson, D.R. 2008. Model based inference in the life sciences: a primer on evidence. Springer Verlag, New York.
Bengtsson, J., Nilsson, S.G., Franc, A. & Menozzi, P. 2000. Biodiversity, disturbances, ecosystem func-tion and management of European forests. Forest Ecology and Management 132(1): 39–50.
Bitterlich, W. 1984. The relascope idea: relative meas-urements in forestry. Commonwealth Agricultural Bureaux, Farnham.
Braastad, H. 1980. Growth model computer program for Pinus sylvestris. Meddelelser fra Norsk institutt for skogforskning 35(5): 272–359.
Burnham, K.P. 2002. Model selection and multi-model inference: a practical information-theoretic
492
Silva Fennica 46(4), 2012 research articles
approach. Springer, New York. 488 p.Carleton, T.J. & Read, D.J. 1991. Ectomycorrhizas and
nutrient transfer in conifer-feather moss ecosys-tems. Canadian Journal of Botany 69(4): 778–785.
Coomes, D.A. & Grubb, P.J. 2000. Impacts of root competition in forests and woodlands: a theoretical framework and review of experiments. Ecological Monographs 70(2): 171–207.
Emteryd, O. 1989. Chemical and physical analysis of inorganic nutrients in plant, soil, water and air. Swedish University of Agricultural Sciences, Department of Forest Site Research, Umeå.
Fremstad, E. 1997. Vegetasjonstyper i Norge. Vol. 12. NINA temahefte.
Gilliam, F.S. & Roberts, M.R. (eds.). 2003. The her-baceous layer in forests of eastern North America. Oxford University Press, Oxford, United Kingdom.
Gini, C. 1912. Variabilità e mutabilità. Reprinted in: Pizetti, E. & Salvemini, T. (eds.). 1955. Memorie di metodologica statistica.
Guisan, A. & Zimmermann, N.E. 2000. Predictive habitat distribution models in ecology. Ecological Modelling 135(2–3): 147–186.
Halpern, C.B. & Spies, T.A. 1995. Plant species diver-sity in natural and managed forests of the Pacific Northwest. Ecological Applications 5(4): 913–934.
Hart, S. & Chen, H. 2006. Understory vegetation dynamics of North American boreal forests. Criti-cal Reviews in Plant Sciences 25(4): 381–397.
Hofgaard, A., Kullman, L. & Alexandersson, H. 1991. Response of old-growth montane Picea abies (L.) Karst. forest to climatic variability in Northern Sweden. New Phytologist 119(4): 585–594.
Hörnberg, G., Ohlson, M. & Zackrisson, O. 1997. Influence of bryophytes and microrelief conditions on Picea abies seed regeneration patterns in boreal old-growth swamp forests. Canadian Journal of Forest Research 27(7): 1015–1023.
Hultén, E. & Fries, M. 1986. Atlas of North Euro-pean vascular plants north of the Tropic of Cancer. Koeltz Scientific Books, Königstein.
Kardell, L. & Eriksson, L. 1995. Bärproduktion och markvegetation. Effekter av kvävegödsling och slutavverkning under en 15-årsperiod. Swedish University of Agricultural Sciences, Department of Environmental Forestry, SLU Rapport 60. (In Swedish).
Kellomäki, S. & Väisänen, H. 1991. Application of a gap model for the simulation of forest ground vegetation in boreal conditions. Forest Ecology
and Management 42(1–2): 35–47.— , Strandman, H., Nuutinen, T., Peltola, H.,
Korhonen, K.T. & Väisänen, H. 2006. SYKEmo334 Adaptation of forest ecosystems, forests and for-estry to climate change. Finnish Environment 1: 10.
— , Väisänen, H., Hänninen, H., Kolström, T., Lau-hanen, R., Mattila, U. & Pajari, B. 1992a. SIMA: a model for forest succession based on the carbon and nitrogen cycles with application to silvicultural management of the forest ecosystem. Silva Carelica 22: 185.
— , Väisänen, H., Hänninen, H. Kolström, T. Lau-hanen, R. Mattila, U. & Pajari, B. 1992b. A simula-tion model for the succession of the boreal forest ecosystem. Silva Fennica 26: 1–18.
Klinka, K., Chen, H.Y., Wang, Q. & DeMontigny, L. 1996. Forest canopies and their influence on understory vegetation in early-seral stands on west Vancouver Island. Northwest Science 70: 193–200.
Kolström, M. 1998. Ecological simulation model for studying diversity of stand structure in boreal for-ests. Ecological Modelling 111(1): 17–36.
— & Pitkänen, S. 1999. Effect of forest management on alpha diversity of ground vegetation in boreal forests: a model approach. Boreal environment research 4(1): 45–54.
Kujala, V. 1964. Metsä-ja suokasvilajien levinneisyysja yleisyyssuhteista Suomessa: vuosina 1951–1953 suoritetun valtakunnan metsien III linja-arvioinnin tuloksiaMetsä-ja suokasvilajien levinneisyysja yleisyyssuhteista Suomessa: vuosina 1951–1953 suoritetun valtakunnan metsien III linja-arvioinnin tuloksia. Referat: Über die Frequenzverthältnisse der Wald-und Moorpflanzen in Finnland − Ergeb-nisse der III. Reichswaldabschätzung 1951−1953. Communicationes Instituti Forestalis Fenniae 59(1). 137 p. + 134 app.
Légaré, S., Bergeron, Y., Leduc, A. & Pare, D. 2001. Comparison of the understory vegetation in boreal forest types of southwest Quebec. Canadian Journal of Botany 79(9): 1019–1027.
Lehtelä, M., Hotanen, J.P. & Sepponen, P. 1996. Under-storey vegetation in fresh and herb-rich upland forests in southwest Lapland. Silva Fennica 30(1): 11–29.
Lexerød, N.L. & Eid, T. 2006. An evaluation of dif-ferent diameter diversity indices based on crite-ria related to forest management planning. Forest Ecology and Management 222(1–3): 17–28.
493
Meen, Nielsen and Ohlson Forest Stand Modelling As a Tool to Predict Performance of the Understory Herb Cornus suecica
Lid, J., Lid, D., Elven, R. & Alm, T. 2005. Norsk flora. Samlaget, Oslo.
McKenzie, D., Halpern, C.B. & Nelson, C.R. 2000. Overstory influences on herb and shrub commu-nities in mature forests of western Washington, USA. Canadian Journal of Forest Research 30(10): 1655–1666.
— , Raymond, C.L. & Cushman, S.A. 2009. Modeling understory vegetation and its response to fire. In: Millspaugh, J.J & Thompson, F.R. (eds.). Models for planning wildlife conservation in large land-scapes. Elsevier. p. 391–414.
Miina, J., Hotanen, J.P. & Salo, K. 2009. Modelling the abundance and temporal variation in the production of bilberry (Vaccinium myrtillus L.) in Finnish mineral soil forests. Silva Fennica 43(4): 577–593.
— , Pukkala, T., Hotanen, J.P. & Salo, K. 2010. Opti-mizing the joint production of timber and bilber-ries. Forest Ecology and Management 259(10): 2065–2071.
Moen, A. 1998. Nasjonalatlas for Norge: Vegetasjon. Statens Kartverk, Hønefoss. 199 p.
Morgan, D. & Smith, H. 1979. A systematic relation-ship between phytochrome-controlled development and species habitat, for plants grown in simulated natural radiation. Planta 145(3): 253–258.
Nielsen, A., Totland, Ø. & Ohlson, M. 2007. The effect of forest management operations on popu-lation performance of Vaccinium myrtillus on a landscape-scale. Basic and Applied Ecology 8(3): 231–241.
Nygaard, P.H. & Ødegaard, T. 1999. Sixty years of vegetation dynamics in a south boreal coniferous forest in southern Norway. Journal of Vegetation Science 10(1): 5–16.
Ohlson, M., Söderström, L., Hörnberg, G., Zackrisson, O. & Hermansson, J. 1997. Habitat qualities versus long-term continuity as determinants of biodiver-sity in boreal old-growth swamp forests. Biological conservation 81(3): 221–231.
Økland, R.H. & Eilertsen, O. 1996. Dynamics of under-story vegetation in an old-growth boreal coniferous forest, 1988–1993. Journal of Vegetation Science 7(5): 747–762.
Palviainen, M., Finér, L., Mannerkoski, H., Piirainen, S. & Starr, M. 2005. Responses of ground vegetation species to clear-cutting in a boreal forest: above-ground biomass and nutrient contents during the first 7 years. Ecological Research 20(6): 652–660.
Peng, C. 2000. Understanding the role of forest simu-
lation models in sustainable forest management. Environmental Impact Assessment Review 20(4): 481–501.
Perry, G.L.W. & Millington, J.D.A. 2008. Spatial mod-elling of succession-disturbance dynamics in forest ecosystems: Concepts and examples. Perspectives in Plant Ecology, Evolution and Systematics 9(3–4): 191–210.
SAS. 2008. SAS OnlineDoc (R), Version 9.2. SAS Institute Inc. Cary, NC.
Shugart, H.H. & West, D.C. 1980. Forest succession models. Bioscience: 308–313.
Sonesson, M. 1974. Late Quaternary forest develop-ment of the Torneträsk area, North Sweden. 2. Pollen Analytical Evidence. Oikos 25(3): 288–307.
Sugiura, N. 1978. Further analysts of the data by Akaike’s information criterion and the finite cor-rections. Communications in Statistics – Theory and Methods 7(1): 13–26.
Taylor, K. 1999. Cornus suecica L. (Chamaepericly-menum suecicum (L.) Ascherson & Graebner). Journal of Ecology 87(6): 1068–1077.
Thompson III, F.R. 2010. Application and presenta-tion of statistics. Journal of Wildlife Management 74(4): 617–619.
Tomter, S.M., Hylen, G. & Nilsen, J.-E. 2010. Devel-opment of Norway’s National Forest Inventory. In: Tomppo, E., Gschwantner, T., Lawrence, M. & McRoberts, R.E. (eds.). National Forest Inven-tories. Pathways for common reporting. Springer Verlag, Heidelberg. p. 411–424.
Tveite, B. 1977. Site index curves for Norway spruce (Picea abies (L.) Karst.). Meddelelser fra Norsk institutt for skogforskning 33(1). 84 p.
Van Couwenberghe, R., Collet, C., Lacombe, E. & Gégout, J.C. 2011. Abundance response of western European forest species along canopy openness and soil pH gradients. Forest Ecology and Management 262(8): 1483–1490.
Weisberg, P.J., Hadorn, C. & Bugmann, H. 2003. Pre-dicting understorey vegetation cover from oversto-rey attributes in two temperate mountain forests. Forstwissenschaftliches Centralblatt 122(5): 273–286.
Wolfslehner, B. & Vacik, H. 2008. Evaluating sustain-able forest management strategies with the Ana-lytic Network Process in a Pressure-State-Response framework. Journal of Environmental Management 88(1): 1–10.
Zackrisson, O., Nilsson, M.C., Steijlen, I. & Hörnberg,
494
Silva Fennica 46(4), 2012 research articles
G. 1995. Regeneration pulses and climate-vegeta-tion interactions in nonpyrogenic boreal Scots pine stands. Journal of Ecology 83: 469–483.
Zavitkovski, J. 1976. Ground vegetation biomass, production, and efficiency of energy utilization in some northern Wisconsin forest ecosystems. Ecology 57(4): 694–706.
Total of 57 references
Appendix A
Tree species composition and basal area of each stand.
Plot Number of stems Basal area Maturity class
Total ha–1
percent Total m2 ha–1
percent
Pinus sylvestris
Picea abies
Betula sp.
Pinus sylvestris
Picea abies
Betula sp.
1 632 0.0 32.8 67.2 12 0 58.3 41.7 42 1031 2.9 61.4 35.6 21 4.8 66.7 28.6 33 55 0.0 100.0 0.0 2 0.0 100.0 0.0 14 289 0.0 96.7 3.3 23 0.0 95.7 4.3 45 698 0.0 100.0 0.0 17 0.0 100.0 0.0 36 403 0.0 91.9 8.1 17 0.0 94.1 5.9 57 872 39.2 60.8 0.0 2 50.0 50.0 0.0 28 572 0.0 94.7 5.3 29 0.0 96.6 3.4 59 432 3.8 96.2 0.0 18 11.1 88.9 0.0 510 255 5.5 74.9 19.5 7 14.3 71.4 14.3 511 286 3.9 96.1 0.0 10 20.0 80.0 0.0 312 1409 0.0 100.0 0.0 7 0.0 100.0 0.0 213 2134 0.3 87.3 12.4 9 11.1 66.7 22.2 314 14 0.0 100.0 0.0 1 0.0 100.0 0.0 115 1055 0.0 61.8 38.2 22 0.0 90.9 9.1 416 1661 0.0 100.0 0.0 6 0.0 100.0 0.0 217 1187 100.0 0.0 0.0 4 100.0 0.0 0.0 218 737 1.0 99.0 0.0 17 5.9 94.1 0.0 519 980 0.0 100.0 0.0 11 0.0 100.0 0.0 220 426 0.0 100.0 0.0 17 0.0 100.0 0.0 421 505 20.7 79.3 0.0 18 44.4 55.6 0.0 522 510 0.0 77.4 22.6 25 0.0 96.0 4.0 523 104 7.4 92.6 0.0 2 50.0 50.0 0.0 124 995 0.0 95.6 4.4 32 0.0 96.9 3.1 425 995 0.0 35.3 64.7 12 0.0 50.0 50.0 3
495
Meen, Nielsen and Ohlson Forest Stand Modelling As a Tool to Predict Performance of the Understory Herb Cornus suecica
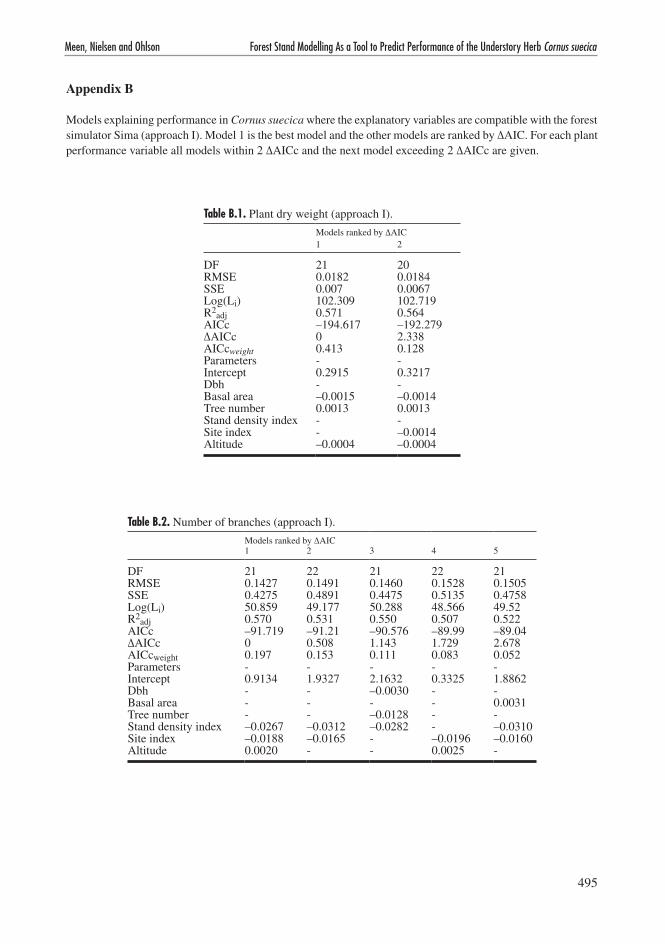
Table B.1. Plant dry weight (approach I).
Models ranked by ΔAIC1 2
DF 21 20RMSE 0.0182 0.0184SSE 0.007 0.0067Log(Li) 102.309 102.719R2
adj 0.571 0.564AICc –194.617 –192.279ΔAICc 0 2.338AICcweight 0.413 0.128Parameters - -Intercept 0.2915 0.3217Dbh - -Basal area –0.0015 –0.0014Tree number 0.0013 0.0013Stand density index - -Site index - –0.0014Altitude –0.0004 –0.0004
Table B.2. Number of branches (approach I).
Models ranked by ΔAIC 1 2 3 4 5
DF 21 22 21 22 21RMSE 0.1427 0.1491 0.1460 0.1528 0.1505SSE 0.4275 0.4891 0.4475 0.5135 0.4758Log(Li) 50.859 49.177 50.288 48.566 49.52R2
adj 0.570 0.531 0.550 0.507 0.522AICc –91.719 –91.21 –90.576 –89.99 –89.04ΔAICc 0 0.508 1.143 1.729 2.678AICcweight 0.197 0.153 0.111 0.083 0.052Parameters - - - - -Intercept 0.9134 1.9327 2.1632 0.3325 1.8862Dbh - - –0.0030 - -Basal area - - - - 0.0031Tree number - - –0.0128 - -Stand density index –0.0267 –0.0312 –0.0282 - –0.0310Site index –0.0188 –0.0165 - –0.0196 –0.0160Altitude 0.0020 - - 0.0025 -
Appendix B
Models explaining performance in Cornus suecica where the explanatory variables are compatible with the forest simulator Sima (approach I). Model 1 is the best model and the other models are ranked by ΔAIC. For each plant performance variable all models within 2 ΔAICc and the next model exceeding 2 ΔAICc are given.
496
Silva Fennica 46(4), 2012 research articles
Table B.3. Number of leaves (approach I).
Models ranked by ΔAIC 1 2 3 4
DF 22 23 21 22RMSE 0.8480 0.8850 0.8491 0.8863SSE 15.8190 18.0148 15.1404 17.2831Log(Li) 5.721 4.096 6.269 4.614R2
adj 0.549 0.509 0.548 0.507AICc –4.299 –3.647 –2.538 –2.086ΔAICc 0 0.652 1.761 2.213AICcweight 0.265 0.192 0.110 0.088Parameters - - - -Intercept 14.8501 13.1004 14.5169 12.7762Dbh - - - -Basal area –0.1031 –0.1047 –0.0994 –0.1008Tree number - - 0.0222 0.0230Stand density index - - - -Site index –0.1321 - –0.1306 -Altitude - - - -
Table B.4. Plant height (approach I).
Models ranked by ΔAIC 1 2 3 4 5
DF 22 21 23 21 21RMSE 2.1892 2.1663 2.3264 2.2004 2.2137SSE 105.4392 98.5472 124.4836 101.6813 102.9109Log(Li) –17.991 –17.146 –20.066 –17.537 –17.687R2
adj 0.230 0.246 0.130 0.222 0.212AICc 43.124 44.291 44.678 45.074 45.375ΔAICc 0 1.167 1.554 1.950 2.250AICcweight 0.204 0.114 0.094 0.077 0.066Parameters - - - - -Intercept 27.6398 32.4965 11.635 30.0057 28.3012Dbh - - - - -Basal area - - - 0.0503 -Tree number 0.1555 0.1559 0.1317 0.1712 0.1469Stand density index - - - - 0.0077Site index - –0.2374 - - -Altitude –0.0336 –0.037 - –0.0402 –0.0361
497
Meen, Nielsen and Ohlson Forest Stand Modelling As a Tool to Predict Performance of the Understory Herb Cornus suecica
Table B.5. Number of flowers (approach I).
Models ranked by ΔAIC 1 2 3 4 5
DF 21 20 22 21 22RMSE 1.2467 1.2296 1.3384 1.2957 1.3443SSE 32.6393 30.2404 39.4113 35.2556 39.7576Log(Li) –3.333 –2.379 –5.69 –4.297 –5.799R2
adj 0.531 0.544 0.460 0.494 0.455AICc 16.666 17.915 18.522 18.594 18.741ΔAICc 0 1.249 1.856 1.928 2.075AICcweight 0.191 0.102 0.075 0.073 0.068Parameters - - - - -Intercept 8.8081 2.6867 5.8336 –1.5935 7.4299Dbh –0.076 –0.0783 –0.0788 –0.0814 -Basal area - - - - -Tree number - - - - -Stand density index –0.0271 –0.0291 –0.0281 –0.0306 –0.0253Site index –0.2328 –0.2045 - - –0.2419Altitude - 0.0123 - 0.0158 -
Appendix C
Models explaining performance in Cornus suecica on all relevant ecological explanatory variables. Model 1 is the best model and the other models are ranked by ΔAIC. The 8 highest ranked models for each plant performance variable are shown.
Table C.1. Plant dry weight (approach II).
Models ranked by ΔAIC 1 2 3
DF 20 21 21RMSE 0.0174 0.0182 0.0189SSE 0.006 0.007 0.0075Log(Li) 104.092 102.309 101.420R2
adj 0.610 0.571 0.540AICc –195.026 –194.617 –192.839ΔAICc 0 0.409 2.187AICcweight 0.053 0.044 0.018Parameters - - -Intercept 0.1294 0.2915 –0.0076Dbh - - -Basal area –0.0013 –0.0015 –0.0018Tree number 0.0013 0.0013 -Stand density index - - -Site index - - -Altitude –0.0004 –0.0004 -Gini - - -Maturity class - - -CN-ratio - - –0.002NH4
+ - - -NO3
- - - -LOI % - - -N % - - -pH 0.034 - 0.0401
498
Silva Fennica 46(4), 2012 research articles
Table C.2. Number of branches (approach II).
Models ranked by ΔAIC 1 2 3 4 5 6 7 8
DF 21 21 21 22 20 22 20 21RMSE 0.1400 0.1403 0.1427 0.1491 0.1388 0.1494 0.1400 0.1460SSE 0.4114 0.4133 0.4275 0.4891 0.3851 0.4913 0.3918 0.4475Log(Li) 51.337 51.280 50.859 49.177 52.163 49.121 51.948 50.288R2
adj 0.587 0.585 0.570 0.531 0.594 0.529 0.587 0.550AICc –92.674 –92.56 –91.719 –91.21 –91.167 –91.098 –90.739 –90.576ΔAICc 0 0.114 0.956 1.464 1.507 1.576 1.935 2.099AICcweight 0.034 0.032 0.021 0.016 0.016 0.016 0.013 0.012Parameters - - - - - - - -Intercept 1.7971 1.9745 0.9134 1.9327 1.2368 1.6629 1.9173 2.1632Dbh - - 0.002 - 0.0015 - - -Basal area - –0.0168 –0.0188 –0.0165 –0.0184 –0.0172 –0.0162 -Tree number –0.0201 - - - - - - –0.0128Stand density index - - - - - - 0.004 -Site index –0.0044 - - - - - - –0.003Altitude - –0.0256 –0.0267 –0.0312 –0.0235 - –0.0249 –0.0282Gini 0.0732 - - - - - - -Maturity class - - - - - - - -CN-ratio - - - - - - - -NH4
+ - –0.0011 - - –0.0009 –0.0013 –0.0012 -NO3
- - - - - - - - -LOI % - - - - - - - -N % - - - - - - - -pH - - - - - - - -
Table C.3. Number of leaves (approach II).
Models ranked by ΔAIC 1 2 3 4 5 6
DF 22 23 21 21 21 22RMSE 0.8480 0.8850 0.8351 0.8491 0.8523 0.8863SSE 15.819 18.0148 14.6468 15.1404 15.2556 17.2831Log(Li) 5.721 4.096 6.683 6.269 6.174 4.614R2
adj 0.549 0.509 0.563 0.548 0.545 0.507AICc –4.299 –3.647 –3.366 –2.538 –2.348 –2.086ΔAICc 0 0.652 0.932 1.761 1.951 2.213AICcweight 0.051 0.036 0.032 0.021 0.019 0.017Parameters - - - - - -Intercept 14.8501 13.1004 16.9948 14.5169 10.9646 12.7762Dbh - - - - - -Basal area –0.1031 –0.1047 –0.0987 –0.0994 –0.0992 –0.1008Tree number - - - 0.0222 - 0.023Stand density index - - - - - -Site index –0.1321 - –0.1732 –0.1306 –0.1289 -Altitude - - - - - -Gini - - - - - -Maturity class - - - - - -CN-ratio - - –0.0549 - - -NH4
+ - - - - - -NO3
- - - - - - -LOI % - - - - - -N % - - - - - -pH - - - - 0.8372 -
499
Meen, Nielsen and Ohlson Forest Stand Modelling As a Tool to Predict Performance of the Understory Herb Cornus suecica
Table C.4. Plant height (approach II).
Models ranked by ΔAIC 1 2 3 4 5 6 7
DF 19 18 17 19 18 20 19RMSE 1.8040 1.7184 1.6201 1.8194 1.7676 1.9509 1.8829SSE 61.8329 53.1526 44.6203 62.8946 56.2385 76.1206 67.3642Log(Li) –11.319 –9.429 –7.241 –11.532 –10.134 –13.918 –12.390R2
adj 0.477 0.525 0.578 0.468 0.498 0.388 0.430AICc 39.306 39.446 39.483 39.731 40.856 40.994 41.448ΔAICc 0 0.140 0.177 0.426 1.551 1.688 2.142AICcweight 0.037 0.034 0.034 0.030 0.017 0.016 0.013Parameters - - - - - - -Intercept 11.4558 14.5157 21.4331 15.1852 11.1808 14.0412 13.3665Dbh –0.0534 –0.0533 –0.0546 –0.0591 –0.0475 –0.0443 –0.0382Basal area - 0.1023 0.1089 0.0986 - - -Tree number - - - - - - -Stand density index 0.1589 0.1720 0.1582 0.2103 0.1304 0.1759 0.1385Site index 0.0196 - - - 0.0176 - -Altitude - - –0.2889 - - - -Gini - - - - - - -Maturity class - - - - - - -CN-ratio - –0.1850 –0.2474 - –0.1420 - –0.1752NH4
+ –0.0253 –0.0304 –0.0298 –0.0239 –0.0296 –0.0202 –0.0262NO3
- - - - - - - -LOI % - - - - - - -N % - - - - - - -pH 5.8892 6.5916 6.4784 5.6025 6.4795 4.5669 5.4668
Table C.5. Number of flowers (approach II).
Models ranked by ΔAIC 1 2 3 4 5 6
DF 21 21 20 22 21 20RMSE 1.2467 1.2586 1.2296 1.3384 1.2957 1.2496SSE 32.6393 33.2671 30.2404 39.4113 35.2556 31.2292Log(Li) –3.3330 –3.5712 –2.3788 –5.6897 –4.2969 –2.7810R2
adj 0.5313 0.5223 0.5441 0.4598 0.4938 0.5292AICc 16.666 17.1423 17.9154 18.5223 18.5937 18.7198ΔAICc 0 0.4763 1.2494 1.8563 1.9277 2.0538AICcweight 0.0405 0.0319 0.0217 0.0160 0.0154 0.0145Parameters - - - - - -Intercept 8.8081 5.7966 2.6867 5.8336 –1.5935 7.8169Dbh –0.076 –0.1256 –0.0783 –0.0788 –0.0814 –0.1045Basal area - - - - - -Tree number - - - - - -Stand density index –0.0271 –0.0367 –0.0291 –0.0281 –0.0306 –0.0325Site index –0.2328 - –0.2045 - - –0.1569Altitude - - 0.0123 - 0.0158 -Gini - - - - - -Maturity class - 0.4927 - - - 0.290CN-ratio - - - - - -NH4
+ - - - - - -NO3
- - - - - - -LOI % - - - - - -N % - - - - - -