forest landscape: a method of amenity evaluation based on computer simulation
TRANSCRIPT
Landscape and Urban Planning, 18 ( 1989) 117-125 Elsevier Science Publishers B.V., Amsterdam -Printed in The Netherlands
117
Forest Landscape: A Method of Amenity Evaluation based on Computer Simulation
SEPPO KELLOMAKI and TIM0 PUKKALA
University ofJoensuu, Faculty of Forestry, P. 0. Box 1 I I. SF-801 01 Joensuu (Finland)
(Accepted for publication 31 May 1989)
ABSTRACT
Kellomaki, S. and Pukkala, T., 1989. Forest landscape: a method of amenity evaluation based on computer simulation. Landscape Urban Plann., 18: II 7-125.
A simulation model is presented to determine the amenity value offorest landscapes subjected to a selected management regime. The simula- tion also provides quantitative predictions of the
temporal development of tree and stand dimen- sions. The landscape created by computer graphics is composed of tree symbols whose spe- cies and size distributions correspond to those in nature. The method gives an adequate basis for amenity evaluations whenever the manage- ment regimes to be compared are sufficiently different.
INTRODUCTION
The treatments of forest stands often alter the forest landscape considerably. Clear, felled areas especially may be visible for decades. and the resultant change of landscape may create public pressure to restrict cuttings (Kello- m&i, 1975 ). Consequently, it is important that the effect of tree felling on the landscape is carefully evaluated before the clearing begins.
Finnish people typically appreciate old for- ests consisting of big trees, notably pines and birches (KellomZki, 1975; Sarolainen and Kellomiki, 198 1; Pukkala et al., 1988). Expe- rience shows that forest stands can be thinned and otherwise economically managed, without
causing adverse comments, if the treatments are not readily discernible. This experience and other evidence (Karhu and Kellomaki, 1980; Hultman, 1983) gives some guidelines for the treatment of individual stands. However, this knowledge cannot be used directly to evaluate the impact of forestry activities on distant scenes. The effect of an individual stand de- pends on the properties and treatments of the surrounding stands and the topography of the terrain. These relationships are often difficult to describe quantitatively and simple forest treatment rules do not cover the range of situ- ations encountered in practical forest management.
Computer simulation is commonly used in
0169-2046/89/$03.50 0 1989 Elsevier Science Publishers B.V.
118 S. KELLOMb;KI AND T. PUKKALA
forest management planning to study the con- sequences of different management alterna- tives. The simulation mimics the temporal change in tree and stand dimensions. It is also possible to simulate the change in forest land- scape by using computer graphics. The quan- tification of the amenity of a landscape is dif- ficult, but can be avoided by a method where a group of experts or decision makers rank the drawings of landscapes associated with differ- ent management options without attaching numerical parameters to them.
Pukkala and Kellomaki ( 1988) presented a method for the simulation and graphical pre- sentation of the temporal development of an individual stand but because a forest land- scape is usually viewed as several stands, the method has limited application. There are also forest landscape simulators for large areas (Stevenson et al., 1979; Tlusty, 1979) but in these systems the simulation of the change in stand dimensions is rather inaccurate.
This paper presents a method which allows the temporal change of a forest landscape to be visualized as the stands grow and are treated according to a proposed management plan. The landscape drawings can be used for examining whether the plan fulfills far-view-amenity re- quirements and can assist in choosing the best alternative in this respect. The system also produces quantitative information on the tim- ber output and stand development associated with the simulated treatments.
SIMULATION OF LANDSCAPE
Description of stands
The forest area is first divided into reasona- bly homogenous compartments and each com- partment is surveyed by ocular standwise in- ventory. The field work for each compartment provides the following measurements sepa- rately for each tree species and canopy layer: basal area or number of trees per ha; mean age; mean height; and the minimum, mean and
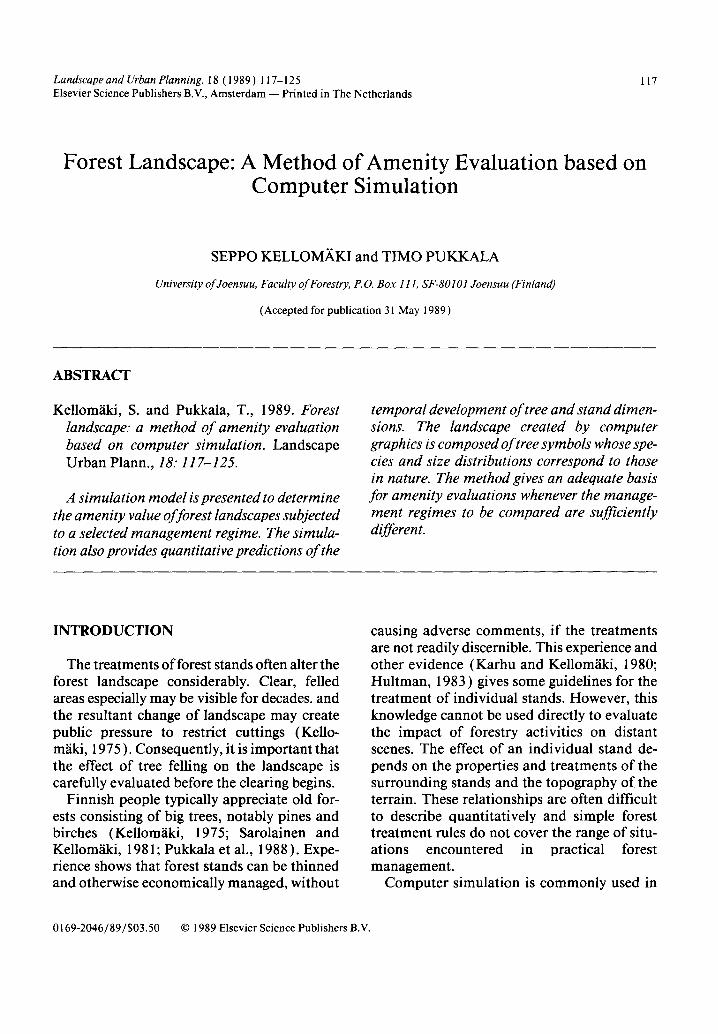
Fig. 1. Stages in creating the drawing of forest landscape.
maximum diameters. From these data a theo- retical tree population is generated for each compartment. The drawing of landscape and the simulation of growth and treatments is based on this tree population (Fig. 1).
The theoretical tree population for each compartment is calculated in two stages. Firstly, the diameter distribution of stand basal area or number of stems is estimated from the field data using the beta function as a theoret- ical distribution (Loetsch et al., 1973; Paivi- nen, 198 1). The diameter distribution is cal- culated separately for each tree species and canopy layer. Secondly, each distribution is di- vided into three classes of equal width and the class midpoint tree is taken to represent the class. This tree is described by species, stem di- ameter at breast height, height and age. The number of trees per ha is determined for each diameter class. The initial age is obtained from lield data and tree heights are predicted based on stem diameter data. The volume and taper functions of Laasasenaho ( 1982) are used to calculate the volumes of different timber as- sortments for each stem. The stand character- istics are computed as means or sums of the tree characteristics.
Description qf terrain
A contour map and a compartment map provide information for a grid of points of which the x, y and z coordinates are known, as well as giving the compartment on which the point lies. Using the data of the compartment map, a table or grid of points is generated in-
AMENITY EVALUATION BASED ON COMPUTER SIMULATION
dicating the compartment number at given in- tervals in the x- and y-directions (in the case study at 12.5-m intervals). Then the altitude, or z coordinate, of each point is calculated as a weighted average of an arbitrary set of known altitudes measured from the contour map (Fig. 1). The weighting of a point is smaller the fur- ther it is from the grid point.
Drawing of landscape
The computer landscape is created by plac- ing tree symbols on the surroundings of the grid points. Different species and tree sizes are rep- resented corresponding to the theoretical tree populations. If the number of trees exceeds a definite limit (in the case study 700 trees per ha), all points are occupied, while with smaller stand densities some points would not have trees shown. It is possible to draw 1-3 trees around each occupied point, depending on the resolution of the output device.
Different vantage points for landscape view- ing can be selected within reasonably wide lim- its and successive landscapes can be repro- duced, e.g. at 5-year intervals. The simulation program runs on a VAX computer and uses the GPGS library routines for coordinate transfor- mations and graphical output (GPGS-F User’s Guide, 198 1) .
Simulation ofgrowth and treatments
The simulation of growth with specific for- est treatments is based on the theoretical tree populations created for each compartment on the basis of the field data. The growth is simu- lated by increasing the diameter, height and age of each tree using the models of Nyyssiinen and Mielikainen ( 1978) and a time step of live years.
The cuttings are simulated by decreasing the tree density by tree species and canopy layers (overstorey and understorey; separating height, 10 m). Regeneration is taken into account by
119
adding new trees to the selected compartment through the keyboard.
After each treatment and growing period the stand characteristics of each compartment, the grand totals of stem volume and the monetary value of growing stock can be calculated and tabulated on the screen. The compartment de- scription also includes the adjective sum which describes the within-stand amenity of the com- partment (Kellomaki and Savolainen, 1984; Pukkala and Kellomaki, 1988). The adjective sum is calculated from mean height, volume of deciduous trees and the number of tree species using the equation of Pukkala and Kellomaki ( 1988). The adjective sum increases with tree height. The proportion of deciduous trees and the number of different tree species also in- crease the adjective sum.
CASE STUDY
Description of Puijo forest
The case study area was the Puijo recreation forest near the town of Kuopio in central Fin- land. The forest consists mainly of old Norway spruce (Picea abies Karst.) stands. These were divided into 28 compartments (Table 1, Fig.
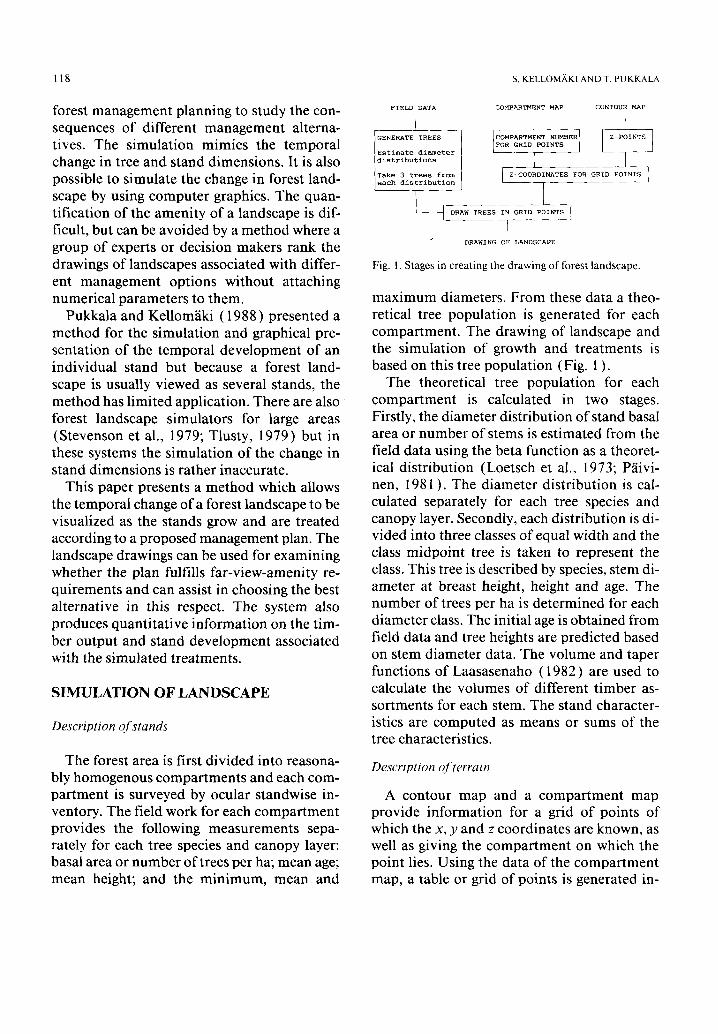
‘n Fig. 2. Map showing the boundaries of compartments of the Puijo nature reserve. Points A and B show the vantage points of Figs. 3 and 4, respectively.
120 S. KELLOM;iKI AND T PUKKALA
TABLE 1
Stand characteristics of different compartments in the Puijo nature reserve
Comp. Area Age Height (ha) (years) (m)
Stand volume ( m3 per ha)
Tot. Sawlog Pulp P’ S
.Adjective sum’
6 0.5 20 12 7 0.6 25 12 8 4.9 105 28 9 2.8 No trees (slalom slope)
10 2.4 155 24
11 2.8 145 23 263 231 30 12 3.4 155 24 296 262 31 13 2.5 155 29 389 214 I1 14 3.1 155 28 349 294 18 I5 1.9 150 27 351 324 24
16 2.7 150 27 358 330 24 17 3.4 155 30 378 300 23 18 1.8 145 25 287 262 23 19 2.9 145 29 408 350 21 20 0.9 145 29 321 280 15
21 2.9 148 24 347 317 27 287 60 59.9 22 1.3 145 29 360 320 19 26 334 61.4 23 2.1 145 29 326 280 17 53 273 61.4 24 1.7 139 25 322 298 22 264 58 60.1 25 1.3 185 23 256 238 16 256 _ 58.0
26 0.8 143 23 258 249 23 259 16 59.4 27 1.3 171 24 292 272 17 216 16 60.0 28 2.6 155 27 364 334 26 198 166 60.8
0.7 150 27 358 330 25 1.2 150 28 378 250 20 1.3 150 27 338 311 23 5.3 25 12 101 0 87 0.7 149 26 155 131 I4
110 101 450
280
0 97 0 88
389 26
257 19
_
_ _ _
_ 352
144
44 156
_
25
87 197 221
358 59.6 378 59.9 338 59.6 101 54.5 155 59.2
110 54.5 101 54.5 98 61.2
135 59.9
219 59.3 140 59.7 389 60.0 349 59.7 351 59.5
333 61.0 378 60.3 201 60.2 211 61.4 100 61.4
‘P= Scats pine. *S = Norway spruce. ‘See Pukkala and Kellomiki ( 1988).
2). The total area of the compartments is 60 diseases, provision needs to be made for regen- ha. A field inventory for each compartment was eration of the forest cover. made as described previously. Since the stands The people of Kuopio are used to seeing the are mostly very old and susceptible to wind and Puijo forest as a uniform and massive body
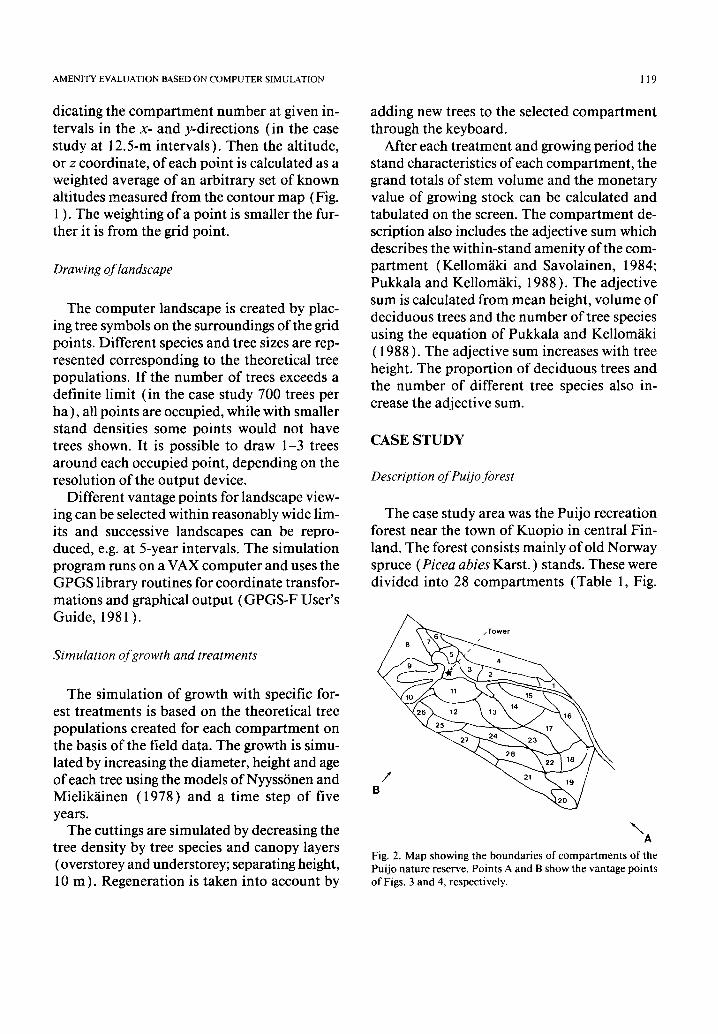
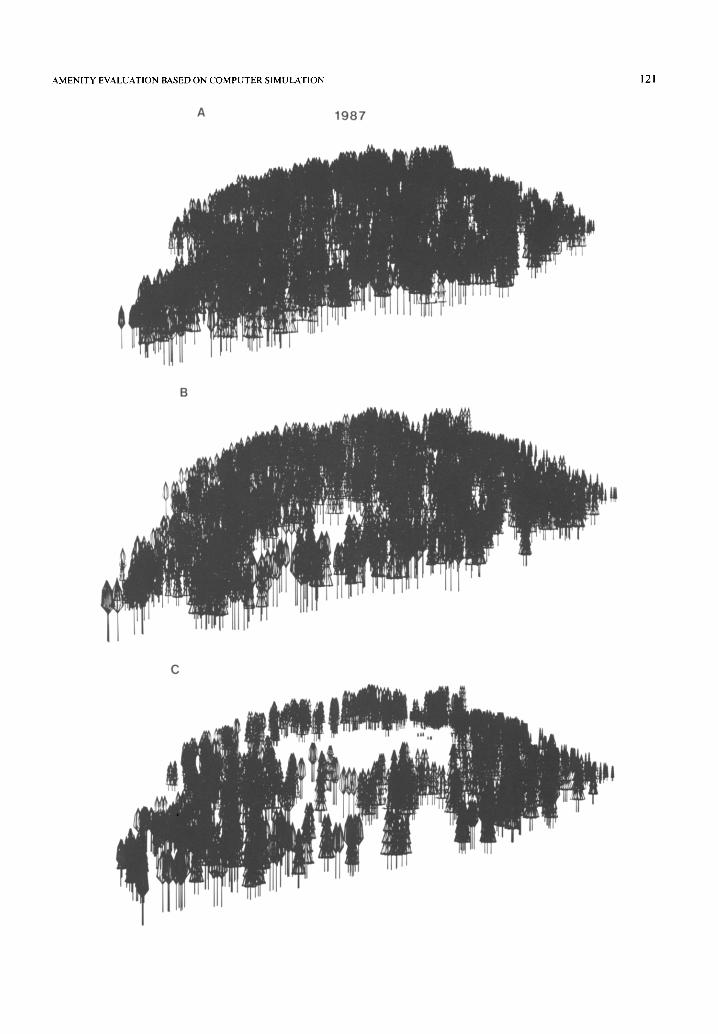
Fig. 3. Appearance of Puijo hill as seen from Kuopio (point A in Fig. 2), if compartments I, 2, 3, 4, 5, I 1, 20, 22 and 23 were treated immediately (removal of shelter trees in compartment 5 and shelter tree thinning in the rest of compartments). (A) present landscape ( 1987), (B) landscape after cuttings. Drawing (C) shows the landscape if compartments 12, 13, 14 and 18 were clear cut, in addition to the cuttings in (B). The tree species is either Scats pine or Norway spruce. Drawing (C) was created to demonstrate the applicability of the program to visualizing the appearance of drastic cuttings.
AMENITY EVALUATION BASED ON COMPUTER SIMULATION 121
A 1987
122 S. KELLOM#KI AND T. PUKKALA
1992
2032
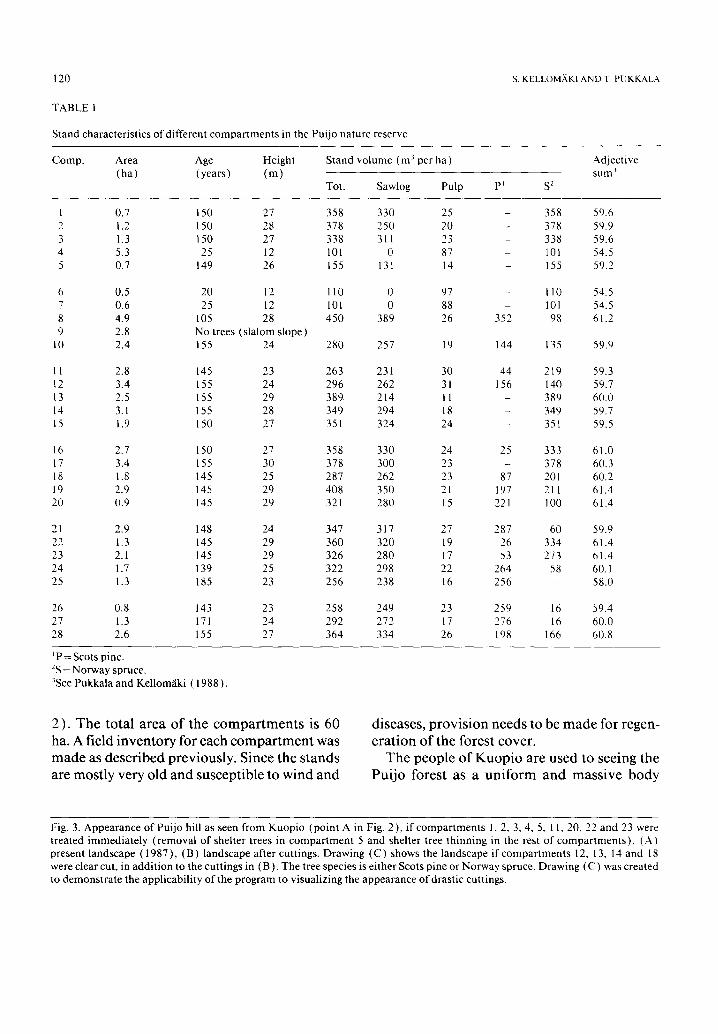
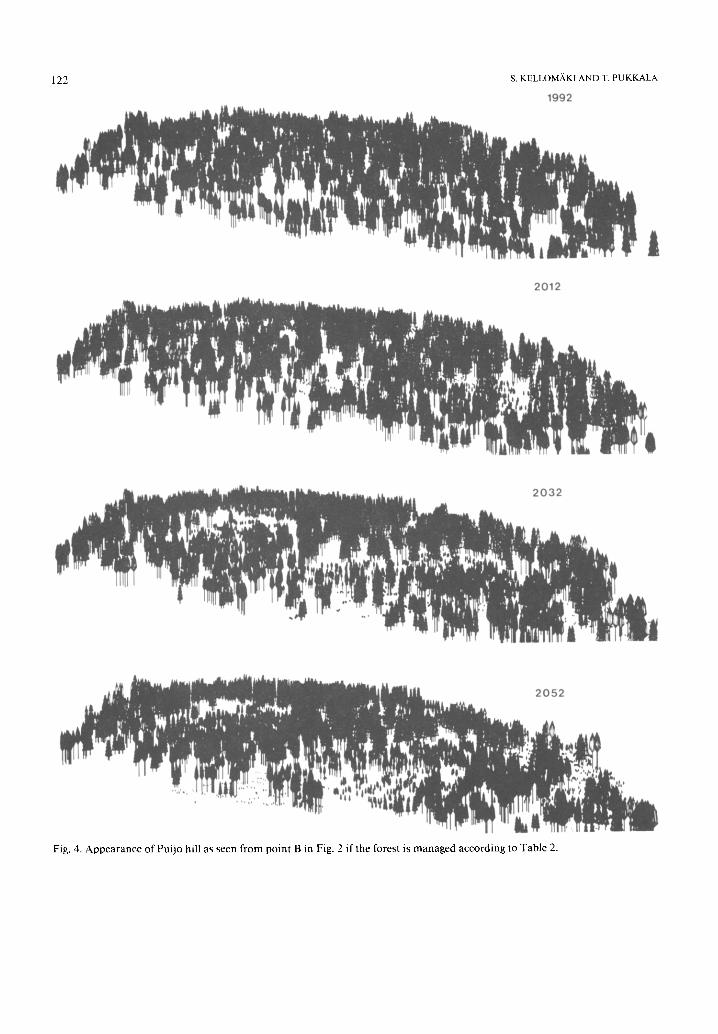
Fig. 4. Appearance of Puijo hill as seen from point B in Fig. 2 if the forest is managed according to Table 2

AMENITY EVALUATION BASED ON COMPUTER SIMULATION 123
TABLE 2 4o01 A
The proposed management regime for the Puijo nature re- serve for the years 1987-2052
Compartment’ Type of cutting Year Percentage of old generation removed
5 2, 22
4,6, 7 1, 3, 24
11,23
16,28
15,19
18,27
20.25
Remove shelter 1992 Shelter cut 1992 Thin shelter 2002 Remove shelter 2012 Thinning 2002 Shelter cut 2002 Thin shelter 2012 Remove shelter 2022 Shelter cut 2012 Thin shelter 2022 Remove shelter 2032 Shelter cut 2022 Thin shelter 2032 Remove shelter 2042 Shelter cut 2032 Thin shelter 2042 Remove shelter 2052 Shelter cut 2042 Thin shelter 2052 Remove shelter 2062 Shelter cut 2052 Thin shelter 2062 Remove shelter 2072
100 33 50
100 40 33 50
100 33 50
100 33 50
100 33 50
100 33 50
100 33 50
100
‘Treatment of other compartments begins after 2052.
covered by conifers. Conservation of this land- scape feature was a guiding principle in the re- generation plan. More specifically, it was de- cided, in consultation with the management staff of Puijo forest, that the following princi- ples should be followed in the regeneration: natural regeneration of trees should be encour- ages; the shelter trees and seed trees should be removed gradually over a long time period; and the natural regeneration should be done for conifers only.
Simulations
Two vantage points from the town of Ku- opio were selected for the landscape evalua- tions (Fig. 2). The impacts of immediate cut- tings in some of the oldest compartments were evaluated from vantage point A. In the simu-
2000 2020 2040 2060 YEAR
160 B
1B 120
cn
- 1
G 0
s
5 60-
f 2 40-
v .
2600 . 2d20 . 2&o . 2&o YEAR
Fig. 5. Development of mean volume (A) and mean age of trees (B) according to the management plan in Table 2.
lation all the selected compartments were thinned so that 60-80 shelter trees per ha were left on the regeneration area (Fig. 3 ) .
It can be seen from Fig. 3B that heavy cut- tings in compartments 22 and 23 are clearly visible from vantage point A, since these com- partments are on a steep slope facing point A. Most of the compartments could, however, be regenerated safely without notable change in landscape. This is because the landscape is normally seen from below, and the foreground trees effectively hide all reasonably small re- generation areas.
The predicted change of landscape from
124 S. KELLOMiiKI AND T. PUKKALA
vantage point B is presented in Fig. 4 assuming the selected regeneration plan (Table 2 ) is im- plemented. The aim was to determine a regen- eration order for individual compartments which would maintain the conformity and uni- formity of the landscape over the whole plan- ning period. The regeneration was started from two locations in which very old stands domi- nate: from the top of the hill (compartments 1, 2, 3 and 5 ) and from the main slope facing towards Kuopio (compartments 22, 23 and 24). The shelter trees were removed gradually, and the regeneration proceeded so that the young stands appeared as uniform and ex- panding zones, and not as separate small parcels.
The proposed regeneration plan does not af- fect the mean tree age or total tree volume of the compartments (Fig. 5 ), but the variation in tree size and stand volume increases. Since there is a gradual change of stand properties, the conformity of the landscape is reasonably well maintained.
DISCUSSION
The simulation method described can be used to visualize the short term and long term impacts of the proposed treatments. In addi- tion to the landscape drawings, the simulation produces quantitative predictions on tree re- movals and changes of stand dimensions. The compartment description and the total amounts of the sum characteristics can be cal- culated at five-year intervals. The compart- ment description includes the adjective sum describing the within-stand amenity of the compartment. The simulation, therefore, pro- vides ample information for decision making in economically managed forest areas which are situated in scenically important locations.
The planning method proved most suitable where forest treatments are significant and cover a reasonably large area (Fig, 3B,C ). The effects of slight differences in treatments can- not easily be evaluated from the computer
drawings. The most suitable area for the pro- gram is 5-30 ha. For a larger area, as in this case study, the correspondence between draw- ing and real landscape is not good because one tree in the drawing represents too many trees in nature. If the area is smaller than 5 ha, then discerning the symbols of individual trees too clearly may render interpretation difficult, be- cause the tree symbols differ considerably from the appearance of real trees.
REFERENCES
GPGS-F User’s Guide, 5th ed.. 1981. Tapir Forlag, Tron- dheim, Norway.
H&man, S.-G., 1983. Public judgement of forest environ- ments as recreation areas. 2. A national survey, Swedish Univ. Agric. Sci. Sect. Environm. Forestry. Rep.. 28: l-91.
Karhu, 1. and Kellom%ki, S., 1980. Effects of silvicultural practice on amenity of the forest landscape. A study on attitudes among inhabitants of Puolanka, north-eastern Finland. Silva Fenn., 14: 409-428.
Kellomiki, S.. 1975. Forest stand preferences of recreation- ists. Acta For. Fenn., 146: l-36.
Kellomlki. S. and Savolainen, R., 1984. The scenic value of the forest landscape as assessed in the field and the labo- ratory. Landscape Plann., 11: 97-107.
Laasasenaho, J., 1982. Taper curve and volume functions for pine, spruce and birch. Commun. Inst. For. Fenn., 108: l-74.
Loetsch, F., Zohrer, F. and Haller, K.E., 1973. Forest inven- tory, Vol. II, Miinchen, 469 pp.
Nyyssonen, A. and Mielikainen, K., 1978. Estimation of stand increment. Acta For. Fenn., 163: I-40.
Paivinen, R., I98 1. On the estimation of stem-diameter dis- tribution and stand characteristics. Folia For. (Helsinki). 422: l-28.
Pukkala, T. and Kellomlki. S., 1988. Simulation as a tool in designing forest landscape. Landscape Urban Plann., 16: 253-260.
Pukkala, T., Kellomaki, S. and Mustonen, E., 1988. Predic- tion of the amenity of a tree stand. Stand. J. For. Res.. 3: 533-544.
Savolainen, R. and Kellomlki, S., 1981. Scenic value of for- est landscape. Acta For. Fenn., 170: l-75.
Stevenson. A., Conley, J. and Carey, J.. 1979. A computer- ized system for portrayal of landscape alteration. In: Pro- ceedings of our National Landscape. A Conference on Ap- plied Techniques for Analysis and Management of Visual Resources, 23-25 April 1979, Incline Village, NV. USDA, Forest Service, General Technical Report PSW-35, pp. 151-156.
Tlusty, W., 1979. The use of VIEWIT and perspective plot to assist in determining the landscape’s visual absorption ca- pability. In: Proceedings of our National Landscape. A

AMENITY EVALUATION BASED ON COMPUTER SIMULATION 125
Conference on Applied Techniques for Analysis and Man- Village, NV, USDA, Forest Service, General Technical agement of Visual Resources, 23-25 April 1979, Incline Report PSW-35, pp. 201-208.