forecasting the financial future for virginia’s localities james j. regimbal jr. virginia...
TRANSCRIPT

Forecasting the Financial Future for Virginia’s Localities
James J. Regimbal Jr.Virginia Association of Counties
November 2010

2
“Bear” Case for Economy • Debt bubble has shifted from private to public
sector.• Waning federal stimulus, potentially rising
federal taxes, increasing protectionism & regulation
• Anemic job growth with low consumer confidence
• Deflation risk• Slow real estate recovery

3
“Bull” Case for Economy • Strong growth in emerging economies• Surging commodity prices suggesting strong global
growth and trade• Low borrowing costs with credit markets on the mend• Steep yield curve predicting growth & no double-dip• Healthy corporate profits, high productivity, and record
high corporate cash• Personal income and spending trending higher• Consumers continue to save and reduce debt burdens• Leading indicators again moving up• Tame inflation

4
2005 2006 2007 2008 2009 2010 2011 2012$12,500
$13,000
$13,500
$14,000
$14,500
$15,000
$15,500
$16,000
2010 Session General Fund Revenue Forecast
Current forecast
5
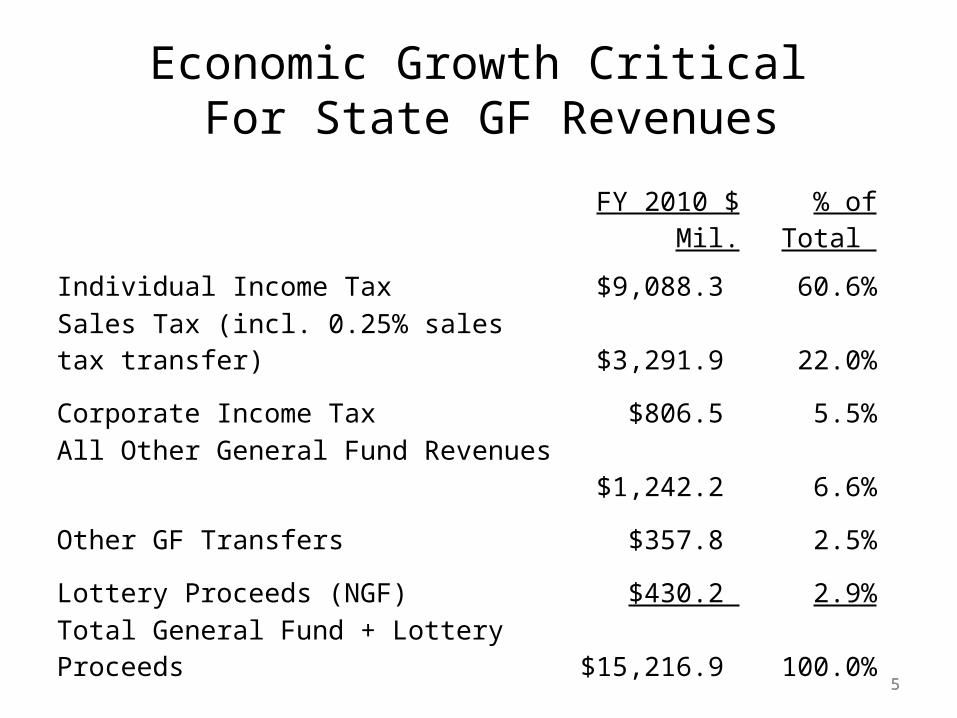
Economic Growth Critical For State GF Revenues
5
FY 2010 $ Mil. % of Total
Individual Income Tax $9,088.3 60.6%
Sales Tax (incl. 0.25% sales tax transfer) $3,291.9 22.0%
Corporate Income Tax $806.5 5.5%
All Other General Fund Revenues $1,242.2 6.6%
Other GF Transfers $357.8 2.5%
Lottery Proceeds (NGF) $430.2 2.9%
Total General Fund + Lottery Proceeds $15,216.9 100.0%

6
FA Estimated Additional General Funds Available for Appropriation ($ Mil.)
FY 2010 (a) Growth FY 2011 (e) Growth FY 2012 (e) Growth
Individual Income $9,088.3 -4.1% $9,630.0 6.0% $10,210.0 6.0%
Sales Taxes $3,082.5 6.2% $2,930.0 -4.9% $3,033.0 3.5%
Corporate Income $806.5 24.4% $792.8 -1.7% $838.4 5.8%
All Other GF $1,242.3 -3.1% $1,322.2 6.4% $1,354.0 2.4%
Total GF Revenues $14,219.6 -0.7% $14,675.0 3.2% $15,435.4 5.2%
GF Transfers $567.2 39.5% $425.5 -25.0% $459.1 7.9%
Total General Fund $14,786.7 0.4% $15,100.5 2.1% $15,894.5 5.3%
Official GF Available 14,558.2 $14,997.9 1.4% $15,748.0 5.0%
Additional GF $228.5 $102.6 $146.5

7
Budget Issues for 2011 Session• Don’t anticipate significant budget restorations. FA anticipates about $350
million in new GF revenue/balances for biennium, assuming no policy changes.
- Only about $100 mil. available from FY 2010 $228 mil. revenue surplus -- most already committed to employee bonus, WQIF, transportation.
- Latest FMAP extension for Medicaid fell short by about $150 million -- pressure to undo contingent appropriation cuts and make providers
whole.
- Other budget “holes” include $150 million for public safety, higher education and increased Medicaid utilization.
- $249 million in federal “Jobs” bill education funding to local schools could potentially be used to offset state GF appropriations and directed to other priorities.
• Election and re-districting year will make for “interesting” session.
- Proposals from economic development/job creation commission include corporate tax rate, BPOL, M&T changes, etc.
- Impacts from Government Reform Commission and ABC privatization proposal?

8
Counties Depend on Real Property Taxes
Real Property56%
Other Property Taxes13%
Charges for Services10%
Local Sales Taxes5%
BPOL 3%
All Other Taxes8%
All Other Revenues5%
FY 2009 County Revenue Sources ($11.21 bil)
Source: Auditor of Public Accounts Comparative Report of Revenues and Expenditures 8

9
Real/Other Property Taxes
Charges for Services Local Sales Taxes All Other Taxes & Revenues
0.0%
10.0%
20.0%
30.0%
40.0%
50.0%
60.0%
70.0%
County Reliance on Property Taxes for Own Revenues Has Grown
FY 2009FY 1999FY 1989

10
Virginia Existing Home Prices May Have Bottomed in 2010.1Q …
Median Sales Price of Existing Single-Family Homes for Metropolitan Areas
(Thousands $)
Metropolitan Area 2007 2008 2009 2010.I 2010.II p
U.S. $217.9 $196.6 $172.1 $166.4 $176.9
South 178.8 169.4 155.0 142.6 155.5
Richmond, VA 233.7 223.5 N/A N/A 199.6
Hampton Roads Metro 226.8 220.0 210.0 195.0 210.0
Washington D.C. Metro 430.8 343.4 308.6 292.6 331.6
*All areas are metropolitan statistical areas (MSA) as defined by the US Office of Management and Budget as of 2004.
They include the named central city and surrounding areas. N/A Not Available p Preliminary
©2010 National Association of REALTORS®

11
…Commercial Real Estate Still Declining
Virginia Commercial Real Estate Activity - 2010 1st Q 2nd Q
Sales Volume Compared with Previous Quarter -10% -14%
Sales Volume Compared with Previous Year -12% -15%
Sales Prices Compared with Previous Quarter -1% -11%
Sales Prices Compared with Previous Year -12% -16%
Volume of New Construction Compared with Previous Quarter -10% -4%
Leasing Activity Compared with Previous Quarter -1% -11%
Rental Rates Compared with Previous Quarter -7% -11%
©2010 National Association of REALTORS®
Commercial Real Estate QUARTERLY MARKET SURVEY, June and September 2010

Property Tax Revenues Expected to Decline At Least Through FY 2011
1990 1991 1992 1993 1994 1995 1996 1997 1998 1999 2000 2001 2002 2003 2004 2005 2006 2007 2008 2009 2010 est.
2011 est.
-4.0%
-2.0%
0.0%
2.0%
4.0%
6.0%
8.0%
10.0%
12.0%
14.0%
16.0%
% Annual Growth
Growth in Total RE Assessed Values (106 localities surveyed): 2009 to 2010: -5.0%
Growth in Total RE Revenues (109 localities surveyed):FY2009 to FY2010: 0.2%FY2010 to budgeted FY2011: -2.8%
12
Fiscal Year

13
1990 1991 1992 1993 1994 1995 1996 1997 1998 1999 2000 2001 2002 2003 2004 2005 2006 2007 2008 2009 2010 est.
2011 est.
-6.0%
-4.0%
-2.0%
0.0%
2.0%
4.0%
6.0%
8.0%
10.0%
12.0%
…Growth in Total Local Revenues Still Declining as Well
% Annual Growth
Fiscal Year107 localities responding to VML/VACO survey: FY2009 to FY2010: -3.6%FY2010 to budgeted FY2011: -1.2%

14
State Sources Provided Only 21% of All County Revenues in FY 2009
Source: Auditor of Public Accounts Comparative Report
County Revenue; 63%
State Sources; 21%
Federal Sources; 3%

15
County Revenue; 52%
State Sources; 42%
Federal Sources, 6%
… But 42% of All FY 2009 County Revenues If 4 Northern Virginia Counties* Are Excluded
* Counties of Arlington, Fairfax, Loudoun, Prince William

16
State GF Appropriations to Localities Has Decreased by $1 Billion Since FY 2009
(1) Does not include appropriated federal stimulus funds in FY 10 and FY 11.
FY 2009 FY 2010 FY 2011 FY 2012
Direct Aid to K-12 $5,607.6 $4,769.8 $4,739.3 $4,903.1
Health and Human Services 888.4 878.7 823.3 813.7 CSA 299.7 279.2 272.2 274.0 Community MH/MR Services 249.4 256.5 230.1 230.1 Local Social Services Staff 117.4 117.4 114.4 111.4 Community Health Programs 117.6 116.9 106.1 105.0 Welfare Services and Programs 104.3 108.7 100.5 93.2 Public Safety 734.3 556.8 671.6 642.7 Local Sheriffs Offices 406.1 257.1 399.9 387.4 Local Police Depts HB 599 197.3 180.8 178.7 160.0 Local Jail Per diem 80.1 68.1 47.6 49.9 Assistance for Juvenile Justice 50.8 50.8 45.4 45.4 Constitutional Officers 155.3 142.2 144.2 144.2 Car Tax 950.0 950.0 950.0 950.0 Aid-to-Locality Reduction (50.0) (50.0) (60.0) (60.0)
Total Local GF Aid 8,285.6 7,247.5 7,268.4 7,393.7
Total GF Appropriations $15,943.0 $14,787.2 $15,377.0 $16,021.1

17
…And Is Falling as a Percent of Total GF Appropriations
FY 2009 FY 2010 FY 2011 FY 2012
Direct Aid to K-12 35.2% 32.3% 30.8% 30.6%
Health and Human Services Aid 5.6% 5.9% 5.4% 5.1%
Public Safety Aid 4.6% 3.8% 4.4% 4.0%
Car Tax 6.0% 6.4% 6.2% 5.9%
Constitutional Officers 1.0% 1.0% 0.9% 0.9%
Aid-to-Locality Reduction -0.3% -0.3% -0.4% -0.4%
Total Local GF Aid 52.0% 49.0% 47.3% 46.1%

18
Existing Spending Pressures Will Limit State Aid to Localities for Foreseeable Future
• Constitutional requirement to fill Rainy Day Fund.
- Requires deposit of half of growth above previous six-year average GF revenue growth. Expect $200-300 million/year in deposits
in FY 2014-2017 to restore fund.• Continued 10% Medicaid growth rates (costs + utilization), plus new
health care bill requirements in 2014 (additional Medicaid eligibility costs state $100’s of millions /yr).
• VRS contributions for both teachers and state employees will have to be restored to actuarially sound levels. Plus, adopted budget calls for 10 year payback of prior cuts. Employer rates will significantly increase.
• Continued growth in future biennia debt service requirements.• Other numerous pent-up demands for additional state agency funding,
including growing VITA contractual demands.• No appetite for general fund tax increases and additional revenue
pressures for transportation first.

19
$80.1 $85.0
$156.6
$224.3
$361.5
$574.6
$715.6
$472.4
$247.5
$340.1
$482.3
$1,064.7
$1,189.8
$1,014.9
$575.1
$295.2$305.3$365.9 $378.4
$613.6
$920.6
$1,216.7
$1,526.4
$1,682.0
$0.0
$200.0
$400.0
$600.0
$800.0
$1,000.0
$1,200.0
$1,400.0
$1,600.0
$1,800.0
FY 95 FY 96 FY 97 FY 98 FY 99 FY 00 FY 01 FY 02 FY 03 FY 04 FY 05 FY 06 FY 07 FY 08 FY 09 FY 10 FY 11 est
FY 12 est
FY 13 est
FY 14 est
FY 15 est
FY 16 est
FY 17 est
FY 18 est
Revenue Stabilization Fund Balances ($ Mil.)
Out-year RDF balances could rise even higher if constitutional amendment passes, increasing max. from 10-15% of major GF taxes

20
2010-12 VRS Teacher Rates May Triple in Future Biennia
2012-2014:“In setting the employer retirement contribution rates in subsequent biennia, the Board shall calculate a separate, supplemental employer contribution rate that will amortize the FY 2011 and 2012 contribution shortfalls over a 10-year period using the Board's assumed long-term rate of return. The Governor shall include funds to support payment of such Board-approved, supplemental employer contribution rates in the budget submitted to the General Assembly.”
Fall 2009 Spring 2010
VRS Board Certified Employer Rates VRS Adopted Budget Employer Rates
Retirement* = 12.91% Retirement* = FY 11: 3.93%; FY 12: 5.16%
Retiree Health Care Credit = 1.08% Retiree Health Care Credit = 0.60%
Group Life = 1.11% Group Life = 0.28%
VSDP = 0.66% VSDP = 0.00%
* Does not include 5% member contribution

21
1999 2000 2001 2002 2003 2004 2005 2006 2007 2008 2009 2010 2011 20120
1000
2000
3000
4000
5000
6000
7000
8000
Medicaid Expenditures Growing Faster Than Rest of State Budget
Fiscal Year
$ Mil.
FY 1999-09 Avg. Growth = 9%, FY 10 = 14.7%
* DMAS forecasted - does not include Medicaid expenditures for MH&MR facilities and CSA

22
FY 2009 FY 2010 FY 2011 FY 2012
K-12 Direct Aid 35.2% 32.3% 30.8% 30.6%
Higher & Other ED 12.2% 12.0% 11.6% 9.9%
Other HH&S 9.2% 9.6% 9.0% 8.5%
DMAS (Medicaid) 14.7% 16.3% 18.3% 21.2%
Public Safety/Comp Board 15.3% 14.6% 14.7% 13.8%
Car Tax 6.0% 6.4% 6.2% 5.9%
Debt Service 2.8% 3.2% 3.7% 3.8%
All Other 4.6% 5.6% 5.7% 6.2%
General Fund Appropriation Trends

23
VACO/VML Survey Results Indicate Localities Still Pessimistic
23
Meet its financial needs Better Same Less Able
All Localities(127):
FY 2010 as compared to FY 2009? 2.3% 29.0% 68.7%
FY 2011 as compared to FY 2010? 6.3 32.8 60.9
FY 2012 as compared to FY 2011? 2.4 39.4 58.3
Cities (37):
FY 2010 as compared to FY 2009? 0.0% 23.7% 76.3%
FY 2011 as compared to FY 2010? 0.0 35.1 64.9
FY 2012 as compared to FY 2011? 2.7 45.9 51.4
Counties (90):
FY 2010 as compared to FY 2009? 3.2% 31.2% 65.6%
FY 2011 as compared to FY 2010? 8.9 31.1 60.0
FY 2012 as compared to FY 2011? 2.2 36.0 61.8

24
Survey Indicates Declining State Aid a Major Concern for Localities
Localities Citing Concern: 2009 Total 2010 Total
Declining personal property assessments 33 5
Declining real property values and taxes 48 33
Declining sales taxes 19 15
Other taxes and local revenue declining 78 15
Declining economic conditions 45 10
Declining state aid 72 73
Declining state aid to Education 11 16
Declining state aid to CSA /Social Services 1 5
Declining state aid to Comp Board 3 14
State mandates 9 13
Elimination of stimulus funds 13 5
Declining federal funds 0 8
Maintain level of services 3 2
Elimination of 599 Funds 2 0
Other 16 11
Total Concerns Expressed 353 246

25
Local Government Budgets Reduced by 2.7% and School Budgets by 3.3% in FY 2011 *
In Top 3 Budget Balancing Actions
Delay or cancellation of capital outlay/infrastructure 40Personnel layoffs- RIF 33Increase tax rates 29Targeted cuts in other services and programs 27Draw down reserves 26Targeted cuts in public education 25Hiring freeze 18Across the board service cut 16Renegotiate debt 13Delay of annual equip. replacement programs 12Reduced contributions to civic/cultural 11Reducing staff health care benefits 10Fee increases 7
Replacing local general funds with special funds 6Salary or wage reductions 6Early retirement incentives 5Targeted cuts in public safety services 5Personnel furloughs 3Other 16
* 109 localities responding

2626
There Have Been Large Shifts in Virginia Employment Over the Last 10 Years
Source: Virginia Employment Commission
June 2000 Employment
June 2010 Employment Change % Change
Total Nonfarm 3,557,400 3,674,400 117,000 3.3%
Natural Resources and Mining 11,500 9,700 (1,800) -15.7%
Construction 214,600 182,600 (32,000) -14.9%
Manufacturing 364,900 231,800 (133,100) -36.5%
Trade, Transportation, and Utilities 648,100 623,300 (24,800) -3.8%
Information 120,000 74,700 (45,300) -37.8%
Finance 180,700 178,300 (2,400) -1.3%
Professional and Business Services 575,200 643,400 68,200 11.9%
Educational and Health Services 330,700 460,000 129,300 39.1%
Leisure and Hospitality 317,700 366,900 49,200 15.5%
Other Services 162,200 197,700 35,500 21.9%
Government 632,000 706,000 74,000 11.7%
Federal 158,700 180,600 21,900 13.8%
State 139,400 149,500 10,100 7.2%
Local 333,900 375,900 42,000 12.6%

27
Where Are Jobs Coming Back?June 2009
EmploymentJune 2010
Employment Change 1 Year % Change
Total Nonfarm 3,678,000 3,674,400 (3,600) -0.1%
Natural Resources and Mining 10,100 9,700 (400) -4.0%
Construction 192,100 182,600 (9,500) -4.9%
Manufacturing 238,300 231,800 (6,500) -2.7%
Trade, Transportation, Utilities 625,200 623,300 (1,900) -0.3%
Information 81,800 74,700 (7,100) -8.7%
Finance 181,800 178,300 (3,500) -1.9%
Professional and Business Services 639,300 643,400 4,100 0.6%
Educational and Health Services 450,700 460,000 9,300 2.1%
Leisure and Hospitality 364,000 366,900 2,900 0.8%
Other Services 188,400 197,700 9,300 4.9%
Government 706,300 706,000 (300) 0.0%
Federal 166,200 180,600 14,400 8.7%
State 148,600 149,500 900 0.6%
Local 391,500 375,900 (15,600) -4.0%

28
Local Government Job Losses by MSA
28
MSA RegionJune 2009 - June 2010
Job Changes
Northern Virginia (5,700)Hampton Roads (4,800)Richmond (3,600)Roanoke-Blacksburg (800)Charlottesville (500)Danville (200)Harrisonburg (100)Lynchburg 200
Source: Virginia Employment Commission

29
Localities Should Plan On Tough Budgets for Foreseeable Future
• Federal relief is waning. • Do not expect meaningful increases in state aid for
several biennia.• While a double-dip recession is not likely, job
growth and real estate recovery will likely be slow, therefore:
- Slow increases in real estate assessments;
- And slow growth in most other local taxes.