forecasting knife homicide risk from prior knife assaults ... · forecasting knife homicide risk...
TRANSCRIPT
Forecasting Knife Homicide Risk from Prior KnifeAssaults in 4835 Local Areas of London, 2016–2018
John Massey, et al. [full author details at the end of the article]
Published online: 14 April 2019# The Author(s) 2019
Abstract
Research Question How accurately can all recorded locations of 97 knife homicides inone year be forecast across all 4835 Lower Layer Super Output Areas (LSOAs) ofLondon, based only upon all 3506 known locations of nonfatal knife injury assaults inthe preceding year?Data All recorded “knife crimes” in the Metropolitan Police Service (MPS) area ofLondon in the financial year 2016–2017 (year 1) were manually reviewed to identify all3506 reported locations of knife-enabled (KE) but nonfatal injuries, as distinct fromother events digitally coded as “knife crimes”, such as displaying, threatening with, orcarrying knives. All KE homicides in 2017–2018 (year 2) were then added to thedatabase.Methods Each KE injury assault in year 1 was classified for occurrence in one ofLondon’s 4835 LSOAs. The total N of such crimes within each LSOA was summedacross all records to divide all LSOAs into seven categories of frequency of KE injuryassaults in 2016/2017: 0, 1, 2, 3, 4, 5, and 6 or more. We then divided the N of LSOAsin each category in 2016/2017 (year 1) into the total N of knife homicides in 2017/2018(year 2). False positives, false negatives, and percentage of homicides targeted werecalculated for six different targeting plans.Findings Over two thirds (69%) of KE homicides in 2017/2018 (year 2) occurred injust 67 (1.4%) of all 4835 LSOAs, comprising 3.3% of the 2048 LSOAs that had hadone or more of the 3506 KE injury assaults mapped in 2016/2017 (year 1). Theproportion of LSOAS with a KE homicide in year 2 was higher where there werehigher numbers of KE injury assaults per LSOA in year 1. Among LSOAs with zeroassaults in year 1, only 1% had a KE homicide in year 2. Among LSOAs with six ormore KE injury assaults in year 1, 15% had a KE homicide in year 2. While the risk ofhomicide was 1400% higher in the hottest spots of knife assaults than in the coolestspots, the absolute number of year two KE homicides in those hottest areas was only6% of the total. All LSOAs with one or more year 1 KE assaults had three times asmuch KE homicide risk than LSOAs with no year 1 KE assaults. Targeting all 2048areas that had one or more year 1 KE assaults would have yielded a true positive rate ofover 3% and covered 69% of actual homicide locations. The true negative rate for 2781areas that would not have been targeted based on having no year 1 KE injuries wouldhave been 99%.
Cambridge Journal of Evidence-Based Policing (2019) 3:1–20https://doi.org/10.1007/s41887-019-00034-y
Conclusions Predicting which local areas are most likely to suffer knife-enabled homi-cides, based only on recent nonfatal knife injuries, can pinpoint risks of homicide inlocal areas that are up to 1400% higher than in most local areas, offering a range ofstrategies for resource allocation.
Keywords Homicide .Knives . Prediction .Knife assaults . Targetingaccuracy.Hot spots .
Lower Layer Super Output Areas . LSOA
Introduction
How predictable are the locations of knife homicide in London? That question isdifficult to answer based on professional experience, given the rarity of homicides inany specific location. As Mark Jackson of the Metropolitan Police Service (2010)discovered, only 12% (579) of all 4765 local census areas of London had any knife-enabled homicides over the 10 years from 2000 to 2010. Over 365 days from April2017, our own study finds that only 1% of the 4835 local areas (2011 Census) had anyof the locatable 97 knife-enabled (KE) homicides. Moreover, there were no local areasthat had more than one such homicide, which means that there were no hot spots ofrepeated knife homicides that year (contra Sherman et al. 1989; Weisburd 2015).
There were, however, clearly identifiable hot spots of nonfatal KE assaults. It isthese nonfatal knife crimes that provide a reliable, if far from perfect, basis forforecasting KE homicides over the time span of 1 year. Over two thirds (69%) of allKE homicides in 2017/2018 (which this study calls “year 2”) occurred in the 2048 localareas where one or more of the 3543 KE assaults were reported to have occurred inLondon in “year 1” (2016/2017). Interspersed between those hot spots, at the sametime, were 2787 areas that had zero nonfatal KE assaults in 2016/2017 (year 1), andonly 1% of those had a KE homicide in year 2.
Such rare events are difficult for any professional to forecast based on personalexperience alone (Sutherland and Mueller-Johnson 2019). Even if police officersconsult digitized crime records and maps, however, they would be misled by the failureof official statistics to count the precise behavior that kills: stabbing or cutting peoplewith knives. Under current record-keeping systems, what the Office of NationalStatistics presents a wide array of crimes in which a knife was used: threats to kill,robbery, assaults without injury, etc. (ONS 2019). The only way to identify wherevictims of stabbing were stabbed nonfatally in England in 2019 is to read the full text ofa narrative report, with no digital code available to indicate actual stabbings.
Yet it is the actual stabbing behavior that is critically important for the problem ofKE homicide. Remarkably, the ratio of deaths per stabbing in London in 2016/2017was 1 in 66 (see below), while in Chicago in 1965, it was almost identical at 1 in 55(Zimring 1968). Given a large body of weapons crime research available in the USA(Wellford et al. 2005), our aim was to test the forecasting value of precisely countingthe behavior most likely to cause death by knife.
Our objective in this article is to demonstrate whether comprehensive statisticalanalysis of where KE assaults have occurred in the recent past will help to forecastwhere KE homicides are most likely to occur in the near future. While we do notcompare that forecasting method to the accuracy of forecasts based on qualitative
2 Cambridge Journal of Evidence-Based Policing (2019) 3:1–20
intelligence, we note that there is presently no research evidence available on theaccuracy of either method of forecasting murder. By testing the comprehensive data-driven approach over 2 years, we can at least set a benchmark of predictive accuracy forother methods to beat. We also hope to assess the value of a major investment in a rapidchange of crime counting systems, in order to count, map, and analyze KE assaultsseparately and distinctly from all other knife crimes.
A Digital Policing Strategy
Such forecasts as we present here can become even more accurate if they are embeddedinto a digital policing strategy—one that uses ongoing data processing programs toupdate the city-wide homicide forecasts immediately upon new information being addedto a forecasting model. Yet, we must recognize the substantial imitations of anyforecasting of homicide risk by location. Even if we knew with 100% probability wherehomicides would happen in London during one of the 525,600 min a year, we would begreatly challenged to predict when they will occur across the possible targets of525,600 min × 4835 local census areas, which is equal to 2.5 billion place minutesper year. On the other hand, if we define the challenge of evidence-based targeting assending police to where they would bemost likely to prevent homicide, a digital policingapproach should offer great advantages over conventional policing. By using up-to-the-minute data on well-tested predictors, police commanders could move resources imme-diately to where they may produce the greatest benefits in saving lives. That challenge isespecially salient with homicides committed by concealed weapons, notably knives andguns.
What predictors might work best? A digital policing strategy, in the not-too-distantfuture, could monitor London’s crime patterns in real time for daily forecasting oflocations at the highest risk of a knife-enabled homicide. Many variables, from socialmedia activity to the weather, could become part of a forecasting model, as discussed ata Ditchley Foundation conference chaired by Metropolitan Police Service (MPS)Commissioner Cressida Dick (Dick 2018). Yet, the entire concept of forecastingremains unfamiliar and often controversial, with frequent misunderstandings. Beforea complex forecasting model is used to deploy police resources, police legitimacywould be well served by having a transparent, single-predictor basis for demonstratingthe very great (and statistically predictable) differences in homicide risk levels fromeach local area to all others.
Counting Near-Miss Murders
The most fundamental starting point for predicting most kinds of rare events is near-misses of those events, in which the highest harm level almost occurs but does notactually happen. In air traffic safety, the near-miss concept implies that no harm occursat all, as when two planes almost collide but do not. In policing, however, therelationship between fatal and nonfatal violence has long been understood to comprisea near-miss to a fatal injury. Using such near-misses to forecast homicide, based onlong-term patterns of prior assaults (Mohler 2014), has been shown to provide sub-stantial improvements over short-term-only analyses, especially by using most recentdata in combination with longer-term patterns.
Cambridge Journal of Evidence-Based Policing (2019) 3:1–20 3
Testing Tactics in Targeted Hot Spots
Even daily updates of such forecasting, however, do not provide guidance on theparticular police practices that should be employed in each high-risk location. Exactlywhat to do is, of course, a matter for testing, given reliable targeting of where to do it(Sherman 2013). Fortunately, in the case of weapon-enabled homicide, there is alreadya growing body of theory and evidence, albeit mostly from the USA. One theory datesto 1980, when two Harvard criminologists (Wilson 1980; Moore 1980) independentlyproposed that gun homicides could be reduced by focusing on widespread gun carryingby numerous gun carriers. The Harvard theory emerged shortly after the criminologicalperspective called routine activity theory (Cohen and Felson 1979), which itself built onthe UK Home Office situational crime prevention literature (Mayhew et al. 1976), all ofwhich stressed that opportunity is essential for committing a crime.
By focusing on concealed weapons as the proximate opportunity for committingmost weapon-enabled homicides, the Harvard theorists suggested that police coulddeter decisions to carry weapons more readily than police could deter decisions tocommit homicide. Wilson and Moore argued, in effect, that if illicit weapons are left athome for fear of arrest for illegal carrying, people inclined to use those weapons willhave no opportunity to use them when encountering someone they might decide toattack. The deterrence of weapon carrying would thus block the opportunity to commithomicide, which would then reduce the frequency of homicide itself.
The evidence testing the Wilson-Moore theory has consistently supported its pre-diction. In a series of field tests in Kansas City (MO) (Sherman et al. 1995), Indianap-olis (McGarrell et al. 2001), Pittsburgh (Cohen & Ludwig 2003), and St. Louis(Rosenfeld et al. 2014), police consistently found support for the target-the-carryingstrategy causing a reduction in murders or weapons injuries [see also Bogota and Caliin Colombia (Villaveces et al. 2000)]. Shootings of guns, measured by either deaths,hospital treatment, or crime reports, went down in the test sites of all of these studies,relative to untreated high-shooting areas, when police targeted high-harm areas withproactive patrols and stop-search strategies. According to a systematic review of mostof this work (Koper and Mayo-Wilson 2006), not one test failed to find evidence thatcriminal weapon usage declined when police targeted weapon carrying—in hot spotareas where weapon crime was concentrated. In each US case, this strategy began withcareful analysis of where weapon-enabled homicides were most likely to occur, andconcluded with intensive proactive policing of weapon carrying in those areas.
Do Near-Miss Injuries Predict Knife Homicide in London?
That proactive US strategy has been at the core of a long debate over stop and search inEngland andWales. In general, however, theUKdebate has neglected any discussion of twokinds of evidence. One is the evidence that stop-and-searchworks best when it is confined toa tiny fraction of a city where weapons crimes are most likely to occur. The US evidenceshowed success of using stop and search, but not just anywhere. It is all tested on preciselytargeted crime hot spots, as distinct from an undifferentiated use of that tactic across any andall locations. The other evidence missing in the UK debate has been research on whethergeographic concentrations of weapon-enabled homicides even exist in the UK—a crucial
4 Cambridge Journal of Evidence-Based Policing (2019) 3:1–20
premise for a policy of limiting the most intrusive policing to that tiny fraction of any city inwhich a risk of weapon-enabled homicide is highest.
This article contributes to that second area of evidence missing from the UK debate.It is only a first, but crucial, step towards a more refined digital policing strategy forpreventing homicide. This step provides what appears to be the first UK test of thehypothesis that any form of homicide can be predicted in micro-areas on the basis ofprior near-misses, or nonfatal assaults using the same weapon as the fatal assaults. Byusing 4835 small census areas across London to pinpoint where knife carrying mostcommonly leads to nonfatal woundings, the article assesses whether the locations ofthose KE woundings can provide more accurate forecasts of future KE homicidelocations.
Targeting Lower Layer Super Output Areas
In adopting this approach, this study builds upon the work of Metropolitan PoliceService Detective Superintendent Mark Jackson (2010), whose Cambridge M.St. thesisfirst analyzed London’s homicide distribution within relatively small locations calledLower Layer Super Output Areas (LSOAs). These areas, like US Census tracts, aredefined by the decennial UK Census of the Office of National Statistics. These geo-graphical areas, in London in 2011, were home to an average of 1722 people each (basedon the last census) and may be as small as 200 metres square. Nationally, each LSOAhad 400 to 1200 households (Office of National Statistics 2011, 2019).
What Jackson (2010) showedwith these areas was not just the concentration of knife-enabled homicide in a small number of these areas (with 88% of LSOAs across Londonfree from any knife homicides over 10 years). He also showed that these “homicidehotspots” are themselves geographically very small. That size means that, in theory, KEhomicide can be more effectively prevented by concentrating police resources at higherlevels of blue uniforms or police cars per square foot (Sherman 2013).
While the MPS in 2019 is reorganizing 32 separately run operational command units(OCUs) into only 12, far larger, basic command units (BCUs), it becomes even moreimportant for BCU commanders to have micro-level data on each LSOA. Jackson’s(2010) discovery that only 6% of LSOAs accounted for 42% of all homicides over10 years showed the serious limitation of using large areas as operational units ofanalysis. Most parts of the 32 large OCUs had no homicide at all for a decade.Targeting at the LSOA level, however, revealed patterns of homicides recurring inmany LSOAs year after year.
The purpose of such analysis is not a passive prediction of future homicide trends.Rather, our aim is to show how useful it would be for digital policing to produceregularly updated maps of locations where homicide is most likely to occur in the nearfuture. This should, in principle, enable police leaders to target, and even test, moreefficient and effective measures to prevent homicides with digital policing forecasts.
Research Questions
This article addresses a small but vital subset of a larger analysis of homicide acrossLondon in 2008–2018 reported in the first author’s M.St. thesis (Massey 2018). Our
Cambridge Journal of Evidence-Based Policing (2019) 3:1–20 5
present focus is on how the key elements of that analysis can be turned into decisionsupport tools for operational policing. The central question is how best to forecast andtarget locations where most KE homicides are most likely to occur.
That broad question has many potential answers. This study focuses on whether one ofthe most powerful answers is to look closely at near-miss homicides as a powerful predictorof completed homicides. Our focus is purposely limited to KE homicides and near-missesbecause they have risen most rapidly in recent years. They are also homogenous group thatoffers more reliability in predictions than the full diversity of all homicides. While manyother predictors could ultimately contribute to a daily forecastingmodel, we limit the presentanalysis so that a wide audience can understand how purely objective criteria can be used fortargeting police resources to save lives.
These are the four specific research questions for this article:
1. Does the prevalence of KE homicide across LSOAs in a given year (year 2)predictably increase with higher frequency of KE assaults in an LSOA in the prioryear (year 1)?
2. If so, how much higher is the highest risk level for KE homicide compared to thelowest risk level, in terms of the likelihood that any KE homicide occurs in year 2?
3. What is the level of “sensitivity” or true positive homicide prediction rate from adecision to target LSOAs with extra policing resources at different levels of KEassaults?
4. What is the level of “specificity” or true negative rate from a decision to targetLSOAs with extra policing resources at different levels of KE assaults?
While these questions are basic to all evidence-based targeting decisions, from cancertreatment to automobile safety, they are rarely addressed in a policing context. Wepresent them as the first step in forecasting and targeting not only KE homicide, butalso any kind of rare and highly harmful outcomes in policing. The same questionscould be asked about targeting missing persons’ investigations, or allocating specialtraffic speed enforcement to frequent crash zones. The answers to these four questionscannot tell police what to do, or even where to do it. Nonetheless, they are essential tomaking informed choices about how to balance the strengths and limitations of anycourse of action.
Data
Two main data sources were required for this analysis: the locations of KE homicidesand the locations of KE assaults. The former was readily available. The latter posedsubstantial barriers and costs in classification. (Digitizing these data would be the firststep for implementing this method of forecasting knife murders).
Underpinning both datasets is the Metropolitan Police Crime Reporting InformationSystem (CRIS). The MPS records every allegation or instance of crime within CRIS; indoing so, a plethora of different data items is recorded by the reporting officer and thesecondary investigating units. A selection of these data was extracted from the originaldatabase to construct a new, tabulated record of every single recorded homicide for theperiod 2008–2018 (using sequential, financial year periods). This included all forms of
6 Cambridge Journal of Evidence-Based Policing (2019) 3:1–20
“culpable” homicide (i.e., manslaughter) but not attempts. Each homicide event thenhad appended to the weapon used.
Typological and demographical detail on the CRIS system is created initially by thefirst recording officer and later amended by the investigating unit if subsequentenquiries prove a particular code to have been missed or erroneously appended. Forexample, if a homicide were later discovered to be drug-related, a “flag” would beadded to the crime report to this effect; these flags are the characteristic features of theevent or victim that are absorbed into the dataset.
In addition, each homicide event, treated as a single unit of analysis, had affixed to itthe corresponding geocoded location of the homicide (LSOA). In three of the 100 knife-enabled homicides in 2017/2018, the location of the stabbing could not be determinedafter the victim was admitted to hospital. Therefore, our analysis is based on all 97 of theKE homicides in which a geographic location of knife attack was recorded.
In a separate dataset, each of the 3543 nonfatal knife injury offenses in 2016/2017was entered and their geographical locations were added. The initial data were derivedfrom the CRIS database compiled by MPS police officers. Because a manual review [oftext] was required to determine, in every case, whether an assault was knife-enabledand in which LSOA each KE assault occurred, it was only possible to code a single,most recent year’s accessible data. These data were further transformed to make eachLSOA a unit of analysis. Once these data had been extracted and collated, thecorresponding homicide counts for both year 1 (2016–2017) and year 2 (2017–2018)were added to the KE assault data in year 1 in each corresponding LSOA.
For year 1 (2016/2017), only 3506 of the 3543 nonfatal knife injury offenses couldbe geocoded; for the rest, the location of the stabbing was not known. Further analysisrevealed that 2048 different LSOAs were the locations for these 3506 nonfatal knifeassaults. Thus, 42% of London’s 4835 LSOAs experienced a knife assault in2016/2017, while 97 (2%) of the total 4835 had one or more homicides in 2017/2018.
Limitations and Data Integrity
Verification of CRIS data integrity was undertaken through reference to a separate com-puter database, the Home Office Large Major Enquiry System (HOLMES)—employedseparately by investigators working within the Homicide and Major Crime Command. A(dip-sampled) cross-comparison of the same events as recorded in both CRIS andHOLMES was used to test whether a vital detail in CRIS was accurate, in 42 separatehomicides, each selected randomly from the period. All 42 were found to hold the sametypological and demographic data in HOLMES as the CRIS report of the same incident.
Each event can, of course, be given more than one categorical label. A knife-enabledhomicide can equally be counted as a domestic/familial homicide or, likewise, a drug organg-related homicide—if all of these characteristics are also present within thesurrounding circumstances. For more details on data collection, see Massey (2018).
Methods
The primary method of this analysis is to compare all London LSOAs in the financialyear 2016/2017 (year 1) to all LSOAs in 2017/2018 (year 2). By sorting each LSOA
Cambridge Journal of Evidence-Based Policing (2019) 3:1–20 7
into different categories in each of the 2 years, the study was able to use year 1 codingto forecast year 2 patterns. The year 1 data combined all LSOA-specific frequenciesfrom CRIS data listing knife-enabled serious assaults. The year 2 data on KE homicideswere then assessed for risk levels in relation to whether each LSOA with a year 2homicide had been coded for having had 0, 1, 2, 3, 4, 5, or 6 or more knife-enablednonfatal injury attacks in year 1.
We then computed the prevalence (in percent) of year 2 KE homicides amongLSOAs in each of the seven KE assault frequency categories in year 1. The magnitudeand differences in percentages were calculated in the simplest terms possible, to makethe findings transparent to the widest possible audience for a dialog of police legitimacy(Bottoms and Tankebe 2012).
What is harder to explain to a wider audience is the difficult trade-off between thespecificity and sensitivity of a forecasting tool (Yerushalmy 1947). The specificity of aprediction is defined as the true positive rate: what proportion of all predictions (ordetections, as in cancer or other diseases for which tests are conducted on people) turnout to be accurate? (The false positive rate is derived by subtracting the true positivepercentage from 100%; see Table 2). The sensitivity of a prediction, in contrast, is theprobability of a negative prediction being accurate: the true negative rate. (The truenegative rate is derived by subtracting the false negative percentage from 100%). In aperfect prediction, both positive and negative predictions would be 100% true. Inpractice, forecasting usually confronts an inverse relationship between true positivesand true negatives: the higher the true positive rate, the lower the true negative rate. Themore false positives a prediction avoids, the more false negatives it is likely to generate.
The method of presenting both specificity and sensitivity in comparison to eachother (see Table 2 below) offers a more precise way of framing difficult resourceallocation decisions for senior police leaders.
Findings
Facts on the Context
Rising Homicides
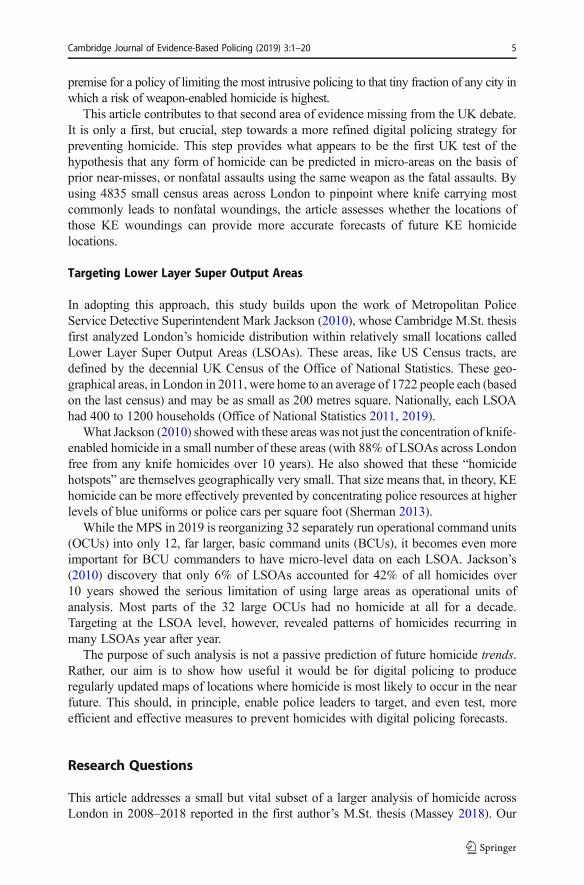
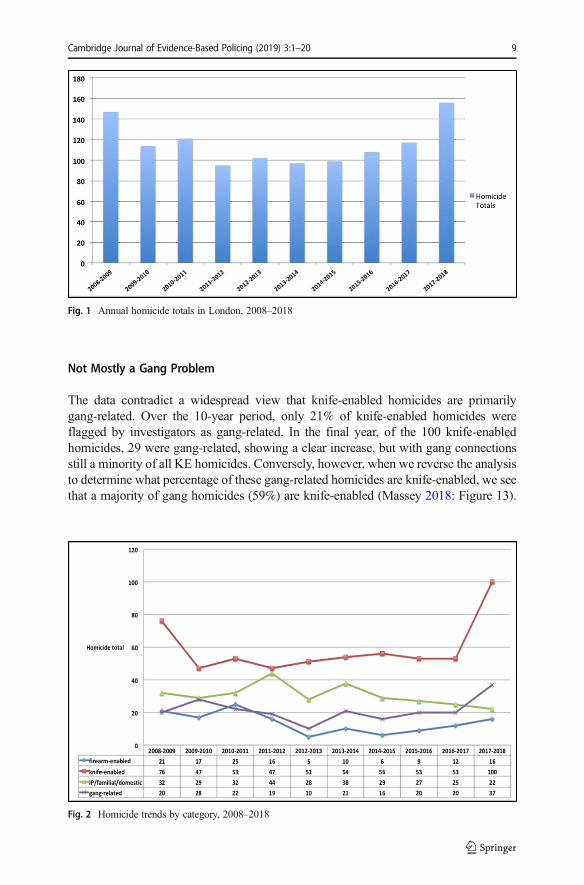
This study was undertaken in a period of rising total homicides in London, as displayedin Fig. 1.
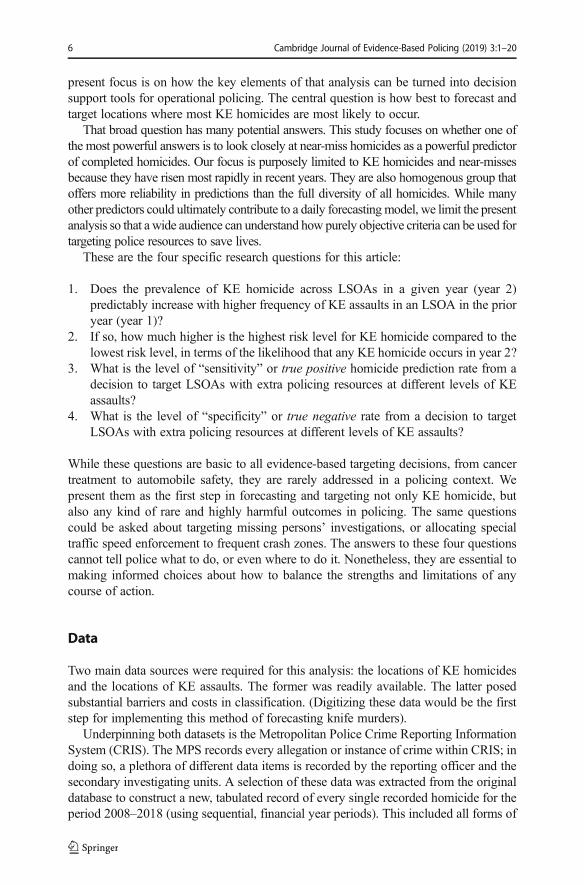
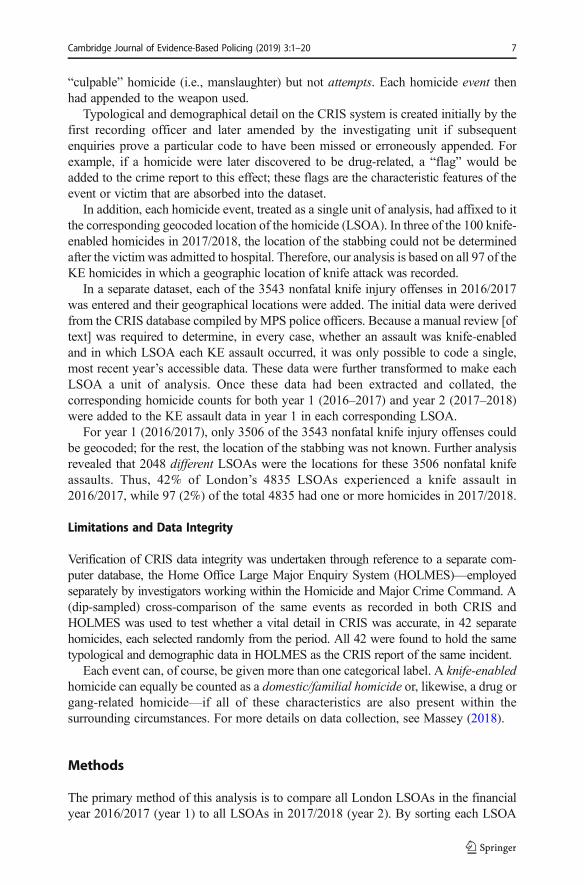
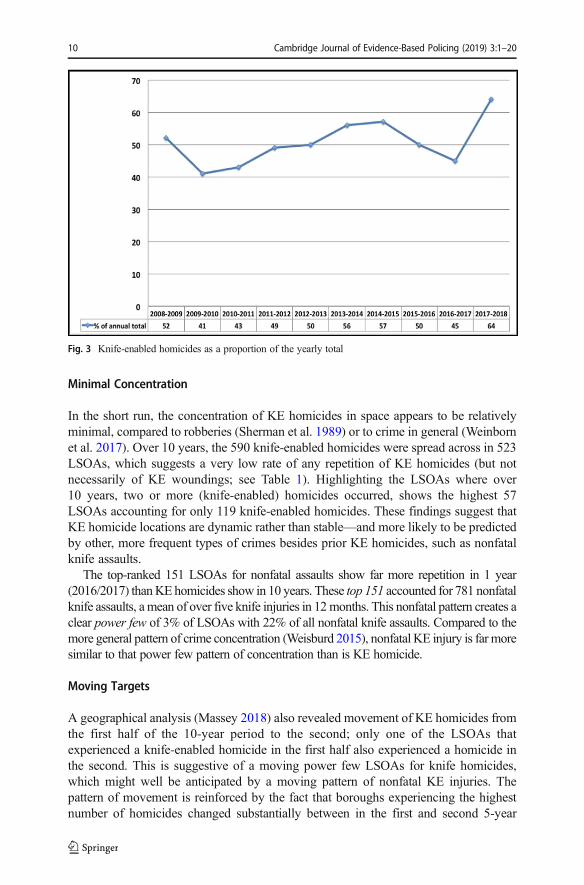
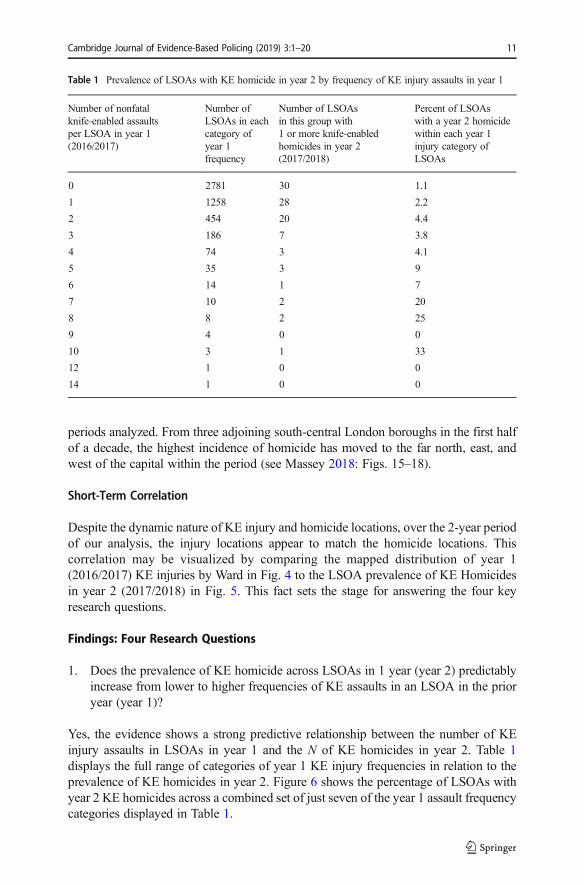
The study period had an even more rapid increase in KE homicides, as shown in Fig. 2,with a 100% increase from 50 to 100 KE homicides in 2016/2017 to 2017/2018, reachinga record high annual proportion over the decade of two thirds of total homicides (Fig. 3).
In the 10-year period to 2018, there were 590 knife-enabled homicides acrossLondon. As a proportion of the yearly total for all kinds of homicide, KE homicideshowed some annual variation. Excluding the final year, the proportion of KEs rangedfrom a high rate of 57% of total to a low rate of 41% of total homicides. Where bothfigures align is at the point of the marked increase of both measures in the final year(see Massey 2018: Fig. 12 and appendix 3). As a raw total, there were 100 knife-enabled homicides in 2017/2018, almost a 100% increase over all but one of theprevious 10 years.
8 Cambridge Journal of Evidence-Based Policing (2019) 3:1–20
Not Mostly a Gang Problem
The data contradict a widespread view that knife-enabled homicides are primarilygang-related. Over the 10-year period, only 21% of knife-enabled homicides wereflagged by investigators as gang-related. In the final year, of the 100 knife-enabledhomicides, 29 were gang-related, showing a clear increase, but with gang connectionsstill a minority of all KE homicides. Conversely, however, when we reverse the analysisto determine what percentage of these gang-related homicides are knife-enabled, we seethat a majority of gang homicides (59%) are knife-enabled (Massey 2018: Figure 13).
Fig. 1 Annual homicide totals in London, 2008–2018
Fig. 2 Homicide trends by category, 2008–2018
Cambridge Journal of Evidence-Based Policing (2019) 3:1–20 9
Minimal Concentration
In the short run, the concentration of KE homicides in space appears to be relativelyminimal, compared to robberies (Sherman et al. 1989) or to crime in general (Weinbornet al. 2017). Over 10 years, the 590 knife-enabled homicides were spread across in 523LSOAs, which suggests a very low rate of any repetition of KE homicides (but notnecessarily of KE woundings; see Table 1). Highlighting the LSOAs where over10 years, two or more (knife-enabled) homicides occurred, shows the highest 57LSOAs accounting for only 119 knife-enabled homicides. These findings suggest thatKE homicide locations are dynamic rather than stable—and more likely to be predictedby other, more frequent types of crimes besides prior KE homicides, such as nonfatalknife assaults.
The top-ranked 151 LSOAs for nonfatal assaults show far more repetition in 1 year(2016/2017) thanKEhomicides show in 10 years. These top 151 accounted for 781 nonfatalknife assaults, a mean of over five knife injuries in 12months. This nonfatal pattern creates aclear power few of 3% of LSOAs with 22% of all nonfatal knife assaults. Compared to themore general pattern of crime concentration (Weisburd 2015), nonfatal KE injury is far moresimilar to that power few pattern of concentration than is KE homicide.
Moving Targets
A geographical analysis (Massey 2018) also revealed movement of KE homicides fromthe first half of the 10-year period to the second; only one of the LSOAs thatexperienced a knife-enabled homicide in the first half also experienced a homicide inthe second. This is suggestive of a moving power few LSOAs for knife homicides,which might well be anticipated by a moving pattern of nonfatal KE injuries. Thepattern of movement is reinforced by the fact that boroughs experiencing the highestnumber of homicides changed substantially between in the first and second 5-year
Fig. 3 Knife-enabled homicides as a proportion of the yearly total
10 Cambridge Journal of Evidence-Based Policing (2019) 3:1–20
periods analyzed. From three adjoining south-central London boroughs in the first halfof a decade, the highest incidence of homicide has moved to the far north, east, andwest of the capital within the period (see Massey 2018: Figs. 15–18).
Short-Term Correlation
Despite the dynamic nature of KE injury and homicide locations, over the 2-year periodof our analysis, the injury locations appear to match the homicide locations. Thiscorrelation may be visualized by comparing the mapped distribution of year 1(2016/2017) KE injuries by Ward in Fig. 4 to the LSOA prevalence of KE Homicidesin year 2 (2017/2018) in Fig. 5. This fact sets the stage for answering the four keyresearch questions.
Findings: Four Research Questions
1. Does the prevalence of KE homicide across LSOAs in 1 year (year 2) predictablyincrease from lower to higher frequencies of KE assaults in an LSOA in the prioryear (year 1)?
Yes, the evidence shows a strong predictive relationship between the number of KEinjury assaults in LSOAs in year 1 and the N of KE homicides in year 2. Table 1displays the full range of categories of year 1 KE injury frequencies in relation to theprevalence of KE homicides in year 2. Figure 6 shows the percentage of LSOAs withyear 2 KE homicides across a combined set of just seven of the year 1 assault frequencycategories displayed in Table 1.
Table 1 Prevalence of LSOAs with KE homicide in year 2 by frequency of KE injury assaults in year 1
Number of nonfatalknife-enabled assaultsper LSOA in year 1(2016/2017)
Number ofLSOAs in eachcategory ofyear 1frequency
Number of LSOAsin this group with1 or more knife-enabledhomicides in year 2(2017/2018)
Percent of LSOAswith a year 2 homicidewithin each year 1injury category ofLSOAs
0 2781 30 1.1
1 1258 28 2.2
2 454 20 4.4
3 186 7 3.8
4 74 3 4.1
5 35 3 9
6 14 1 7
7 10 2 20
8 8 2 25
9 4 0 0
10 3 1 33
12 1 0 0
14 1 0 0
Cambridge Journal of Evidence-Based Policing (2019) 3:1–20 11
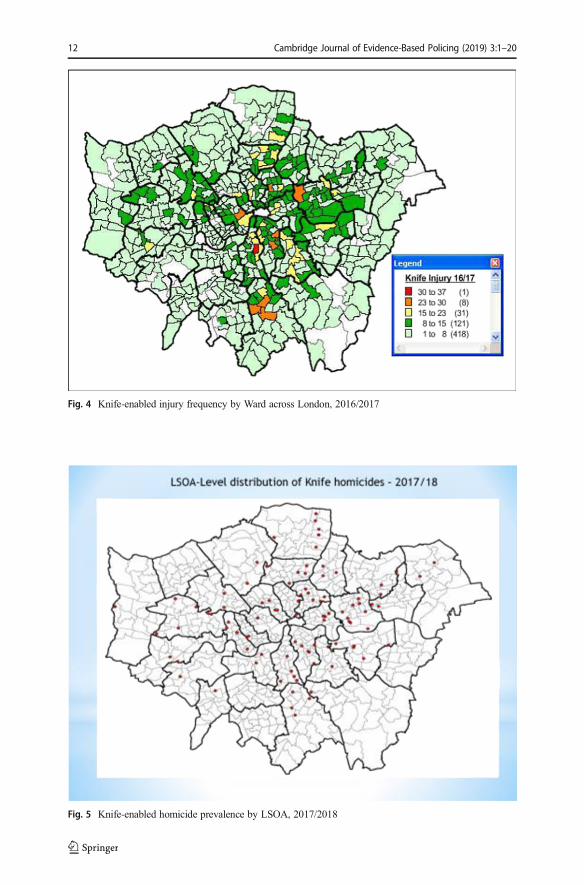
Fig. 4 Knife-enabled injury frequency by Ward across London, 2016/2017
Fig. 5 Knife-enabled homicide prevalence by LSOA, 2017/2018
12 Cambridge Journal of Evidence-Based Policing (2019) 3:1–20
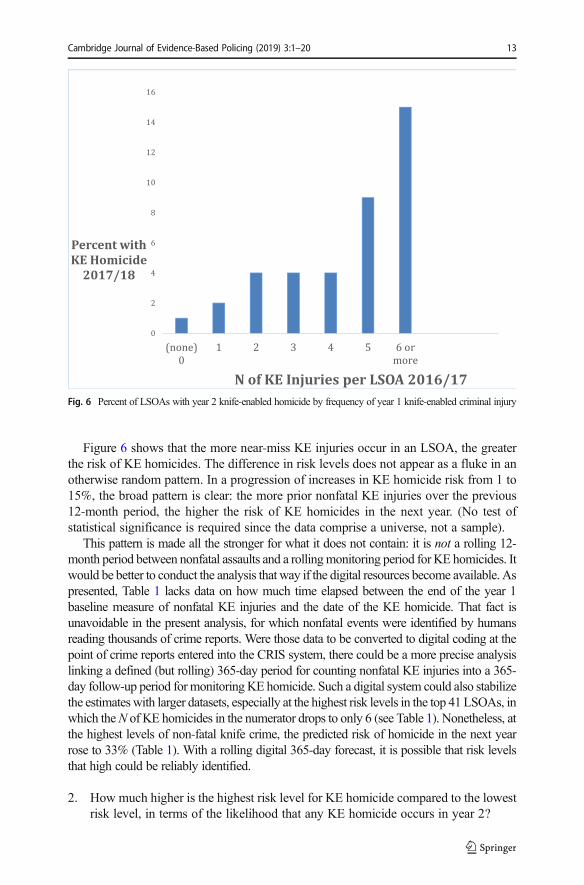
Figure 6 shows that the more near-miss KE injuries occur in an LSOA, the greaterthe risk of KE homicides. The difference in risk levels does not appear as a fluke in anotherwise random pattern. In a progression of increases in KE homicide risk from 1 to15%, the broad pattern is clear: the more prior nonfatal KE injuries over the previous12-month period, the higher the risk of KE homicides in the next year. (No test ofstatistical significance is required since the data comprise a universe, not a sample).
This pattern is made all the stronger for what it does not contain: it is not a rolling 12-month period between nonfatal assaults and a rollingmonitoring period for KE homicides. Itwould be better to conduct the analysis that way if the digital resources become available. Aspresented, Table 1 lacks data on how much time elapsed between the end of the year 1baseline measure of nonfatal KE injuries and the date of the KE homicide. That fact isunavoidable in the present analysis, for which nonfatal events were identified by humansreading thousands of crime reports. Were those data to be converted to digital coding at thepoint of crime reports entered into the CRIS system, there could be a more precise analysislinking a defined (but rolling) 365-day period for counting nonfatal KE injuries into a 365-day follow-up period formonitoring KE homicide. Such a digital system could also stabilizethe estimateswith larger datasets, especially at the highest risk levels in the top 41 LSOAs, inwhich theN of KE homicides in the numerator drops to only 6 (see Table 1). Nonetheless, atthe highest levels of non-fatal knife crime, the predicted risk of homicide in the next yearrose to 33% (Table 1). With a rolling digital 365-day forecast, it is possible that risk levelsthat high could be reliably identified.
2. How much higher is the highest risk level for KE homicide compared to the lowestrisk level, in terms of the likelihood that any KE homicide occurs in year 2?
Fig. 6 Percent of LSOAs with year 2 knife-enabled homicide by frequency of year 1 knife-enabled criminal injury
Cambridge Journal of Evidence-Based Policing (2019) 3:1–20 13
As Fig. 6 shows, there is a large difference in the 2017/2018 risk of KE homicides betweenthe 41 LSOAs that had six or more KE injuries the year before and the 2871 LSOAs that hadno KE injuries the year before. While the risk of KE homicides is not zero anywhere inLondon, in most places (especially where no previous knife assault injuries have recentlyoccurred), the homicide risk is only a tiny fraction of the risk at the highest levels of prior-yearinjuries. The highest risk level, based on nonfatal assaults, is 15 times higher than the lowest.
While the difference from the lowest (1% KE homicide risk) to the highest (15% KEhomicide risk) may appear to be small in absolute terms, it is a very large increase inrelative terms. It not only means that there is a 15% chance of a KE murder in areas thatmay normally receive no more patrol than adjoining areas of 1% risk. It also means thatrelative to other areas that police could target for homicide prevention, these areas areover 1400% more likely to have a murder than most LSOAs in London. The eventsremain rare for individuals. But for police, a target with a clearly identified 15% risk ofany homicide is also a rare event, usually prompting substantial investments inprotection. This clarity, of course, could be strengthened by replications of the analysiswithin London for other time periods, as well as in other UK cities.
3. What is the level of “sensitivity” or true positive homicide prediction rate from a decisionto target LSOAs with extra policing resources at different levels of KE assaults?
4. What is the level of “specificity” or true negative rate from a decision to targetLSOAs with extra policing resources at different levels of KE assaults?
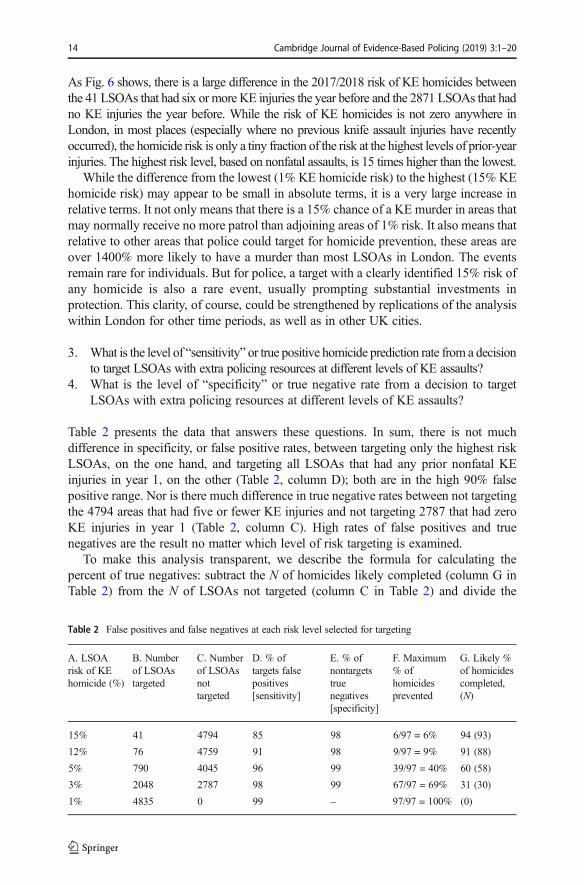
Table 2 presents the data that answers these questions. In sum, there is not muchdifference in specificity, or false positive rates, between targeting only the highest riskLSOAs, on the one hand, and targeting all LSOAs that had any prior nonfatal KEinjuries in year 1, on the other (Table 2, column D); both are in the high 90% falsepositive range. Nor is there much difference in true negative rates between not targetingthe 4794 areas that had five or fewer KE injuries and not targeting 2787 that had zeroKE injuries in year 1 (Table 2, column C). High rates of false positives and truenegatives are the result no matter which level of risk targeting is examined.
To make this analysis transparent, we describe the formula for calculating thepercent of true negatives: subtract the N of homicides likely completed (column G inTable 2) from the N of LSOAs not targeted (column C in Table 2) and divide the
Table 2 False positives and false negatives at each risk level selected for targeting
A. LSOArisk of KEhomicide (%)
B. Numberof LSOAstargeted
C. Numberof LSOAsnottargeted
D. % oftargets falsepositives[sensitivity]
E. % ofnontargetstruenegatives[specificity]
F. Maximum% ofhomicidesprevented
G. Likely %of homicidescompleted,(N)
15% 41 4794 85 98 6/97 = 6% 94 (93)
12% 76 4759 91 98 9/97 = 9% 91 (88)
5% 790 4045 96 99 39/97 = 40% 60 (58)
3% 2048 2787 98 99 67/97 = 69% 31 (30)
1% 4835 0 99 – 97/97 = 100% (0)
14 Cambridge Journal of Evidence-Based Policing (2019) 3:1–20
difference by the N of LSOAs not targeted (also column C of Table 2). The formula forfalse positives is similar: subtract the N of maximum homicides prevented (Table 2,column F) from the N of LSOAs targeted (column B) and divide the difference by the Nof LSOAs targeted (Table 2, column B).
What matters most for policing, however, is some measure of available resources.That is certainly a matter for testing. But, it is also a matter that is informed by theresults in Table 2. What matters most in police decisions is not the rates of falsenegatives, but the absolute number—especially for homicides. Hence, the discussion ofTable 2 in policing terms would likely place special emphasis on columns F and G.
These columns present commanders with five scenarios. The first is presented in thebottom row of the table: to assign equal levels of KE homicide prevention acrossLondon. That would guarantee that something has been done to stop every potentialKE homicide. It could also guarantee that very little can be done anywhere, includingthe highest risk areas, because London is so large.
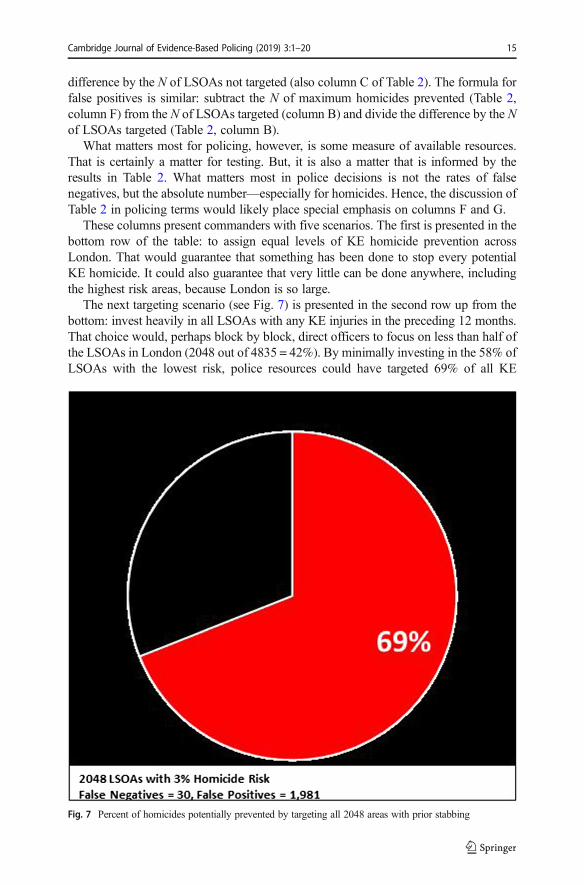
The next targeting scenario (see Fig. 7) is presented in the second row up from thebottom: invest heavily in all LSOAs with any KE injuries in the preceding 12 months.That choice would, perhaps block by block, direct officers to focus on less than half ofthe LSOAs in London (2048 out of 4835 = 42%). By minimally investing in the 58% ofLSOAs with the lowest risk, police resources could have targeted 69% of all KE
Fig. 7 Percent of homicides potentially prevented by targeting all 2048 areas with prior stabbing
Cambridge Journal of Evidence-Based Policing (2019) 3:1–20 15
homicides in 2017/2018, or 67 out of 97. Yet, that leaves 30 KE homicides that are notaddressed in the same way. And while the rate of false negatives is very low acrossthose thosuands of LSOAs not receiving extra resources (only 1%), the absolutenumber of 30 murders is very high in a London context.
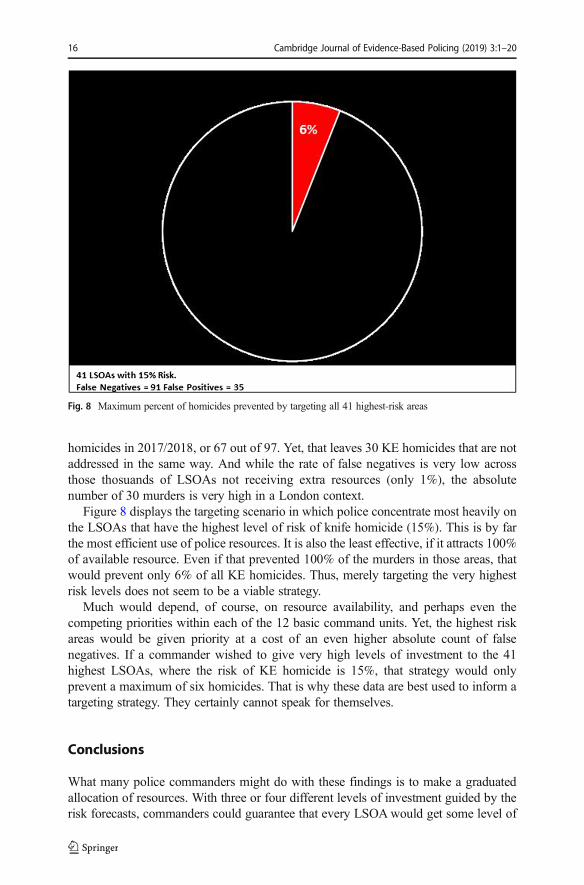
Figure 8 displays the targeting scenario in which police concentrate most heavily onthe LSOAs that have the highest level of risk of knife homicide (15%). This is by farthe most efficient use of police resources. It is also the least effective, if it attracts 100%of available resource. Even if that prevented 100% of the murders in those areas, thatwould prevent only 6% of all KE homicides. Thus, merely targeting the very highestrisk levels does not seem to be a viable strategy.
Much would depend, of course, on resource availability, and perhaps even thecompeting priorities within each of the 12 basic command units. Yet, the highest riskareas would be given priority at a cost of an even higher absolute count of falsenegatives. If a commander wished to give very high levels of investment to the 41highest LSOAs, where the risk of KE homicide is 15%, that strategy would onlyprevent a maximum of six homicides. That is why these data are best used to inform atargeting strategy. They certainly cannot speak for themselves.
Conclusions
What many police commanders might do with these findings is to make a graduatedallocation of resources. With three or four different levels of investment guided by therisk forecasts, commanders could guarantee that every LSOAwould get some level of
Fig. 8 Maximum percent of homicides prevented by targeting all 41 highest-risk areas
16 Cambridge Journal of Evidence-Based Policing (2019) 3:1–20
preventive policing against knife crime. Yet, they could also guarantee that the greatestinvestment in prevention could be targeted on the LSOAs with the greatest risk, wherethe chances of prevention are greatest and target areas are smallest in number.
To the extent that this study becomes a first step towards an automated digitalpolicing system, there is a potential for treating preventive policing much like reactiveresponse policing. If nonfatal stabbing occurs in an LSOA—and perhaps the thirdstabbing in 3 months (or what would more predicably happen with 3 stabbings in 3days or even three hours)—a high-risk level for that LSOA could be declared. Intensivepolicing, at least for a short period of time, could lead to greater risk of concealedweapons being detected. Arrests could increase for absconded persons in the LSOA.Focused deterrence on knife carrying could become highly visible. If a digital analysisshows that after several months, or even weeks or days, that the risk of KE homicidehas declined, the resources invested in preventing KE homicide in that area could be re-allocated to other areas that have recently received a high-risk-of-homicide forecast—perhaps defined as any short-term level of over 10% chance of a homicide.
A transparently calculated level of KE homicide risk could even become the basisfor a special authorization of police powers to use stop and search within the veryconfined area of an LSOA. This idea would likely require a substantial dialogue withlocal communities in order to gain legitimacy. Yet, the evidence supporting such adecision would at least be clear—unlike qualitative intelligence that can often not bedivulged as to its source nor transparently examined for its reliability.
Regardless of what commanders might do with these findings, the most importantpolicy implication of this analysis is that it is now operationally out of date: not the researchmethod, that is, but the specific lists of high-risk LSOAs. The analysis has shown that thesedata and methods can forecast KE homicide risk with known rates of error, in specificityand sensitivity. But, it is by definition a short-term analysis. The case for digital policing isthat a computer program can automatically run the same analysis every day, or even severaltimes a day, to present the most accurate forecasts on the most up-to-the minute datasets.
The brute fact is that such analysis is not possible under current IT systems in England.The digital category of nonfatal knife injury by assault, to our knowledge, does not exist inpolice records for England and Wales. It is only by manual labor that this analysis wasmade possible.We recommend that crime recording systems be altered as soon as possibleto allow a keystroke by the reporting officer to indicate the occurrence of a KE injury inany legal category of crime. Then and only then can the relevant data be accessed in realtime to use twenty-first-century data analysis to forecast when and where these murdersare most likely to occur—and most likely be preventable.
In broad strategic terms, a quintessentially utilitarian approach is indicated: policeleaders could deploy greater resources to the power few LSOAs to address the mostsignificant proportion of crime harm, achieving the greatest benefit for the largest sectionof the community. LSOAs are small in size, few in number, and can be targeted by regular,high visibility patrols. BCU-level data processing can calculate up-to-date analysis at theLSOA level to reveal their most recent, vulnerable to KE homicide locations.
Such patrols do currently take place but are often deployed across whole boroughsfor short, isolated periods. This research has clearly demonstrated that LSOA geocodescan be ascribed to a larger volume of knife-enabled, nonfatal assaults, providing policeleaders with more precise targeting data to assign hotspot patrols. This permanent,concentrated, LSOA-level analytic focus would yield its own invaluable local
Cambridge Journal of Evidence-Based Policing (2019) 3:1–20 17
intelligence, help identify emerging mobility patterns, and fuel the evidence-led ap-proach. Nor is it likely that targeting police actions so tightly would merely displace theoffenses elsewhere (Mazeika 2014; Weisburd et al 2006).
In more specific terms, this geographical understanding can inform a myriad ofdifferent preventative as well as enforcement initiatives. Isolating the most vulnerableareas allows more selective targeting, for example, of schools, with additional resourcessuch as physical safeguarding measures. These might include journey-to-school chap-erones; knife arches at school entries; closer monitoring of pupil exclusions, internalpeer-relationships, and gang affiliations; and greater local authority and police over-sight upon specific vulnerable youths. Thus, preventative targeting of LSOAs couldlead to community partnership measures as well as extra patrol activity.
Accordingly, a multi-agency board overseeing locally accountable multi-agencyteams, dedicated to designing and implementing preventative intervention programs,is well worth testing as evidence-based policing (Sherman 2013). By combiningexpertise with specific LSOA-level knowledge, a more preventative outlook can beattained. The achievability of such a proposal is underscored by the plethora of suchmulti-agency groups that already exist for retrospective homicide assessment. Byforecasting KE homicide risk, digital policing could encourage prospective multi-agency action in very local areas.
Provided further EBP principles of tracking and testing were employed, the successor failure of these actions could be readily captured for ongoing data analysis. Targetingis only the first step to better knowledge of what works to prevent murders. Testing andtracking alternative responses to digital policing forecasts is needed for the long run. Atthe same time, targeting itself can be improved by continuing to build more data into aforecasting model. This study is a first step towards making that investment. So far, theevidence suggests that investment could reap substantial dividends.
Acknowledgements We are grateful for the support of Metropolitan Police Service Commissioner CressidaDick in encouraging research of this kind. The first author also thanks Chris Sims for his support during theCambridge course of 2017–2018, and Roy Baker, Claire Durnell, Christine Leist, and Richard Moore; thelatter’s statistical contribution was invaluable.
Open Access This article is distributed under the terms of the Creative Commons Attribution 4.0 InternationalLicense (http://creativecommons.org/licenses/by/4.0/), which permits unrestricted use, distribution, and repro-duction in any medium, provided you give appropriate credit to the original author(s) and the source, provide alink to the Creative Commons license, and indicate if changes were made.
References
Bottoms, A. (2012). Developing socio-spatial criminology. In M. Maguire, R. Morgan, & R. Reiner (Eds.),The Oxford handbook of criminology (5th ed., pp. 450–488). Oxford: Oxford University Press.
Cohen, L. E., & Felson, M. (1979). Social change and crime rate trends: a routine activity approach. Am SociolRev, 44(4), 588–608.
Cohen, J., & Ludwig, J. (2003). Policing crime guns. In J. Ludwig & P. J. Cook (Eds.), Evaluating gun policy:Effects on crime and violence (pp. 217–239). Washington DC: Brookings Institution.
Dick, C. (2018). The future of policing in the digital age. Ditchley: Ditchley Foundation. https://www.ditchley.com/future-policing-digital-age.
18 Cambridge Journal of Evidence-Based Policing (2019) 3:1–20
Jackson, M. (2010). Homicide concentration and distribution patterns in London an exploratory analysis often years of data (Unpublished MSt thesis, Police Executive Programme, Institute of Criminology,University of Cambridge).
Koper, C. S., & Mayo-Wilson, E. (2006). Police crackdowns on illegal gun carrying: A systematic review oftheir impact on gun crime. Journal of experimental criminology, 2(2), 227–261.
Massey, J. (2018). Targeting the Geography and Demography of Recent Homicide Trends in London: AnExploratory Analysis. M.St. Thesis, Police Executive Programme, Institute of Criminology, University ofCambridge.
Mayhew, P., Clarke, R. V. G., Sturman, A., & Hough, J. M. (1976). Crime as Opportunity. Home OfficeResesarch Study No. 34. London: HMSO.
Mazeika, D. (2014). General and specific displacement effects of police crackdowns: criminal events and“local” criminals. PhD diss. Department of Criminology and Criminal Justice, University of Maryland.
McGarrell, E. F., Chermak, S., Weiss, A., & Wilson, J. (2001). Reducing firearms violence through directedpolice patrol. Criminology & Public Policy, 1(1), 119–148.
Mohler, G. (2014). Marked point process hotspot maps for homicide and gun crime prediction in Chicago. IntJ Forecast, 30(3), 491–497.
Moore, M. H. (1980). The police and weapons offenses. ANNALS AAPSS, 452(1), 22–32.Office for National Statistics (2011) Retrieved 20 April 2018, from ONS:https://www.ons.gov.
uk/methodology/geography/ukgeographies/censusgeography#super-output-area-soaOffice of National Statistics (2019) Retrieved 9th March 2019 from https://data.london.gov.uk/dataset/lsoa-
atlasRosenfeld, R., Deckard, M. J., & Blackburn, E. (2014). The effects of directed patrol and self-initiated
enforcement on firearm violence: A randomized controlled study of hot spot policing. Criminology, 52(3),428–449.
Sherman, L. W. (2013). ‘The rise of evidence based policing’: targeting, testing and tracking. In M. Tonry(Ed.), Crime and justice in America, 1975-2025, crime and justice: a review of research, vol. 42 (pp. 377–451). Chicago: University of Chicago Press.
Sherman, L. W., Gartin, P., & Buerger, M. (1989). Hot spots of predatory crime: routine activities and thecriminology of place. Criminology, 27(1), 27–55.
Sherman, L. W., Rogan, D. P., Shaw, J. W., & Rogan, D. P. (1995). The Kansas City Gun Experiment.Research in Brief. Washington, DC: U.S. National Institute of Justice.
Sutherland, J. & Muller-Johnson, K. (2019). Evidence vs. Professional Judgment in Ranking “Power Few”Crime Targets: A Comparative Analysis. Cambridge Journal of Evidence-Based Policing, 3.
Villaveces, A., Cummings, P., Espitia, V. E., Koepsell, T. D., McKnight, B., & Kellermann, A. L. (2000).Effect of a ban on carrying firearms on homicide rates in 2 Colombian cities. JAMA, 283(9), 1205–1209.
Weinborn, C., Ariel, B., Sherman, L. W., & O’Dwyer, E. (2017). Hotspots vs. harmspots: shifting the focusfrom counts to harm in the criminology of place. Appl Geogr, 86, 226–244.
Weisburd, D. (2015). The law of crime concentration and the criminology of place. Criminology, 53(2), 133–157.
Weisburd, D., Wyckoff, L. A., Ready, J., Eck, J. E., Hinkle, J. C., & Gajewski, F. (2006). Does crime justmove around the corner? A controlled study of spatial displacement and diffusion of crime controlbenefits. Criminology, 44(3), 549–592.
Wellford, C. F., Pepper, J., & Petrie, C. (2005). Firearms and violence: a critical review. Washington: NationalAcademies Press.
Wilson, J. Q. (1980). What can the police do about violence? ANNALS AAPSS, 452(1), 13–21.Yerushalmy, J. (1947). Statistical problems in assessing methods of medical diagnosis with special reference to
x-ray techniques. Public Health Rep, 62(2), 1432–1439.Zimring, F. E. (1968). Is gun control likely to reduce violent killings? University of Chicago Law Review, 35,
721–737.
Publisher’s Note Springer Nature remains neutral with regard to jurisdictional claims in published mapsand institutional affiliations.
Cambridge Journal of Evidence-Based Policing (2019) 3:1–20 19
John Massey, M.A. (Oxon), M.St. (Cantab) is a Detective Chief Inspector, Homicide and Major CrimeCommand, Metropolitan Police Service, London. The present article is based on data from his Cambridge MStThesis, which was supported by the Metropolitan Police Service.
Lawrence W. Sherman, M.A. (Cantab), Ph.D. is Professor and Chair of the Cambridge Police ExecutiveProgramme, Distinguished University Professor at the University of Maryland, and Editor-in-Chief of theCambridge Journal of Evidence-Based Policing.
Timothy Coupe, M.A. (Oxon), Ph.D. is a Lecturer in Criminal Justice in the Cambridge Police ExecutiveProgramme, Institute of Criminology, University of Cambridge.
Affiliations
John Massey1 & Lawrence W. Sherman2,3& Timothy Coupe2
* Lawrence W. [email protected]
1 Metropolitan Police Service, London, UK
2 Institute of Criminology, University of Cambridge, Cambridge, UK
3 University of Maryland, College Park, MD, USA
20 Cambridge Journal of Evidence-Based Policing (2019) 3:1–20