for vortex generators in subsonic internal flows - … · for vortex generators in subsonic...
TRANSCRIPT
NASA Technical Memorandum 87327 AIAA-86-1458 .
NP{3A-TH-812E21
NASA-TM-87327
: ICj?rf;{)611 D13 \
Application of a Computational Model for Vortex Generators in Subsonic Internal Flows
William G. Kunik Lewis Research Center Cleveland, Ohio
Prepared for the 22nd Joint Propulsion Conference cosponsored by the AIAA, ASME, SAE, and ASEE Huntsville, Alabama, June 16-18, 1986
. NI\S/\
: 111111111111111111111111111111111111111111111 . NF01526
'-
liBRARY COpy ~Ff 1 t 1~86
LANGLEY RESEARCH CENTER lIBAARV, NASA
tiA~.~PTCtlL VIRGINIA
https://ntrs.nasa.gov/search.jsp?R=19860017073 2018-08-29T16:10:47+00:00Z
. . AIAA-86-1458 Application of a Computational Model for Vortex Generators in Subsonic Internal Flows William G. Kunik, NASA Lewis Research Center, Cleveland, OH
AIAA/ASME/SAE/ASEE 22nd Joint Propulsion Conference
June 16-18, 1986/Huntsville, Alabama
For permission to copy or republish, contact the American Institute of Aeronautics and Astronautics 1633 Broadway, New York, NY 10019 N'f:Lo - C)~ ~:r+t-

APPLICAlION OF A COMPUTATIONAL MODEL FOR VORTEX GENERAlORS IN
SUBSONIC INlERNAL FLOWS
William G. Kunik National Aeronautics and Space Administration
Lewis Research Center Cleveland, Ohio 44135
SUMMARY
A model for the analysis of vortex generators in a fully viscous subsonic internal flow is evaluated. A vorticity source term is used in a modified form of the "Parabolized" Navier-Stokes equations to model the shed vortex. Computed results are compared with idealized flow vortex paths, and with experimental data for vortex generators embedded in a thick turbule~t boundary layer. The analysis is also compared with experimental data for a separated diffusing S-duct and for a diffusing S-duct with vortex generators. Quantitative comparisons are shown for the latter three cases. Emphasis is placed on verifying the ability of the model to predict global distortions in the flow field.
INTRODUCliON
Three-dimensional subsonic diffusers are very common in modern aircraft propulsion systems. Strong secondary flows are generated by the presence of offset bends and changes in cross-sectional shape of the duct. In addition to this phenomena, since the flow is diffusing, the boundary layers may grow to a thickness comparable to the duct radius. These effects weigh heavily on the overall performance of the diffuser.
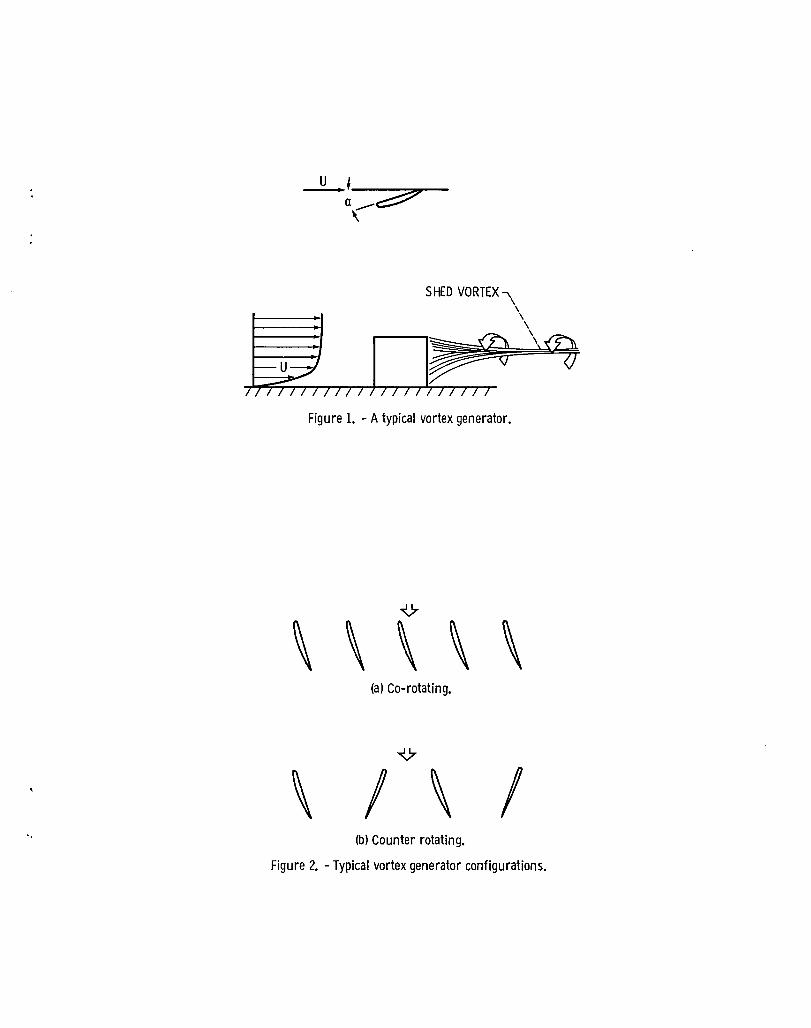
In efforts to save weight and thereby fuel, it is common to design these ducts to be as short as possible. In these cases the designer must be concerned with the flow separating due to a strong adverse pressure gradient. This separation may have devastating effects on engine performance, such as the engine unstarting. To alleviate this problem; vortex generators can be used as a flow control device. The vortex generator will cause a mixing of the hi~h momentum core flow with the low momentum flow in the boundary layer, resulting in a net increase of energy near the surface. This can delay or eliminate the separation depending on the flow conditions. There is a penalty that is paid for the use of the vortex generators and that is the drag of the generator. But, since the vortex generators tend to have small planform areas, this adverse effect is small. An excellent background on forced mixing can be obtained from references 1 to 3.
To solve for the flow fields in these ducts, a complete three-dimensional Navier-Stokes analysis could be used, but large amounts of computer time and storage are required for a detailed solution. However, by making certain approximations to the Navier-Stokes equations, such as neglecting streamwise diffusion, a set of equations can be obtained for fully viscous internal flow that can be solved by forward marching in space. A computer analysis, designated PEPSIG, has been developed using these equations to compute threedimensional subsonic viscous flow through curved ducts with superelliptic
".
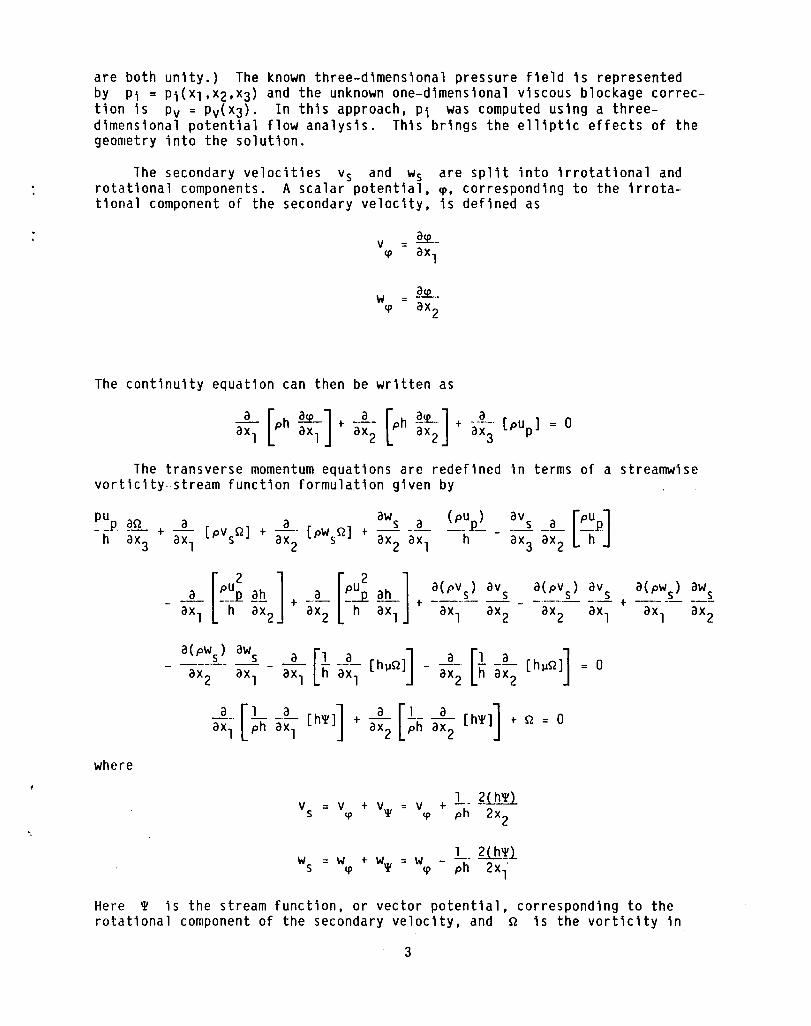
are both unity.) The known three-dimensional pressure field is represented by Pi = Pi(Xl.x2.x3) and the unknown one-dimensional viscous blockage correction is Pv = Pv(x3). In this approach. Pi was computed using a threedimensional potential flow analysis. This brings the elliptic effects of the geometry into the solution.
The secondary velocities Vs and Ws are split into irrotational and rotational components. A scalar potential. ~. corresponding to the irrotational component of the secondary velocity. is defined as
v ~
w ~
The continuity equation can then be written as
_a_ [Ph ~] t ~- [Ph ~!L] t a [pup] = 0 aX l aX l aX2 aX 2 aX3
The transverse momentum equations are redefined in terms of a streamwise vorticity-stream function formulation given by
- - -- [h'l'] t - -- -- [h'l'] a [1 a ] a [1 a ] aXl ph aXl aX2 ph aX2 t Q o
where
v = V t V'¥ V + :L fi!ltl s q> q> ph 2x
2
Ws w t w'l' = w~ - L . .?l.h'!'l ~ ph 2xl
Here 'l' is the stream function. or vector potential. corresponding to the rotational component of the secondary velocity. and Q is the vorticity in
3
'0
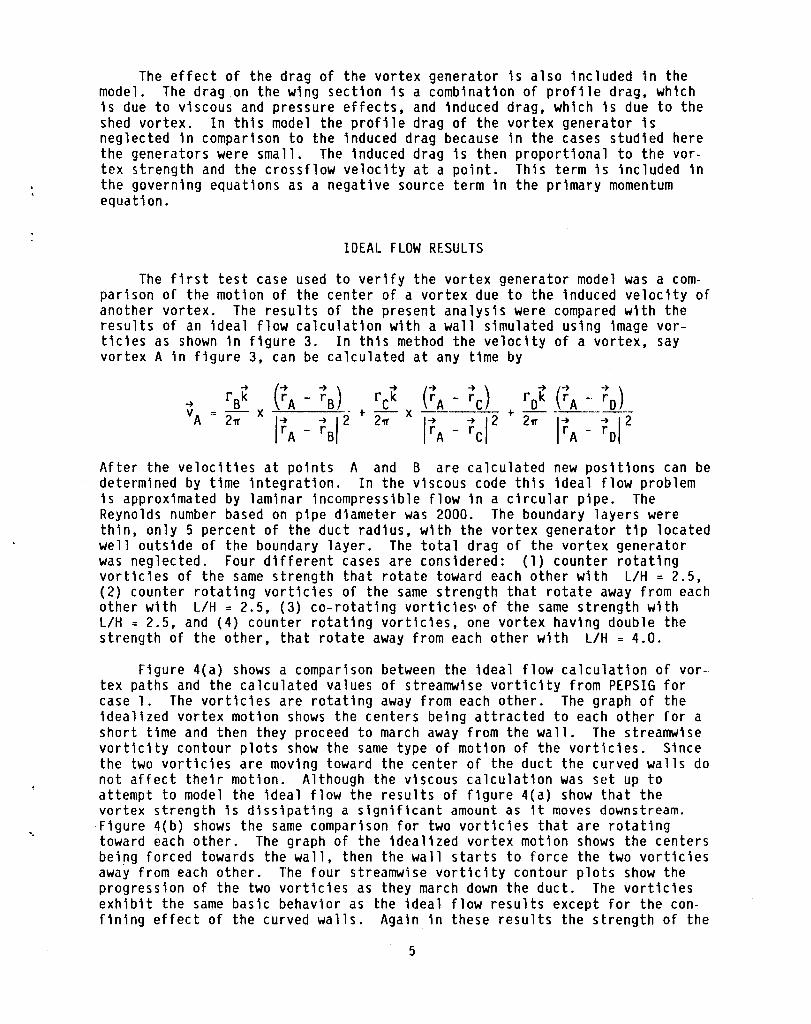
The effect of the drag of the vortex generator is also included in the model. The drag .on the wing section is a combination of profile drag, wh1ch is due to viscous and pressure effects, and induced drag, which is due to the shed vortex. In this model the profile drag of the vortex generator is neglected in comparison to the induced drag because in the cases studied here the generators were small. The induced drag is then proportional to the vortex strength and the crossflow velocity at a point. This term is included in the governing equations as a negative source term in the primary momentum equation.
IDEAL FLOW RESULTS
The first test case used to verify the vortex generator model was a comparison of the motion of the center of a vortex due to the induced velocity of another vortex. The results of the present analysis were compared with the results of an ideal flow calculation with a wall simulated using image vorticies as shown in figure 3. In th1s method the velocity of a vortex, say vortex A in figure 3, can be calculated at any time by
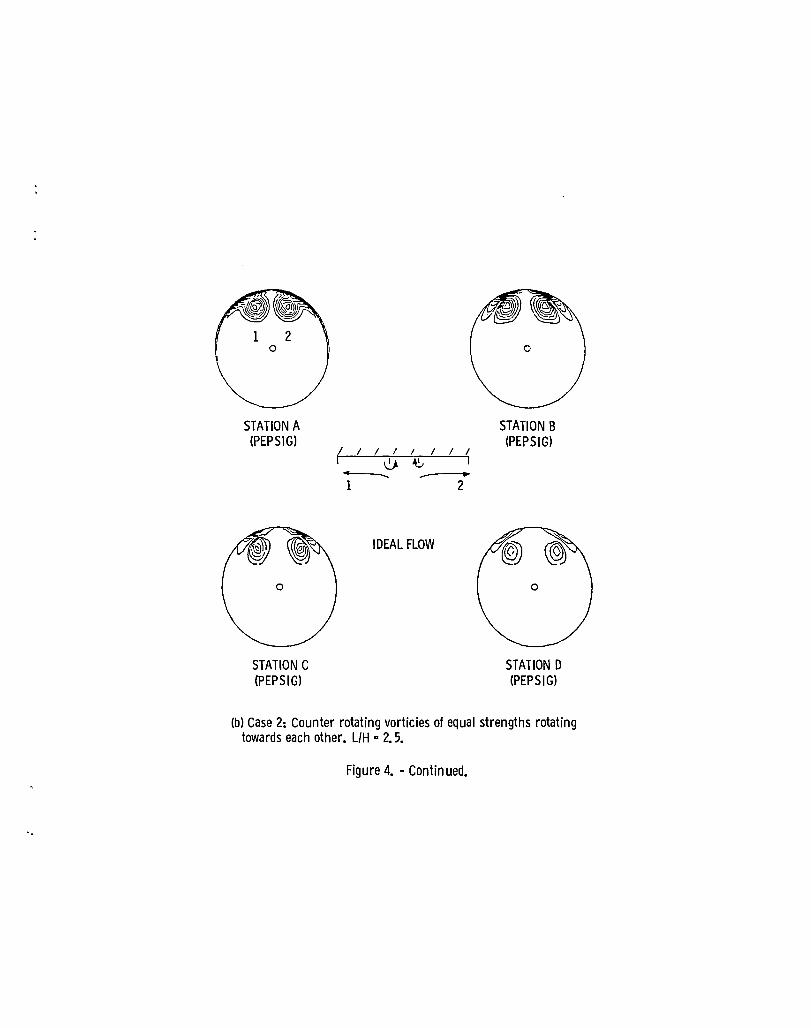
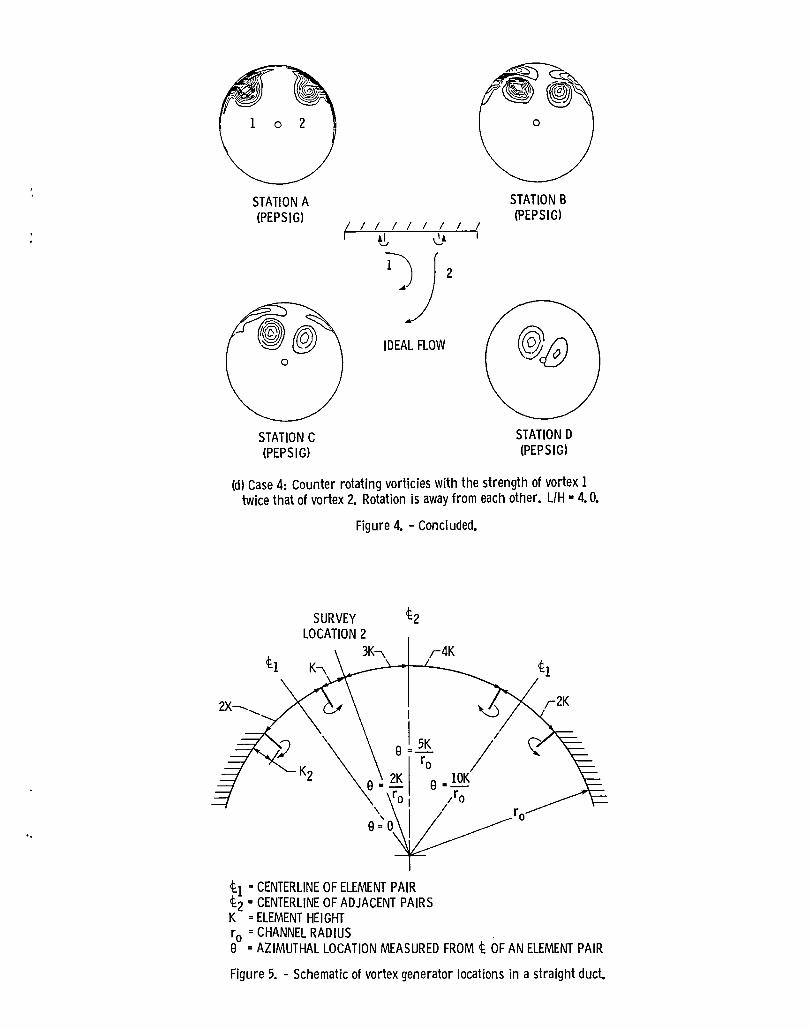
After the veloc1ties at p01nts A and B are calculated new pos1t10ns can be determined by time integration. In the viscous code this ideal flow problem is approximated by lam1nar incompress1ble flow in a circular pipe. The Reynolds number based on pipe diameter was 2000. The boundary layers were thin, only 5 percent of the duct radius, with the vortex generator tip located well outside of the boundary layer. The total drag of the vortex generator was neglected. Four different cases are considered: (1) counter rotating vorticies of the same strength that rotate toward each other with L/H = 2.5, (2) counter rotating vorticies of the same strength that rotate away from each other with L/H = 2.5, (3) co-rotating vorticie~ of the same strength with L/H = 2.5, and (4) counter rotating vorticies, one vortex having double the strength of the other, that rotate away from each other with L/H = 4.0.
Figure 4(a) shows a comparison between the ideal flow calculation of vortex paths and the calculated values of streamwise vorticity from PEPSIG for case 1. The vorticies are rotating away from each other. The graph of the idealized vortex motion shows the centers being attracted to each other for a short time and then they proceed to march away from the wall. The streamwise vorticity contour plots show the same type of motion of the vorticies. Since the two vorticies are mov1ng toward the center of the duct the curved walls do not affect their mot1on. Although the viscous calculation was set up to attempt to model the 1deal flow the results of figure 4(a) show that the vortex strength is dissipating a significant amount as it moves downstream. Figure 4(b) shows the same compar1son for two vorticies that are rotating toward each other. The graph of the idealized vortex motion shows the centers being forced towards the wall, then the wall starts to force the two vortic1es away from each other. The four streamwise vorticity contour plots show the progression of the two vorticies as they march down the duct. The vorticies exhibit the same basic behavior as the ideal flow results except for the confining effect of the curved walls. Again in these results the strength of the
5
"
agree well with the experiment. From this comparison it is evident that the overall effects of the vortex are predicted but if detailed information about skin friction and heat transfer are needed the effect of the wall on the vortex must be better modeled.
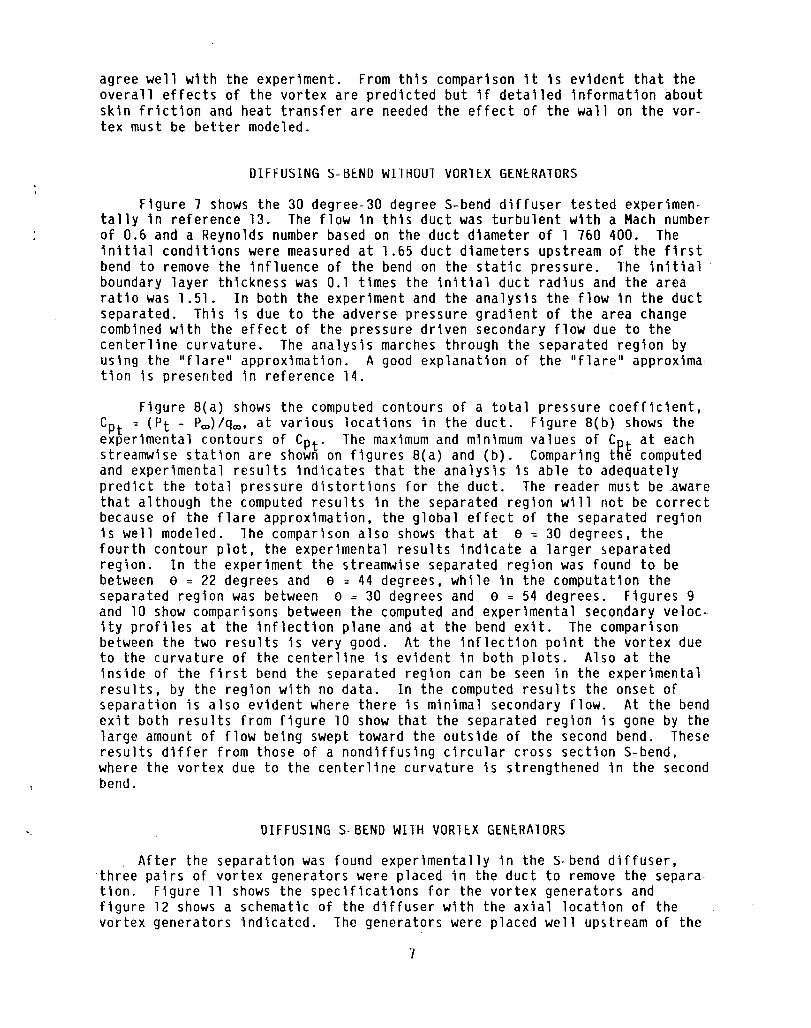
DIFFUSING S-6END WITHOUT VOR1EX GENERATORS
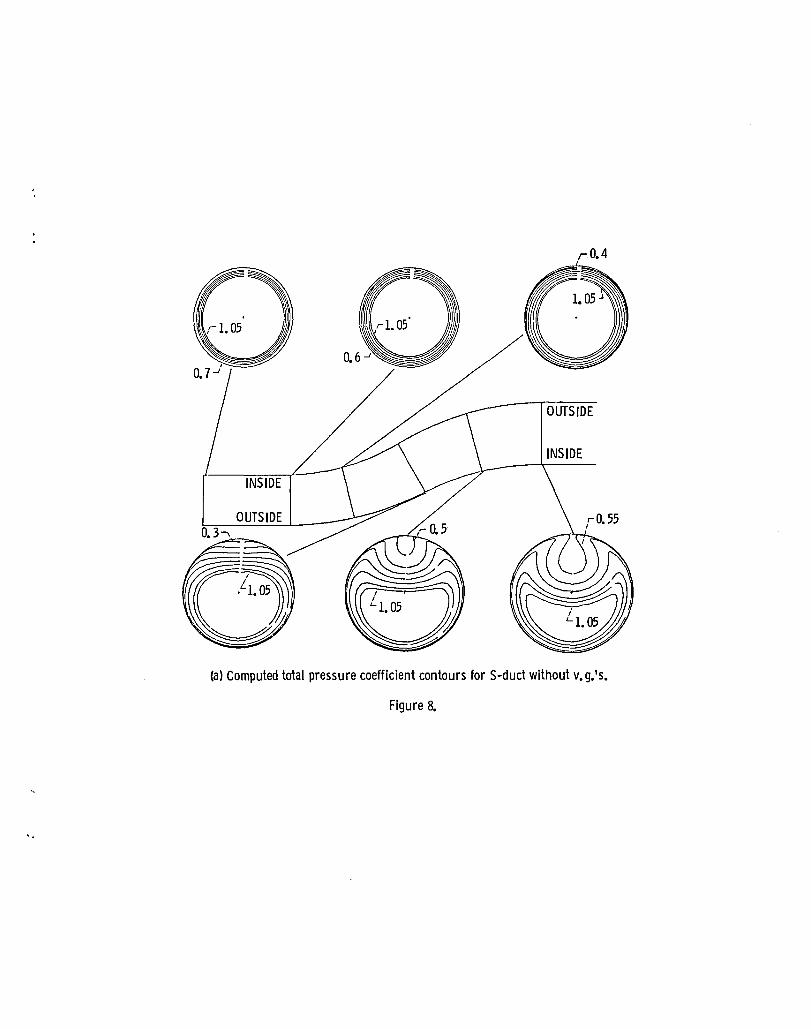
Figure 7 shows the 30 degree-30 degree S-bend diffuser tested experimentally in reference 13. The flow in this duct was turbulent with a Mach number of 0.6 and a Reynolds number based on the duct diameter of 1 760 400. The initial conditions were measured at 1.65 duct diameters upstream of the first bend to remove the influence of the bend on the static pressure. The initial boundary layer thickness was 0.1 times the initial duct radius and the area ratio was 1.51. In both the experiment and the analysis the flow in the duct separated. This is due to the adverse pressure gradient of the area change combined with the effect of the pressure driven secondary flow due to the centerline curvature. The analysis marches through the separated region by using the "flare" approximation. A good explanation of the "flare" approxima tion is presented in reference 14.
Figure 8(a) shows the computed contours of a total pressure coefficient, CPt = (Pt - Pro)/qro, at various locations in the duct. Figure 8(b) shows the experimental contours of CPt. The maximum and minimum values of CPt at each streamwise station are shown on figures 8(a) and (b). Comparing the computed and experimental results indicates that the analYSis is able to adequately predict the total pressure distortions for the duct. The reader must be ,aware that although the computed results in the separated region will not be correct because of the flare approximation, the global effect of the separated region is well modeled. The comparison also shows that at e = 30 degrees, the fourth contour plot, the experimental results indicate a larger separated region. In the experiment the streamwise separated region was found to be between e = 22 degrees and e = 44 degrees, while in the computation the separated region was between e = 30 degrees and e = 54 degrees. Figures 9 and 10 show comparisons between the computed and experimental secondary velocity profiles at the inflection plane and at the bend exit. The comparison between the two results is very good. At the inflection point the vortex due to the curvature of the centerline is evident in both plots. Also at the inside of the first bend the separated region can be seen in the experimental results, by the region with no data. In the computed results the onset of separation is also evident where there is minimal secondary flow. At the bend exit both results from figure 10 show that the separated region is gone by the large amount of flow being swept toward the outside of the second bend. These results differ from those of a nondiffusing circular cross section S-bend, where the vortex due to the centerline curvature is strengthened in the second bend.
DIFFUSING S-BEND WITH VOR1EX GENERAl DRS
After the separation was found experimentally in the S-bend diffuser, three pairs of vortex generators were placed in the duct to remove the separa· tion. Figure 11 shows the specifications for the vortex generators and figure 12 shows a schematic of the diffuser with the axial location of the vortex generators indicated. The generators were placed well upstream of the
7
600 to 700 gr1d po1nts per second. Th1s 1s approx1mately 150 to 200 times faster than a full Navier-Stokes analys1s for comparable accuracy.
REFERENCES
1. Taylor, H.D., "Des1gn Criteria for and Applications of the Vortex Generator Mixing Principle," United Aircraft Corp., East Hartford, CT, Report M-15038-1, Feb. 1948.
2. Schubauer, G.B., and Spangenberg, W.G., "Forced Mixing in Boundary Layers," ~ournal of Fluid Mechanics, Vol. 8, Pt. 1, May 1960, pp. 10-23.
3. Shaw, R.J., "An Experimental Investigation of Forced Mixing of a Turbulent Boundary Layer in an Annular Diffuser," Ph.D. Thes1s, Ohio State University, June 1979.
4. Briley, W.R., and McDonald, H., "Analysis and Computation of Viscous Subsonic Primary and Secondary Flows," AIAA Paper 79-1453, July 1979.
5. Levy, R., McDonald, H., Briley, W.R., and Kreskovsky, J.P., "A ThreeDimensional Turbulent Compressible Subsonic Duct Flow Analysis for Use with Constructed Coordinate Systems," AIAA Paper 80-1398, July 1980.
6. Levy, R., Briley, W.R., and McDonald, H., "Viscous Primary/Secondary Flow Analysis for Use with Nonorthogonal Coordinate Systems," AIAA Paper 83-0556, Jan. 1983.
7. Towne, C.E., and Anderson, B.H., "Numerical Simulation of Flows in Curved Diffusers with Cross-Sectional Transitioning Using a Three-Dimensional Viscous Analysis," AIAA Paper 81-0003, Jan. 1981.
8. Towne, C.E., "Computation of Viscous Flow in Curved Ducts and Comparison with Experimental Data," AIAA Paper 84-0531, Jan. 1984.
9. Vakili, A., Wu, J. M., Hingst, W.R., and Towne, C.E., "Comparison of Experimental and Computational Compressible Flow in an S-Duct," AIAA Paper 84-0033, Jan. 1984.
10. Levy, R., "Vortex Generator Modeling," Report in Preparation, 1986. (Scientific Research Associates, Glastonbury, C1.)
11. Squire, H.B., "Growth of a Vortex in Turbulent Flow," The Aeronautical QuarterlY, Vol. 16, Pt. 3, August 1965, pp. 302-306.
12. Spangler, J.G., and Wells, C.S. Jr., "Effects of Spiral Longitudinal Vorticies on Turbulent Boundary Layer Skin Friction," NASA CR-145, 1964.
", 13. Vakil1, A.D., Wu, J.M., L1ver, P., and Bhat, M.K., "Experimental Investi-gation of Secondary Flow in a Diffusing S-Duct," (Warren Hingst, Project
. Manager, NASA Lewis Research Center, to be published), 1986.
14. Anderson, D.A., Tannehill, J.C., and Pletcher, R.H., Computat~~nat~id Mechanics and Heat Transfer, 1st Edition, Hemisphere, Washington, D.C., 1984.
9
U I l a ___ ~ ,
SHED VORTEX"'"\ , , ,
Figure 1. - A typical vortex generator.
~
\ \ \ \ \ (a) Co-rotating.
~
I \ I (b) Counter rotating.
\
\~
Figure 2. - Typical vortex generator configurations.
STATION A (PEPSIGl
STATION C (PEPSIGl
( I I I I I
-IDEAL FLOW
I I I ..
2
STATION B (PEPSIGl
STATION D (PEPSIGl
(bl Case 2: Counter rotating vorticies of equal strengths rotating towards each other. LlH • 2.5.
Figure 4. - Cantin ued.
STATION A (PEPSIGl
STATION C (PEPSIGl
!.. I I
IIIIII
~ ~,
~2 IDEAL FLOW
I I
STATION B (PEPSIGl
@8
STATION D (PEPSIGl
(dl Case 4: Counter rotating vorticies with the strength of vortex 1 twice that of vortex 2. Rotation is away from each other. LlH· 4. O.
Figure 4. - Concluded.
SURVEY 4:2 LOCATION 2
4:1 = CENTERLINE OF ELEMENT PAIR 4:2 = CENTERLINE OF ADJACENT PAIRS K = ELEMENT HEIGHT r 0 = CHANNEL RADIUS 9 = AZIMUTHAL LOCATION MEASURED FROM 4: OF AN ELEMENT PAIR
Figure 5. - Schematic of vortex generator locations in a straight duct.
OUTSIDE
(a) Computed total pressure coefficient contours for S-duct without v.g.'s.
Figure 8.

EXPERIMENTAL RESULT
OUTSIDE OF SECOND BEND
INSIDE
COMPUTED RESULT
. . ~
Figure 10. - Comparison of secondary flow at the exit plane for S-duct without v. g.'s.
1. 778
\ 0.16
u i r R = 7.0
• b'"
(a) DimenSions of vortex generator.
(b) Dimensions of v. g. configuration. All dimensions in cm.
Figure 11. - Vortex generator configuration for S-duct diffuser.
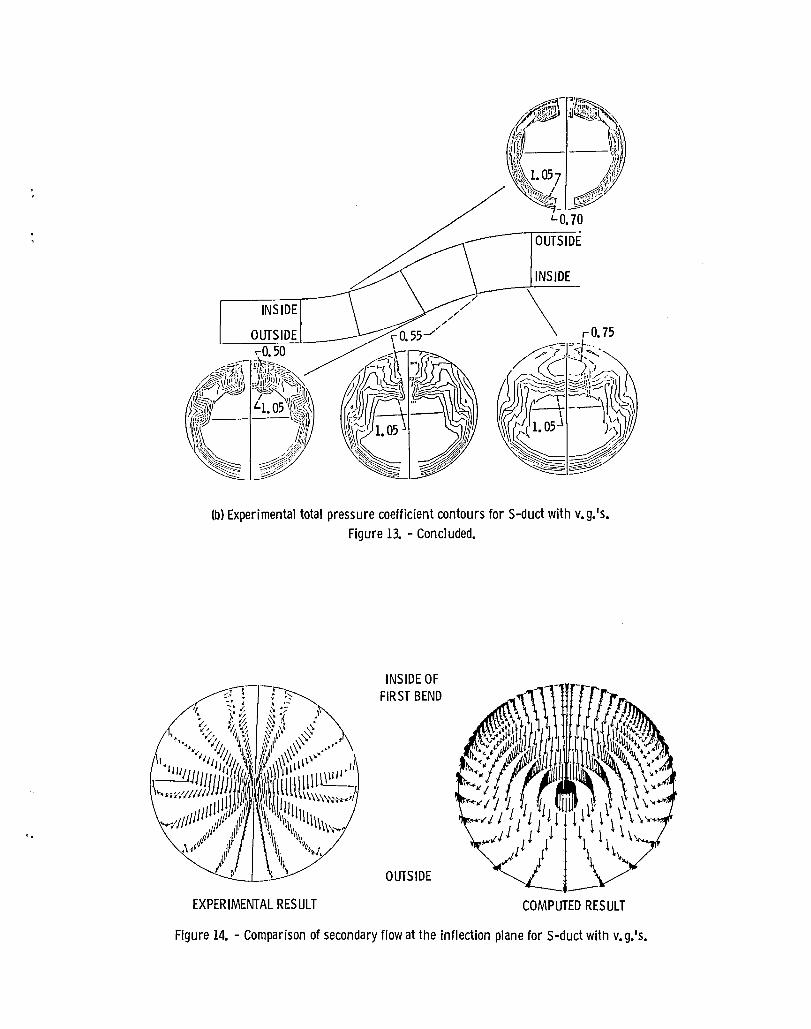
INSIDE
\
(b) Experimental total pressure coefficient contours for S-duct with v. g. 'so Figure 13. - Concluded.
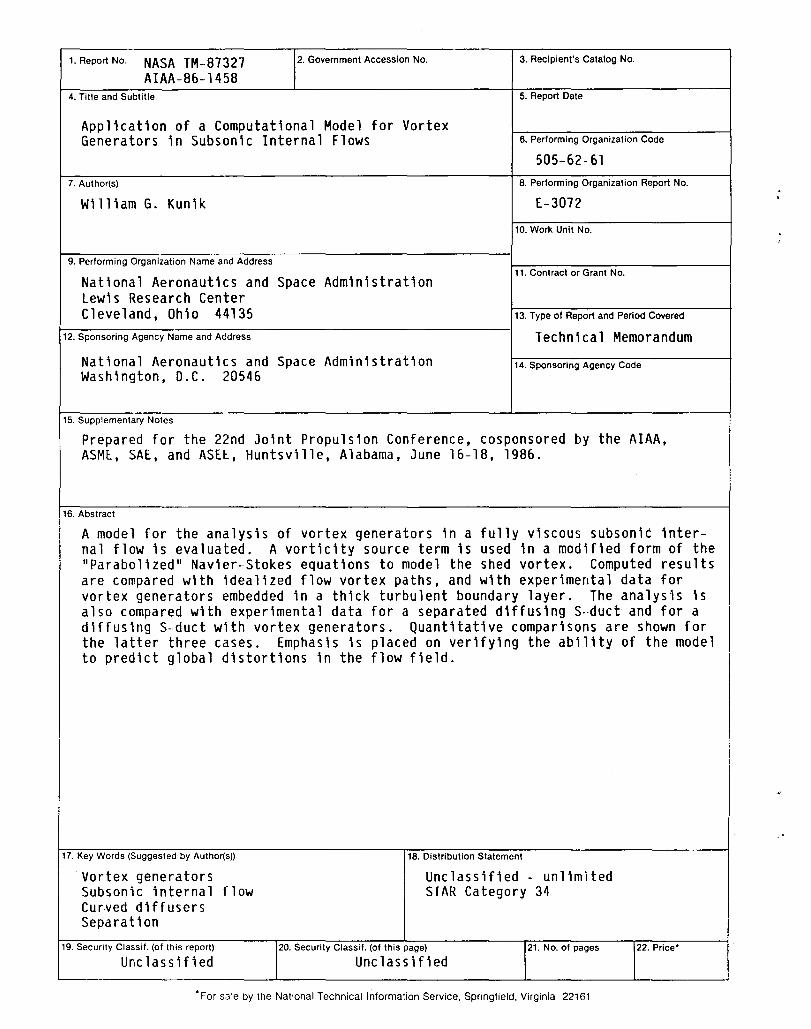
EXPERIMENTAL RESULT
INSIDE OF FIRST BEND
OUTSIDE
COMPUTED RESULT
Figure 14. - Comparison of secondary flow at the inflection plane for S-duct with v. g.'s.
1. Report No. NASA TM-87327 AIAA-86-1458
4. Title and Subtitle
2. Government Accession No.
Application of a Computational Model for Vortex Generators in Subsonic Internal Flows
7. Author(s)
William G. Kunik
9. Performing Organization Name and Address
National Aeronautics and Space Administration lewis Research Center Cleveland, Ohio 44135
12. Sponsoring Agency Name and Address
National Aeronautics and Space Administration Washington, D.C. 20546
15. Supplementary Notes
3. Recipient's Catalog No.
5. Report Date
6. Performing Organization Code
505-62-61 8. Performing Organization Report No.
E-3072
10. Work Unit No.
11. Contract or Grant No.
13. Type of Report and Period Covered
Technical Memorandum
14. Sponsoring Agency Code
Prepared for the 22nd Joint Propulsion Conference, cosponsored by the AIAA, ASME, SAE, and ASEE, Huntsville, Alabama, June 16-18, 1986.
16. Abstract
A model for the analysis of vortex generators in a fully viscous subsoniC internal flow is evaluated. A vorticity source term is used in a modified form of the "Parabolized" Navier-Stokes equations to model the shed vortex. Computed results are compared with idealized flow vortex paths, and with experimental data for vortex generators embedded in a thick turbulent boundary layer. The analysis is also compared with experimental data for a separated diffusing S··duct and for a diffusing S-duct with vortex generators. Quantitative comparisons are shown for the latter three cases. Emphasis is placed on verifying the ability of the model to predict global distortions in the flow field.
17. Key Words (Suggested by Author(s))
Vortex generators Subsonic internal flow Curved diffusers Separation
19. Security Classi!. (of this report)
Unclassified
18. Distribution Statement
Unclassified - unlimited STAR Category 34
20. Security Classif. (of this page)
Unclassified 21. No. of pages
• For sale by the National Technical Information Service. Springfield. Virginia 22161
22. Price'

End of Document