for lease 12th avenue retail shop space - costar...
TRANSCRIPT
Cushman & Wakefield Copyright 2015. No warranty or representation, express or implied, is made to the accuracy or completeness of the information contained herein, and same is submitted subject to errors, omissions, change of price, rental or other conditions, withdrawal without notice, and to any special listing conditions imposed by the property owner(s). As applicable, we make no representation as to the condition of the property (or properties) in question.
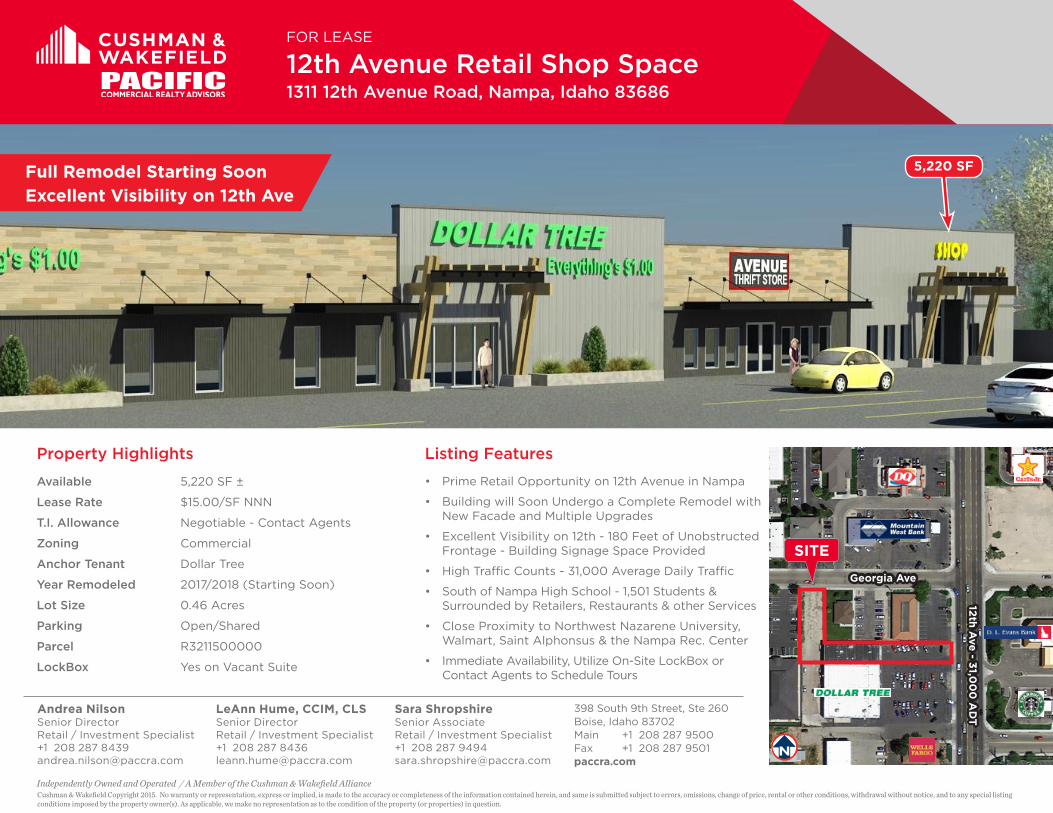
Full Remodel Starting SoonExcellent Visibility on 12th Ave
Independently Owned and Operated / A Member of the Cushman & Wakefield Alliance
Andrea NilsonSenior Director Retail / Investment Specialist +1 208 287 8439 [email protected]
398 South 9th Street, Ste 260 Boise, Idaho 83702Main +1 208 287 9500 Fax +1 208 287 9501paccra.com
LeAnn Hume, CCIM, CLSSenior DirectorRetail / Investment Specialist +1 208 287 8436 [email protected]
Sara ShropshireSenior AssociateRetail / Investment Specialist +1 208 287 9494 [email protected]
12th Avenue Retail Shop Space 1311 12th Avenue Road, Nampa, Idaho 83686
FOR LEASE
Listing Features
• Prime Retail Opportunity on 12th Avenue in Nampa
• Building will Soon Undergo a Complete Remodel with New Facade and Multiple Upgrades
• Excellent Visibility on 12th - 180 Feet of Unobstructed Frontage - Building Signage Space Provided
• High Traffic Counts - 31,000 Average Daily Traffic
• South of Nampa High School - 1,501 Students & Surrounded by Retailers, Restaurants & other Services
• Close Proximity to Northwest Nazarene University, Walmart, Saint Alphonsus & the Nampa Rec. Center
• Immediate Availability, Utilize On-Site LockBox or Contact Agents to Schedule Tours
Property Highlights
Available 5,220 SF ±
Lease Rate $15.00/SF NNN
T.I. Allowance Negotiable - Contact Agents
Zoning Commercial
Anchor Tenant Dollar Tree
Year Remodeled 2017/2018 (Starting Soon)
Lot Size 0.46 Acres
Parking Open/Shared
Parcel R3211500000
LockBox Yes on Vacant Suite
5,220 SF
12th Ave - 31,0
00
AD
T
Georgia Ave
SITE
Cushman & Wakefield Copyright 2015. No warranty or representation, express or implied, is made to the accuracy or completeness of the information contained herein, and same is submitted subject to errors, omissions, change of price, rental or other conditions, withdrawal without notice, and to any special listing conditions imposed by the property owner(s). As applicable, we make no representation as to the condition of the property (or properties) in question.
Independently Owned and Operated / A Member of the Cushman & Wakefield Alliance
12th Avenue Retail Shop Space 1311 12th Avenue Road, Nampa, Idaho 83686
FOR LEASE
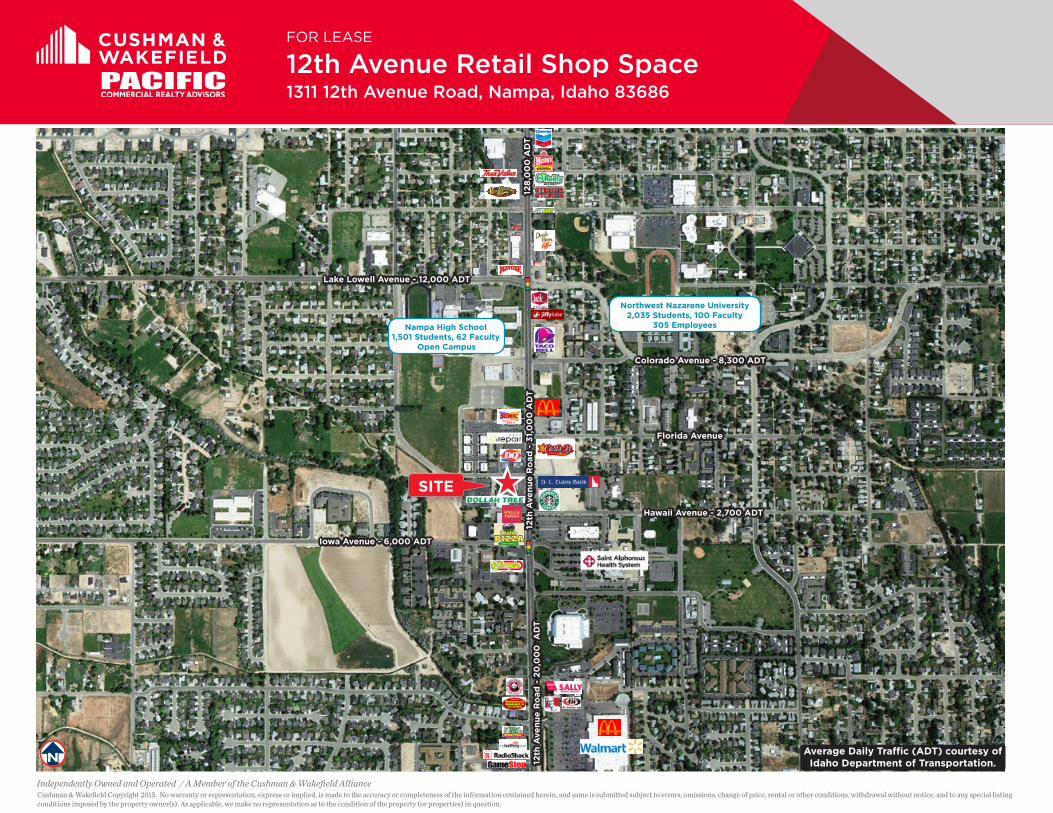
Iowa Avenue - 6,000 ADT12
th A
venu
e R
oad
- 3
1,0
00
AD
T
Northwest Nazarene University2,035 Students, 100 Faculty
305 Employees
Hawaii Avenue - 2,700 ADT
Florida Avenue
Lake Lowell Avenue - 12,000 ADT
Colorado Avenue - 8,300 ADT
128,
00
0 A
DT
12th
Ave
nue
Ro
ad -
20
,00
0 A
DT
Nampa High School1,501 Students, 62 Faculty
Open Campus
SITE
Average Daily Traffic (ADT) courtesy of Idaho Department of Transportation.
84
84 84
EXIT44
EXIT35
EXIT44
EXIT36
EXIT44
EXIT38
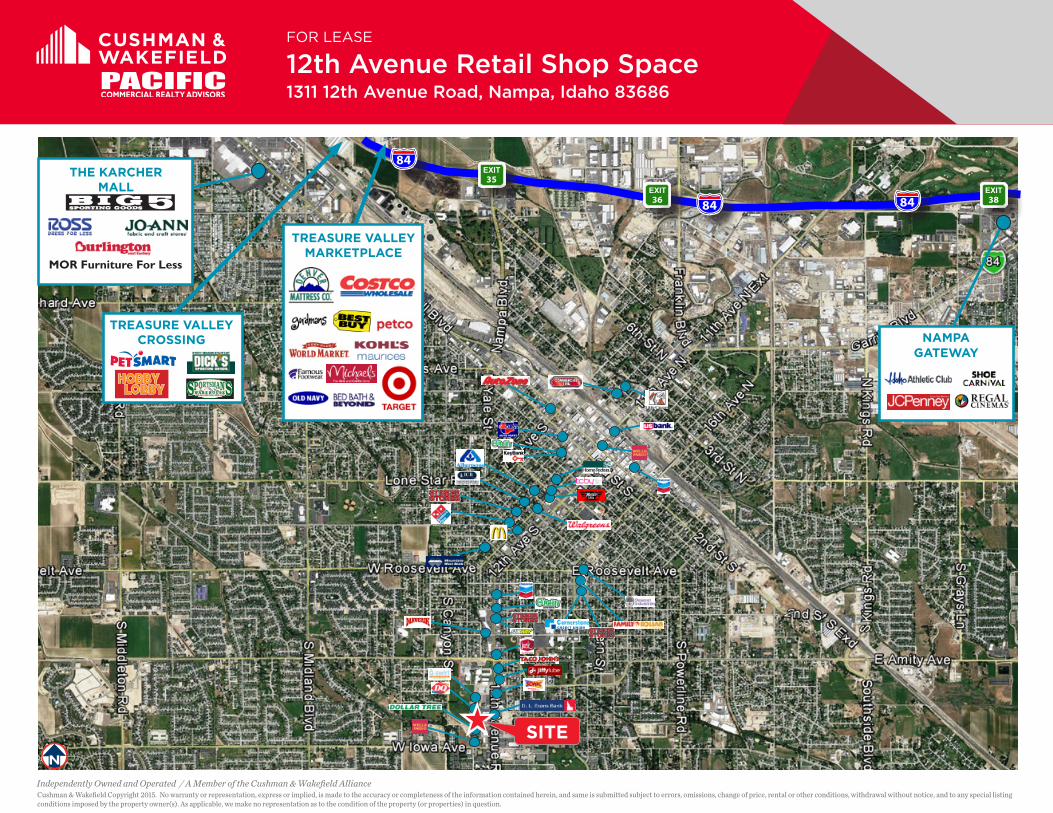
NAMPA GATEWAY
THE KARCHERMALL
MOR Furniture For Less
TREASURE VALLEY MARKETPLACE
TREASURE VALLEY CROSSING
Cushman & Wakefield Copyright 2015. No warranty or representation, express or implied, is made to the accuracy or completeness of the information contained herein, and same is submitted subject to errors, omissions, change of price, rental or other conditions, withdrawal without notice, and to any special listing conditions imposed by the property owner(s). As applicable, we make no representation as to the condition of the property (or properties) in question.
Independently Owned and Operated / A Member of the Cushman & Wakefield Alliance
12th Avenue Retail Shop Space 1311 12th Avenue Road, Nampa, Idaho 83686
FOR LEASE
SITE
Executive Summary1311 12th Avenue Rd, Nampa, Idaho, 83686 Prepared by EsriRings: 1, 2, 3 mile radii Latitude: 43.55593
Longitude: -116.57293
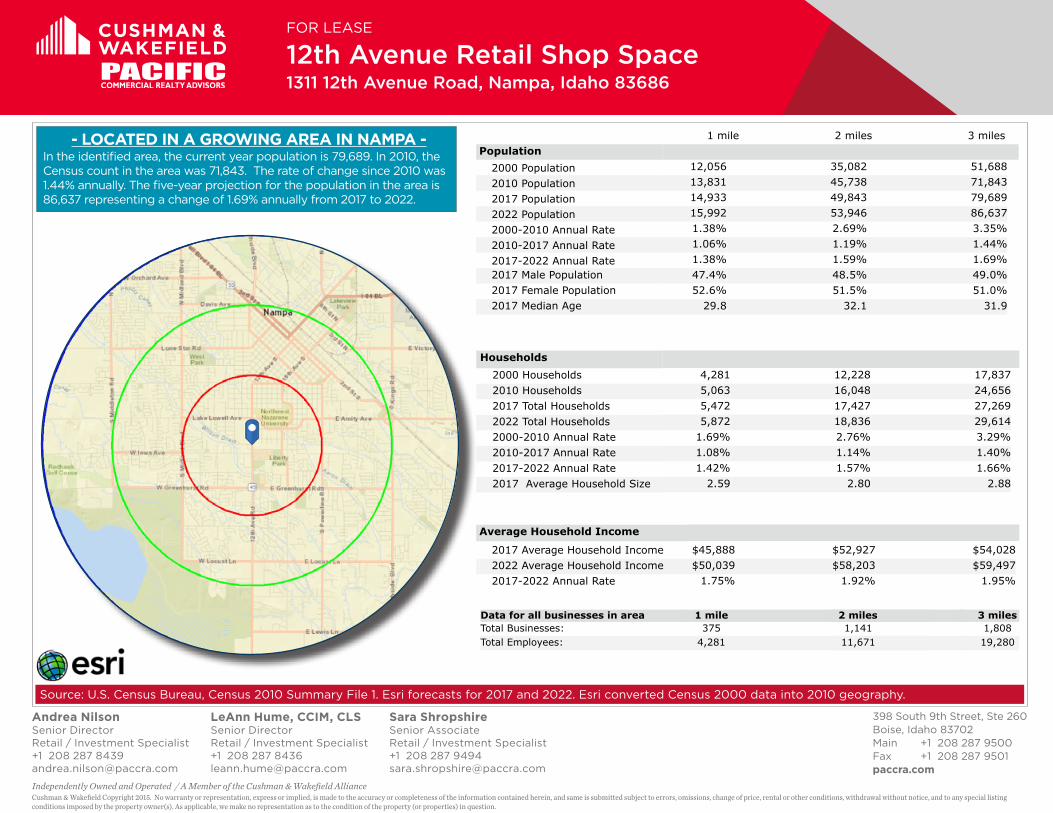
1 mile 2 miles 3 milesPopulation
2000 Population 12,056 35,082 51,6882010 Population 13,831 45,738 71,8432017 Population 14,933 49,843 79,6892022 Population 15,992 53,946 86,6372000-2010 Annual Rate 1.38% 2.69% 3.35%2010-2017 Annual Rate 1.06% 1.19% 1.44%2017-2022 Annual Rate 1.38% 1.59% 1.69%2017 Male Population 47.4% 48.5% 49.0%2017 Female Population 52.6% 51.5% 51.0%2017 Median Age 29.8 32.1 31.9
In the identified area, the current year population is 79,689. In 2010, the Census count in the area was 71,843. The rate of change since 2010 was 1.44% annually. The five-year projection for the population in the area is 86,637 representing a change of 1.69% annually from 2017 to 2022. Currently, the population is 49.0% male and 51.0% female.
Median Age
The median age in this area is 29.8, compared to U.S. median age of 38.2.Race and Ethnicity
2017 White Alone 80.3% 82.2% 81.6%2017 Black Alone 1.0% 0.9% 0.9%2017 American Indian/Alaska Native Alone 1.4% 1.3% 1.3%2017 Asian Alone 1.2% 1.1% 1.0%2017 Pacific Islander Alone 0.4% 0.4% 0.4%2017 Other Race 11.9% 10.4% 11.2%2017 Two or More Races 3.7% 3.7% 3.7%2017 Hispanic Origin (Any Race) 23.7% 22.2% 23.6%
Persons of Hispanic origin represent 23.6% of the population in the identified area compared to 18.1% of the U.S. population. Persons of Hispanic Origin may be of any race. The Diversity Index, which measures the probability that two people from the same area will be from different race/ethnic groups, is 57.4 in the identified area, compared to 64.0 for the U.S. as a whole.
Households2000 Households 4,281 12,228 17,8372010 Households 5,063 16,048 24,6562017 Total Households 5,472 17,427 27,2692022 Total Households 5,872 18,836 29,6142000-2010 Annual Rate 1.69% 2.76% 3.29%2010-2017 Annual Rate 1.08% 1.14% 1.40%2017-2022 Annual Rate 1.42% 1.57% 1.66%2017 Average Household Size 2.59 2.80 2.88
The household count in this area has changed from 24,656 in 2010 to 27,269 in the current year, a change of 1.40% annually. The five-year projection of households is 29,614, a change of 1.66% annually from the current year total. Average household size is currently 2.88, compared to 2.87 in the year 2010. The number of families in the current year is 19,674 in the specified area.
Data Note: Income is expressed in current dollarsSource: U.S. Census Bureau, Census 2010 Summary File 1. Esri forecasts for 2017 and 2022. Esri converted Census 2000 data into 2010 geography.
October 04, 2017
©2017 Esri Page 1 of 2
Executive Summary1311 12th Avenue Rd, Nampa, Idaho, 83686 Prepared by EsriRings: 1, 2, 3 mile radii Latitude: 43.55593
Longitude: -116.57293
1 mile 2 miles 3 milesMedian Household Income
2017 Median Household Income $33,723 $40,183 $41,2372022 Median Household Income $33,791 $40,959 $42,1342017-2022 Annual Rate 0.04% 0.38% 0.43%
Average Household Income
2017 Average Household Income $45,888 $52,927 $54,0282022 Average Household Income $50,039 $58,203 $59,4972017-2022 Annual Rate 1.75% 1.92% 1.95%
Per Capita Income2017 Per Capita Income $17,593 $19,079 $18,8652022 Per Capita Income $18,997 $20,868 $20,6782017-2022 Annual Rate 1.55% 1.81% 1.85%
Households by IncomeCurrent median household income is $41,237 in the area, compared to $56,124 for all U.S. households. Median household income is projected to be $42,134 in five years, compared to $62,316 for all U.S. households
Current average household income is $54,028 in this area, compared to $80,675 for all U.S. households. Average household income is projected to be $59,497 in five years, compared to $91,585 for all U.S. households
Current per capita income is $18,865 in the area, compared to the U.S. per capita income of $30,820. The per capita income is projected to be $20,678 in five years, compared to $34,828 for all U.S. households Housing
2000 Total Housing Units 4,547 12,982 18,9912000 Owner Occupied Housing Units 2,615 8,318 12,4202000 Renter Occupied Housing Units 1,666 3,909 5,4172000 Vacant Housing Units 266 755 1,154
2010 Total Housing Units 5,613 17,648 27,0562010 Owner Occupied Housing Units 2,714 10,422 16,4352010 Renter Occupied Housing Units 2,349 5,626 8,2212010 Vacant Housing Units 550 1,600 2,400
2017 Total Housing Units 6,015 19,008 29,6422017 Owner Occupied Housing Units 2,811 10,916 17,5742017 Renter Occupied Housing Units 2,661 6,511 9,6952017 Vacant Housing Units 543 1,581 2,373
2022 Total Housing Units 6,445 20,511 32,1382022 Owner Occupied Housing Units 3,031 11,810 19,1102022 Renter Occupied Housing Units 2,841 7,027 10,5032022 Vacant Housing Units 573 1,675 2,524
Currently, 59.3% of the 29,642 housing units in the area are owner occupied; 32.7%, renter occupied; and 8.0% are vacant. Currently, in the U.S., 55.6% of the housing units in the area are owner occupied; 33.1% are renter occupied; and 11.3% are vacant. In 2010, there were 27,056 housing units in the area - 60.7% owner occupied, 30.4% renter occupied, and 8.9% vacant. The annual rate of change in housing units since 2010 is 4.14%. Median home value in the area is $152,430, compared to a median home value of $207,344 for the U.S. In five years, median value is projected to change by 3.28% annually to $179,139.
Data Note: Income is expressed in current dollarsSource: U.S. Census Bureau, Census 2010 Summary File 1. Esri forecasts for 2017 and 2022. Esri converted Census 2000 data into 2010 geography.
October 04, 2017
©2017 Esri Page 2 of 2
Business Summary1311 12th Avenue Rd, Nampa, Idaho, 83686 Prepared by EsriRings: 1, 2, 3 mile radii Latitude: 43.55593
Longitude: -116.57293Data for all businesses in area 1 mile 2 miles 3 milesTotal Businesses: 375 1,141 1,808Total Employees: 4,281 11,671 19,280Total Residential Population: 14,933 49,843 79,689Employee/Residential Population Ratio (per 100 Residents) 29 23 24
Businesses Employees Businesses Employees Businesses Employeesby SIC Codes Number Percent Number Percent Number Percent Number Percent Number Percent Number PercentAgriculture & Mining 6 1.6% 44 1.0% 25 2.2% 177 1.5% 49 2.7% 284 1.5%Construction 27 7.2% 94 2.2% 81 7.1% 331 2.8% 139 7.7% 858 4.5%Manufacturing 3 0.8% 37 0.9% 18 1.6% 185 1.6% 55 3.0% 1,131 5.9%Transportation 4 1.1% 10 0.2% 23 2.0% 368 3.2% 45 2.5% 501 2.6%Communication 4 1.1% 27 0.6% 9 0.8% 74 0.6% 15 0.8% 123 0.6%Utility 0 0.0% 2 0.0% 3 0.3% 77 0.7% 4 0.2% 100 0.5%Wholesale Trade 3 0.8% 22 0.5% 27 2.4% 325 2.8% 68 3.8% 1,349 7.0%
Retail Trade Summary 78 20.8% 849 19.8% 242 21.2% 2,189 18.8% 385 21.3% 4,009 20.8%Home Improvement 3 0.8% 20 0.5% 17 1.5% 103 0.9% 37 2.0% 448 2.3%General Merchandise Stores 3 0.8% 78 1.8% 4 0.4% 90 0.8% 9 0.5% 280 1.5%Food Stores 4 1.1% 72 1.7% 20 1.8% 286 2.5% 33 1.8% 420 2.2%Auto Dealers, Gas Stations, Auto Aftermarket 7 1.9% 57 1.3% 30 2.6% 289 2.5% 57 3.2% 715 3.7%Apparel & Accessory Stores 1 0.3% 1 0.0% 13 1.1% 28 0.2% 16 0.9% 37 0.2%Furniture & Home Furnishings 6 1.6% 14 0.3% 15 1.3% 41 0.4% 30 1.7% 105 0.5%Eating & Drinking Places 29 7.7% 457 10.7% 68 6.0% 929 8.0% 96 5.3% 1,379 7.2%Miscellaneous Retail 25 6.7% 149 3.5% 75 6.6% 422 3.6% 106 5.9% 626 3.2%
Finance, Insurance, Real Estate Summary 39 10.4% 198 4.6% 111 9.7% 579 5.0% 179 9.9% 940 4.9%Banks, Savings & Lending Institutions 13 3.5% 98 2.3% 29 2.5% 238 2.0% 51 2.8% 358 1.9%Securities Brokers 4 1.1% 12 0.3% 12 1.1% 28 0.2% 18 1.0% 42 0.2%Insurance Carriers & Agents 8 2.1% 29 0.7% 28 2.5% 96 0.8% 45 2.5% 155 0.8%Real Estate, Holding, Other Investment Offices 14 3.7% 59 1.4% 43 3.8% 218 1.9% 66 3.7% 385 2.0%
Services Summary 201 53.6% 2,959 69.1% 521 45.7% 5,756 49.3% 751 41.5% 8,029 41.6%Hotels & Lodging 0 0.0% 0 0.0% 1 0.1% 4 0.0% 4 0.2% 57 0.3%Automotive Services 10 2.7% 30 0.7% 34 3.0% 129 1.1% 56 3.1% 214 1.1%Motion Pictures & Amusements 10 2.7% 131 3.1% 29 2.5% 252 2.2% 44 2.4% 328 1.7%Health Services 71 18.9% 1,529 35.7% 122 10.7% 2,341 20.1% 152 8.4% 2,851 14.8%Legal Services 6 1.6% 34 0.8% 22 1.9% 97 0.8% 26 1.4% 117 0.6%Education Institutions & Libraries 13 3.5% 705 16.5% 32 2.8% 1,395 12.0% 45 2.5% 1,884 9.8%Other Services 90 24.0% 531 12.4% 283 24.8% 1,539 13.2% 423 23.4% 2,578 13.4%
Government 2 0.5% 38 0.9% 44 3.9% 1,607 13.8% 58 3.2% 1,941 10.1%
Unclassified Establishments 7 1.9% 0 0.0% 36 3.2% 2 0.0% 60 3.3% 15 0.1%
Totals 375 100.0% 4,281 100.0% 1,141 100.0% 11,671 100.0% 1,808 100.0% 19,280 100.0%
Source: Copyright 2017 Infogroup, Inc. All rights reserved. Esri Total Residential Population forecasts for 2017.Date Note: Data on the Business Summary report is calculated using Esri’s Data allocation method which uses census block groups to allocate business summary data to custom areas.
October 04, 2017
©2017 Esri Page 1 of 2
- LOCATED IN A GROWING AREA IN NAMPA -In the identified area, the current year population is 79,689. In 2010, the Census count in the area was 71,843. The rate of change since 2010 was 1.44% annually. The five-year projection for the population in the area is 86,637 representing a change of 1.69% annually from 2017 to 2022.
Source: U.S. Census Bureau, Census 2010 Summary File 1. Esri forecasts for 2017 and 2022. Esri converted Census 2000 data into 2010 geography.
Site Map1311 12th Avenue Rd, Nampa, Idaho, 83686 Prepared by EsriRings: 1, 2, 3 mile radii Latitude: 43.55593
Longitude: -116.57293
October 04, 2017
©2017 Esri Page 1 of 1
Cushman & Wakefield Copyright 2015. No warranty or representation, express or implied, is made to the accuracy or completeness of the information contained herein, and same is submitted subject to errors, omissions, change of price, rental or other conditions, withdrawal without notice, and to any special listing conditions imposed by the property owner(s). As applicable, we make no representation as to the condition of the property (or properties) in question.
Independently Owned and Operated / A Member of the Cushman & Wakefield Alliance
398 South 9th Street, Ste 260 Boise, Idaho 83702Main +1 208 287 9500 Fax +1 208 287 9501paccra.com
Andrea NilsonSenior Director Retail / Investment Specialist +1 208 287 8439 [email protected]
LeAnn Hume, CCIM, CLSSenior DirectorRetail / Investment Specialist +1 208 287 8436 [email protected]
Sara ShropshireSenior AssociateRetail / Investment Specialist +1 208 287 9494 [email protected]
12th Avenue Retail Shop Space 1311 12th Avenue Road, Nampa, Idaho 83686
FOR LEASE