foot locker, inc. · pdf filepage 1 foot locker, inc. introduction the one-year return for the...
TRANSCRIPT
Page 1
Foot Locker, Inc. Introduction The one-year return for the S&P500 is 10.55%; its price hit an all-time high this summer. Meanwhile, the SPDR
S&P Retail ETF (NYSEARCA: XRT) returned an annual figure of -4.75%, and Foot Locker (NYSE: FL) -9.60%. At first
glance, it appears as if the market as a whole is blazing but left behind Foot Locker (amongst other companies).
But this didn’t make much sense to me. The S&P500 aggregate EPS fell from $23.22 per share to $21.72 per share
in the last year. At the same time, Foot Locker grew its revenue by 3.6%, grew its adjusted net income by 24%1,
and increased annual dividends to $1.10 per share. In midst of one of the longest bull markets in history, I wanted
to investigate Foot Locker further and determine why, despite improvement in several metrics, it’s down when
the market is up.
Foot Locker is an American specialty athletic retailer that primarily sells premium athletic footwear, including
brands such as Nike, Adidas, Under Armor, Puma, and Converse. It has more than 3,000 stores in 23 countries in
North America, EMEA, and Asia. The company has two primary business segments: athletic stores (brick-and-
mortar) and direct-to-customer (online). Its online segment notably has a 5-year CAGR of 15%.
It is a stable and growing FCF-generating business. This is a retailer with an adjusted unlevered free cash flow
margin of 10%, that generates 18% return on assets, and a history of growing dividends and share buyback
programs2.
Industry Trends and Strategic Positioning Traditional retailers are facing a rather tough environment, to put it mildly. Heavy pricing competition, seemingly
permanent markdowns and discounts, high cost pressures from rising wages in manufacturing countries, and
lower barriers of entry due to the presence of online retailers all create an intensely competitive environment.
The ephemeral fads and fashion trends require that businesses stay agile and flexible or risk being left in the dust.
It’s no wonder investors are so eager to ditch their retail stocks and chase the exciting FANG3 stocks.
But some segments in the industry fared better than others. I believe one such segment is one in which Foot
Locker operates: premium athletic footwear. The footwear segment grown faster than the growth of the apparel;
its success has been driven primarily by athletic wear and accessories4. Consumers are likely to replace footwear
more often and typically stay loyal to their brands. There are several substitutes for athletic footwear, but you
likely won’t be playing tennis in boots or sandals.
Moreover, premium sneakers have a cultural and fashion aspect that supports its perceived value. Some sneakers
are designed for the purpose of athletic performance, others…well, “let's face it, the majority of [these] shoes are
not used for performance” (Ken Hicks, Q4 2013 earnings call). I believe this is an important factor that should go
into evaluating companies in the industry, but may either be misunderstood by some investors, or branded as a
factor that’s too flimsy to go into valuation.
1 Excluded the effect of a one-off litigation charge. Net income grew by 4% without adjustment. 2 All figures are reported after adjusting for operating leases as capital leases. 3 Facebook, Amazon, Netflix, Google 4 MarketLine Research in US Footwear, May 2015
Page 2
The products Foot Locker sells not only have high perceived values, but stable ones as well. Even during the 2007-
2009 financial crisis, a period of low consumer spending and confidence, Foot Locker continued to keep ASPs
strong and growing (due to limited resources, I relied on earnings conference calls to determine ASP trends). Some
examples:
“Our average footwear selling prices in the U.S. increased mid-single digits, enhanced by a lower markdown rate and mix
shift toward selling a greater percentage of high-priced footwear.” – Matt Serra, Q1 2008 earnings call
“On average selling prices, they increased mid-single digits in both footwear and apparel during the third quarter.” – Matt
Serra, Q3 2008 earnings call
“Our average footwear selling prices in the US increased double digits versus last year.” – Matt Serra, Q4 2008 earnings
call
“Our average unit prices are up low- to mid- single digits by division.” – Matt Serra, Q2 2009 earnings call
“[On higher ASPs] it's a combination of less markdowns and selling more premium shoes and some higher prices on some
shoes.” – Ken Hicks, Q2 2011 earnings call
“ASPs continued strong, as they have been all year.” – Lauren Peters, Q4 2014 earnings call
Despite selling primarily luxurious products, the company maintained a 4-5% EBITDA margin and positive cash
flows (both free cash flows and cash flows from operations) throughout the crisis. As for most sellers of premium
products, however, Foot Locker performs best during periods of economic booms.
Competitors The following companies are the most direct competitors to Foot Locker:
Dick’s Sporting Goods, Inc. (NYSE: DKS)
Sports Authority (recently bankrupted private company, absorbed by Dick’s Sporting Goods)
Sport Chek (private company)
DSW Inc. (NYSE: DSW)
Deckers Outdoor Corp (NYSE: DECK)
Caleres (NYSE: CAL)
Genesco Inc. (NYSE: GCO)
For the purpose of having a comprehensive list of comparables, these companies are also deemed having similar
business structures and dynamics.
The Gap, Inc. (NYSE:GPS)
Ross Stores, Inc. (NASDAQ:ROST)
American Eagle Outfitters (NYSE:AEO)
Abercrombie & Fitch Co. (NYSE:ANF)
Crocs, Inc. (NASDAQ:CROX)
Deckers Outdoor Corp. (NYSE: DECK)
There are also “competitors” that Foot Locker directly cooperates – its suppliers. I opted to exclude these
companies from my multiples analysis. These include companies such as:
Nike Inc. (NYSE: NKE)
adidas AG (ETR: ADS)
Timberlands, Vans (NYSE: VFC)
Under Armour Inc. (NYSE: UA)
Page 3
Valuation Foot Locker has three key drivers in its valuation:
Margins. The footwear industry is projected to see only low-single digit growth rates, so valuation primarily
hinges on how effectively Foot Locker manages its cost. Sensitivities in Appendix I demonstrate that a modest
2.50% increase in my cost of sales and SG&A estimates each year reduces Foot Locker’s value by
approximately 25%.
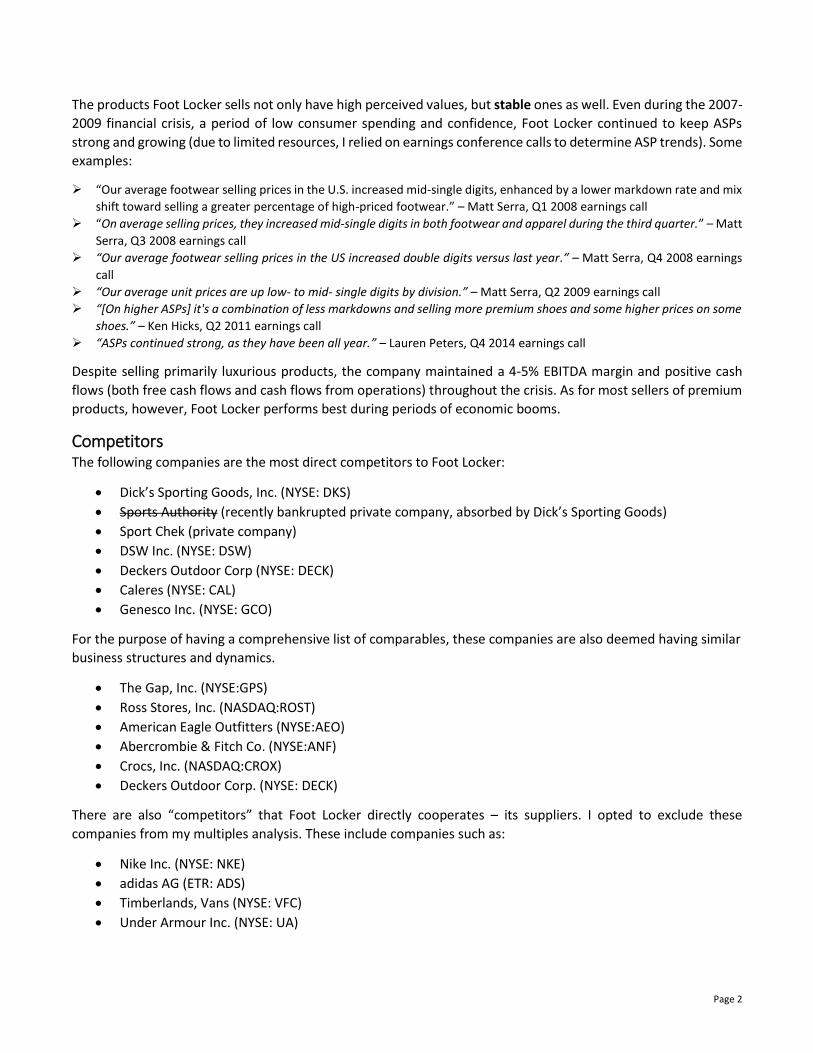
Foot Locker’s margins have drastically improved over the past decade(s).
Figure 1. Gross, EBIT, Net and FCF Margins
Margins FY 2005 FY 2010 FY 2011 FY 2012 FY 2013 FY 2014 FY 2015
Gross margin: 30.5% 30.0% 31.9% 32.9% 32.8% 33.2% 33.8%
EBIT margin: 7.3% 5.2% 7.8% 9.9% 10.2% 11.3% 12.6%
Net margin: 4.8% 3.3% 4.9% 6.4% 6.6% 7.3% 8.6%
FCF margin: 2.2% 4.5% 6.1% 4.1% 5.0% 7.3% 8.3%* *Excluded effect of a one-off litigation charge. Net margin is 7.3% otherwise.
These margin improvements were accompanied by an average revenue growth of 8%; I believe this
demonstrates management’s ability to cut costs and focus on efficiency. I project that margins will continue
to improve, supported by continued investment in improving turnover and reducing markdowns, strong and
stable ASPs, and management’s ability to tighten slack in its operations.
Revenue growth. As long as Foot Locker maintains or expands its market share in the footwear industry, it
can essentially “piggy-back” off the natural growth of the industry. The industry grew a 5-year CAGR of 3.2%.
During the same period, Foot Locker grew a CAGR of 8.0%. Third-party industry reports predict that the
industry will grow at an average annual rate of 4% the next five years5, and some argue that the athletic
footwear segment is primed to grow faster.
Foot Locker have a few key drivers for revenue growth:
1. Continued growth in its online retail, which has shown a 5-year CAGR of 15.1%. In FY2015, online sales
were 12.7% of total sales. Not only can online retail provide convenience to existing loyal customers,
but it can also reach new customers who don’t live near a Foot Locker. Although online retail is
extremely competitive – it only takes a click away to jump to competitors – I believe Foot Locker
delivers a quality value proposition in offering an attractive and wholesome selection of products.
2. Capture additional sales through cross-selling opportunities. Performance in apparel sales have been
disappointing as the company transitions from selling cheap and generic apparel to apparel with a
premium bent, creating a consistent message for the brand. The management plans for penetration
and profitability in premium apparel.
3. Capturing market share in other segments. Foot Locker highlights these segments as its priority for
future growth: expanding leading position in kids’ segment, continued growth in its European
operations, and delivering growth in women’s segment.
5 Plunkett Analytics, 2015.
Page 4
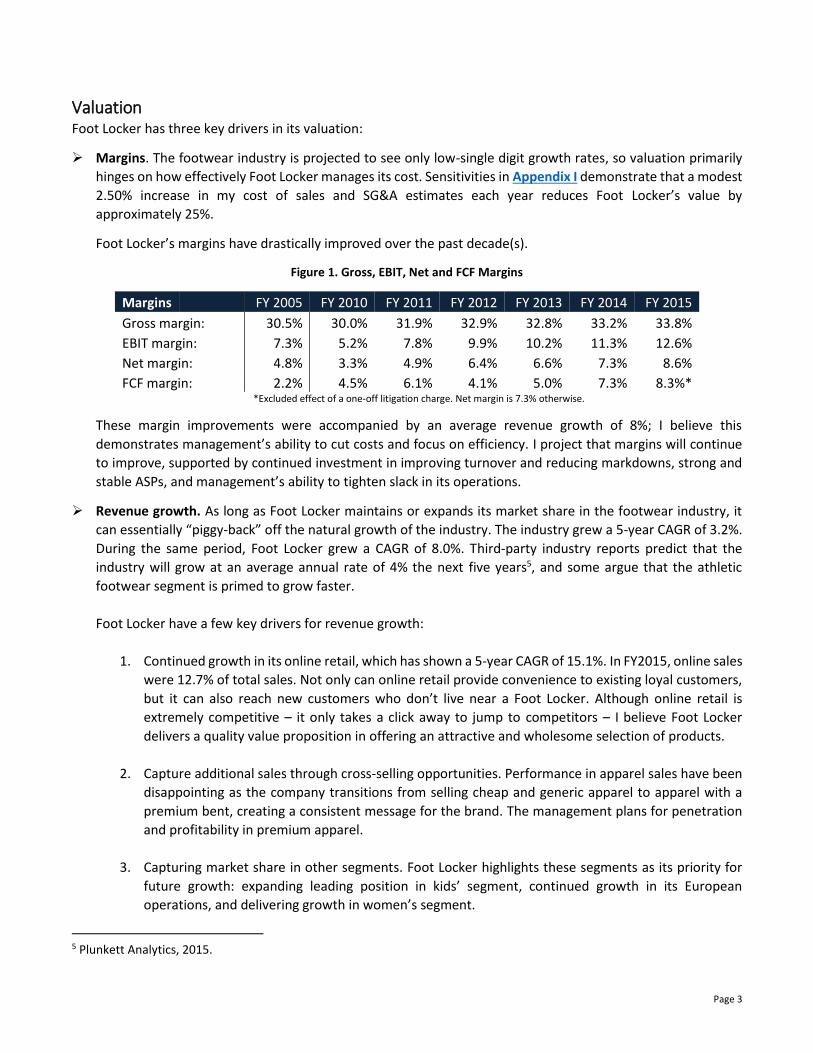
Returning Value to Shareholders. Along with a history of increasing dividend payments, Foot Locker has
consistently approved share repurchase programs that support the stock’s price level.
Figure 2. Foot Locker’s History of Returning Cash to Shareholders
Returning Cash via FY 2010 FY 2011 FY 2012 FY 2013 FY 2014 FY 2015
Dividend payments: $ 93 $ 101 $ 109 $ 118 $ 127 $ 139
Dividend / share: 0.60 0.66 0.72 0.80 0.88 1.00
Share repurchase program*: 83 133 200 200 333 333 *Assuming straight-line purchases (e.g. a 3-year $1Bn share repurchase program was approved during FY2014) $ in millions except per share data
Baseline Assumptions Sales growth CAGR from FY2016 to FY2023: 4.1%
Sales in FY2020: $9.2Bn (vs. management’s guidance of $10Bn)
U.S. sales per gross square footage in FY2020: $652M / sq. ft. (vs. management’s guidance of $600M / sq. ft.)
EBIT margin in FY2020: 14.3% (vs. management’s guidance of 12.5%)
Net margin in FY2020: 9.2% (vs. management’s guidance of 8.5%)
Recorded an additional one-year litigation charge of $120 in FY2016
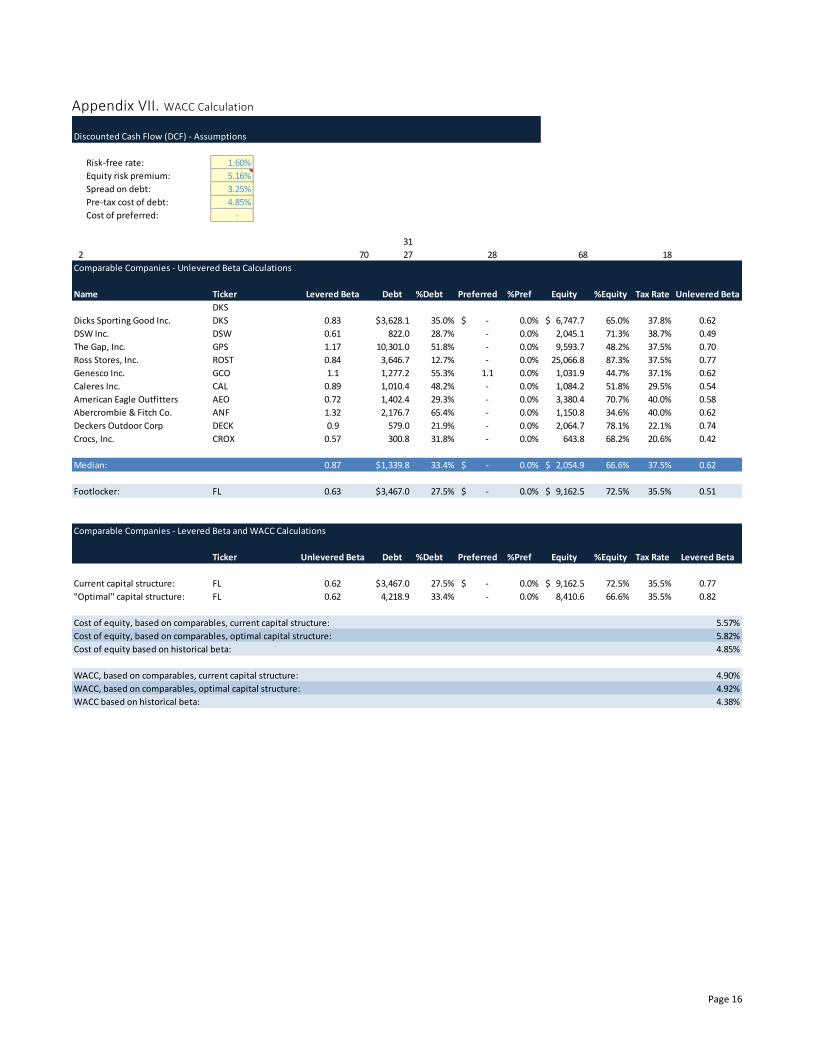
Adjusted for operating leases to capital leases, for all companies
Equity risk premium of 5.16%, sourced from Damodaran’s database
Levered beta of 0.82; unlevered beta of 0.62 – calculated from industry averages
WACC of 4.92% based on Foot Locker’s targeted capital structure
Terminal growth rate of 0%
Effective tax rate of 35.47% (in line with historical tax rates)
While the margins I assume seem optimistic compared to management’s guidance, it is somewhat balanced out
by my more pessimistic view on the sales growth Foot Locker is able to achieve. Management’s net margin of 8.5%
on $10Bn sales gives a net income of $850M; my numbers give $852M. Rather than changing around my initial
assumptions (I found management’s guidance after forecasting their statements), I estimated the value of the
company using management’s guidance in a later section.
To summarize my baseline assumption, I believe Foot Locker will continue doing what it’s been doing for the past
decade – growing revenues, expanding margins, creating value – but at a slower pace. Figure 3 highlights some of
the key projections for the explicit forecast period. FYI: a fiscal year ends on the last Saturday of the January of
the next calendar year (e.g. FY2015 ends January 30, 2016).
I estimate Foot Locker’s current value given this scenario at $108 (+63% upside), with a range of $87 to $134. This
range is calculated by varying the discount rate and terminal growth rate – two factors I find the most uncertain
in my projections. The large range of estimates come from the terminal value contributing to a significant portion
of the valuation.
Page 5
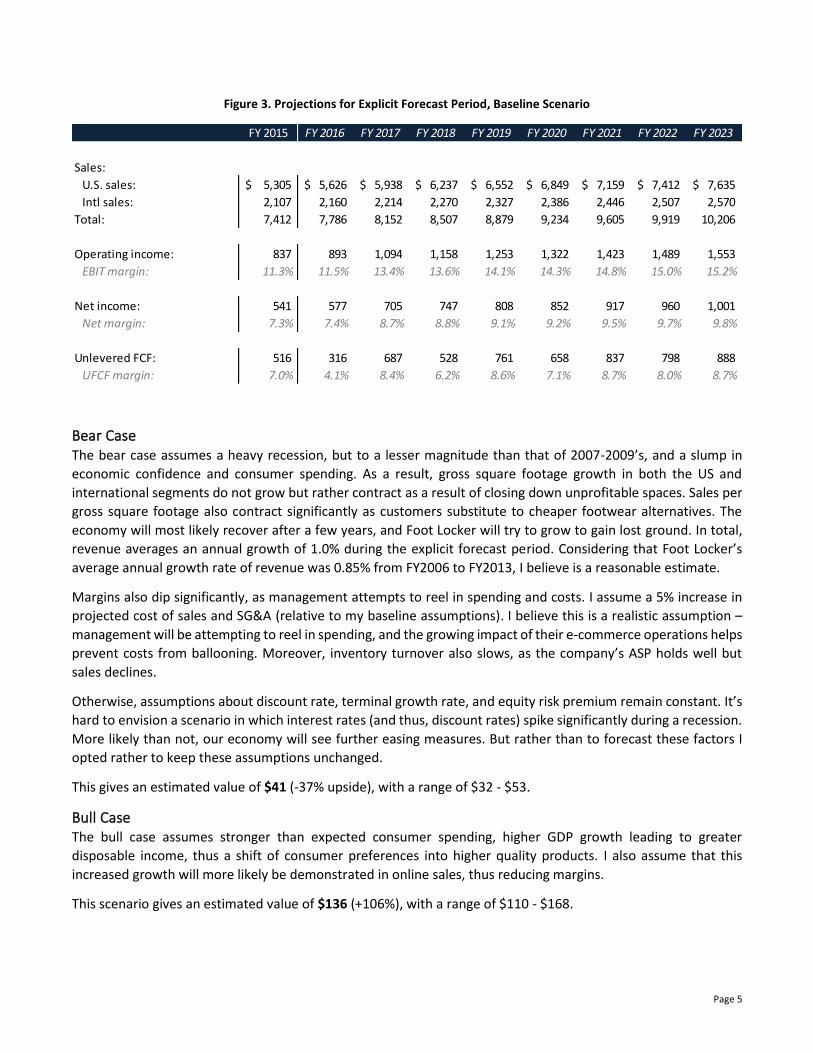
Figure 3. Projections for Explicit Forecast Period, Baseline Scenario
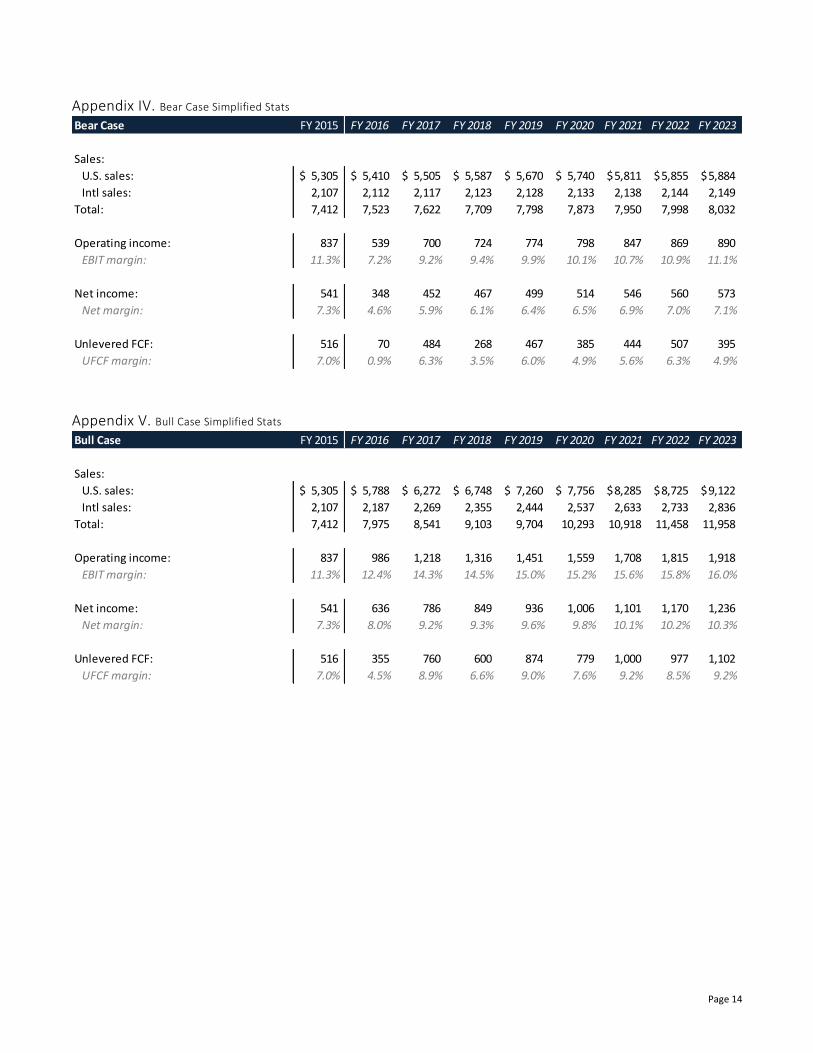
Bear Case The bear case assumes a heavy recession, but to a lesser magnitude than that of 2007-2009’s, and a slump in
economic confidence and consumer spending. As a result, gross square footage growth in both the US and
international segments do not grow but rather contract as a result of closing down unprofitable spaces. Sales per
gross square footage also contract significantly as customers substitute to cheaper footwear alternatives. The
economy will most likely recover after a few years, and Foot Locker will try to grow to gain lost ground. In total,
revenue averages an annual growth of 1.0% during the explicit forecast period. Considering that Foot Locker’s
average annual growth rate of revenue was 0.85% from FY2006 to FY2013, I believe is a reasonable estimate.
Margins also dip significantly, as management attempts to reel in spending and costs. I assume a 5% increase in
projected cost of sales and SG&A (relative to my baseline assumptions). I believe this is a realistic assumption –
management will be attempting to reel in spending, and the growing impact of their e-commerce operations helps
prevent costs from ballooning. Moreover, inventory turnover also slows, as the company’s ASP holds well but
sales declines.
Otherwise, assumptions about discount rate, terminal growth rate, and equity risk premium remain constant. It’s
hard to envision a scenario in which interest rates (and thus, discount rates) spike significantly during a recession.
More likely than not, our economy will see further easing measures. But rather than to forecast these factors I
opted rather to keep these assumptions unchanged.
This gives an estimated value of $41 (-37% upside), with a range of $32 - $53.
Bull Case The bull case assumes stronger than expected consumer spending, higher GDP growth leading to greater
disposable income, thus a shift of consumer preferences into higher quality products. I also assume that this
increased growth will more likely be demonstrated in online sales, thus reducing margins.
This scenario gives an estimated value of $136 (+106%), with a range of $110 - $168.
FY 2015 FY 2016 FY 2017 FY 2018 FY 2019 FY 2020 FY 2021 FY 2022 FY 2023
Sales:
U.S. sales: 5,305$ 5,626$ 5,938$ 6,237$ 6,552$ 6,849$ 7,159$ 7,412$ 7,635$
Intl sales: 2,107 2,160 2,214 2,270 2,327 2,386 2,446 2,507 2,570
Total: 7,412 7,786 8,152 8,507 8,879 9,234 9,605 9,919 10,206
Operating income: 837 893 1,094 1,158 1,253 1,322 1,423 1,489 1,553
EBIT margin: 11.3% 11.5% 13.4% 13.6% 14.1% 14.3% 14.8% 15.0% 15.2%
Net income: 541 577 705 747 808 852 917 960 1,001
Net margin: 7.3% 7.4% 8.7% 8.8% 9.1% 9.2% 9.5% 9.7% 9.8%
Unlevered FCF: 516 316 687 528 761 658 837 798 888
UFCF margin: 7.0% 4.1% 8.4% 6.2% 8.6% 7.1% 8.7% 8.0% 8.7%
Page 6
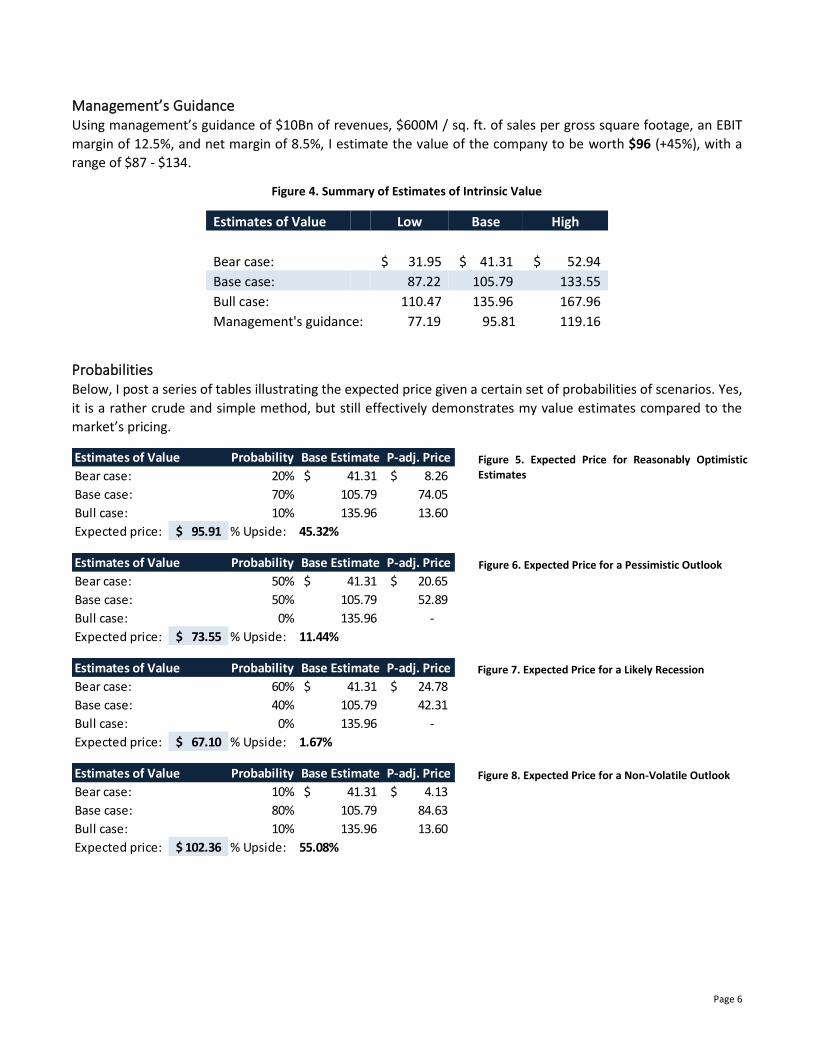
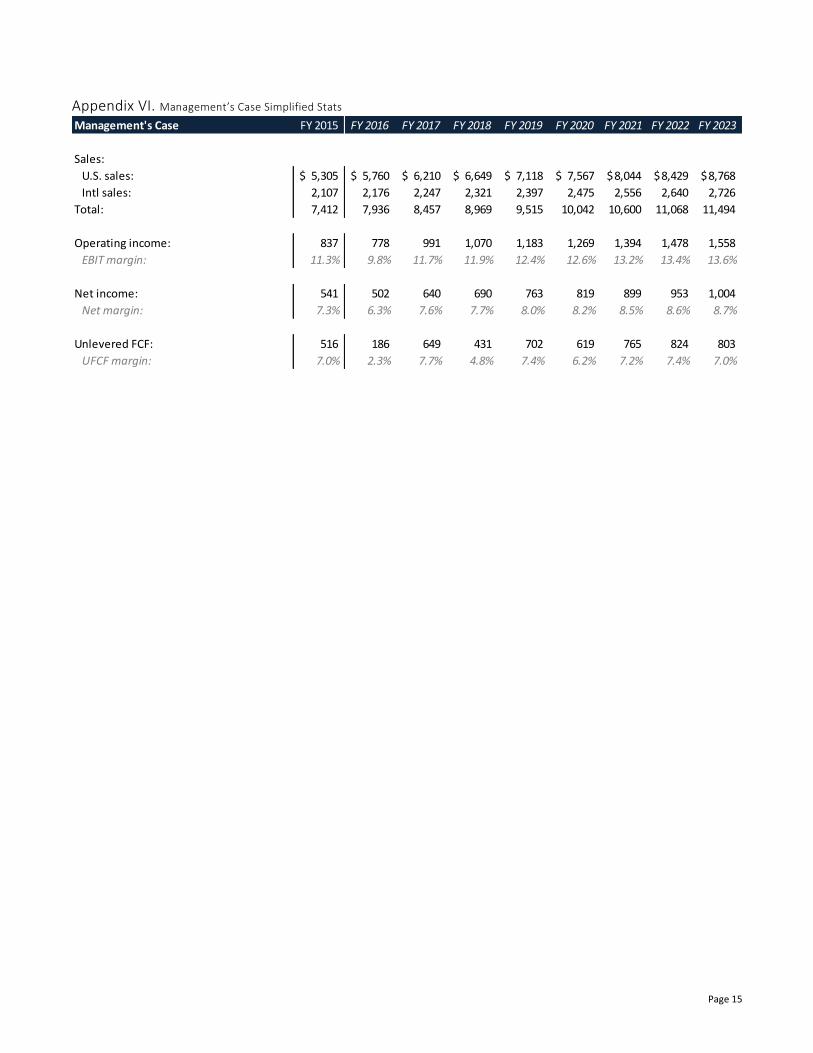
Management’s Guidance Using management’s guidance of $10Bn of revenues, $600M / sq. ft. of sales per gross square footage, an EBIT
margin of 12.5%, and net margin of 8.5%, I estimate the value of the company to be worth $96 (+45%), with a
range of $87 - $134.
Figure 4. Summary of Estimates of Intrinsic Value
Estimates of Value Low Base High
Bear case: $ 31.95 $ 41.31 $ 52.94
Base case: 87.22 105.79 133.55
Bull case: 110.47 135.96 167.96
Management's guidance: 77.19 95.81 119.16
Probabilities Below, I post a series of tables illustrating the expected price given a certain set of probabilities of scenarios. Yes,
it is a rather crude and simple method, but still effectively demonstrates my value estimates compared to the
market’s pricing.
Estimates of Value Probability Base Estimate P-adj. Price
Bear case: 20% 41.31$ 8.26$
Base case: 70% 105.79 74.05
Bull case: 10% 135.96 13.60
Expected price: 95.91$ % Upside: 45.32%
Estimates of Value Probability Base Estimate P-adj. Price
Bear case: 50% 41.31$ 20.65$
Base case: 50% 105.79 52.89
Bull case: 0% 135.96 -
Expected price: 73.55$ % Upside: 11.44%
Estimates of Value Probability Base Estimate P-adj. Price
Bear case: 60% 41.31$ 24.78$
Base case: 40% 105.79 42.31
Bull case: 0% 135.96 -
Expected price: 67.10$ % Upside: 1.67%
Estimates of Value Probability Base Estimate P-adj. Price
Bear case: 10% 41.31$ 4.13$
Base case: 80% 105.79 84.63
Bull case: 10% 135.96 13.60
Expected price: 102.36$ % Upside: 55.08%
Figure 5. Expected Price for Reasonably Optimistic
Estimates
Figure 6. Expected Price for a Pessimistic Outlook
Figure 7. Expected Price for a Likely Recession
Figure 8. Expected Price for a Non-Volatile Outlook
Page 7
Pricing In this section, I attempt to examine Foot Locker’s current multiples compared to other companies to compare
Foot Locker’s pricing compared to the industry average.
At first glance, FL seems overvalued compared to its peers. Its EV/LTM EBITDA, EV/LTM Sales, and EV/LTM Total
Square Footage are all higher than the average of its competitors, although its P/E ratio is slightly below the
average.
To further get a sense of what the market is pricing for future growth, I used IBES projected revenues, EBITDA,
and net income for competitors, while using my baseline projections for Foot Locker, to calculate future multiples.
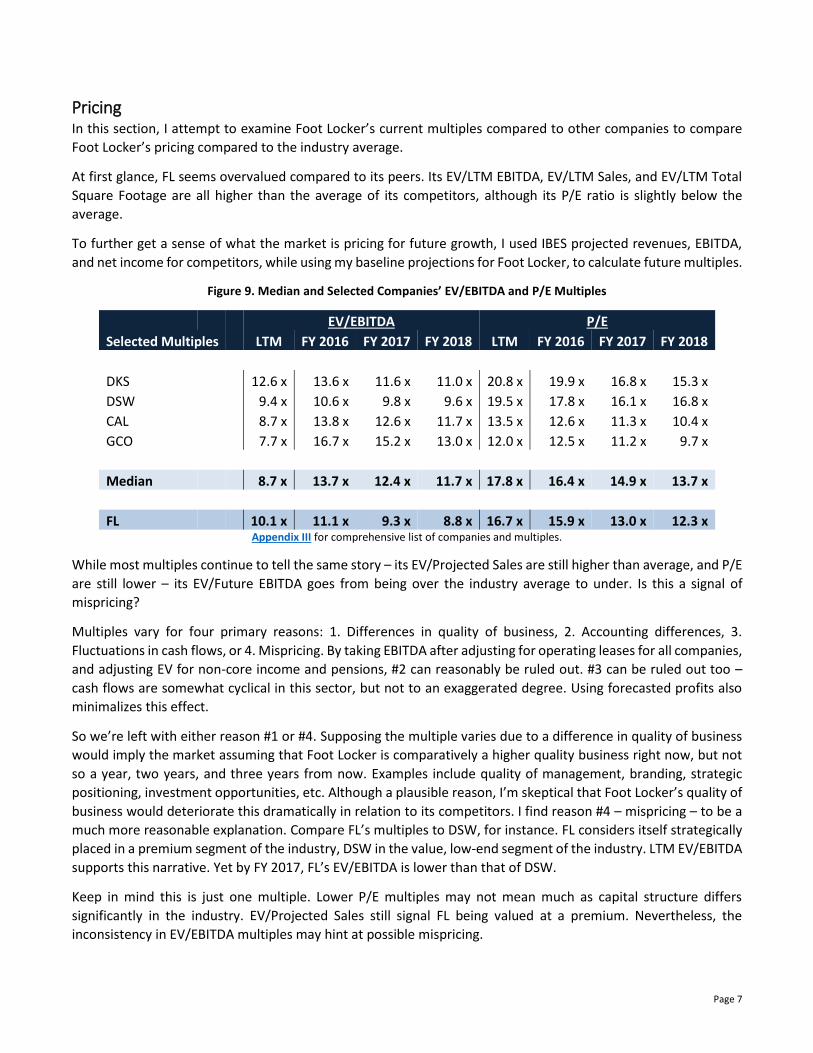
Figure 9. Median and Selected Companies’ EV/EBITDA and P/E Multiples
EV/EBITDA P/E
Selected Multiples LTM FY 2016 FY 2017 FY 2018 LTM FY 2016 FY 2017 FY 2018
DKS 12.6 x 13.6 x 11.6 x 11.0 x 20.8 x 19.9 x 16.8 x 15.3 x
DSW 9.4 x 10.6 x 9.8 x 9.6 x 19.5 x 17.8 x 16.1 x 16.8 x
CAL 8.7 x 13.8 x 12.6 x 11.7 x 13.5 x 12.6 x 11.3 x 10.4 x
GCO 7.7 x 16.7 x 15.2 x 13.0 x 12.0 x 12.5 x 11.2 x 9.7 x
Median 8.7 x 13.7 x 12.4 x 11.7 x 17.8 x 16.4 x 14.9 x 13.7 x
FL 10.1 x 11.1 x 9.3 x 8.8 x 16.7 x 15.9 x 13.0 x 12.3 x Appendix III for comprehensive list of companies and multiples.
While most multiples continue to tell the same story – its EV/Projected Sales are still higher than average, and P/E
are still lower – its EV/Future EBITDA goes from being over the industry average to under. Is this a signal of
mispricing?
Multiples vary for four primary reasons: 1. Differences in quality of business, 2. Accounting differences, 3.
Fluctuations in cash flows, or 4. Mispricing. By taking EBITDA after adjusting for operating leases for all companies,
and adjusting EV for non-core income and pensions, #2 can reasonably be ruled out. #3 can be ruled out too –
cash flows are somewhat cyclical in this sector, but not to an exaggerated degree. Using forecasted profits also
minimalizes this effect.
So we’re left with either reason #1 or #4. Supposing the multiple varies due to a difference in quality of business
would imply the market assuming that Foot Locker is comparatively a higher quality business right now, but not
so a year, two years, and three years from now. Examples include quality of management, branding, strategic
positioning, investment opportunities, etc. Although a plausible reason, I’m skeptical that Foot Locker’s quality of
business would deteriorate this dramatically in relation to its competitors. I find reason #4 – mispricing – to be a
much more reasonable explanation. Compare FL’s multiples to DSW, for instance. FL considers itself strategically
placed in a premium segment of the industry, DSW in the value, low-end segment of the industry. LTM EV/EBITDA
supports this narrative. Yet by FY 2017, FL’s EV/EBITDA is lower than that of DSW.
Keep in mind this is just one multiple. Lower P/E multiples may not mean much as capital structure differs
significantly in the industry. EV/Projected Sales still signal FL being valued at a premium. Nevertheless, the
inconsistency in EV/EBITDA multiples may hint at possible mispricing.
Page 8
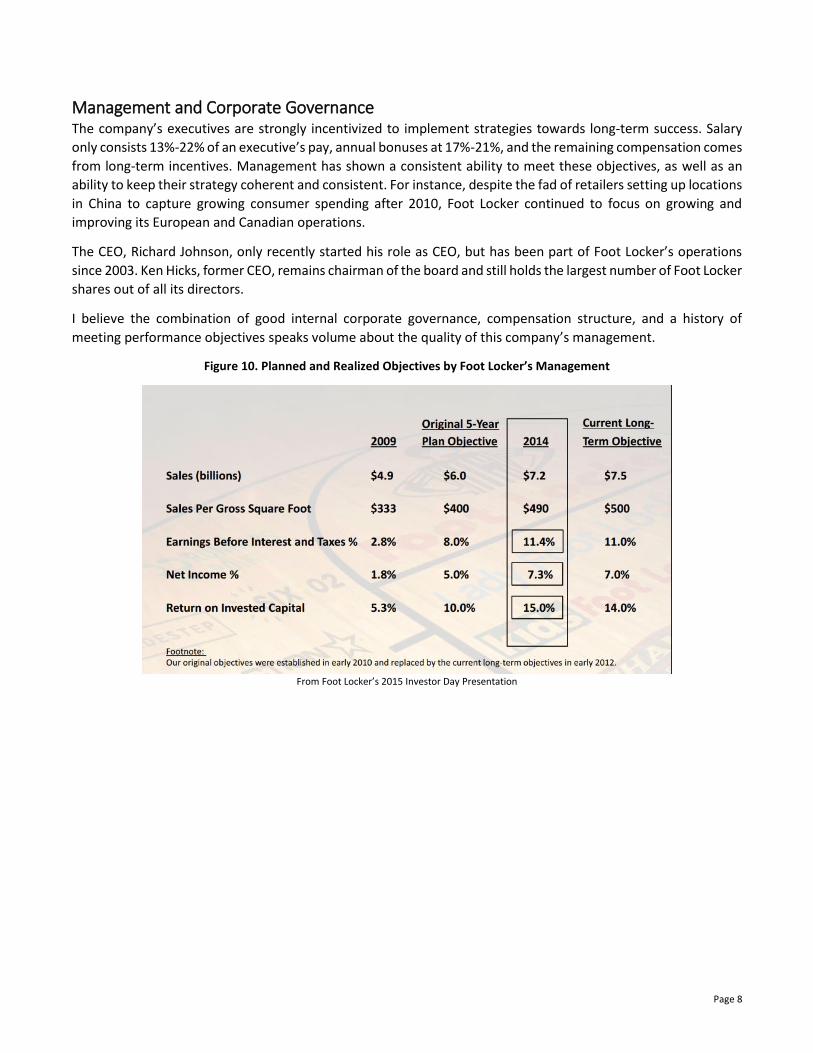
Management and Corporate Governance The company’s executives are strongly incentivized to implement strategies towards long-term success. Salary
only consists 13%-22% of an executive’s pay, annual bonuses at 17%-21%, and the remaining compensation comes
from long-term incentives. Management has shown a consistent ability to meet these objectives, as well as an
ability to keep their strategy coherent and consistent. For instance, despite the fad of retailers setting up locations
in China to capture growing consumer spending after 2010, Foot Locker continued to focus on growing and
improving its European and Canadian operations.
The CEO, Richard Johnson, only recently started his role as CEO, but has been part of Foot Locker’s operations
since 2003. Ken Hicks, former CEO, remains chairman of the board and still holds the largest number of Foot Locker
shares out of all its directors.
I believe the combination of good internal corporate governance, compensation structure, and a history of
meeting performance objectives speaks volume about the quality of this company’s management.
Figure 10. Planned and Realized Objectives by Foot Locker’s Management
From Foot Locker’s 2015 Investor Day Presentation
Page 9
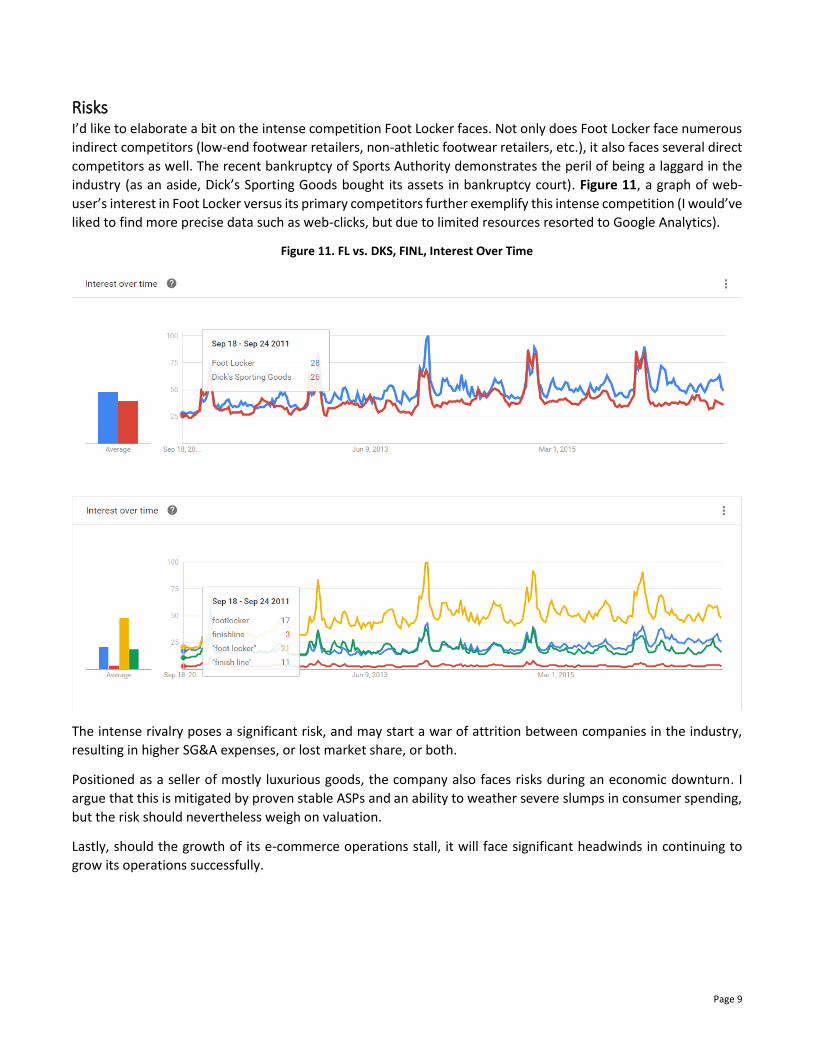
Risks I’d like to elaborate a bit on the intense competition Foot Locker faces. Not only does Foot Locker face numerous
indirect competitors (low-end footwear retailers, non-athletic footwear retailers, etc.), it also faces several direct
competitors as well. The recent bankruptcy of Sports Authority demonstrates the peril of being a laggard in the
industry (as an aside, Dick’s Sporting Goods bought its assets in bankruptcy court). Figure 11, a graph of web-
user’s interest in Foot Locker versus its primary competitors further exemplify this intense competition (I would’ve
liked to find more precise data such as web-clicks, but due to limited resources resorted to Google Analytics).
Figure 11. FL vs. DKS, FINL, Interest Over Time
The intense rivalry poses a significant risk, and may start a war of attrition between companies in the industry,
resulting in higher SG&A expenses, or lost market share, or both.
Positioned as a seller of mostly luxurious goods, the company also faces risks during an economic downturn. I
argue that this is mitigated by proven stable ASPs and an ability to weather severe slumps in consumer spending,
but the risk should nevertheless weigh on valuation.
Lastly, should the growth of its e-commerce operations stall, it will face significant headwinds in continuing to
grow its operations successfully.
Page 10
Investment Thesis I originally looked at Foot Locker to answer the following question: despite growing its operations successfully,
why did FL experience a -9.6% drop in its stock price? I cannot definitively answer the question, but I think the
combination of missing earnings for two consecutive quarters, an unfavorable litigation outcome, and being
potentially mispriced may contribute to its underperformance.
Although the industry Foot Locker operates in is incredibly competitive, I believe the company is positioned
strongly in a niche part of the industry that will continue to grow down the line. Other factors, such as excellent
corporate governance structure and a history of meeting long-term objectives further add to my belief that Foot
Locker is a competitive and attractive company.
Taking this into account, I believe the temporary underperformance creates a rather attractive buying
opportunity.
I approached estimating the company’s intrinsic value by assuming continuity in its strategy. For instance, I did
not assume further mergers and acquisitions, expansion to new regions, introduction of new products, and the
likes. In attempting to keep my assumptions as realistic and conservative as possible, I believe that Figure 5 best
demonstrates the intrinsic value of the company. I further believe the company has a good margin of safety. Figure
7 demonstrates that the prevailing price per share reflects what I think to be the expected price if one believes a
recession is more likely than not.
Therefore, I believe Foot Locker is a strong buy with a price target of $96. I have no time horizon for this, but I
believe the stock price will begin to trend upwards as the market begins to realize the high level of free cash flows
and returns this company is able to generate. Further increase in dividend payouts or share repurchases will
continue to support the price and help its convergence to intrinsic value.
Disclaimer As of the publication date of this report, I own shares of this company and stand to realize gains in the event that the price
of the stock increases. Investors should conduct independent due diligence on any security discussed before making any
investment decision.
Page 11
Some More Figures
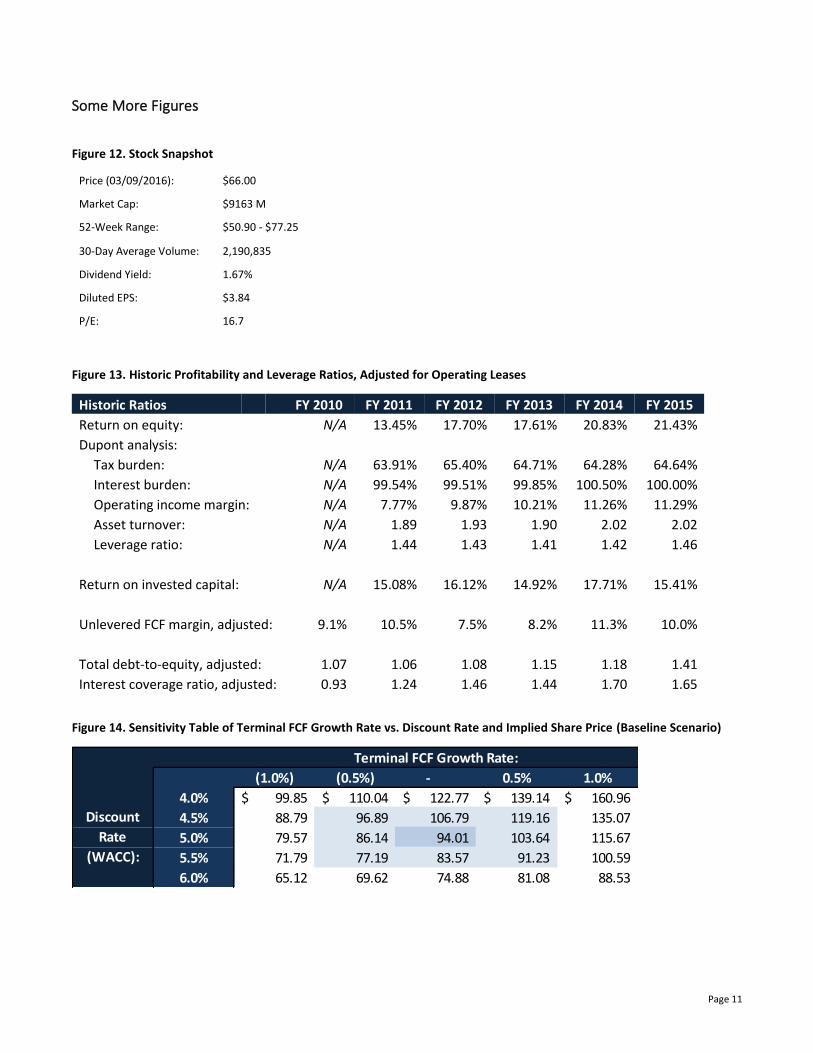
Figure 12. Stock Snapshot
Price (03/09/2016): $66.00
Market Cap: $9163 M
52-Week Range: $50.90 - $77.25
30-Day Average Volume: 2,190,835
Dividend Yield: 1.67%
Diluted EPS: $3.84
P/E: 16.7
Figure 13. Historic Profitability and Leverage Ratios, Adjusted for Operating Leases
Historic Ratios FY 2010 FY 2011 FY 2012 FY 2013 FY 2014 FY 2015
Return on equity: N/A 13.45% 17.70% 17.61% 20.83% 21.43%
Dupont analysis:
Tax burden: N/A 63.91% 65.40% 64.71% 64.28% 64.64%
Interest burden: N/A 99.54% 99.51% 99.85% 100.50% 100.00%
Operating income margin: N/A 7.77% 9.87% 10.21% 11.26% 11.29%
Asset turnover: N/A 1.89 1.93 1.90 2.02 2.02
Leverage ratio: N/A 1.44 1.43 1.41 1.42 1.46
Return on invested capital: N/A 15.08% 16.12% 14.92% 17.71% 15.41%
Unlevered FCF margin, adjusted: 9.1% 10.5% 7.5% 8.2% 11.3% 10.0%
Total debt-to-equity, adjusted: 1.07 1.06 1.08 1.15 1.18 1.41
Interest coverage ratio, adjusted: 0.93 1.24 1.46 1.44 1.70 1.65
Figure 14. Sensitivity Table of Terminal FCF Growth Rate vs. Discount Rate and Implied Share Price (Baseline Scenario)
Terminal FCF Growth Rate:
9580.6% (1.0%) (0.5%) - 0.5% 1.0%
4.0% 99.85$ 110.04$ 122.77$ 139.14$ 160.96$
4.5% 88.79 96.89 106.79 119.16 135.07
5.0% 79.57 86.14 94.01 103.64 115.67
5.5% 71.79 77.19 83.57 91.23 100.59
6.0% 65.12 69.62 74.88 81.08 88.53
Discount
Rate
(WACC):
Page 12
Appendices
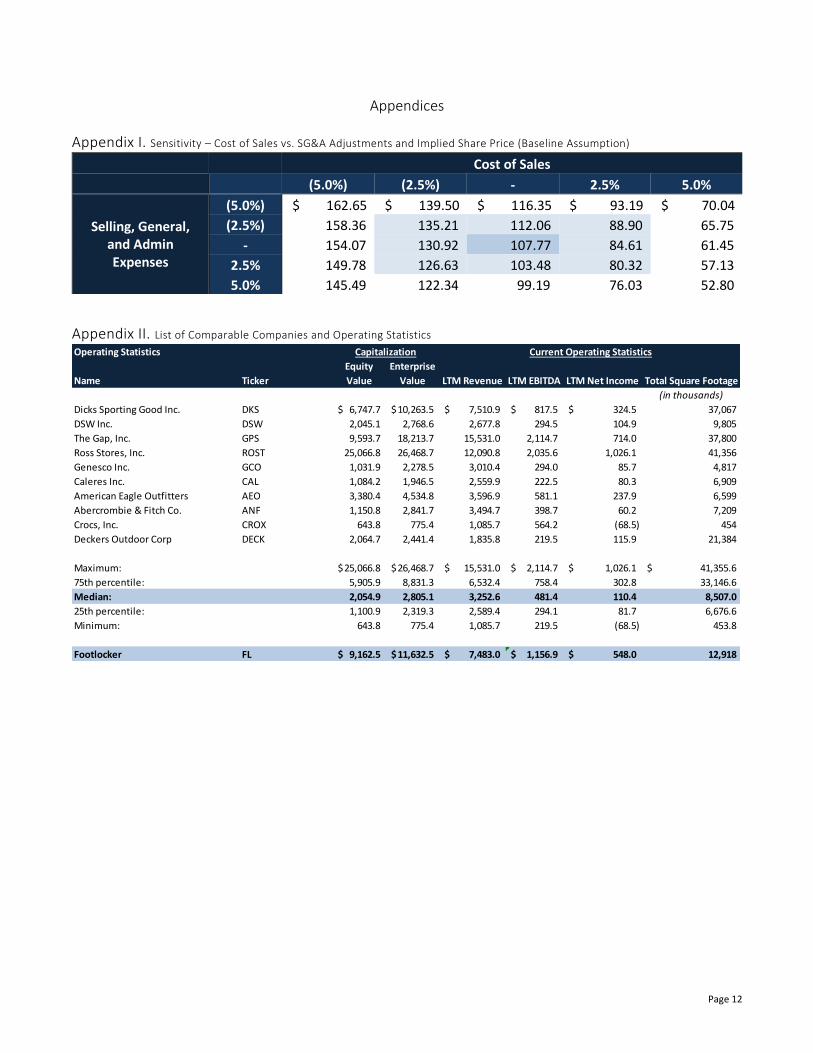
Appendix I. Sensitivity – Cost of Sales vs. SG&A Adjustments and Implied Share Price (Baseline Assumption)
Cost of Sales
10776.6% (5.0%) (2.5%) - 2.5% 5.0%
Selling, General, and Admin Expenses
(5.0%) $ 162.65 $ 139.50 $ 116.35 $ 93.19 $ 70.04
(2.5%) 158.36 135.21 112.06 88.90 65.75
- 154.07 130.92 107.77 84.61 61.45
2.5% 149.78 126.63 103.48 80.32 57.13
5.0% 145.49 122.34 99.19 76.03 52.80
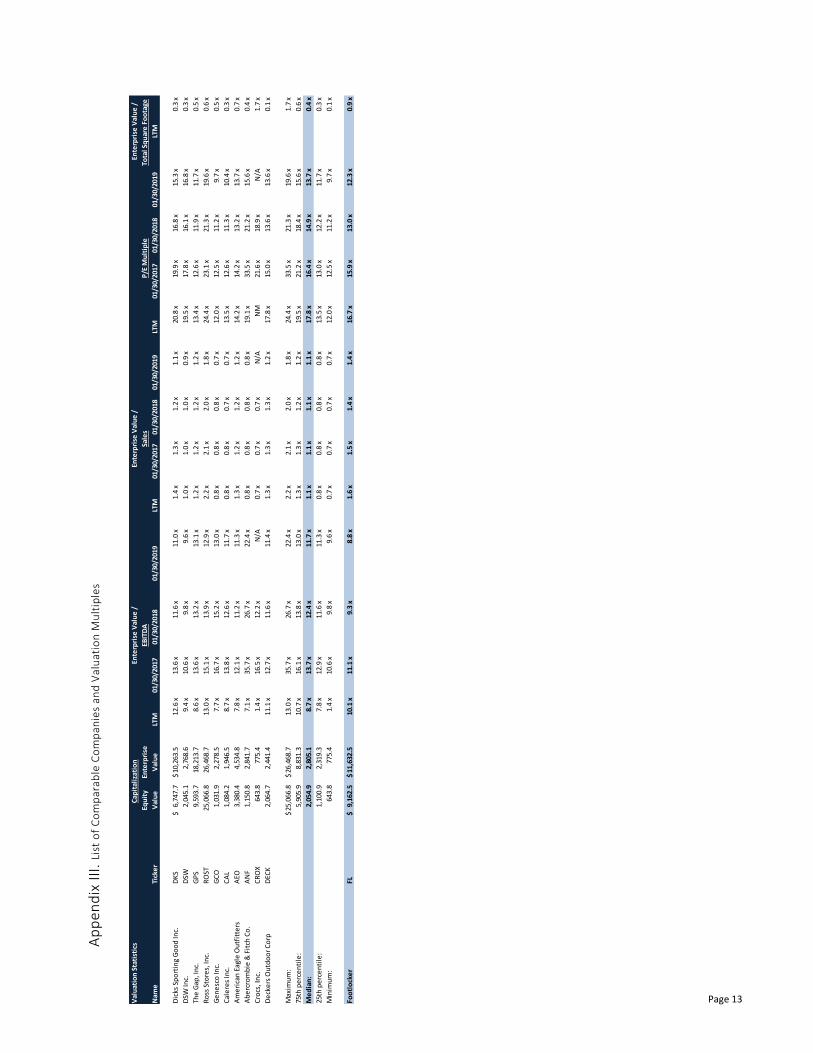
Appendix II. List of Comparable Companies and Operating Statistics
Operating Statistics Capitalization Current Operating Statistics Estimated Operating Statistics
Equity Enterprise Sales
Name Ticker Value Value LTM Revenue LTM EBITDA LTM Net Income Total Square Footage
(in thousands)
Dicks Sporting Good Inc. DKS 6,747.7$ 10,263.5$ 7,510.9$ 817.5$ 324.5$ 37,067
DSW Inc. DSW 2,045.1 2,768.6 2,677.8 294.5 104.9 9,805
The Gap, Inc. GPS 9,593.7 18,213.7 15,531.0 2,114.7 714.0 37,800
Ross Stores, Inc. ROST 25,066.8 26,468.7 12,090.8 2,035.6 1,026.1 41,356
Genesco Inc. GCO 1,031.9 2,278.5 3,010.4 294.0 85.7 4,817
Caleres Inc. CAL 1,084.2 1,946.5 2,559.9 222.5 80.3 6,909
American Eagle Outfitters AEO 3,380.4 4,534.8 3,596.9 581.1 237.9 6,599
Abercrombie & Fitch Co. ANF 1,150.8 2,841.7 3,494.7 398.7 60.2 7,209
Crocs, Inc. CROX 643.8 775.4 1,085.7 564.2 (68.5) 454
Deckers Outdoor Corp DECK 2,064.7 2,441.4 1,835.8 219.5 115.9 21,384
Maximum: 25,066.8$ 26,468.7$ 15,531.0$ 2,114.7$ 1,026.1$ 41,355.6$
75th percentile: 5,905.9 8,831.3 6,532.4 758.4 302.8 33,146.6
Median: 2,054.9 2,805.1 3,252.6 481.4 110.4 8,507.0
25th percentile: 1,100.9 2,319.3 2,589.4 294.1 81.7 6,676.6
Minimum: 643.8 775.4 1,085.7 219.5 (68.5) 453.8
Footlocker FL 9,162.5$ 11,632.5$ 7,483.0$ 1,156.9$ 548.0$ 12,918
Page 13 Val
uat
ion
Sta
tist
ics
Cap
ital
izat
ion
Ente
rpri
se V
alu
e /
Ente
rpri
se V
alu
e /
Ente
rpri
se V
alu
e /
Equ
ity
Ente
rpri
seEB
ITD
ASa
les
P/E
Mu
ltip
leTo
tal S
qu
are
Fo
ota
ge
Nam
eTi
cke
rV
alu
eV
alu
eLT
M01
/30/
2017
01/3
0/20
1801
/30/
2019
LTM
01/3
0/20
1701
/30/
2018
01/3
0/20
19LT
M01
/30/
2017
01/3
0/20
1801
/30/
2019
LTM
Dic
ks S
po
rtin
g G
oo
d In
c.D
KS
6,74
7.7
$
10,2
63.5
$ 12
.6 x
13.6
x11
.6 x
11.0
x1.
4 x
1.3
x1.
2 x
1.1
x20
.8 x
19.9
x16
.8 x
15.3
x0.
3 x
DSW
Inc.
DSW
2,04
5.1
2,76
8.6
9.4
x10
.6 x
9.8
x9.
6 x
1.0
x1.
0 x
1.0
x0.
9 x
19.5
x17
.8 x
16.1
x16
.8 x
0.3
x
The
Gap
, In
c.G
PS
9,59
3.7
18,2
13.7
8.6
x13
.6 x
13.2
x13
.1 x
1.2
x1.
2 x
1.2
x1.
2 x
13.4
x12
.6 x
11.9
x11
.7 x
0.5
x
Ro
ss S
tore
s, In
c.R
OST
25,0
66.8
26,4
68.7
13.0
x15
.1 x
13.9
x12
.9 x
2.2
x2.
1 x
2.0
x1.
8 x
24.4
x23
.1 x
21.3
x19
.6 x
0.6
x
Ge
ne
sco
Inc.
GC
O1,
031.
9
2,
278.
5
7.
7 x
16.7
x15
.2 x
13.0
x0.
8 x
0.8
x0.
8 x
0.7
x12
.0 x
12.5
x11
.2 x
9.7
x0.
5 x
Cal
ere
s In
c.C
AL
1,08
4.2
1,94
6.5
8.7
x13
.8 x
12.6
x11
.7 x
0.8
x0.
8 x
0.7
x0.
7 x
13.5
x12
.6 x
11.3
x10
.4 x
0.3
x
Am
eri
can
Eag
le O
utf
itte
rsA
EO3,
380.
4
4,
534.
8
7.
8 x
12.1
x11
.2 x
11.3
x1.
3 x
1.2
x1.
2 x
1.2
x14
.2 x
14.2
x13
.2 x
13.7
x0.
7 x
Ab
erc
rom
bie
& F
itch
Co
.A
NF
1,15
0.8
2,84
1.7
7.1
x35
.7 x
26.7
x22
.4 x
0.8
x0.
8 x
0.8
x0.
8 x
19.1
x33
.5 x
21.2
x15
.6 x
0.4
x
Cro
cs, I
nc.
CR
OX
643.
8
77
5.4
1.4
x16
.5 x
12.2
xN
/A0.
7 x
0.7
x0.
7 x
N/A
NM
21.6
x18
.9 x
N/A
1.7
x
De
cke
rs O
utd
oo
r C
orp
DEC
K2,
064.
7
2,
441.
4
11
.1 x
12.7
x11
.6 x
11.4
x1.
3 x
1.3
x1.
3 x
1.2
x17
.8 x
15.0
x13
.6 x
13.6
x0.
1 x
Max
imu
m:
25,0
66.8
$ 26
,468
.7$
13.0
x35
.7 x
26.7
x22
.4 x
2.2
x2.
1 x
2.0
x1.
8 x
24.4
x33
.5 x
21.3
x19
.6 x
1.7
x
75th
pe
rce
nti
le:
5,90
5.9
8,83
1.3
10.7
x16
.1 x
13.8
x13
.0 x
1.3
x1.
3 x
1.2
x1.
2 x
19.5
x21
.2 x
18.4
x15
.6 x
0.6
x
Me
dia
n:
2,05
4.9
2,80
5.1
8.7
x13
.7 x
12.4
x11
.7 x
1.1
x1.
1 x
1.1
x1.
1 x
17.8
x16
.4 x
14.9
x13
.7 x
0.4
x
25th
pe
rce
nti
le:
1,10
0.9
2,31
9.3
7.8
x12
.9 x
11.6
x11
.3 x
0.8
x0.
8 x
0.8
x0.
8 x
13.5
x13
.0 x
12.2
x11
.7 x
0.3
x
Min
imu
m:
643.
8
77
5.4
1.4
x10
.6 x
9.8
x9.
6 x
0.7
x0.
7 x
0.7
x0.
7 x
12.0
x12
.5 x
11.2
x9.
7 x
0.1
x
Foo
tlo
cke
rFL
9,16
2.5
$
11,6
32.5
$ 10
.1 x
11.1
x9.
3 x
8.8
x1.
6 x
1.5
x1.
4 x
1.4
x16
.7 x
15.9
x13
.0 x
12.3
x0.
9 x
Ap
pe
nd
ix I
II.
List
of
Co
mp
arab
le C
om
pan
ies
and
Val
uat
ion
Mu
ltip
les
Page 14
Appendix IV. Bear Case Simplified Stats
Appendix V. Bull Case Simplified Stats
Bear Case FY 2015 FY 2016 FY 2017 FY 2018 FY 2019 FY 2020 FY 2021 FY 2022 FY 2023
Sales:
U.S. sales: 5,305$ 5,410$ 5,505$ 5,587$ 5,670$ 5,740$ 5,811$ 5,855$ 5,884$
Intl sales: 2,107 2,112 2,117 2,123 2,128 2,133 2,138 2,144 2,149
Total: 7,412 7,523 7,622 7,709 7,798 7,873 7,950 7,998 8,032
Operating income: 837 539 700 724 774 798 847 869 890
EBIT margin: 11.3% 7.2% 9.2% 9.4% 9.9% 10.1% 10.7% 10.9% 11.1%
Net income: 541 348 452 467 499 514 546 560 573
Net margin: 7.3% 4.6% 5.9% 6.1% 6.4% 6.5% 6.9% 7.0% 7.1%
Unlevered FCF: 516 70 484 268 467 385 444 507 395
UFCF margin: 7.0% 0.9% 6.3% 3.5% 6.0% 4.9% 5.6% 6.3% 4.9%
Bull Case FY 2015 FY 2016 FY 2017 FY 2018 FY 2019 FY 2020 FY 2021 FY 2022 FY 2023
Sales:
U.S. sales: 5,305$ 5,788$ 6,272$ 6,748$ 7,260$ 7,756$ 8,285$ 8,725$ 9,122$
Intl sales: 2,107 2,187 2,269 2,355 2,444 2,537 2,633 2,733 2,836
Total: 7,412 7,975 8,541 9,103 9,704 10,293 10,918 11,458 11,958
Operating income: 837 986 1,218 1,316 1,451 1,559 1,708 1,815 1,918
EBIT margin: 11.3% 12.4% 14.3% 14.5% 15.0% 15.2% 15.6% 15.8% 16.0%
Net income: 541 636 786 849 936 1,006 1,101 1,170 1,236
Net margin: 7.3% 8.0% 9.2% 9.3% 9.6% 9.8% 10.1% 10.2% 10.3%
Unlevered FCF: 516 355 760 600 874 779 1,000 977 1,102
UFCF margin: 7.0% 4.5% 8.9% 6.6% 9.0% 7.6% 9.2% 8.5% 9.2%
Page 15
Appendix VI. Management’s Case Simplified Stats
Management's Case FY 2015 FY 2016 FY 2017 FY 2018 FY 2019 FY 2020 FY 2021 FY 2022 FY 2023
Sales:
U.S. sales: 5,305$ 5,760$ 6,210$ 6,649$ 7,118$ 7,567$ 8,044$ 8,429$ 8,768$
Intl sales: 2,107 2,176 2,247 2,321 2,397 2,475 2,556 2,640 2,726
Total: 7,412 7,936 8,457 8,969 9,515 10,042 10,600 11,068 11,494
Operating income: 837 778 991 1,070 1,183 1,269 1,394 1,478 1,558
EBIT margin: 11.3% 9.8% 11.7% 11.9% 12.4% 12.6% 13.2% 13.4% 13.6%
Net income: 541 502 640 690 763 819 899 953 1,004
Net margin: 7.3% 6.3% 7.6% 7.7% 8.0% 8.2% 8.5% 8.6% 8.7%
Unlevered FCF: 516 186 649 431 702 619 765 824 803
UFCF margin: 7.0% 2.3% 7.7% 4.8% 7.4% 6.2% 7.2% 7.4% 7.0%
Page 16
Appendix VII. WACC Calculation
Discounted Cash Flow (DCF) - Assumptions
Risk-free rate: 1.60%
Equity risk premium: 5.16%
Spread on debt: 3.25%
Pre-tax cost of debt: 4.85%
Cost of preferred: -
31
2 70 27 28 68 18
Comparable Companies - Unlevered Beta Calculations
Name Ticker Levered Beta Debt %Debt Preferred %Pref Equity %Equity Tax Rate Unlevered Beta
DKS
Dicks Sporting Good Inc. DKS 0.83 3,628.1$ 35.0% -$ 0.0% 6,747.7$ 65.0% 37.8% 0.62
DSW Inc. DSW 0.61 822.0 28.7% - 0.0% 2,045.1 71.3% 38.7% 0.49
The Gap, Inc. GPS 1.17 10,301.0 51.8% - 0.0% 9,593.7 48.2% 37.5% 0.70
Ross Stores, Inc. ROST 0.84 3,646.7 12.7% - 0.0% 25,066.8 87.3% 37.5% 0.77
Genesco Inc. GCO 1.1 1,277.2 55.3% 1.1 0.0% 1,031.9 44.7% 37.1% 0.62
Caleres Inc. CAL 0.89 1,010.4 48.2% - 0.0% 1,084.2 51.8% 29.5% 0.54
American Eagle Outfitters AEO 0.72 1,402.4 29.3% - 0.0% 3,380.4 70.7% 40.0% 0.58
Abercrombie & Fitch Co. ANF 1.32 2,176.7 65.4% - 0.0% 1,150.8 34.6% 40.0% 0.62
Deckers Outdoor Corp DECK 0.9 579.0 21.9% - 0.0% 2,064.7 78.1% 22.1% 0.74
Crocs, Inc. CROX 0.57 300.8 31.8% - 0.0% 643.8 68.2% 20.6% 0.42
Median: 0.87 1,339.8$ 33.4% -$ 0.0% 2,054.9$ 66.6% 37.5% 0.62
Footlocker: FL 0.63 3,467.0$ 27.5% -$ 0.0% 9,162.5$ 72.5% 35.5% 0.51
Comparable Companies - Levered Beta and WACC Calculations
Ticker Unlevered Beta Debt %Debt Preferred %Pref Equity %Equity Tax Rate Levered Beta
Current capital structure: FL 0.62 3,467.0$ 27.5% -$ 0.0% 9,162.5$ 72.5% 35.5% 0.77
"Optimal" capital structure: FL 0.62 4,218.9 33.4% - 0.0% 8,410.6 66.6% 35.5% 0.82
Cost of equity, based on comparables, current capital structure: 5.57%
Cost of equity, based on comparables, optimal capital structure: 5.82%
Cost of equity based on historical beta: 4.85%
WACC, based on comparables, current capital structure: 4.90%
WACC, based on comparables, optimal capital structure: 4.92%
WACC based on historical beta: 4.38%
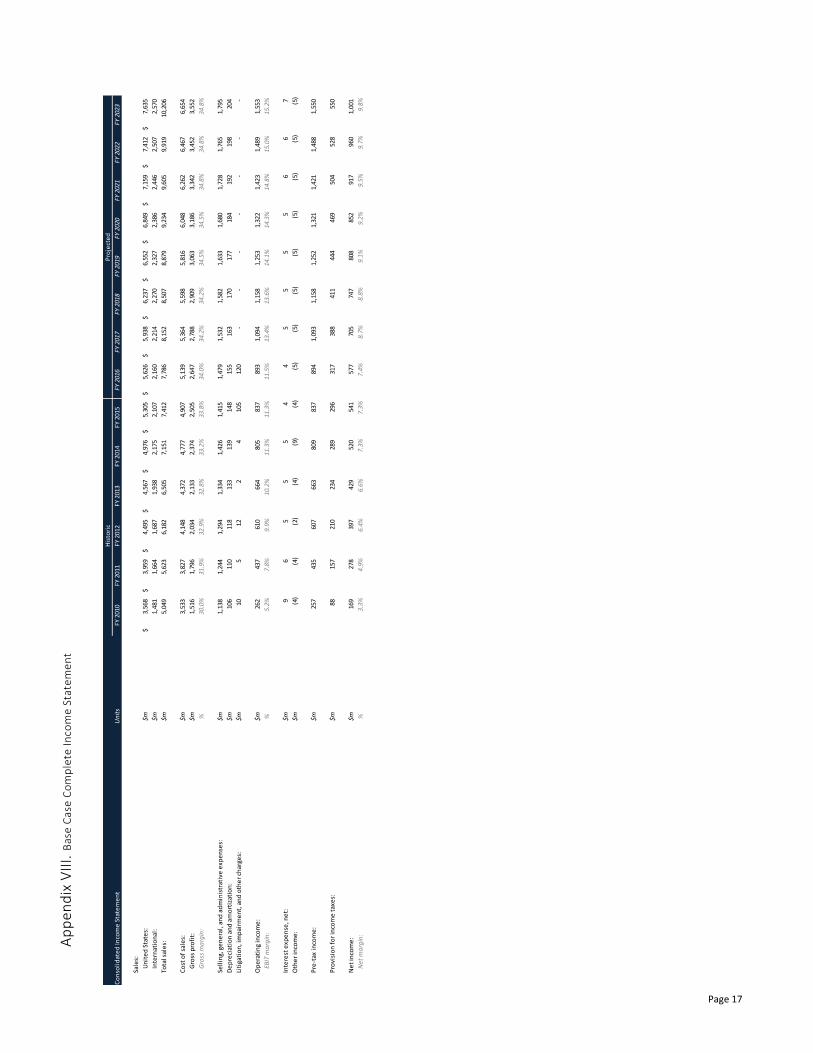
Page 17
His
tori
cP
roje
cte
d
Co
nso
lid
ate
d In
com
e S
tate
me
nt
Un
its
FY 2
010
FY 2
011
FY 2
012
FY 2
013
FY 2
014
FY 2
015
FY 2
016
FY 2
017
FY 2
018
FY 2
019
FY 2
020
FY 2
021
FY 2
022
FY 2
023
Sale
s:
Un
ite
d S
tate
s:$m
3,56
8$
3,95
9$
4,49
5$
4,56
7$
4,97
6$
5,30
5$
5,
626
$
5,93
8$
6,
237
$
6,55
2$
6,
849
$
7,15
9$
7,
412
$
7,63
5$
Inte
rnat
ion
al:
$m1,
481
1,
664
1,
687
1,
938
2,
175
2,
107
2,16
0
2,
214
2,27
0
2,
327
2,38
6
2,
446
2,50
7
2,
570
Tota
l sal
es:
$m5,
049
5,
623
6,
182
6,
505
7,
151
7,
412
7,78
6
8,
152
8,50
7
8,
879
9,23
4
9,
605
9,91
9
10
,206
Co
st o
f sa
les:
$m3,
533
3,
827
4,
148
4,
372
4,
777
4,
907
5,13
9
5,
364
5,59
8
5,
816
6,04
8
6,
262
6,46
7
6,
654
Gro
ss p
rofi
t:$m
1,51
6
1,79
6
2,03
4
2,13
3
2,37
4
2,50
5
2,
647
2,78
8
2,
909
3,06
3
3,
186
3,34
2
3,
452
3,55
2
Gro
ss m
arg
in:
%30
.0%
31.9
%32
.9%
32.8
%33
.2%
33.8
%34
.0%
34.2
%34
.2%
34.5
%34
.5%
34.8
%34
.8%
34.8
%
Sell
ing,
ge
ne
ral,
an
d a
dm
inis
trat
ive
exp
en
ses:
$m1,
138
1,
244
1,
294
1,
334
1,
426
1,
415
1,47
9
1,
532
1,58
2
1,
633
1,68
0
1,
728
1,76
5
1,
795
De
pre
ciat
ion
an
d a
mo
rtiz
atio
n:
$m10
6
11
0
11
8
13
3
13
9
14
8
15
5
16
3
17
0
17
7
18
4
19
2
19
8
20
4
Liti
gati
on
, im
pai
rme
nt,
an
d o
the
r ch
arge
s:$m
10
5
12
2
4
10
5
12
0
-
-
-
-
-
-
-
Op
era
tin
g in
com
e:
$m26
2
43
7
61
0
66
4
80
5
83
7
89
3
1,
094
1,15
8
1,
253
1,32
2
1,
423
1,48
9
1,
553
EBIT
ma
rgin
:%
5.2%
7.8%
9.9%
10.2
%11
.3%
11.3
%11
.5%
13.4
%13
.6%
14.1
%14
.3%
14.8
%15
.0%
15.2
%
Inte
rest
exp
en
se, n
et:
$m9
6
5
5
5
4
4
5
5
5
5
6
6
7
Oth
er
inco
me
:$m
(4)
(4
)
(2)
(4
)
(9)
(4
)
(5)
(5
)
(5)
(5
)
(5)
(5
)
(5)
(5
)
Pre
-tax
inco
me
:$m
257
435
607
663
809
837
894
1,09
3
1,
158
1,25
2
1,
321
1,42
1
1,
488
1,55
0
Pro
visi
on
fo
r in
com
e t
axe
s:$m
88
157
210
234
289
296
317
388
411
444
469
504
528
550
Ne
t in
com
e:
$m16
9
27
8
39
7
42
9
52
0
54
1
57
7
70
5
74
7
80
8
85
2
91
7
96
0
1,
001
Net
ma
rgin
:%
3.3%
4.9%
6.4%
6.6%
7.3%
7.3%
7.4%
8.7%
8.8%
9.1%
9.2%
9.5%
9.7%
9.8%
Ap
pe
nd
ix V
III.
Bas
e C
ase
Co
mp
lete
In
com
e S
tate
me
nt
Page 18
His
tori
cP
roje
cte
d
Un
leve
red
Fre
e C
ash
Flo
w P
roje
ctio
ns
Un
its
FY 2
010
FY 2
011
FY 2
012
FY 2
013
FY 2
014
FY 2
015
FY 2
016
FY 2
017
FY 2
018
FY 2
019
FY 2
020
FY 2
021
FY 2
022
FY 2
023
Sale
s:$m
5,04
9$
5,62
3$
6,18
2$
6,50
5$
7,15
1$
7,41
2$
7,
786
$
8,15
2$
8,
507
$
8,87
9$
9,
234
$
9,60
5$
9,
919
$
10,2
06$
An
nu
al s
ale
s g
row
th r
ate
:%
N/A
11.4
%9.
9%5.
2%9.
9%3.
6%5.
0%4.
7%4.
4%4.
4%4.
0%4.
0%3.
3%2.
9%
Op
era
tin
g in
com
e (
EBIT
):$m
262
437
610
664
805
837
893
1,09
4
1,
158
1,25
3
1,
322
1,42
3
1,
489
1,55
3
EBIT
ma
rgin
:%
5.2%
7.8%
9.9%
10.2
%11
.3%
11.3
%11
.5%
13.4
%13
.6%
14.1
%14
.3%
14.8
%15
.0%
15.2
%
Less
: tax
es,
exc
lud
ing
eff
ect
s o
f in
tere
st:
$m93
15
5
21
6
23
5
28
6
29
7
31
7
38
8
41
1
44
4
46
9
50
5
52
8
55
1
Ne
t o
pe
rati
ng
pro
fit
afte
r ta
xes
(NO
PA
T):
$m16
9
28
2
39
4
42
9
51
9
54
0
57
6
70
6
74
7
80
9
85
3
91
8
96
1
1,
002
Ad
just
me
nts
fo
r n
on
-cas
h c
har
ges:
No
n-c
ash
imp
airm
en
t ch
arge
s:$m
10
5
12
-
4
5
6
5
4
4
3
2
1
-
De
pre
ciat
ion
an
d a
mo
rtiz
atio
n:
$m10
6
11
0
11
8
13
3
13
9
14
8
15
5
16
3
17
0
17
7
18
4
19
2
19
8
20
4
De
ferr
ed
inco
me
tax
es:
$m84
29
20
19
20
(6
)
-
-
-
-
-
-
-
-
Shar
e-b
ase
d c
om
pe
nsa
tio
n e
xpe
nse
:$m
13
18
20
25
24
22
23
24
24
25
26
27
27
28
Exce
ss t
ax b
en
efi
ts o
n s
har
e-b
ase
d c
om
pe
nsa
tio
n:
$m1
5
9
(8)
(1
2)
(3
5)
(3
5)
(3
5)
(3
5)
(3
5)
(3
5)
(3
5)
(3
5)
(3
5)
Gai
n o
n s
ale
of
real
est
ate
:$m
-
-
-
-
(4)
-
-
-
-
-
-
-
-
-
Qu
alif
ied
pe
nsi
on
pla
n c
on
trib
uti
on
s:$m
(32)
(28)
(26)
(2)
(6
)
(4)
(2
2)
(2
1)
(2
1)
(2
0)
(1
8)
(1
7)
(1
6)
(1
4)
Tota
l ad
just
me
nts
fo
r n
on
-cas
h c
har
ges:
$m18
2
13
9
15
3
16
7
16
5
13
0
12
7
13
5
14
3
15
2
16
0
16
8
17
5
18
2
Ch
ange
s in
op
era
tin
g as
sets
& li
abil
itie
s:$m
Ch
ange
in m
erc
han
dis
e in
ven
tori
es:
$m(1
9)
(1
7)
(9
1)
(2
0)
(8
1)
(4
9)
(1
02)
6
(1
10)
16
(116
)
27
(1
11)
37
Ch
ange
in a
cco
un
ts p
ayab
le:
$m7
19
57
(48)
51
(17)
40
14
28
(1
7)
62
(53)
95
(9
0)
Ch
ange
in a
ccru
ed
an
d o
the
r li
abil
itie
s:$m
35
38
(4)
(1
0)
33
-
(2
9)
65
(28)
62
(2
6)
59
(27)
57
Ch
ange
in in
com
e t
ax r
ece
ivab
les
and
pay
able
s:$m
(33)
24
(34)
-
-
-
-
-
-
-
-
-
-
-
Ch
ange
in o
the
r, n
et:
$m(1
5)
16
(6
2)
12
24
14
0
(6
5)
3
(0
)
3
(0)
3
(1
)
3
Ne
t ch
ange
in w
ork
ing
cap
ital
:$m
(25)
80
(134
)
(66)
27
74
(1
56)
88
(110
)
64
(8
1)
36
(44)
6
Less
: cap
ital
exp
en
dit
ure
s:$m
(97)
(152
)
(163
)
(206
)
(190
)
(228
)
(231
)
(242
)
(252
)
(263
)
(274
)
(285
)
(294
)
(303
)
An
nu
al u
nle
vere
d f
ree
cas
h f
low
s:$m
229
349
250
324
521
516
316
687
528
761
658
837
798
888
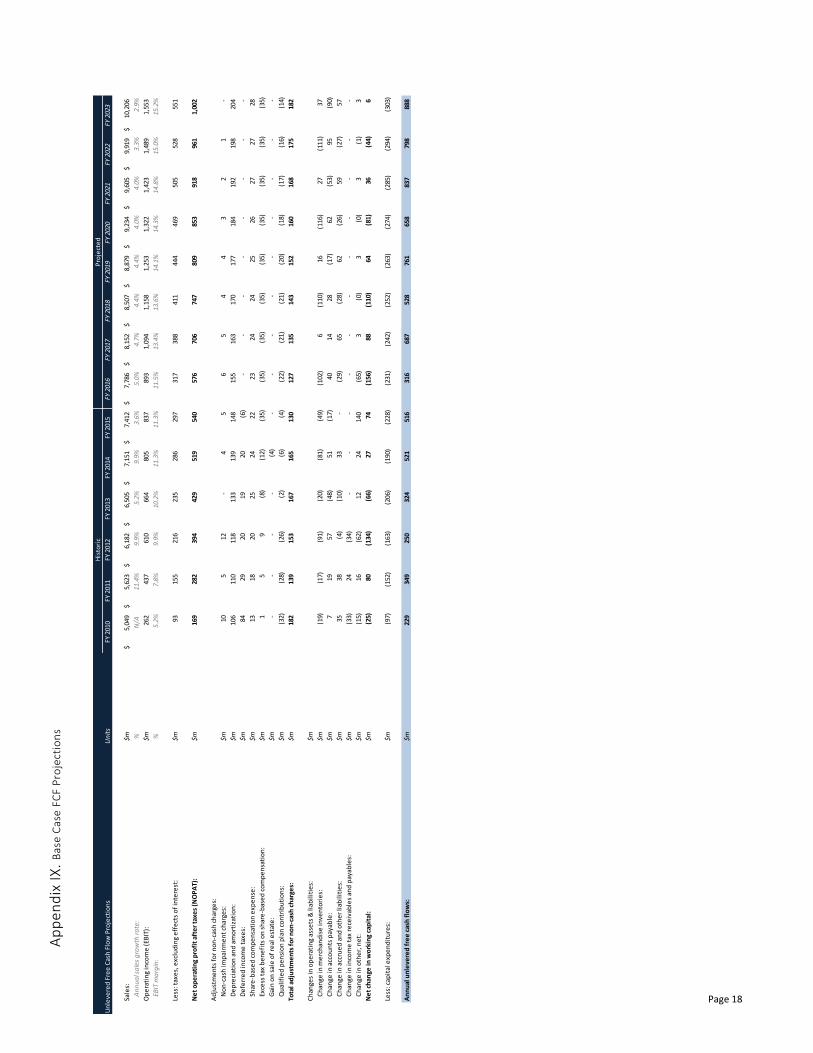
Ap
pe
nd
ix I
X.
Bas
e C
ase
FC
F P
roje
ctio
ns
Page 19
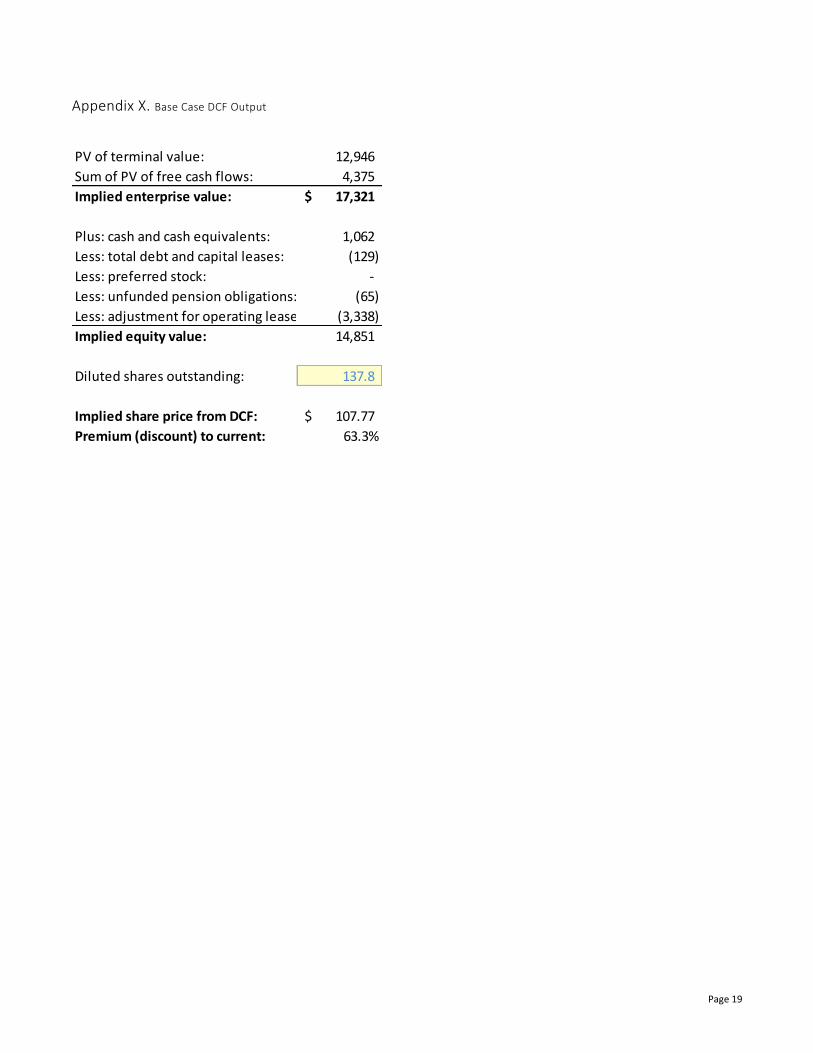
Appendix X. Base Case DCF Output
PV of terminal value: 12,946
Sum of PV of free cash flows: 4,375
Implied enterprise value: 17,321$
Plus: cash and cash equivalents: 1,062
Less: total debt and capital leases: (129)
Less: preferred stock: -
Less: unfunded pension obligations: (65)
Less: adjustment for operating leases: (3,338)
Implied equity value: 14,851
Diluted shares outstanding: 137.8
Implied share price from DCF: 107.77$
Premium (discount) to current: 63.3%
Page 20
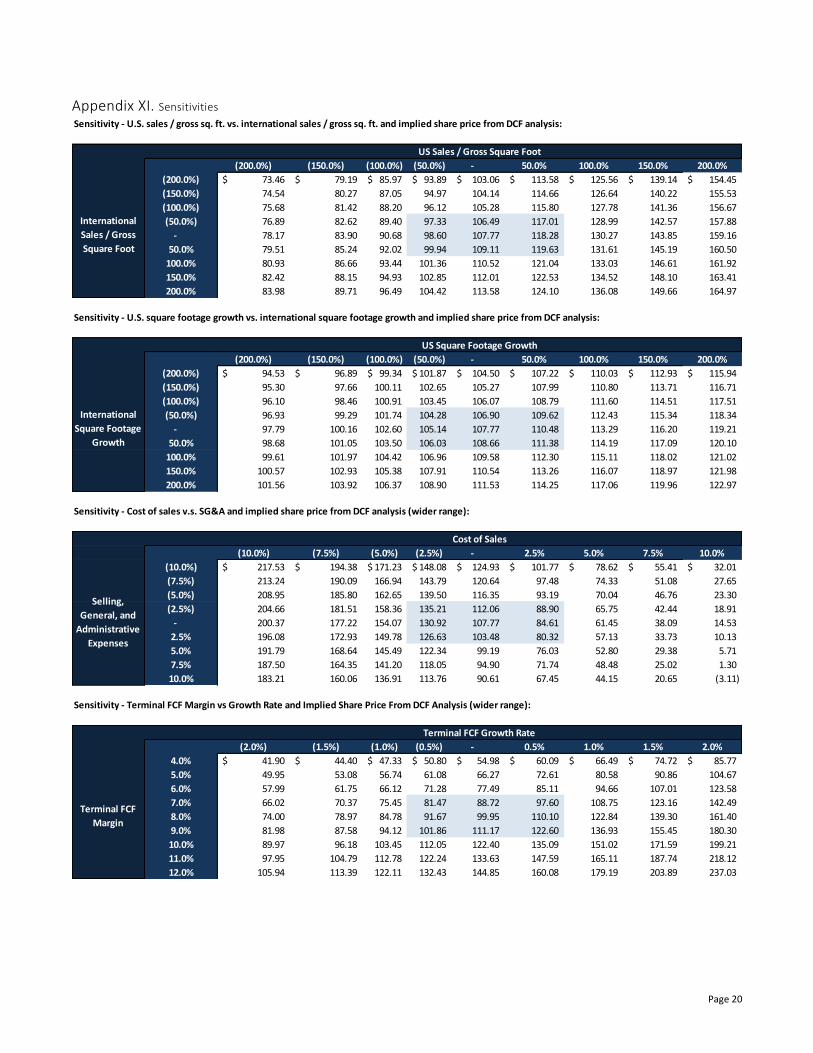
Appendix XI. Sensitivities
Sensitivity - U.S. sales / gross sq. ft. vs. international sales / gross sq. ft. and implied share price from DCF analysis:
US Sales / Gross Square Foot
10776.6% (200.0%) (150.0%) (100.0%) (50.0%) - 50.0% 100.0% 150.0% 200.0%
(200.0%) 73.46$ 79.19$ 85.97$ 93.89$ 103.06$ 113.58$ 125.56$ 139.14$ 154.45$
(150.0%) 74.54 80.27 87.05 94.97 104.14 114.66 126.64 140.22 155.53
(100.0%) 75.68 81.42 88.20 96.12 105.28 115.80 127.78 141.36 156.67
(50.0%) 76.89 82.62 89.40 97.33 106.49 117.01 128.99 142.57 157.88
- 78.17 83.90 90.68 98.60 107.77 118.28 130.27 143.85 159.16
50.0% 79.51 85.24 92.02 99.94 109.11 119.63 131.61 145.19 160.50
100.0% 80.93 86.66 93.44 101.36 110.52 121.04 133.03 146.61 161.92
150.0% 82.42 88.15 94.93 102.85 112.01 122.53 134.52 148.10 163.41
200.0% 83.98 89.71 96.49 104.42 113.58 124.10 136.08 149.66 164.97
International
Sales / Gross
Square Foot
Sensitivity - U.S. square footage growth vs. international square footage growth and implied share price from DCF analysis:
US Square Footage Growth
10776.6% (200.0%) (150.0%) (100.0%) (50.0%) - 50.0% 100.0% 150.0% 200.0%
(200.0%) 94.53$ 96.89$ 99.34$ 101.87$ 104.50$ 107.22$ 110.03$ 112.93$ 115.94$
(150.0%) 95.30 97.66 100.11 102.65 105.27 107.99 110.80 113.71 116.71
(100.0%) 96.10 98.46 100.91 103.45 106.07 108.79 111.60 114.51 117.51
(50.0%) 96.93 99.29 101.74 104.28 106.90 109.62 112.43 115.34 118.34
- 97.79 100.16 102.60 105.14 107.77 110.48 113.29 116.20 119.21
50.0% 98.68 101.05 103.50 106.03 108.66 111.38 114.19 117.09 120.10
100.0% 99.61 101.97 104.42 106.96 109.58 112.30 115.11 118.02 121.02
150.0% 100.57 102.93 105.38 107.91 110.54 113.26 116.07 118.97 121.98
200.0% 101.56 103.92 106.37 108.90 111.53 114.25 117.06 119.96 122.97
International
Square Footage
Growth
Sensitivity - Cost of sales v.s. SG&A and implied share price from DCF analysis (wider range):
Cost of Sales
10776.6% (10.0%) (7.5%) (5.0%) (2.5%) - 2.5% 5.0% 7.5% 10.0%
(10.0%) 217.53$ 194.38$ 171.23$ 148.08$ 124.93$ 101.77$ 78.62$ 55.41$ 32.01$
(7.5%) 213.24 190.09 166.94 143.79 120.64 97.48 74.33 51.08 27.65
(5.0%) 208.95 185.80 162.65 139.50 116.35 93.19 70.04 46.76 23.30
(2.5%) 204.66 181.51 158.36 135.21 112.06 88.90 65.75 42.44 18.91
- 200.37 177.22 154.07 130.92 107.77 84.61 61.45 38.09 14.53
2.5% 196.08 172.93 149.78 126.63 103.48 80.32 57.13 33.73 10.13
5.0% 191.79 168.64 145.49 122.34 99.19 76.03 52.80 29.38 5.71
7.5% 187.50 164.35 141.20 118.05 94.90 71.74 48.48 25.02 1.30
10.0% 183.21 160.06 136.91 113.76 90.61 67.45 44.15 20.65 (3.11)
Selling,
General, and
Administrative
Expenses
Sensitivity - Terminal FCF Margin vs Growth Rate and Implied Share Price From DCF Analysis (wider range):
Terminal FCF Growth Rate
10776.6% (2.0%) (1.5%) (1.0%) (0.5%) - 0.5% 1.0% 1.5% 2.0%
4.0% 41.90$ 44.40$ 47.33$ 50.80$ 54.98$ 60.09$ 66.49$ 74.72$ 85.77$
5.0% 49.95 53.08 56.74 61.08 66.27 72.61 80.58 90.86 104.67
6.0% 57.99 61.75 66.12 71.28 77.49 85.11 94.66 107.01 123.58
7.0% 66.02 70.37 75.45 81.47 88.72 97.60 108.75 123.16 142.49
8.0% 74.00 78.97 84.78 91.67 99.95 110.10 122.84 139.30 161.40
9.0% 81.98 87.58 94.12 101.86 111.17 122.60 136.93 155.45 180.30
10.0% 89.97 96.18 103.45 112.05 122.40 135.09 151.02 171.59 199.21
11.0% 97.95 104.79 112.78 122.24 133.63 147.59 165.11 187.74 218.12
12.0% 105.94 113.39 122.11 132.43 144.85 160.08 179.19 203.89 237.03
Terminal FCF
Margin