food desert presentation
TRANSCRIPT
+
Can community gardens and farmer’s markets end food deserts?Tim Sharp
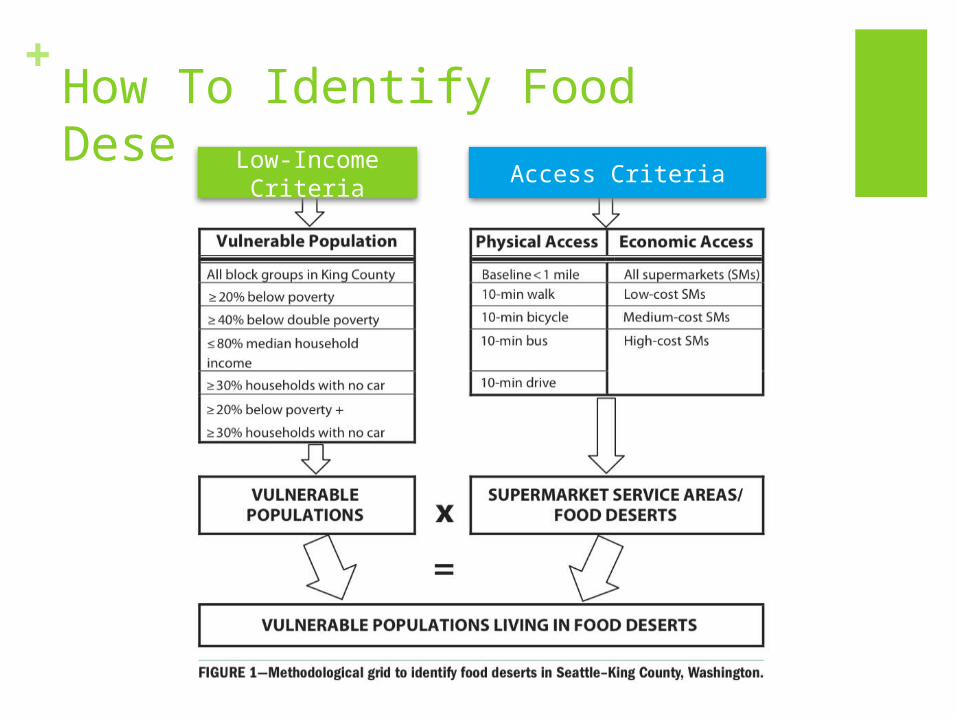
+How To Identify Food DesertsLow-Income
Criteria Access Criteria
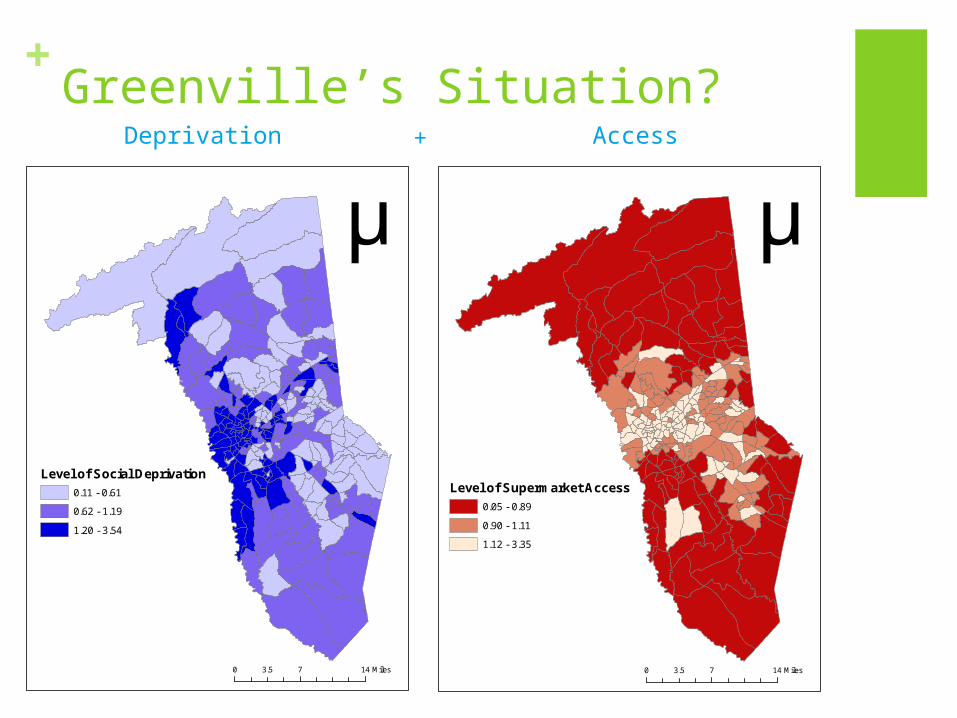
+Greenville’s Situation?
0 7 143.5 Miles
µ
Level of Social Deprivation0.11 - 0.61
0.62 - 1.19
1.20 - 3.54
0 7 143.5 Miles
µ
Level of Supermarket Access0.05 - 0.89
0.90 - 1.11
1.12 - 3.35
Deprivation Access+
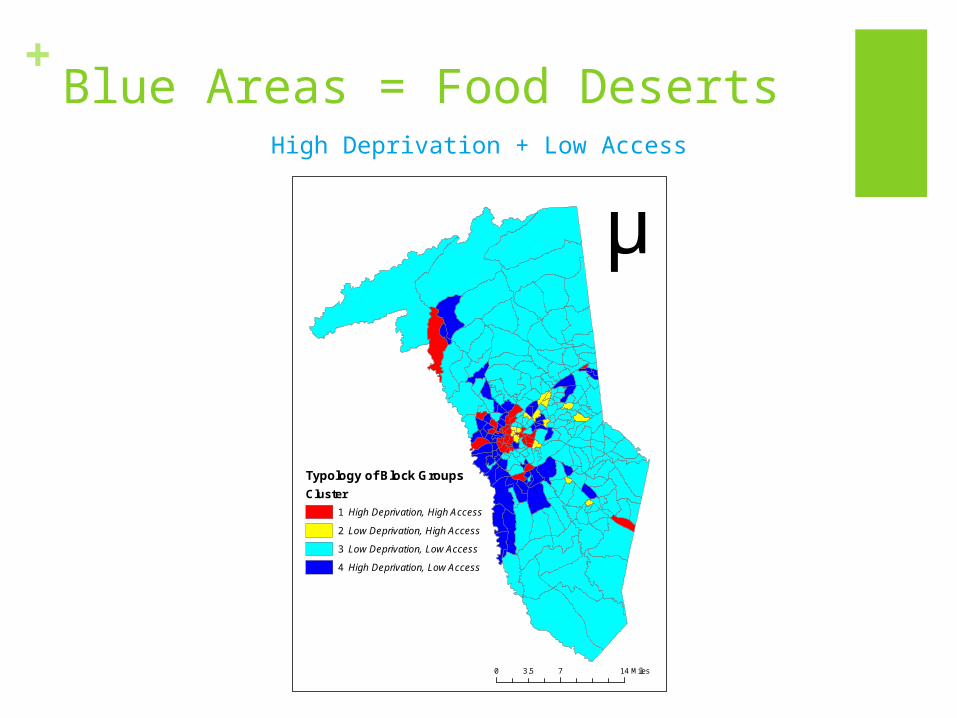
+Blue Areas = Food Deserts
0 7 143.5 Miles
µ
Typology of Block GroupsCluster
1 High Deprivation, High Access
2 Low Deprivation, High Access
3 Low Deprivation, Low Access
4 High Deprivation, Low Access
High Deprivation + Low Access
+
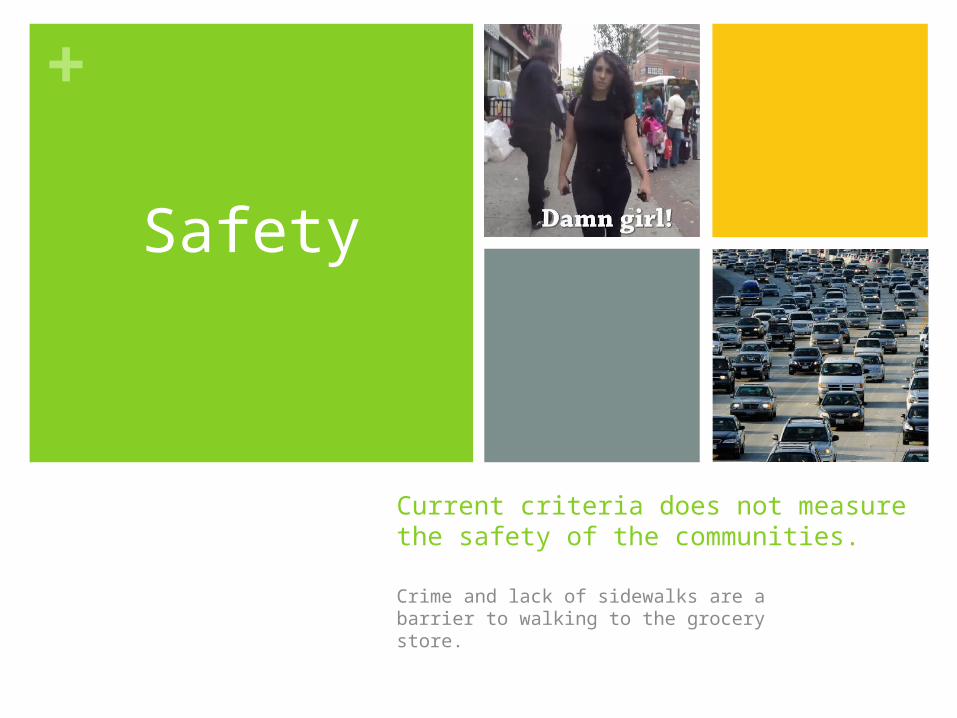
Current criteria does not measure the safety of the communities.Crime and lack of sidewalks are a barrier to walking to the grocery store.
Safety
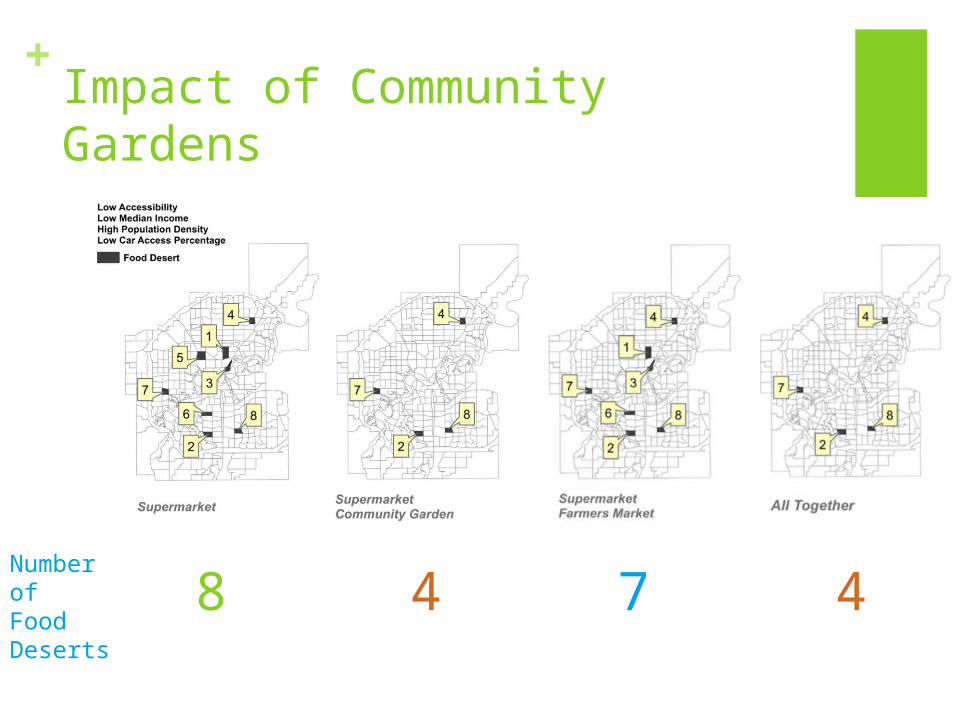
+Impact of Community Gardens
Number of Food Deserts 8 4 7 4
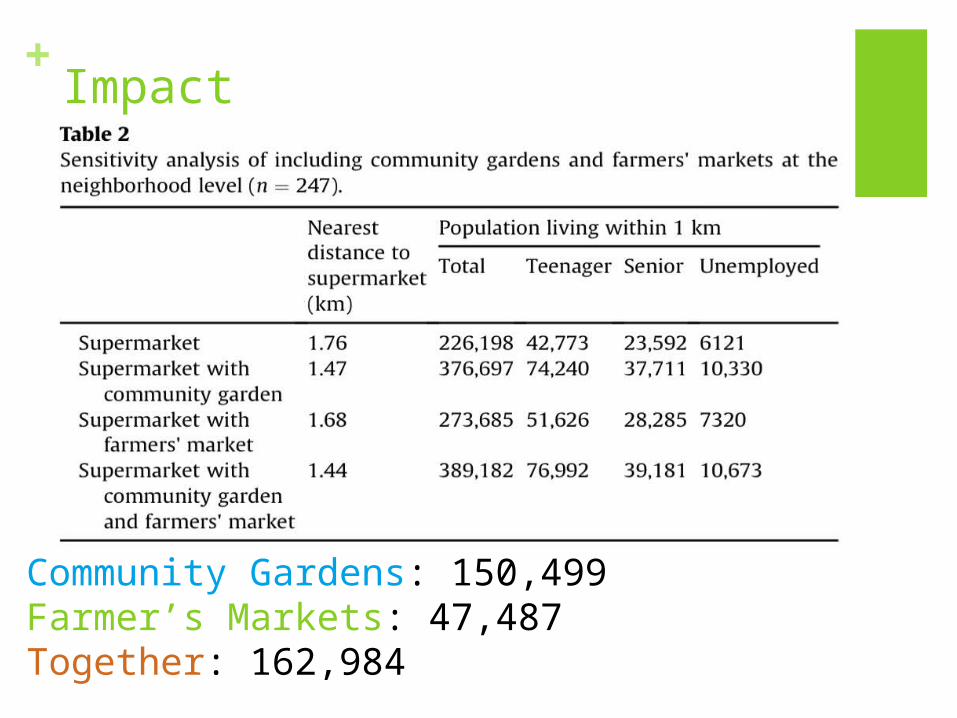
+Impact
Community Gardens: 150,499Farmer’s Markets: 47,487Together: 162,984
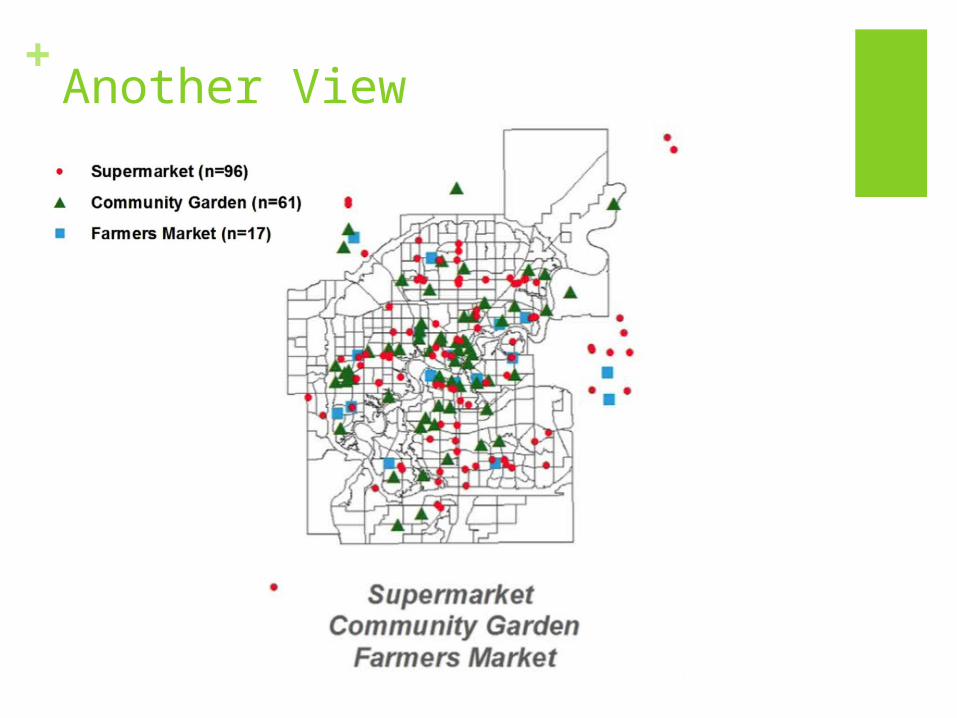
+Another View
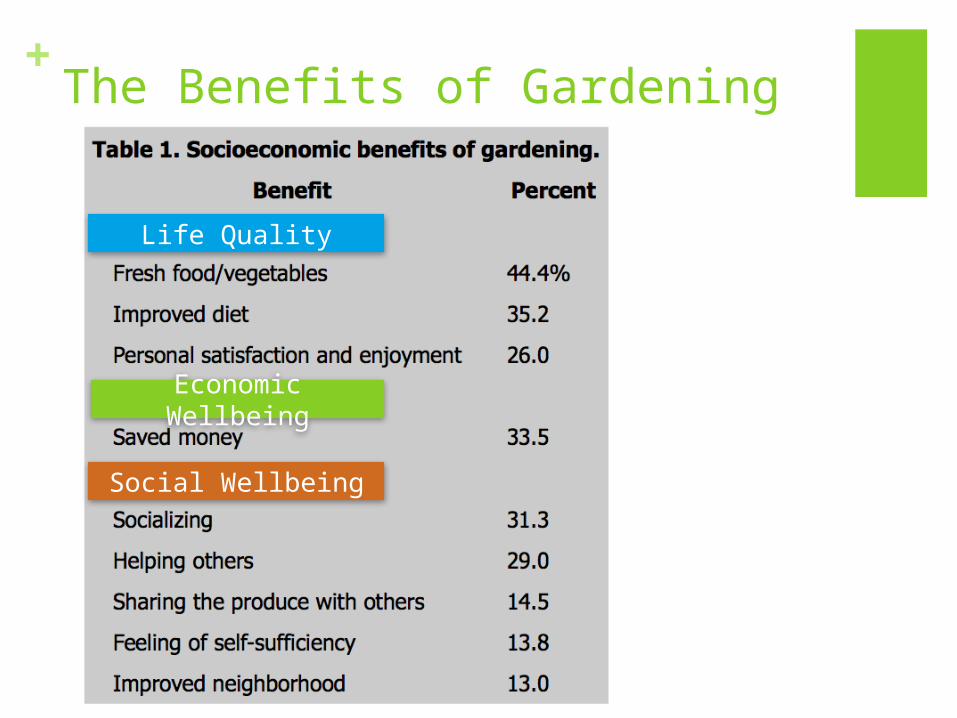
+The Benefits of Gardening
Life Quality
Economic Wellbeing
Social Wellbeing
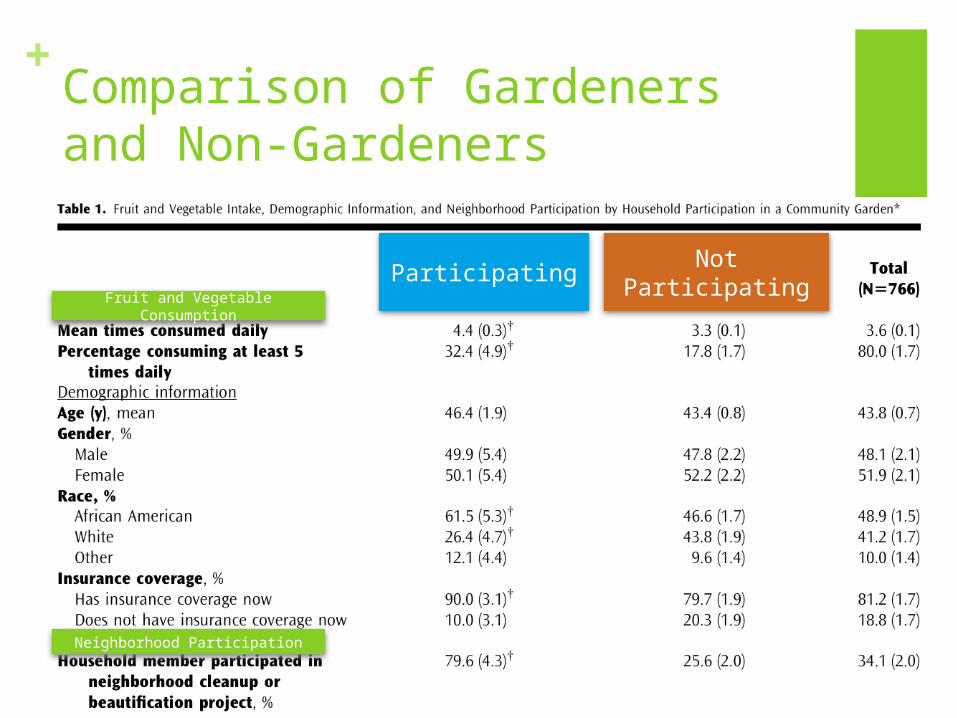
+Comparison of Gardeners and Non-Gardeners
Participating Not ParticipatingFruit and Vegetable Consumption
Neighborhood Participation
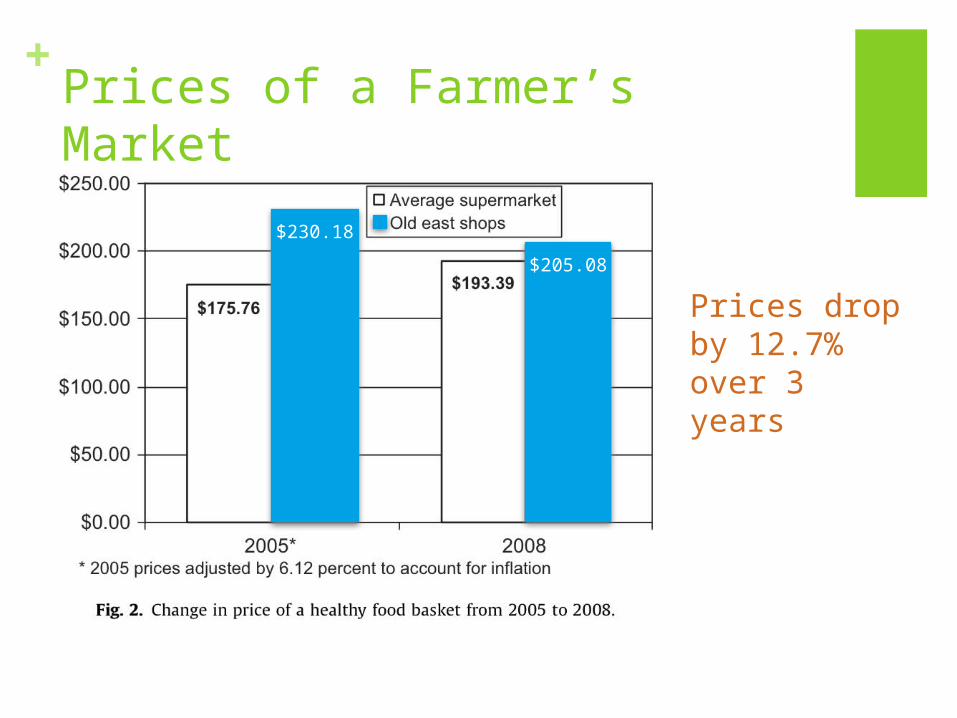
+Prices of a Farmer’s Market
$230.18$205.08
Prices drop by 12.7% over 3 years
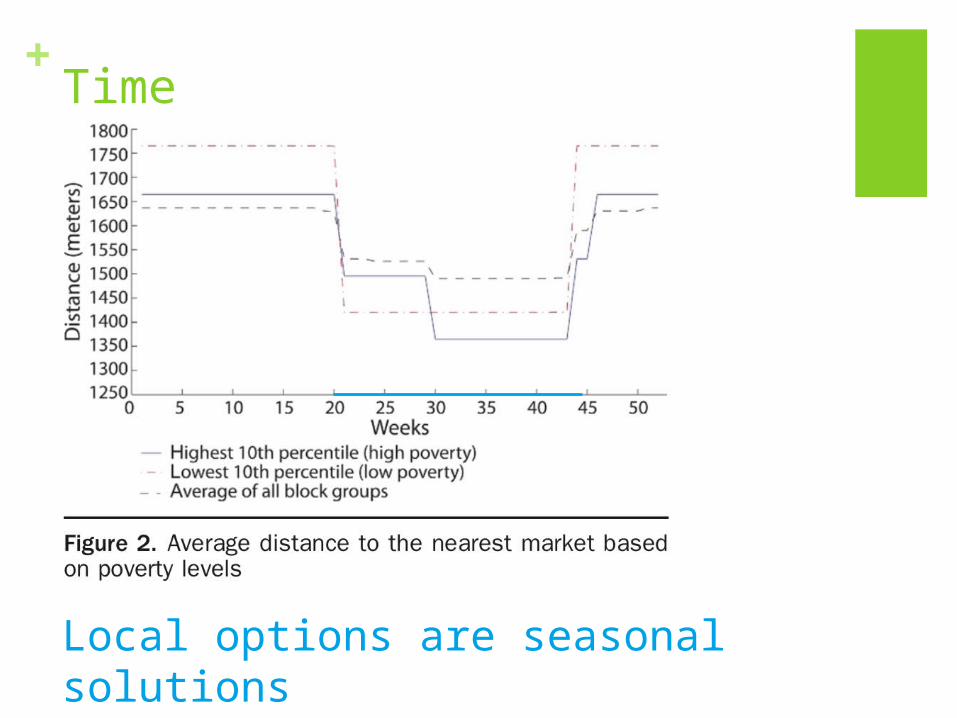
+Time
Local options are seasonal solutions
+
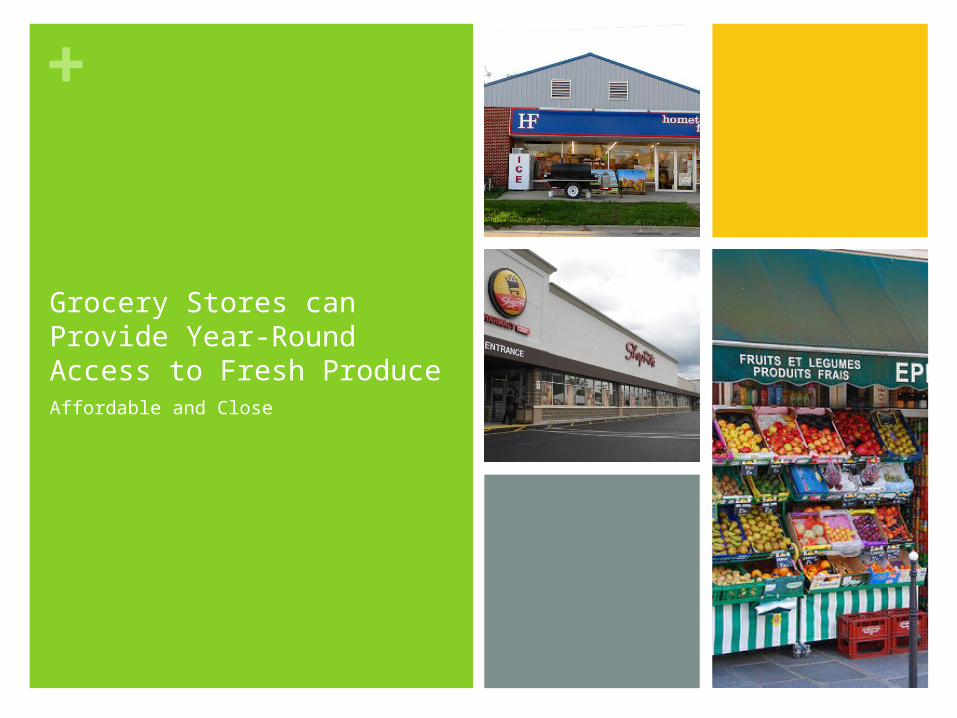
Grocery Stores can Provide Year-Round Access to Fresh ProduceAffordable and Close
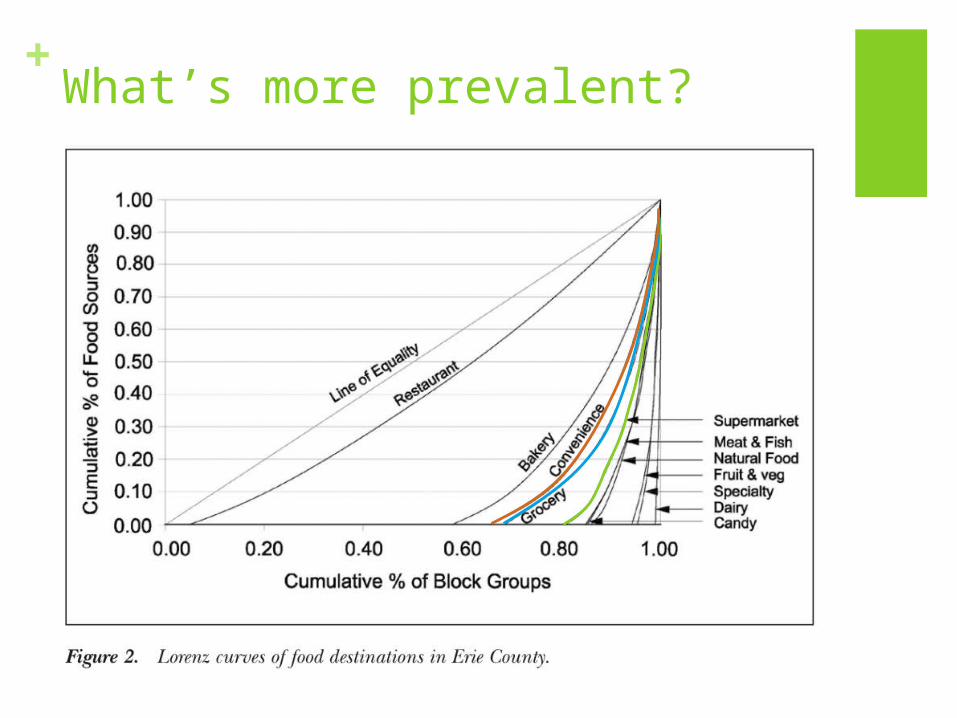
+What’s more prevalent?
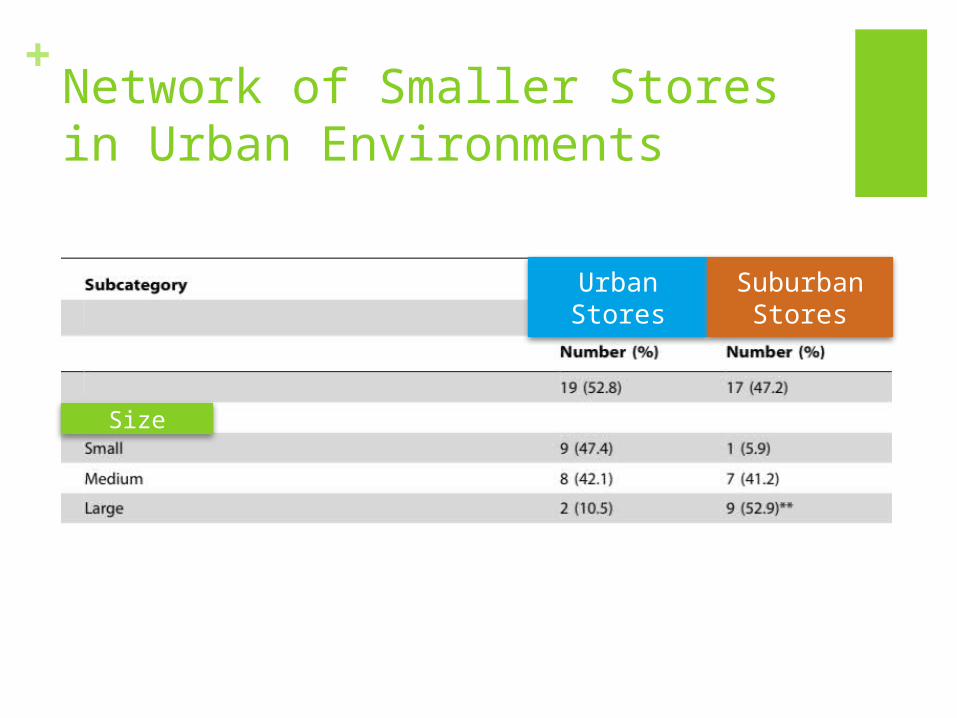
+Network of Smaller Stores in Urban Environments
UrbanStores
SuburbanStores
Size
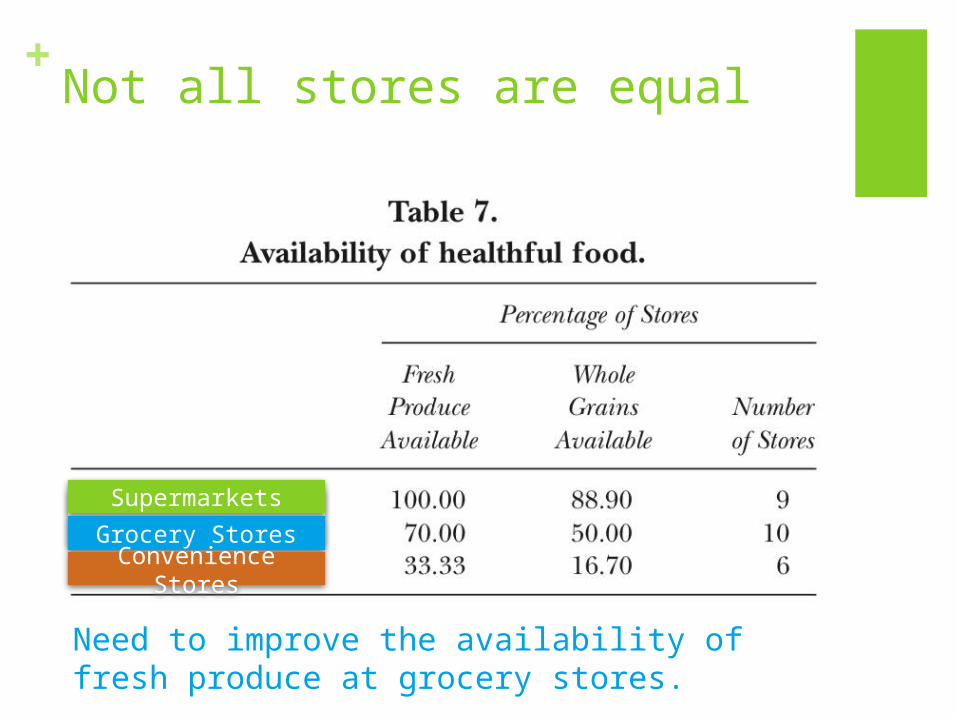
+Not all stores are equal
SupermarketsGrocery StoresConvenience
Stores
Need to improve the availability of fresh produce at grocery stores.
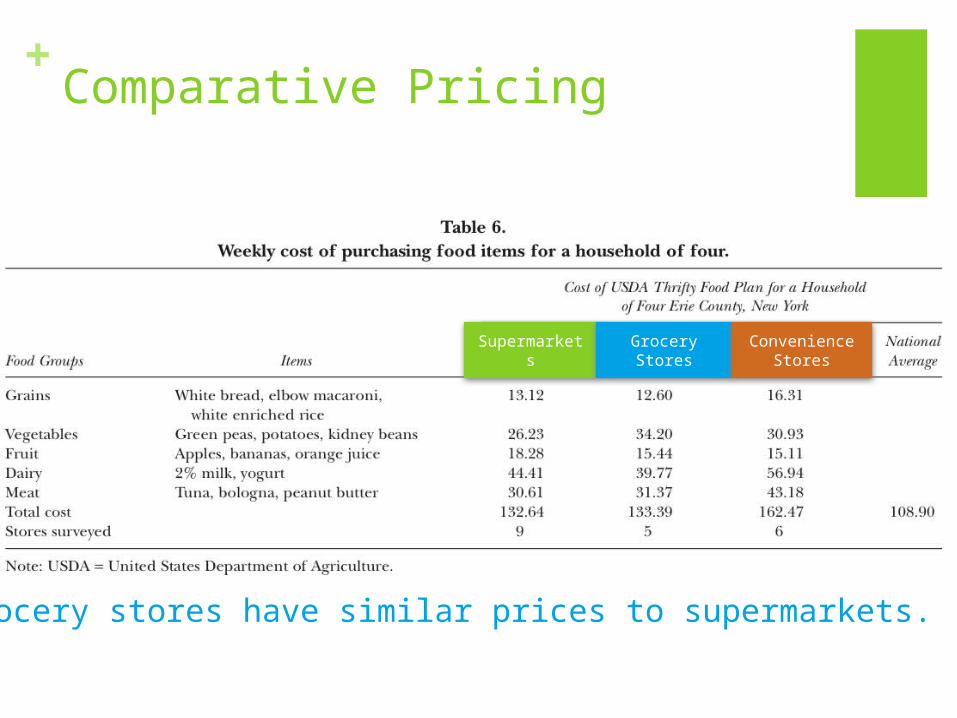
+Comparative Pricing
Supermarkets Grocery Stores
Convenience Stores
Grocery stores have similar prices to supermarkets.
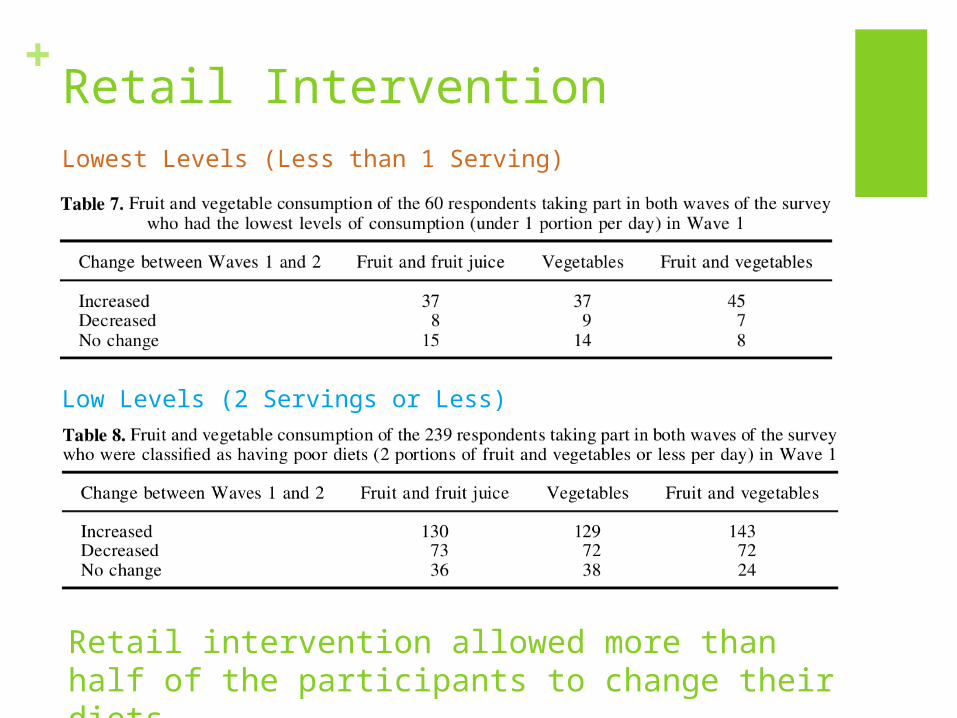
+Retail InterventionLowest Levels (Less than 1 Serving)
Low Levels (2 Servings or Less)
Retail intervention allowed more than half of the participants to change their diets.
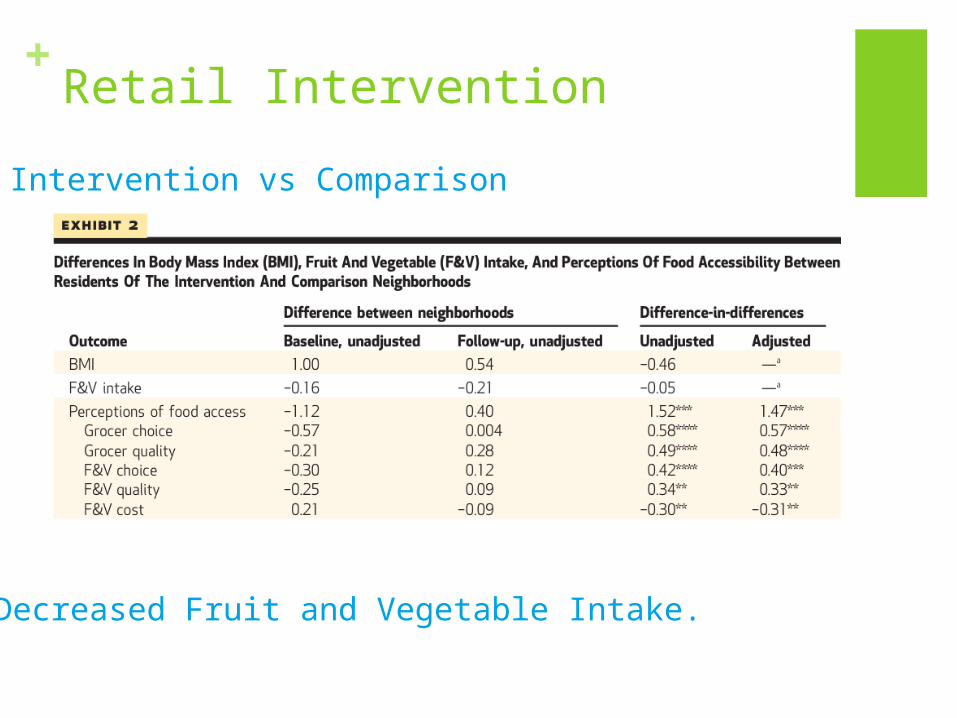
+Retail InterventionIntervention vs Comparison
Decreased Fruit and Vegetable Intake.
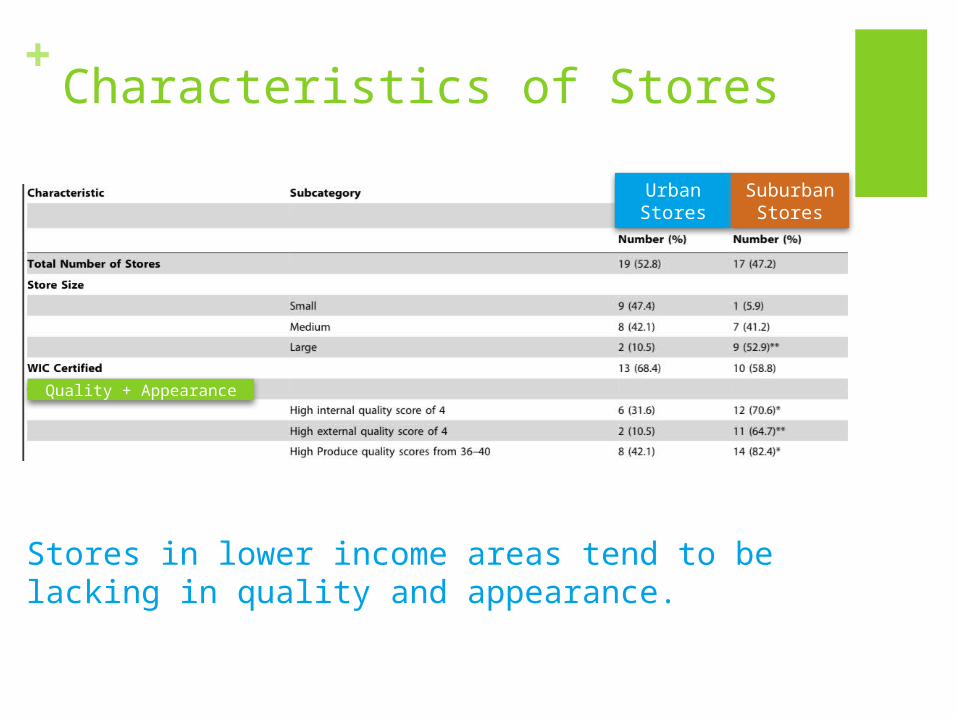
+Characteristics of Stores
Quality + Appearance
Urban Stores
SuburbanStores
Stores in lower income areas tend to be lacking in quality and appearance.
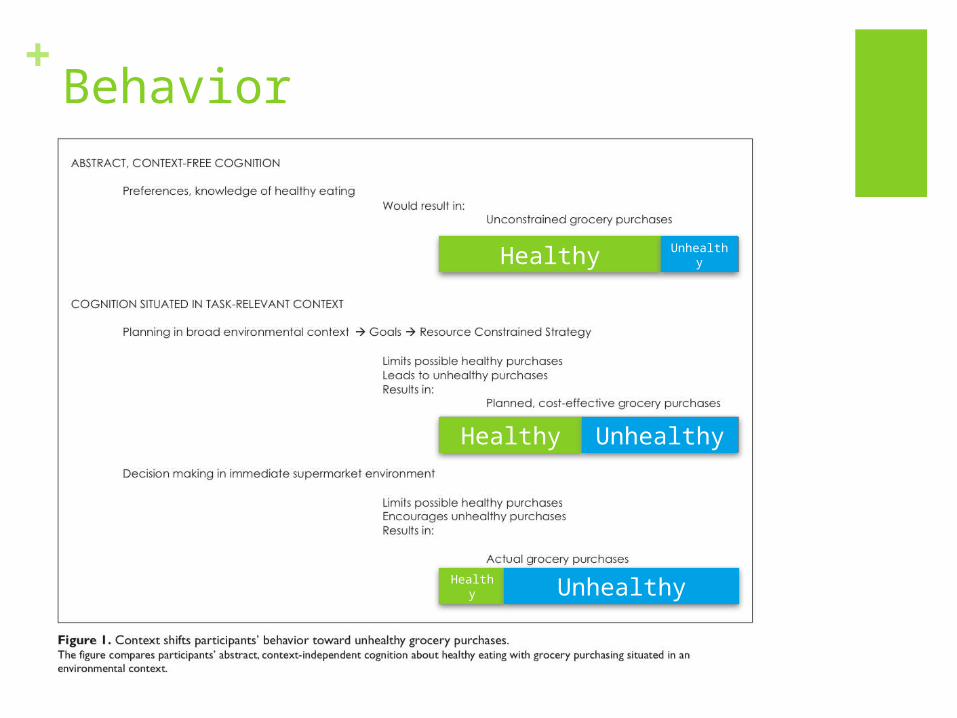
+Behavior
Healthy Unhealthy
Healthy Unhealthy
Healthy Unhealthy