focus on: coventry - 2018 - content.knightfrank.com · residential research affordability...
TRANSCRIPT
RESIDENTIAL RESEARCH
AFFORDABILITY DEVELOPMENT PIPELINE INFRASTRUCTURE UPGRADES
FOCUS ON: COVENTRY 2018
2
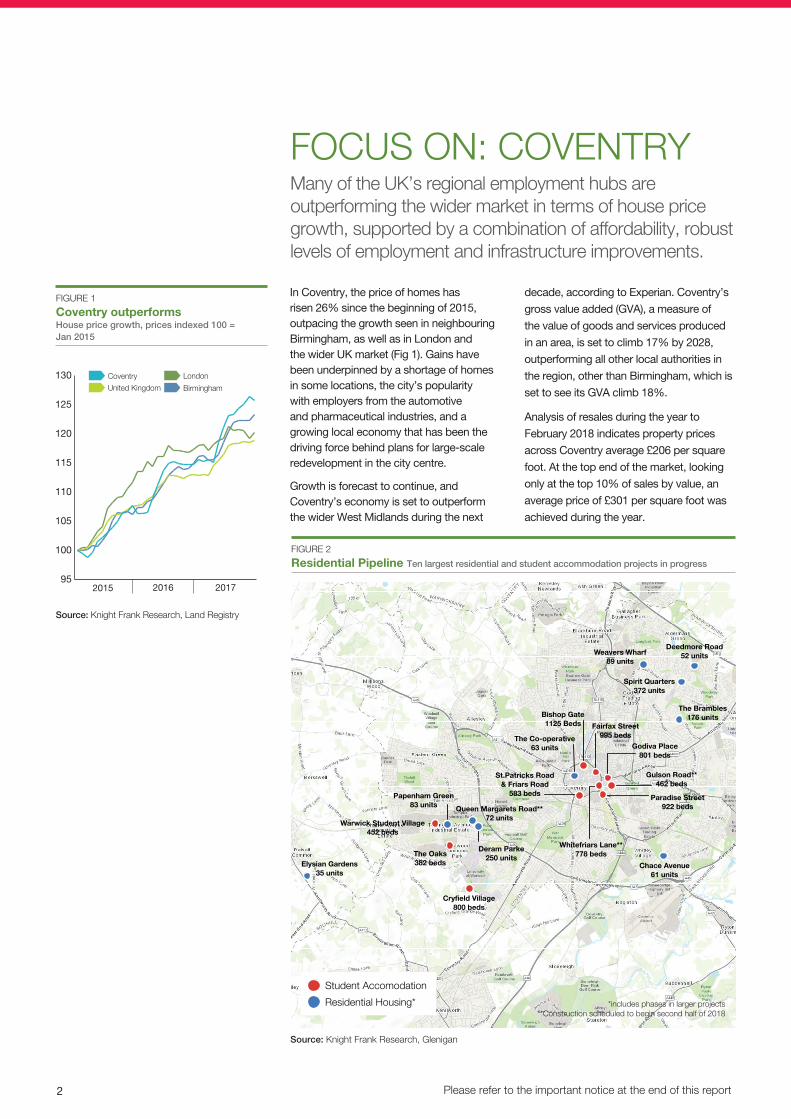
In Coventry, the price of homes has risen 26% since the beginning of 2015, outpacing the growth seen in neighbouring Birmingham, as well as in London and the wider UK market (Fig 1). Gains have been underpinned by a shortage of homes in some locations, the city’s popularity with employers from the automotive and pharmaceutical industries, and a growing local economy that has been the driving force behind plans for large-scale redevelopment in the city centre.
Growth is forecast to continue, and Coventry’s economy is set to outperform the wider West Midlands during the next
decade, according to Experian. Coventry’s
gross value added (GVA), a measure of
the value of goods and services produced
in an area, is set to climb 17% by 2028,
outperforming all other local authorities in
the region, other than Birmingham, which is
set to see its GVA climb 18%.
Analysis of resales during the year to
February 2018 indicates property prices
across Coventry average £206 per square
foot. At the top end of the market, looking
only at the top 10% of sales by value, an
average price of £301 per square foot was
achieved during the year.
FOCUS ON: COVENTRYMany of the UK’s regional employment hubs are outperforming the wider market in terms of house price growth, supported by a combination of affordability, robust levels of employment and infrastructure improvements.
Please refer to the important notice at the end of this report
Gulson Road**462 beds
Deram Parke250 units
Godiva Place801 beds
Chace Avenue61 units
The Brambles176 units
Deedmore Road52 unitsWeavers Wharf
89 units
Papenham Green83 units
Elysian Gardens35 units
Cryfield Village800 beds
St.Patricks Road& Friars Road
583 beds
The Co-operative63 units
Warwick Student Village452 beds
Queen Margarets Road**72 units
Whitefriars Lane**778 beds
Spirit Quarters372 units
Paradise Street922 beds
Fairfax Street995 beds
Bishop Gate1125 Beds
The Oaks382 beds
Student Accomodation Residential Housing*
95
100
105
110
115
120
125
130
201720162015
United Kingdom
Coventry London
Birmingham
Source: Knight Frank Research, Glenigan
FIGURE 2
Residential Pipeline Ten largest residential and student accommodation projects in progress
Source: Knight Frank Research, Land Registry
FIGURE 1
Coventry outperforms House price growth, prices indexed 100 = Jan 2015
FOCUS ON: COVENTRY
*includes phases in larger projects **Construction scheduled to begin second half of 2018
3
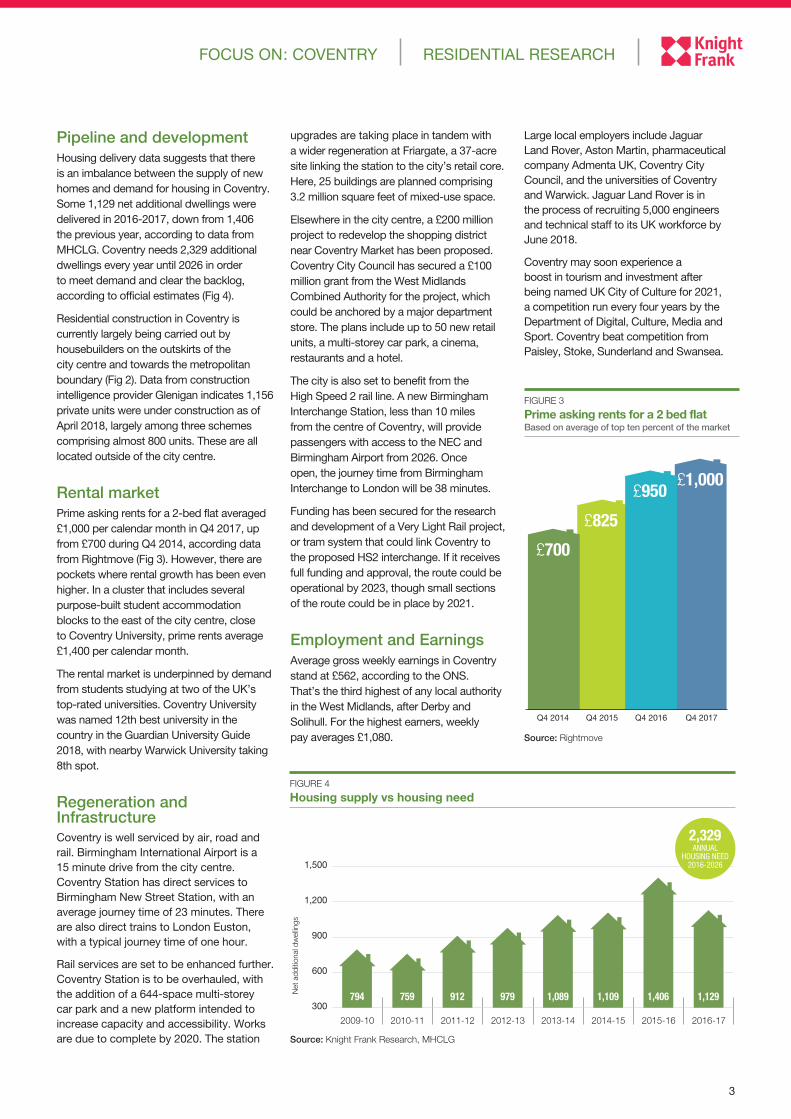
Pipeline and developmentHousing delivery data suggests that there is an imbalance between the supply of new homes and demand for housing in Coventry. Some 1,129 net additional dwellings were delivered in 2016-2017, down from 1,406 the previous year, according to data from MHCLG. Coventry needs 2,329 additional dwellings every year until 2026 in order to meet demand and clear the backlog, according to official estimates (Fig 4).
Residential construction in Coventry is currently largely being carried out by housebuilders on the outskirts of the city centre and towards the metropolitan boundary (Fig 2). Data from construction intelligence provider Glenigan indicates 1,156 private units were under construction as of April 2018, largely among three schemes comprising almost 800 units. These are all located outside of the city centre.
Rental marketPrime asking rents for a 2-bed flat averaged £1,000 per calendar month in Q4 2017, up from £700 during Q4 2014, according data from Rightmove (Fig 3). However, there are pockets where rental growth has been even higher. In a cluster that includes several purpose-built student accommodation blocks to the east of the city centre, close to Coventry University, prime rents average £1,400 per calendar month.
The rental market is underpinned by demand from students studying at two of the UK’s top-rated universities. Coventry University was named 12th best university in the country in the Guardian University Guide 2018, with nearby Warwick University taking 8th spot.
Regeneration and InfrastructureCoventry is well serviced by air, road and rail. Birmingham International Airport is a 15 minute drive from the city centre. Coventry Station has direct services to Birmingham New Street Station, with an average journey time of 23 minutes. There are also direct trains to London Euston, with a typical journey time of one hour.
Rail services are set to be enhanced further. Coventry Station is to be overhauled, with the addition of a 644-space multi-storey car park and a new platform intended to increase capacity and accessibility. Works are due to complete by 2020. The station
Source: Rightmove
FIGURE 3
Prime asking rents for a 2 bed flat Based on average of top ten percent of the market
Q4 2017Q4 2016Q4 2015Q4 2014
£700
£825
£950£1,000
300
600
900
1,200
1,500
2016-172015-162014-152013-142012-132011-122010-112009-10
794 759 912 979 1,089 1,109 1,406 1,129Net
add
ition
al d
wel
lings
2,329ANNUAL
HOUSING NEED2016-2026
Source: Knight Frank Research, MHCLG
FIGURE 4
Housing supply vs housing need
FOCUS ON: COVENTRY RESIDENTIAL RESEARCH
upgrades are taking place in tandem with a wider regeneration at Friargate, a 37-acre site linking the station to the city’s retail core. Here, 25 buildings are planned comprising 3.2 million square feet of mixed-use space.
Elsewhere in the city centre, a £200 million project to redevelop the shopping district near Coventry Market has been proposed. Coventry City Council has secured a £100 million grant from the West Midlands Combined Authority for the project, which could be anchored by a major department store. The plans include up to 50 new retail units, a multi-storey car park, a cinema, restaurants and a hotel.
The city is also set to benefit from the High Speed 2 rail line. A new Birmingham Interchange Station, less than 10 miles from the centre of Coventry, will provide passengers with access to the NEC and Birmingham Airport from 2026. Once open, the journey time from Birmingham Interchange to London will be 38 minutes.
Funding has been secured for the research and development of a Very Light Rail project, or tram system that could link Coventry to the proposed HS2 interchange. If it receives full funding and approval, the route could be operational by 2023, though small sections of the route could be in place by 2021.
Employment and EarningsAverage gross weekly earnings in Coventry stand at £562, according to the ONS. That’s the third highest of any local authority in the West Midlands, after Derby and Solihull. For the highest earners, weekly pay averages £1,080.
Large local employers include Jaguar Land Rover, Aston Martin, pharmaceutical company Admenta UK, Coventry City Council, and the universities of Coventry and Warwick. Jaguar Land Rover is in the process of recruiting 5,000 engineers and technical staff to its UK workforce by June 2018.
Coventry may soon experience a boost in tourism and investment after being named UK City of Culture for 2021, a competition run every four years by the Department of Digital, Culture, Media and Sport. Coventry beat competition from Paisley, Stoke, Sunderland and Swansea.
RECENT MARKET-LEADING RESEARCH PUBLICATIONS
Important Notice
© Knight Frank LLP 2018 – This report is published for general information only and not to be relied upon in any way. Although high standards have been used in the preparation of the information, analysis, views and projections presented in this report, no responsibility or liability whatsoever can be accepted by Knight Frank LLP for any loss or damage resultant from any use of, reliance on or reference to the contents of this document. As a general report, this material does not necessarily represent the view of Knight Frank LLP in relation to particular properties or projects. Reproduction of this report in whole or in part is not allowed without prior written approval of Knight Frank LLP to the form and content within which it appears. Knight Frank LLP is a limited liability partnership registered in England with registered number OC305934. Our registered office is 55 Baker Street, London, W1U 8AN, where you may look at a list of members’ names.
For the latest news, views and analysison the world of prime property, visit
KnightFrank.com/blog
KNIGHT FRANKINTELLIGENCE
FOR ANY RESEARCH ENQUIRIES:
Patrick Gower Associate +44 20 3640 7015 [email protected]
FOR RESIDENTIAL DEVELOPMENT ENQUIRIES:
Will Jordan Partner +44 121 233 6413 [email protected]
Jonathan Wish Associate +44 178 920 6963 [email protected]
Knight Frank Research provides strategic advice, consultancy services and forecasting to a wide range of clients worldwide including developers, investors, funding organisations, corporate institutions and the public sector. All our clients recognise the need for expert independent advice customised to their specific needs.
Knight Frank Research Reports are available at KnightFrank.com/Research
Front cover image: Shutterstock
RESIDENTIAL RESEARCH
UK RESIDENTIAL MARKET FORECAST
“ The market is localised and we see slightly stronger growth in the Midlands, East of England and the North West, a continuation of the trend that has emerged this year.”
For the latest news, views and analysis on the world of prime property, visit our blog or @kfintelligence
UK HOUSE PRICE FORECASTUK house price growth has moderated from recent peaks, although markets remain highly localised.
Headlines Dec 2017UK house price growth has been slowing since the summer of 2014, although the annual change remains positive
Price growth across the UK is expected to be 1.0% in 2018, reaching 14.2% cumulatively between 2018 and 2022
In London, prices are forecast to fall by 0.5% in 2018, but cumulative price growth over the next five years is positive at 13.1%
2017-2022 Forecasts, December 2017
2017 2018 2019 2020 2021 2022 2018 - 2022Mainstream residential sales markets
UK 1.5% 1.0% 2.0% 3.0% 3.5% 4.0% 14.2%
London -1.0% -0.5% 2.5% 3.0% 3.5% 4.0% 13.1%
North East 2.0% 2.0% 2.0% 4.0% 3.0% 3.0% 14.8%
North West 2.0% 1.0% 2.0% 4.0% 4.0% 4.5% 16.4%
Yorks & Humber 0.5% 1.0% 2.0% 3.0% 3.0% 3.0% 12.6%
East Midlands 4.5% 2.0% 2.5% 2.5% 3.0% 3.5% 14.2%
West Midlands 4.5% 2.0% 2.0% 3.0% 3.0% 4.0% 14.8%
East 1.0% 2.0% 3.0% 3.0% 4.0% 3.0% 15.9%
South East 3.0% 0.0% 2.0% 3.0% 4.0% 4.5% 14.2%
South West 4.0% 1.0% 2.0% 2.5% 3.5% 4.5% 14.2%
Wales 1.5% 1.5% 1.5% 2.5% 3.0% 4.0% 13.1%
Scotland 1.5% 1.0% 1.0% 2.5% 3.5% 3.5% 12.0%
Prime residential sales markets
Prime central London east 0.0% 0.5% 1.5% 2.5% 3.0% 5.0% 13.1%
Prime central London west 0.0% 0.5% 1.5% 3.5% 3.0% 3.5% 12.6%
Prime outer London -1.0% 0.0% 1.0% 3.0% 3.5% 4.5% 12.5%
Prime England & Wales 0.7% 1.5% 2.0% 2.0% 2.0% 2.0% 9.9%
Residential rental markets
UK 1.2% 2.5% 2.5% 2.5% 3.0% 3.0% 14.0%
London 0.7% 3.0% 2.5% 3.0% 3.0% 3.0% 15.0%
Prime central London -1.5% 0.5% 1.5% 2.5% 3.0% 3.0% 11.0%
Prime outer London -3.5% -1.0% 1.0% 2.0% 2.5% 3.0% 8.0%
The momentum in house price growth is slowing in many parts of the country, and we expect price rises to remain muted overall next year amid increased economic and political uncertainty in the run-up to Brexit and amid more muted forecasts for wage growth. The market is localised and we see slightly stronger growth in the Midlands, East of England and the North West, a continuation of the trend that has emerged this year.
Once the Brexit deal is completed, we forecast rising momentum across the market, with price growth reflecting this in many locations. The variations currently
Source: Knight Frank Research NB. Price forecasts are for existing homes. Property values in the new-build market may perform differently.
observed in the prime housing markets in London and beyond are set to continue, and we explore this more fully in our blog.
The UK may now be entering a period of interest rate rises, but even so, we expect rates to be low compared to long-term norms by the end of the forecast period. While development levels are rising across the country, the shortage of new homes is unlikely to be fully reversed in the coming years, and that will underpin pricing.
On the other hand, factors such as deepening affordability pressures and property taxes, will continue to weigh on pricing.
Methodology Statement: House price forecasts are based upon time series regression analysis of relevant statistically significant macro-economic variables adjusted in-house to encompass externalities such as likely risk factors. The forecast uses the Nationwide House Price Index as a base. Our forecasts assume a Brexit deal, but with a two year transitional period.
LOOKING TO THE FUTURE: CROSSRAIL 2
DEVELOPMENT PIPELINE
HOW HAVE PRICES PERFORMED?
CROSSRAILANALYSING PROPERTY MARKET PERFORMANCE ALONG THE ELIZABETH LINE 2017
RESIDENTIAL RESEARCH
Knight Frank The Birmingham Report
1
THE
REPORT LONDON DEVELOPMENT HOTSPOTSRESIDENTIAL DEVELOPMENT OPPORTUNITY AREAS 2018
RESIDENTIAL RESEARCH
AREAS TO WATCH PRICE FORECASTS MARKET UPDATE
London Development Hotspots 2018
UK Housing Market Forecast - Dec 2017
Crossrail 2017
The Birmingham Report 2017
UK Retirement Housing Market Update Q1 2018
UK Student Property Report Q1 2018
SUPPLY AND DEMAND FUNDING MODELS POLICY FOCUS
RESIDENTIAL RESEARCH
RETIREMENT HOUSING MARKET UPDATE Q1 2018
UK STUDENT HOUSING UPDATE
Student property investment totalled £4bn in 2017, up 25% on the previous year. This strong performance looks set to continue in 2018, despite the current uncertainty surrounding Brexit. The enduring strength and quality of the UK’s Higher Education sector remains the key driver.
January deadline data from UCAS reinforces this view. Despite a slight drop in total applicant numbers, down 0.9% compared with 2017/18, which reflects the smaller cohort of those turning 18 over the last year, a record 36% of A-level students across the UK applied for higher education courses in 2018.
Applications from international students also increased, bucking the downward trend seen in 2017 when uncertainty surrounding the UK’s future relationship
with Europe contributed to a decline in applications from within the EU, although the numbers coming to UK universities remained high due to above-average acceptance rates.
In the 2018/19 cycle, applications from within the EU were 3.4% higher year-on-year, with an 11.1% increase in applications from non-EU applicants. Overall, applications from outside of the UK increased by 7.6%, highlighting the enduring popularity of the UK as a place to study and live.
The number of students accepting places at UK institutions has increased over the long-term. In 2017/18, over 200,000 18-year olds and 70,000 students from outside the UK accepted places, the highest on record.
SEARCH FOR QUALITY UNDERPINS APPLICATION NUMBERSDemand for UK Higher Education remains strong despite uncertainty over EU funding and the inclusion of international students in government migration targets.
Key factsTotal applicant numbers for UK higher education courses for the 2018/19 cycle fell by 0.9% year-on-year, according to UCAS data
However, a record 36% of A-level students across the UK applied for courses in 2018
Applications from within the EU were 3.4% higher year-on-year, with an 11.1% increase in applications from non-EU applicants
The number of 18-year olds in the UK is projected to increase by 103,000 between 2021 and 2025, underpinning future demand
PBSA represents around 30% of full-time first-year undergraduate housing choices, up from 22% five years ago
JAMES PULLAN Head of Student Property
“ Demand for Higher Education in the UK remains strong. Universities that are perceived to offer the highest quality courses in locations offering the best overall student experience will increasingly attract higher levels of students.”
Source: Knight Frank Research / UCAS
FIGURE 1
University applicants by domicile Indexed 100 = 2009/10, full year (data for 2018 at January deadline)
FIGURE 2
Applications by university tariff band Indexed 100 = 2009/10, full year (data for 2018 at January deadline)
Source: Knight Frank Research / UCAS
80
100
120
140
160
180
200
220
2018
/19
2017
/18
2016
/17
2015
/16
2014
/15
2013
/14
2012
/13
2011
/12
2010
/11
2009
/10
UK EU (excluding UK)
Non-EU Total
80
90
100
110
120
130
2018
/19
2017
/18
2016
/17
2015
/16
2014
/15
2013
/14
2012
/13
Lower tariff Medium tariff
Higher tariff All
The UK Tenant Survey 2017
Development Land Index - Q1 2018
TENANT SURVEY 2017: RESULTS INVESTOR INTENTIONSSECTOR UPDATE
MULTIHOUSING 2017 PRS RESEARCH
RESIDENTIAL RESEARCH
RESIDENTIAL DEVELOPMENT LAND INDEX
Average greenfield land values in England climbed 0.9% during Q1 2018, aided by demand for oven-ready sites with access to infrastructure. This took the annual change to 2.2%, down from 2.6% in the year to Q4 2017.
Uncertainty over the future of Britain’s relationship with the European Union is likely to weigh on future growth in values, with house builders taking an increasingly selective approach when bidding for land as they adjust to perceived risk in the market.
The Help to Buy Equity Loan scheme has continued to contribute to sales rates, though developers are now embarking on projects due to complete after 2021 – when the scheme is currently stated to end. Uncertainty over the future of the policy is likely to be reflected on English greenfield land values in the coming quarters, coupled with house builders factoring into their margins the unclear economic picture ahead.
Growth in urban brownfield land values moderated during the quarter, climbing 0.4%. This follows a strong final quarter of 2017, when values rose 4.9%, amid positive sentiment and robust employment growth in the UK’s major cities – particularly in Birmingham. Values have climbed 6.4% during the past twelve months.
Those fundamentals that underpinned demand in Q4 remain unchanged. However, long-term affordability pressures are limiting what customers can pay for homes, which is in turn limiting what developers are willing to pay for land.
Development land prices in prime central London remained unchanged during Q1 2018, taking the annual change to -2.1%.
Though trading volumes remain lower than in previous years, a number of large sites have been put on the market following the Christmas lull, which should provide a strong indication of the strength of the market, and whether larger developers are re-committing to Zones 1&2.
The GLA affordable housing policy – allowing developers to fast-track through the process if they hit a threshold of 35% Affordable Housing, or 50% on public land – is being digested by the market and should provide a much need boost to Affordable Housing in the capital. The spread of prices paid for land sold with planning, compared to land sold without, has widened as developers weigh up risk in a new planning environment.
We anticipate prime central London development land values will remain stable moving forward.
ENGLISH GREENFIELD LAND EDGES UP IN Q1 2018 The value of English greenfield land climbed 0.9% between January and March, while land values in prime central London remained unchanged. The average value of urban brownfield land edged up by 0.4%.
Key Facts Q1 2018 English greenfield land values climbed 0.9% during Q1 2018, taking the annual change to 2.2%
Urban brownfield land values rose 0.4%, taking the annual change to 6.4%
Land values in prime central London remained unchanged, taking the annual decline to 2.1%
PATRICK GOWER Associate, Residential Research
Follow Patrick at @patrickgower
For the latest news, views and analysis on the world of prime property, visit our blog or follow @KFIntelligence
-12.5%
-10.0%
-7.5%
-5.0%
-2.5%
0.0%
2.5%
5.0%
7.5%
10.0%
12.5%
15.0%
Jan-
18
Oct
-17
Jul-1
7
Apr
-17
Jan-
17
Oct
-16
Jul-1
6
Apr
-16
Jan-
16
Prime Central London English Greenfield
Urban Brownfield
Source: Knight Frank Research
FIGURE 2
Annual change in average land values
Source: Knight Frank Research
FIGURE 1
Residential development land prices
90
100
110
120
130
140
150
Jan-
18
Jul-1
7
Jan-
17
Jul-1
6
Jan-
16
Jul-1
5
Jan-
15
Jul-1
4
Jan-
14
Jul-1
3
Jan-
13
Jul-1
2
Jan-
12
Jul-1
1
Ind
ex
Prime Central London English Greenfield
Urban Brownfield
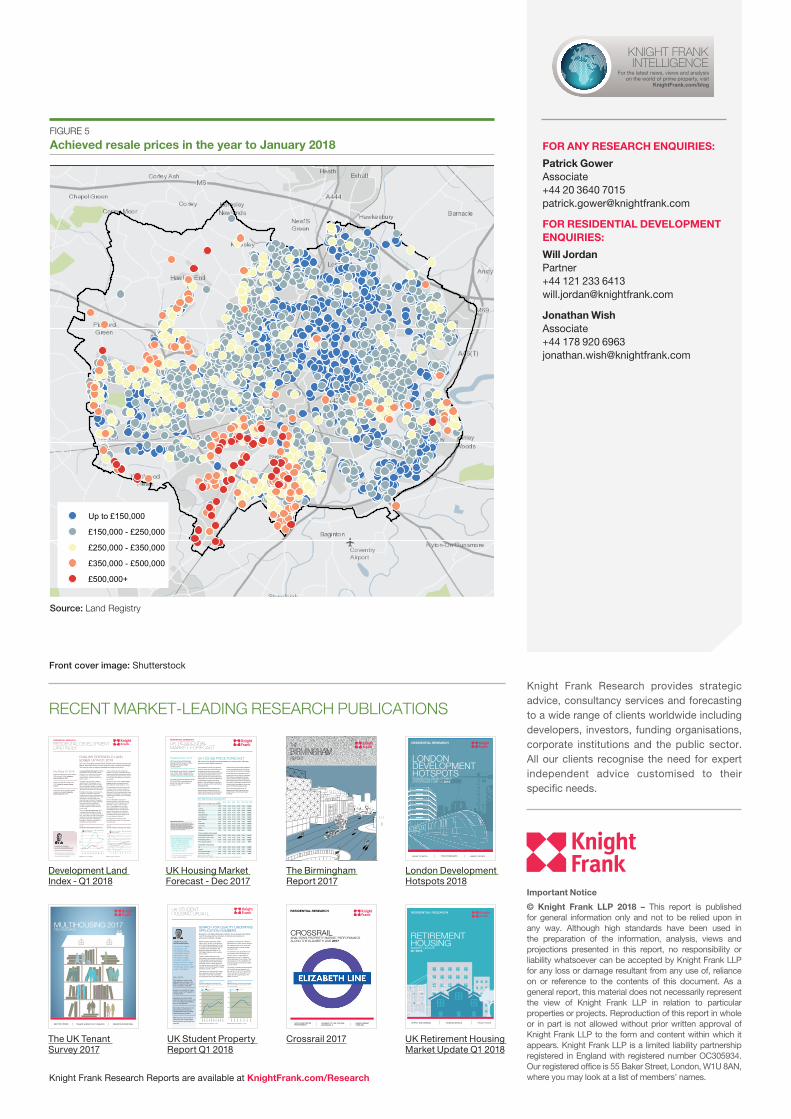
Contains OS data © Crown Copyright and database right 2017 Source: Land Registry
FIGURE 5
Achieved resale prices in the year to January 2018
£150,000Up to
£150,000 - £250,000
£250,000 - £350,000
£350,000 - £500,000
£500,000+