fmc technologies overview fourth quarter 2016 -...
TRANSCRIPT
FMC Technologies Overview
Fourth Quarter 2016
Director, Investor Relations
Matt Seinsheimer
+1 281.260.3665
1
This presentation contains “forward-looking statements” intended to qualify for the safe harbors from liability established by
the Private Securities Litigation Reform Act of 1995. All statements other than statements of historical fact contained in this
report are forward-looking statements within the meaning of Section 21E of the Securities Exchange Act of 1934, as amended
(the “Exchange Act”). Forward-looking statements usually relate to future events and anticipated revenues, earnings, cash
flows or other aspects of our operations or operating results. Forward-looking statements are often identified by the words
“believe,” “expect,” “anticipate,” “plan,” “intend,” “foresee,” “should,” “would,” “could,” “may,” “estimate,” “outlook” and similar
expressions, including the negative thereof. The absence of these words, however, does not mean that the statements are
not forward-looking. These forward-looking statements are based on our current expectations, beliefs and assumptions
concerning future developments and business conditions and their potential effect on us. While management believes that
these forward-looking statements are reasonable as and when made, there can be no assurance that future developments
affecting us will be those that we anticipate.
All of our forward-looking statements involve risks and uncertainties (some of which are significant or beyond our control) and
assumptions that could cause actual results to differ materially from our historical experience and our present expectations or
projections. Known material factors that could cause actual results to differ materially from those contemplated in forward-
looking statements include those described in Part I, Item 1A “Risk Factors” of our Annual Report on Form 10-K and in our
Quarterly Reports on Form 10-Q. We wish to caution you not to place undue reliance on any forward-looking statements,
which speak only as of the date hereof. We undertake no obligation to publicly update or revise any of our forward-looking
statements after the date they are made, whether as a result of new information, future events or otherwise, except to the
extent required by law.
2
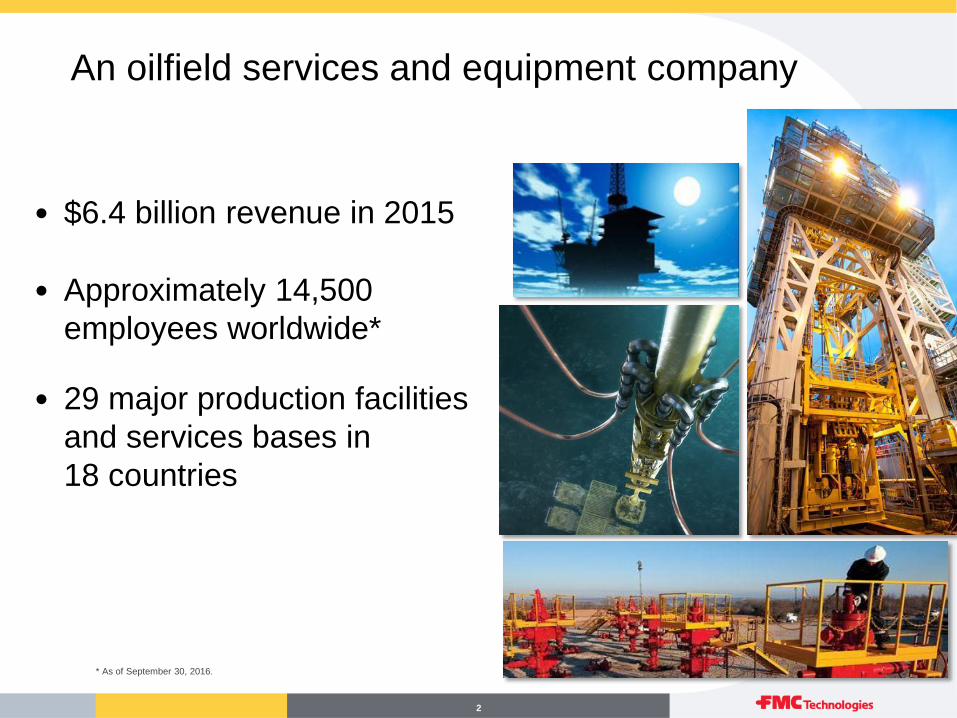
* As of September 30, 2016.
An oilfield services and equipment company
• $6.4 billion revenue in 2015
• Approximately 14,500
employees worldwide*
• 29 major production facilities
and services bases in
18 countries
3
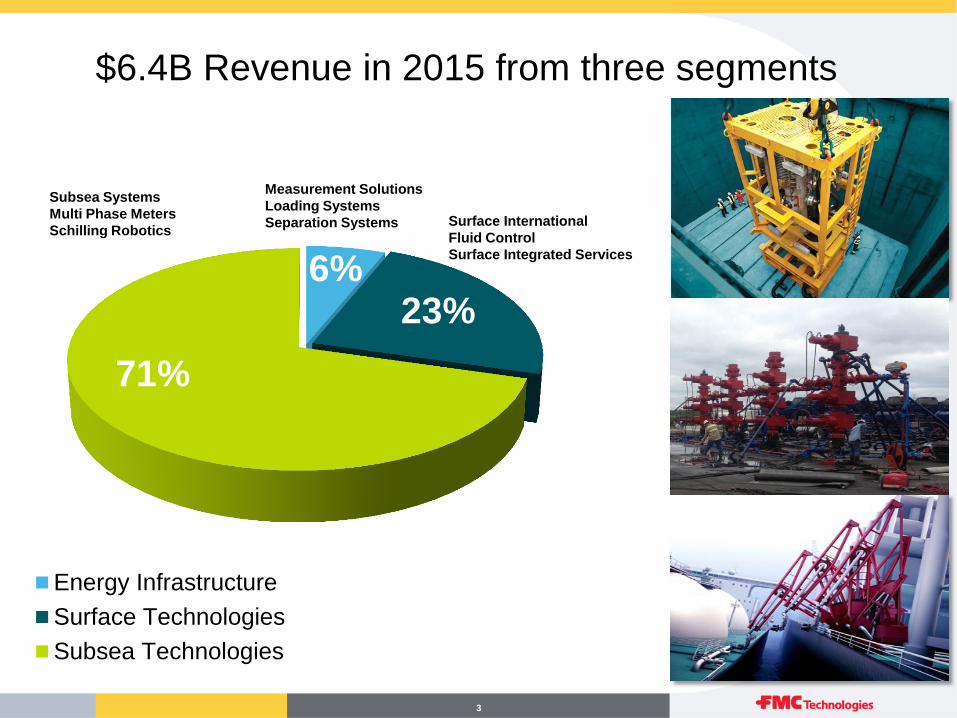
$6.4B Revenue in 2015 from three segments
6% 23%
71%
Energy Infrastructure
Surface Technologies
Subsea Technologies
Surface International
Fluid Control
Surface Integrated Services
Measurement Solutions
Loading Systems
Separation Systems
Subsea Systems
Multi Phase Meters
Schilling Robotics
4
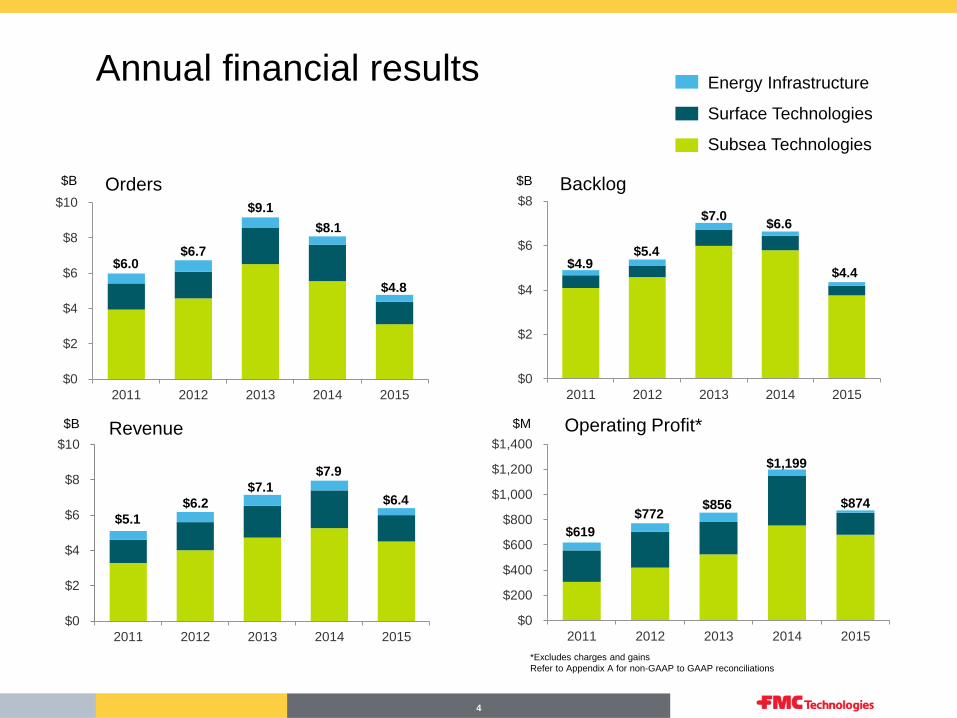
$0
$2
$4
$6
$8
2011 2012 2013 2014 2015
$B Backlog
$4.9 $5.4
$6.6 $7.0
$0
$200
$400
$600
$800
$1,000
$1,200
$1,400
2011 2012 2013 2014 2015
$856
$0
$2
$4
$6
$8
$10
2011 2012 2013 2014 2015
$6.4
Annual financial results
$B $M Operating Profit*
$619
$874 $772
Revenue
$7.1
$6.2
$0
$2
$4
$6
$8
$10
2011 2012 2013 2014 2015
$B Orders
$6.7 $6.0
$8.1
$9.1
$5.1
$4.8 $4.4
$7.9 $1,199
Energy Infrastructure
Surface Technologies
Subsea Technologies
*Excludes charges and gains
Refer to Appendix A for non-GAAP to GAAP reconciliations
5
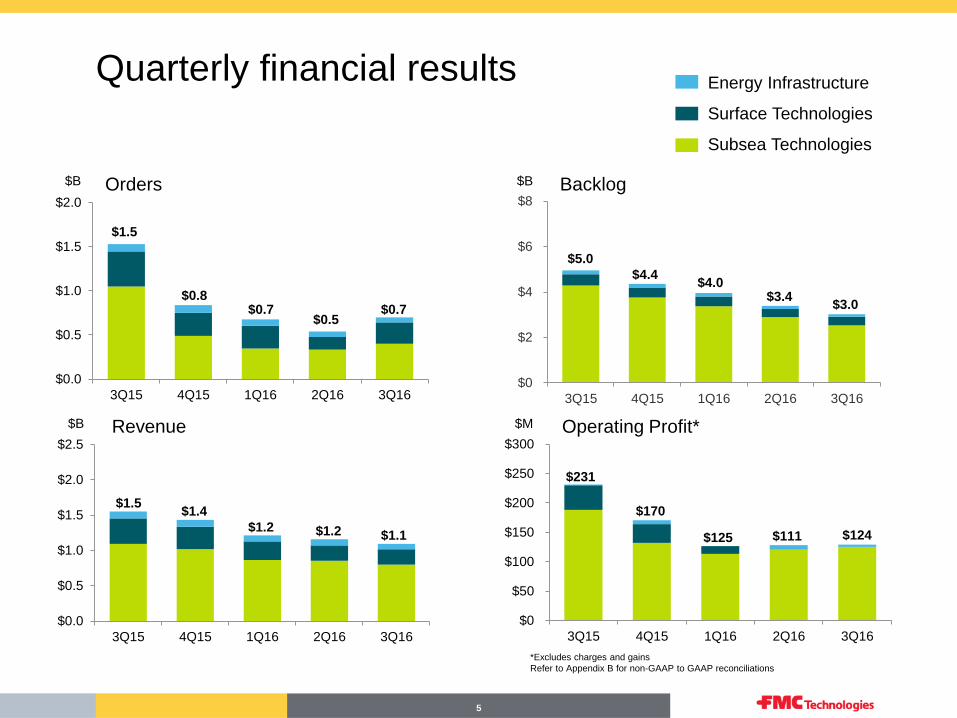
$0
$2
$4
$6
$8
3Q15 4Q15 1Q16 2Q16 3Q16
$B Backlog
$5.0
$4.4
$3.4 $4.0
$0
$50
$100
$150
$200
$250
$300
3Q15 4Q15 1Q16 2Q16 3Q16
$125
$0.0
$0.5
$1.0
$1.5
$2.0
$2.5
3Q15 4Q15 1Q16 2Q16 3Q16
$1.1
Quarterly financial results
$B $M Operating Profit*
$231
$124
$170
Revenue
$1.2
$1.4
$0.0
$0.5
$1.0
$1.5
$2.0
3Q15 4Q15 1Q16 2Q16 3Q16
$B Orders
$0.8
$1.5
$0.5 $0.7
$1.5
$0.7 $3.0
$1.2 $111
Energy Infrastructure
Surface Technologies
Subsea Technologies
*Excludes charges and gains
Refer to Appendix B for non-GAAP to GAAP reconciliations
6
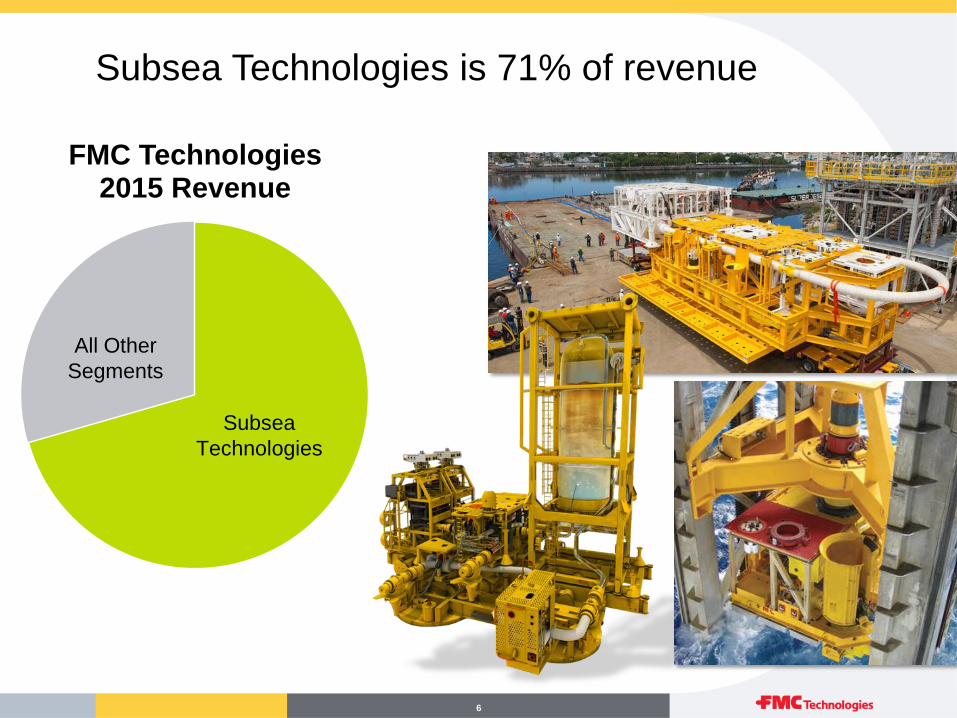
Subsea Technologies is 71% of revenue
FMC Technologies 2015 Revenue
All Other
Segments
Subsea
Technologies
7
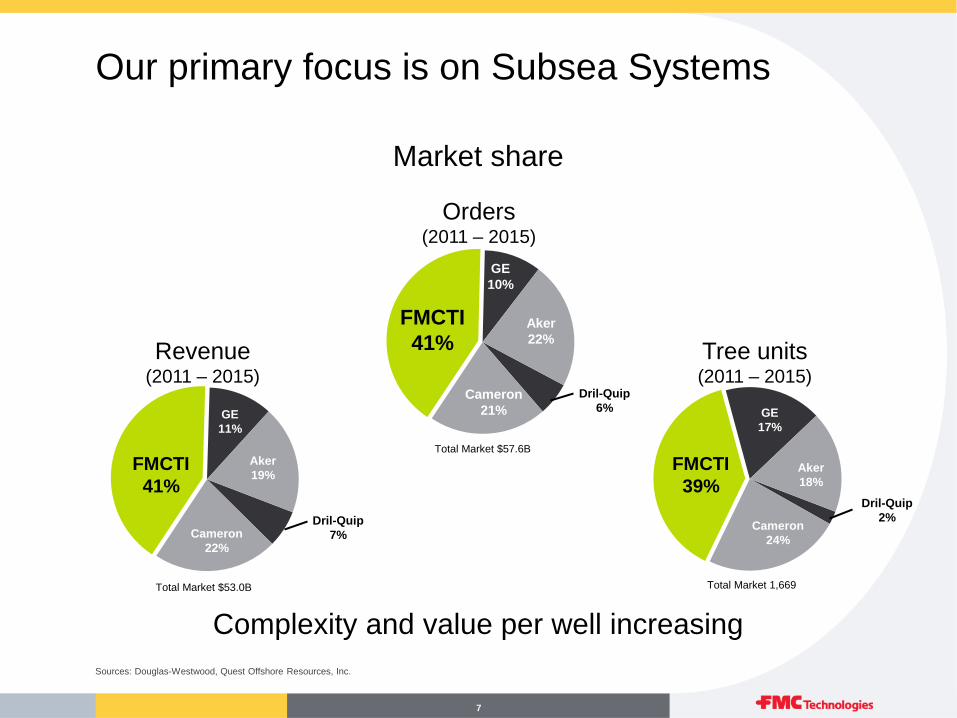
Our primary focus is on Subsea Systems
Complexity and value per well increasing
Market share
Sources: Douglas-Westwood, Quest Offshore Resources, Inc.
Revenue (2011 – 2015)
Tree units (2011 – 2015)
GE
11%
Aker
19%
Cameron
22%
FMCTI
41%
GE
17%
Aker
18%
Cameron
24%
FMCTI
39% Dril-Quip
2%
Orders (2011 – 2015)
GE
10%
Aker
22%
Cameron
21%
FMCTI
41%
Total Market $57.6B
Total Market 1,669 Total Market $53.0B
Dril-Quip
6%
Dril-Quip
7%
8
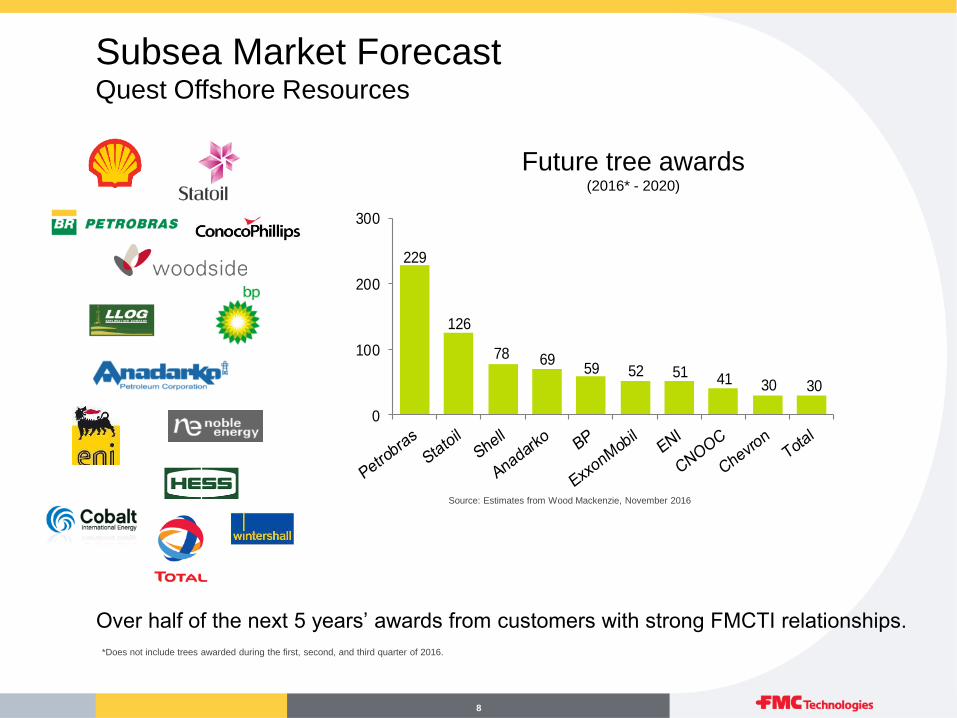
Subsea Market Forecast Quest Offshore Resources
229
126
78 6959 52 51 41 30 30
0
100
200
300
Future tree awards (2016* - 2020)
Over half of the next 5 years’ awards from customers with strong FMCTI relationships.
Source: Estimates from Wood Mackenzie, November 2016
*Does not include trees awarded during the first, second, and third quarter of 2016.
9
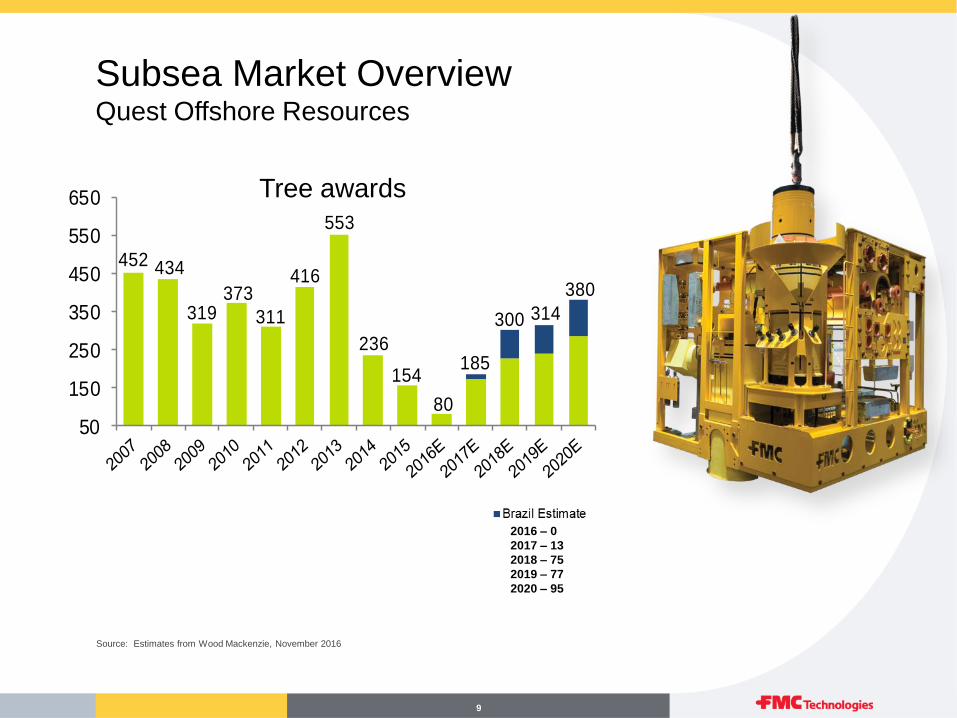
Subsea Market Overview Quest Offshore Resources
Tree awards
452 434
319373
311
416
553
236
154
80
185
300 314
380
50
150
250
350
450
550
650
Source: Estimates from Wood Mackenzie, November 2016
2016 – 0
2017 – 13
2018 – 75
2019 – 77
2020 – 95
10
Partners
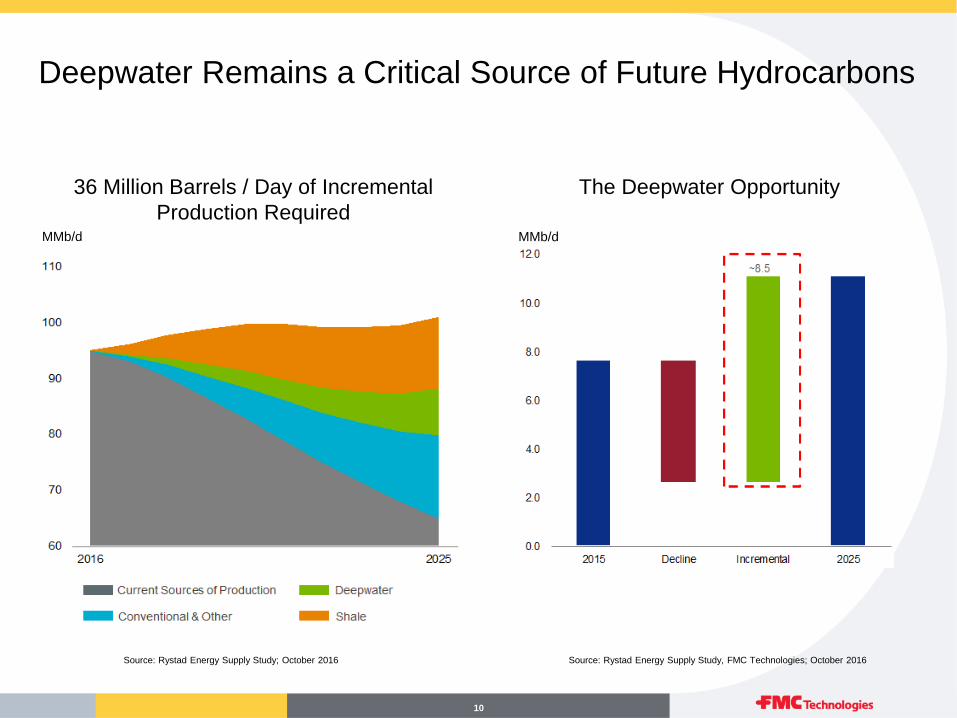
Deepwater Remains a Critical Source of Future Hydrocarbons
Source: Rystad Energy Supply Study; October 2016
36 Million Barrels / Day of Incremental
Production Required
Source: Rystad Energy Supply Study, FMC Technologies; October 2016
The Deepwater Opportunity
MMb/d MMb/d
11
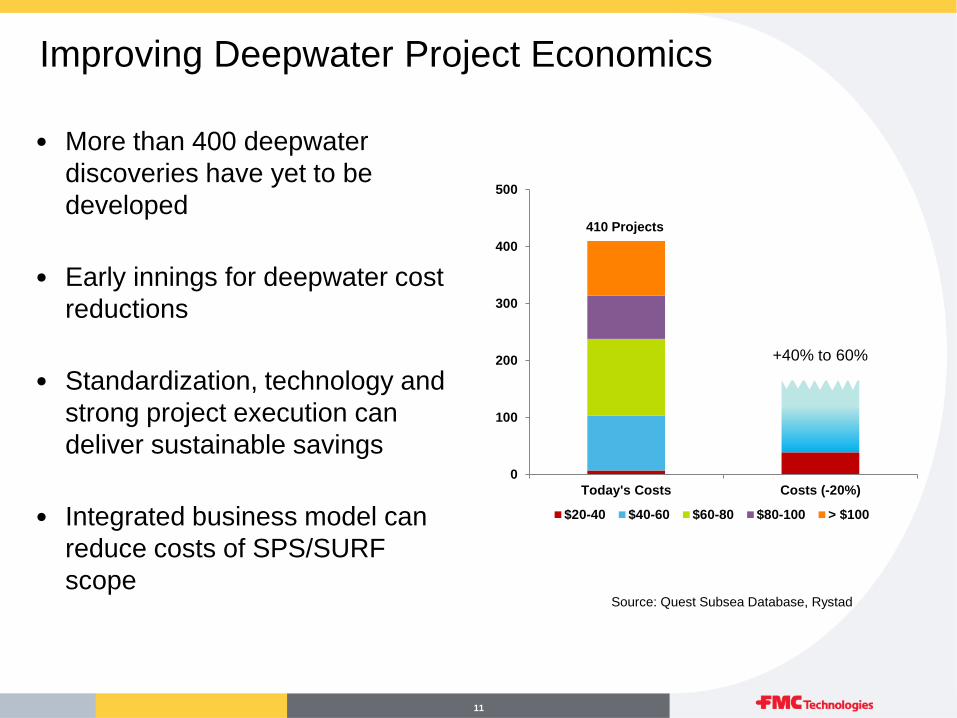
0
100
200
300
400
500
Today's Costs Costs (-20%)
$20-40 $40-60 $60-80 $80-100 > $100
Improving Deepwater Project Economics
• More than 400 deepwater
discoveries have yet to be
developed
• Early innings for deepwater cost
reductions
• Standardization, technology and
strong project execution can
deliver sustainable savings
• Integrated business model can
reduce costs of SPS/SURF
scope
Source: Quest Subsea Database, Rystad
410 Projects
+40% to 60%
12
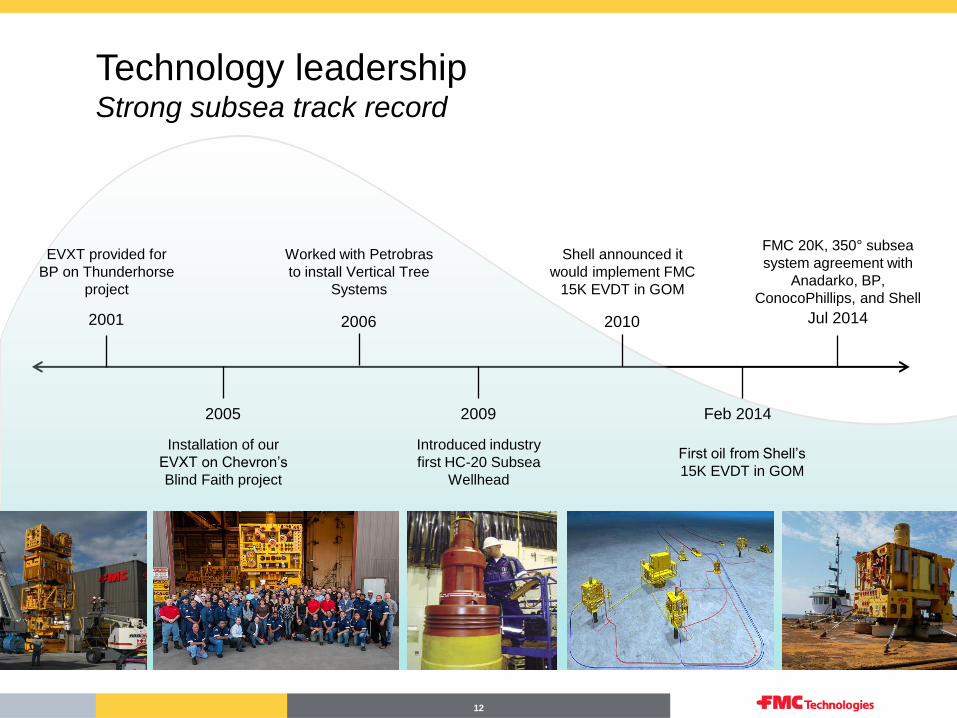
Technology leadership Strong subsea track record
2001 2006
2005
2010
2009
Jul 2014
Feb 2014
EVXT provided for
BP on Thunderhorse
project
Installation of our
EVXT on Chevron’s
Blind Faith project
Worked with Petrobras
to install Vertical Tree
Systems
Introduced industry
first HC-20 Subsea
Wellhead
Shell announced it
would implement FMC
15K EVDT in GOM
First oil from Shell’s
15K EVDT in GOM
FMC 20K, 350° subsea
system agreement with
Anadarko, BP,
ConocoPhillips, and Shell
13
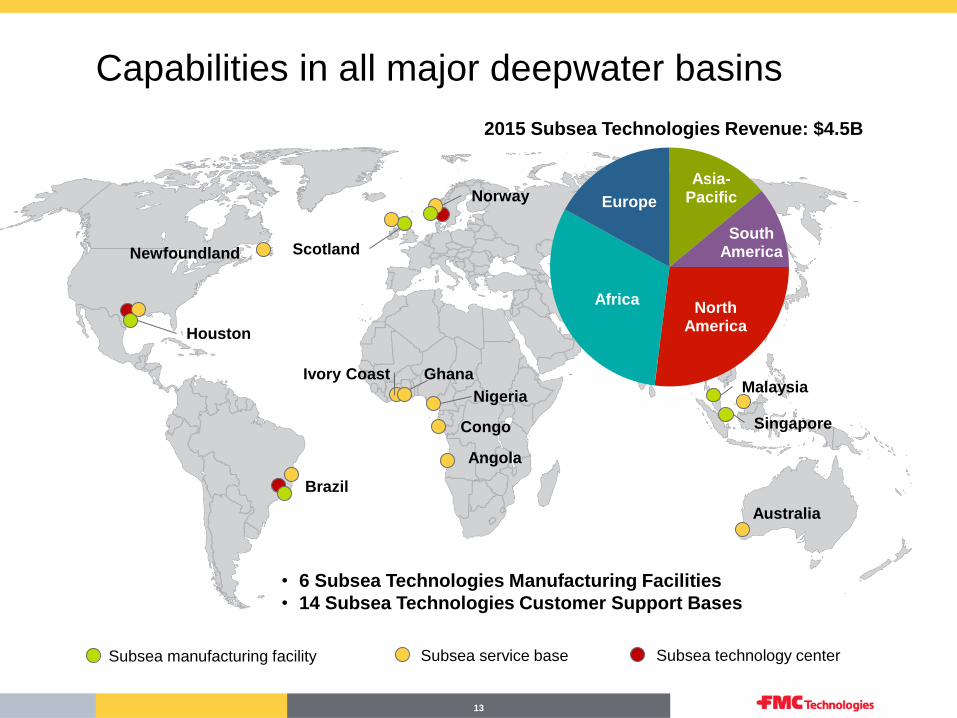
Subsea manufacturing facility Subsea service base Subsea technology center
Capabilities in all major deepwater basins
• 6 Subsea Technologies Manufacturing Facilities
• 14 Subsea Technologies Customer Support Bases
2015 Subsea Technologies Revenue: $4.5B
Norway
Scotland
Nigeria
Angola
Australia
Brazil
Houston
Malaysia
Singapore
Ivory Coast Ghana
Congo
Newfoundland
Asia-Pacific
South America
North America
Africa
Europe
14
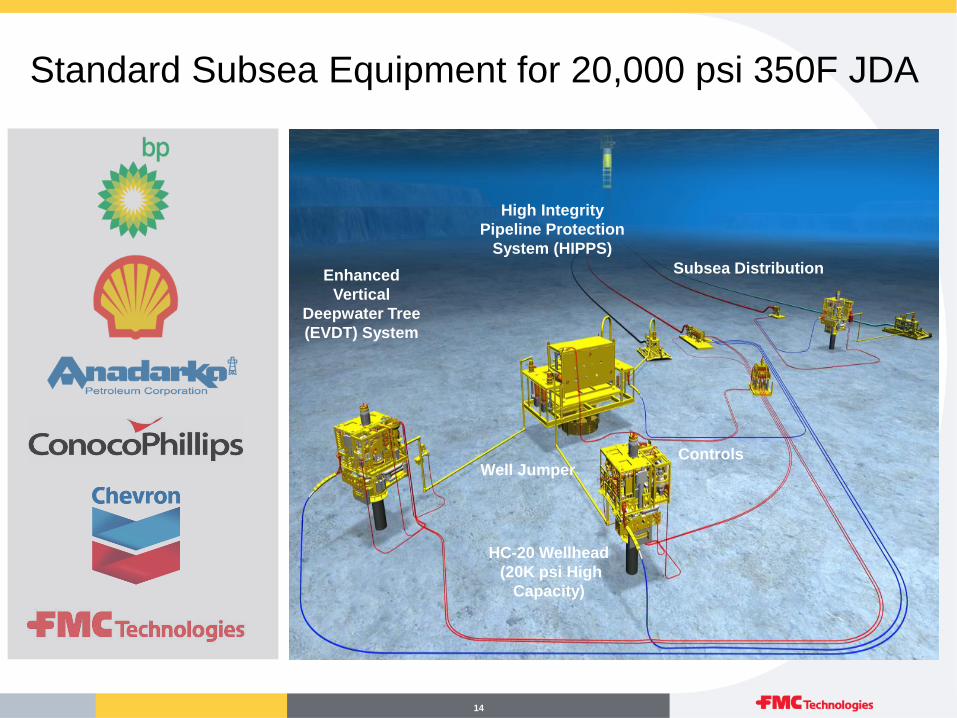
Standard Subsea Equipment for 20,000 psi 350F JDA
Enhanced
Vertical
Deepwater Tree
(EVDT) System
HC-20 Wellhead
(20K psi High
Capacity)
High Integrity
Pipeline Protection
System (HIPPS)
Subsea Distribution
Controls Well Jumper
Partners Equipment Scope
15
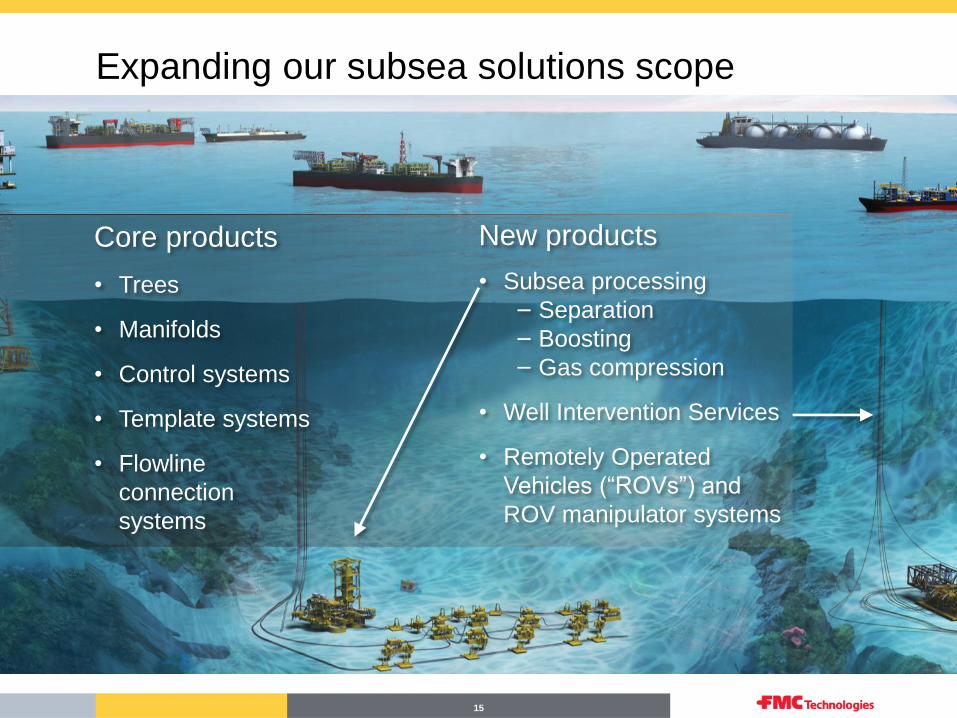
Expanding our subsea solutions scope
Core products
• Trees
• Manifolds
• Control systems
• Template systems
• Flowline
connection
systems
New products
• Subsea processing
− Separation
− Boosting
− Gas compression
• Well Intervention Services
• Remotely Operated
Vehicles (“ROVs”) and
ROV manipulator systems
16
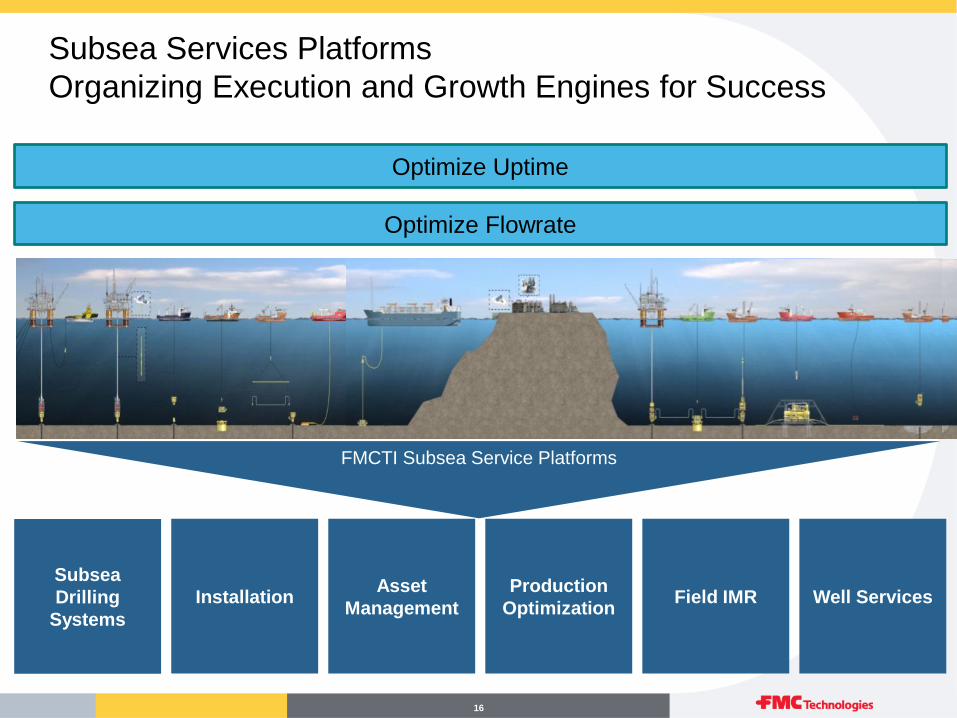
Subsea Services Platforms
Organizing Execution and Growth Engines for Success
FMCTI Subsea Service Platforms
Installation
Subsea
Drilling
Systems
Asset
Management
Production
Optimization Field IMR Well Services
Optimize Uptime
Optimize Flowrate
17
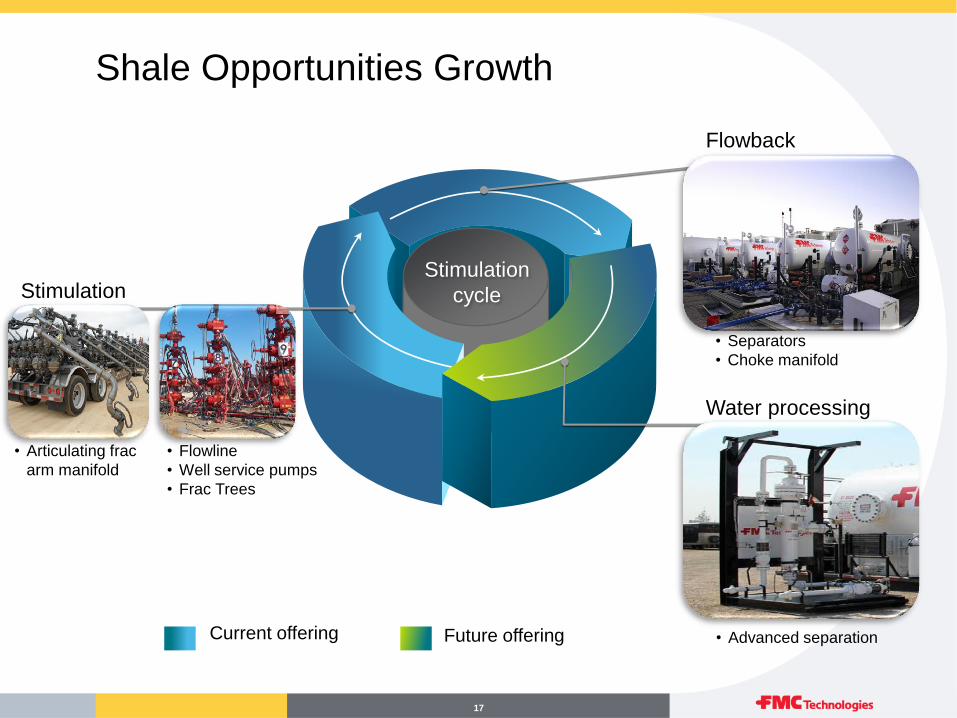
Stimulation
cycle
Current offering
Flowback
Future offering
• Separators
• Choke manifold
• Flowline
• Well service pumps
• Frac Trees
Stimulation
• Articulating frac
arm manifold
Water processing
• Advanced separation
Shale Opportunities Growth
18
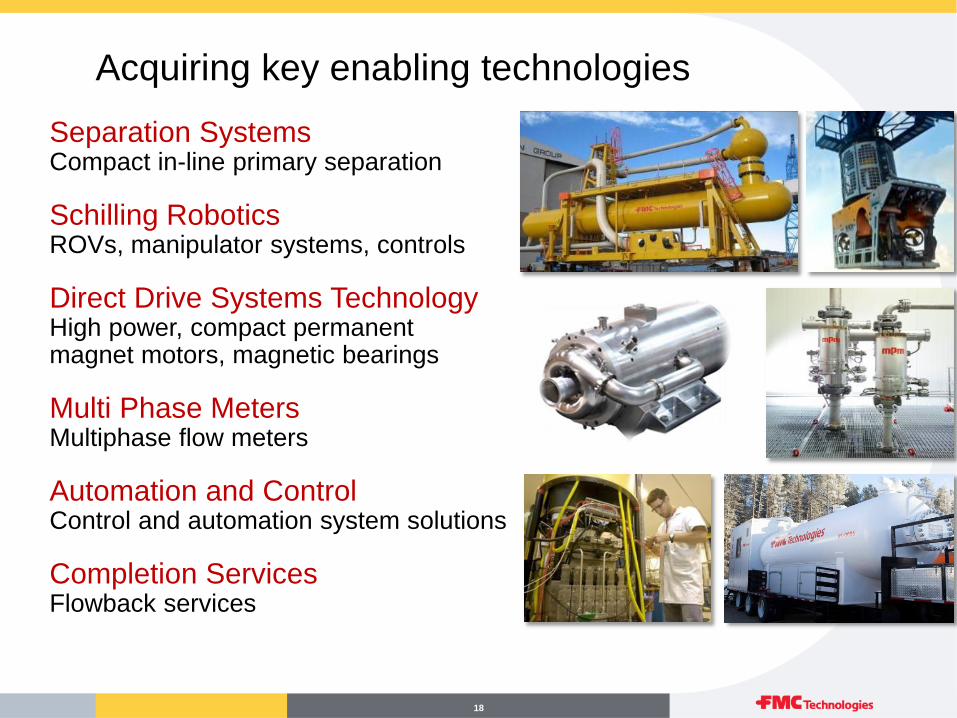
Acquiring key enabling technologies
Separation Systems Compact in-line primary separation
Schilling Robotics ROVs, manipulator systems, controls
Direct Drive Systems Technology High power, compact permanent magnet motors, magnetic bearings
Multi Phase Meters Multiphase flow meters
Automation and Control Control and automation system solutions
Completion Services Flowback services
19
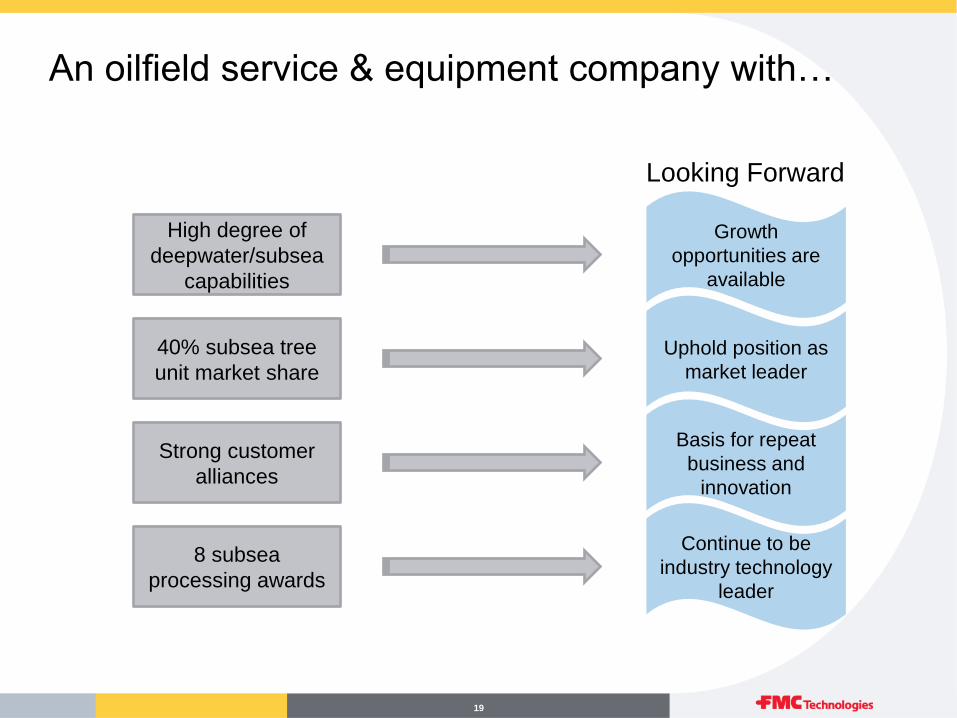
An oilfield service & equipment company with…
Looking Forward
High degree of
deepwater/subsea
capabilities
40% subsea tree
unit market share
Strong customer
alliances
8 subsea
processing awards
Growth
opportunities are
available
Uphold position as
market leader
Basis for repeat
business and
innovation
Continue to be
industry technology
leader
20
www.fmctechnologies.com
21
Appendix A
Subsea
Technologies
Surface
Technologies
Energy
Infrastructure
Subsea
Technologies
Surface
Technologies
Energy
Infrastructure
Subsea
Technologies
Surface
Technologies
Energy
Infrastructure
Subsea
Technologies
Surface
Technologies
Energy
Infrastructure
Subsea
Technologies
Surface
Technologies
Energy
Infrastructure
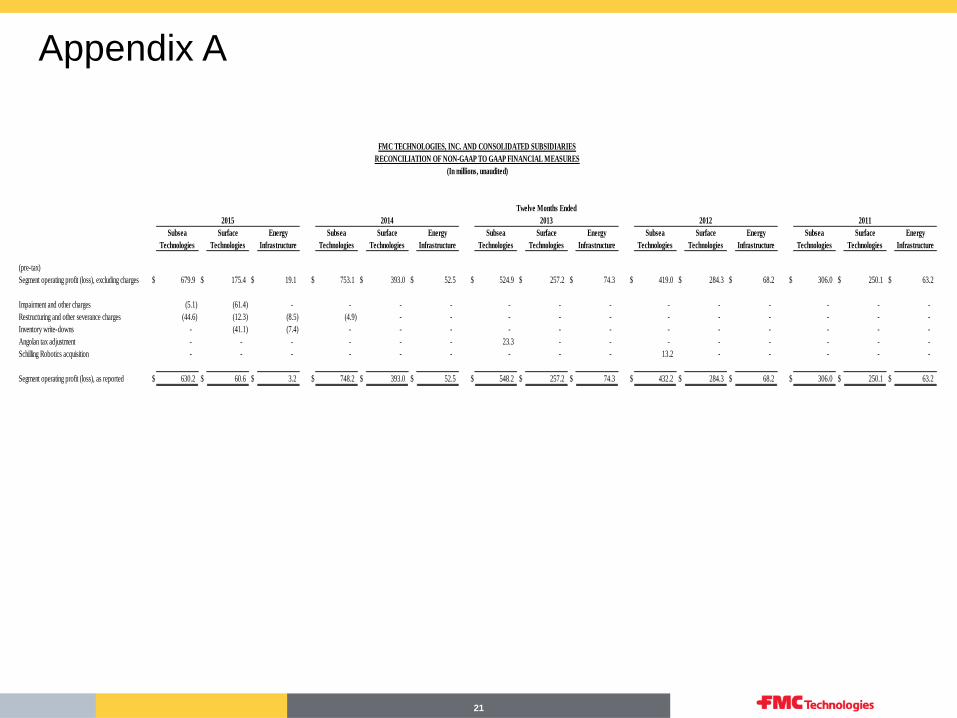
(pre-tax)
Segment operating profit (loss), excluding charges $ 679.9 $ 175.4 $ 19.1 $ 753.1 $ 393.0 $ 52.5 $ 524.9 $ 257.2 $ 74.3 $ 419.0 $ 284.3 $ 68.2 $ 306.0 $ 250.1 $ 63.2
Impairment and other charges (5.1) (61.4) - - - - - - - - - - - - -
Restructuring and other severance charges (44.6) (12.3) (8.5) (4.9) - - - - - - - - - - -
Inventory write-downs - (41.1) (7.4) - - - - - - - - - - - -
Angolan tax adjustment - - - - - - 23.3 - - - - - - - -
Schilling Robotics acquisition - - - - - - - - - 13.2 - - - - -
Segment operating profit (loss), as reported $ 630.2 $ 60.6 $ 3.2 $ 748.2 $ 393.0 $ 52.5 $ 548.2 $ 257.2 $ 74.3 $ 432.2 $ 284.3 $ 68.2 $ 306.0 $ 250.1 $ 63.2
FMC TECHNOLOGIES, INC. AND CONSOLIDATED SUBSIDIARIES
RECONCILIATION OF NON-GAAP TO GAAP FINANCIAL MEASURES
(In millions, unaudited)
Twelve Months Ended
2015 2014 2013 2012 2011
22
Appendix B
Subsea
Technologies
Surface
Technologies
Energy
Infrastructure
Subsea
Technologies
Surface
Technologies
Energy
Infrastructure
Subsea
Technologies
Surface
Technologies
Energy
Infrastructure
Subsea
Technologies
Surface
Technologies
Energy
Infrastructure
Subsea
Technologies
Surface
Technologies
Energy
Infrastructure
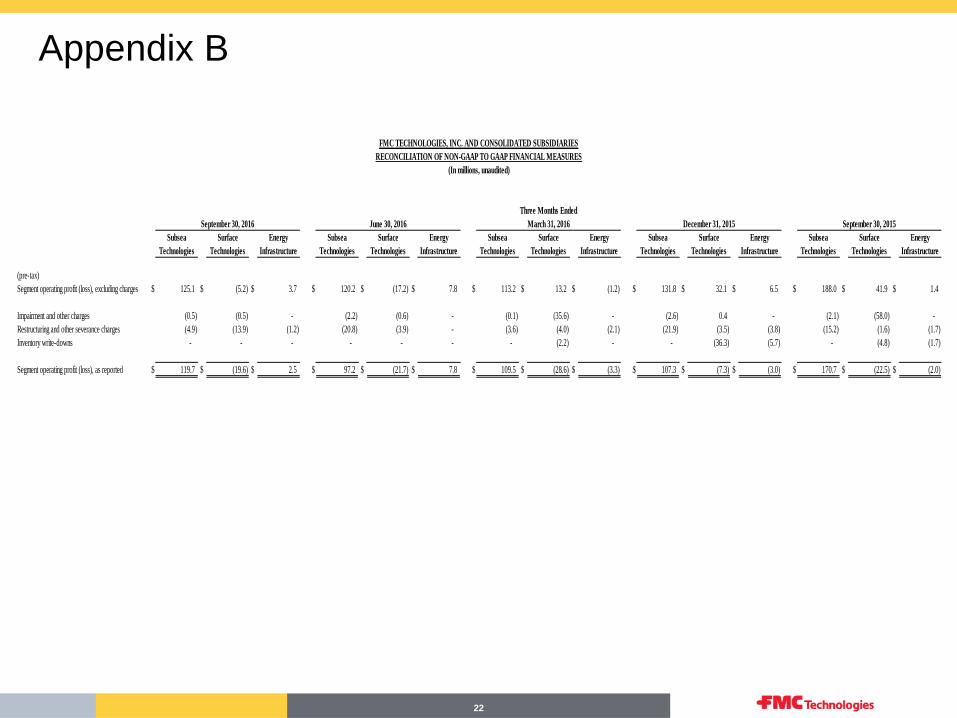
(pre-tax)
Segment operating profit (loss), excluding charges $ 125.1 $ (5.2) $ 3.7 $ 120.2 $ (17.2) $ 7.8 $ 113.2 $ 13.2 $ (1.2) $ 131.8 $ 32.1 $ 6.5 $ 188.0 $ 41.9 $ 1.4
Impairment and other charges (0.5) (0.5) - (2.2) (0.6) - (0.1) (35.6) - (2.6) 0.4 - (2.1) (58.0) -
Restructuring and other severance charges (4.9) (13.9) (1.2) (20.8) (3.9) - (3.6) (4.0) (2.1) (21.9) (3.5) (3.8) (15.2) (1.6) (1.7)
Inventory write-downs - - - - - - - (2.2) - - (36.3) (5.7) - (4.8) (1.7)
Segment operating profit (loss), as reported $ 119.7 $ (19.6) $ 2.5 $ 97.2 $ (21.7) $ 7.8 $ 109.5 $ (28.6) $ (3.3) $ 107.3 $ (7.3) $ (3.0) $ 170.7 $ (22.5) $ (2.0)
June 30, 2016 March 31, 2016 December 31, 2015 September 30, 2015September 30, 2016
Three Months Ended
(In millions, unaudited)
RECONCILIATION OF NON-GAAP TO GAAP FINANCIAL MEASURES
FMC TECHNOLOGIES, INC. AND CONSOLIDATED SUBSIDIARIES