flowcomag april 1{2, 2004 sfb 609
TRANSCRIPT

FLOWCOMAG
April 1–2, 2004
SFB 609
Seawater Flow Transition and Separation Control
Tom Weier, Thomas Albrecht, Gerd Mutschke, Gunter Gerbeth

Wall–parallel Lorentz force
NS
SN
NS
SN a
+ +z
xy
∞U
LSN S
N− + −
3
410
10
10
10
2
1F [N/m ]3
j = σ(E + u×B)
F = j×B = Fex
F =π
8j0M0e
−πay
Gailitis, Lielausis 1961
u?∂u?
∂x? + v?∂u?
∂y? = ∂2u?
∂y?2+ Ze−y
?
x? = νπ2xU∞a2, y
? = πay, u
? = uU∞, v
? = vaπν
Z = j0M0a2
8πρU∞ν = 1 : uU∞ = 1− e−πay

Laminar Boundary Layer with Lorentz force Reδ1 = 290
0
5
10
15
20
25
30
35
40
10.5010.5010.5010.50
y/m
m
u/U∞
x=0mm
x*=0
x=150mm
x*=0.18
x=350mm
x*=0.43
x=550mm
x*=0.68
Z=0Z=1.2exp. profileBlasius profile

Transition: T–S waves for Reδ1 = 585, a = 3.475δ1
0
0.1
0.2
0.3
0.4
0.5
0.6
0.7
0 100 200 300 400 500 600 700
u(y
=δ 1
)/U
∞
x/δ1
Z=0, no TSZ=0, TSZ=1, x= 5Z=1, x=300
0
0.1
0.2
0.3
0.4
0.5
0.6
0.7
0 100 200 300 400 500 600 700
u(y
=δ 1
)/U
∞
x/δ1
Z00.050.10.20.40.8
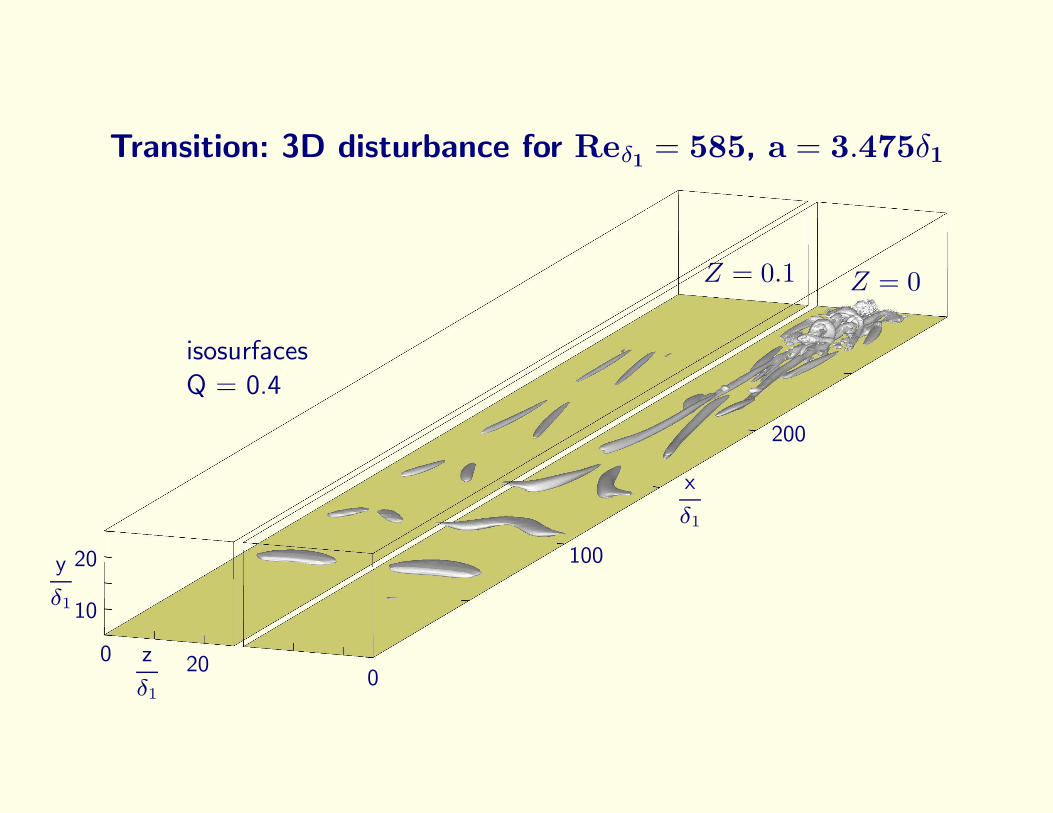
Transition: 3D disturbance for Reδ1 = 585, a = 3.475δ1
z
δ1
0 20
10
20y
δ1
0
100
200
x
δ1
isosurfacesQ = 0.4
Z = 0Z = 0.1

Separation suppression at an inclined flat plate

Hydrofoils with electrodes and magnets
NACA 0015 (left):c = 0.667ma/c = 0.015B0 = 0.58Tstainless steel electrodes
PTL IV (right):c = 0.158ma/c = 0.03B0 = 0.2TTi with RuO2/IrO2
(DSA)

NACA 0015 in parallel flow
CµEMHD = aj0B02ρU2∞
· xe−xsc
-0.1
0
0.1
0.2
0.3
0.4
0.5
0.6
0 0.05 0.1 0.15 0.2 0.25 0.3 0.35 0.4 0.45
CL
Cµ EMHD
Re=1.16·105
Re=1.82·105
Re=3.08·105
Re=3.71·105
CL = 0.843 · C0.521µEMHD
-0.4
-0.35
-0.3
-0.25
-0.2
-0.15
-0.1
-0.05
0
0.05
0 0.05 0.1 0.15 0.2 0.25 0.3 0.35 0.4 0.45
CD
Cµ EMHD
Re=1.16·105
Re=1.82·105
Re=3.08·105
Re=3.71·105
CD = 0.024− 1.01 · CµEMHD

Reattachment: Comparison to steady blowing
0
0.2
0.4
0.6
0.8
1
1.2
0 0.02 0.04 0.06 0.08 0.1
∆CL
CµEMHD
Re=3.4 ·104
Re=4.8 ·104
Re=5.8 ·104
PTL IVα=17° BLC
Circulation Control
0
0.5
1
1.5
2
0 0.05 0.1 0.15 0.2
∆CL
Cµ
0.35% c0.42% c0.45% c0.61% c

Maximum lift gain
0
0.5
1
2
0 5 10 15 20 25 35
CCL
Lmax
α[°]
Cµ EMHD =0Cµ EMHD =0.045
5Re=3.0·10 ∆NACA 0015
∆CLmax(Cµ, Re) = CLmax(Cµ, Re)− CLmax(Cµ = 0, Re)

Maximum lift gain versus CµEMHD
∆CLmax = 3.02 · C0.585µEMHD
0.01
0.1
1
10
0.001 0.01 0.1 1
∆CLm
ax
CµEMHD
PTL IV a/c=0.06PTL IV a/c=0.03NACA 0015 a/c=0.015Numerics

Oscillatory forces: Motivation
0.5
1
1.5
2
3
−10 −5 0 5 10 20
CL
α [°]
baselineF+=0 Cµ=1%F+=1.75 C’µ=0.015%
Darabi, A.Wygnanski, I.1996
Seifert, A.

Lorentz force configurations compared
stationary:
U∞
xs
xe
CµEMHD =1
2· aj0B0
ρU2∞· xe − xs
c
oscillatory:
F+ =fec
U∞
U∞
xs xe
C ′µeff =1
2· aj0effB0
ρU2∞· xe − xs
c

,

NACA 0015 in the test section
c = 160 mms = 240 mmxa = 15 mma = 5 mmB0 = 0.33 T

Lift- and drag coefficient versus excitation frequency,
α = 20◦, Re = 5.2 · 104
0.6
0.7
0.8
0.9
1
1.1
1.2
0 2 4 6 8 10
CL
F+
c’µeff
0.28%
0.56%
0.83%
1.11%
0.26
0.3
0.34
0.38
0.42
0.46
0 2 4 6 8 10
CD
F+

Comparison to oscillatory blowing on a NACA 0015
0
0.2
0.4
0.6
0.8
1
1.2
1.4
0 5 10 15 20 25
CL
α / o
c’µeff
Re=5.2·104, F+=0.5
0
0.06%
0.28%
0.56%
0.84%
1.11%
0
0.2
0.4
0.6
0.8
1
1.2
1.4
0 5 10 15 20C
L
α / o
c’µeff
Greenblatt, D.Wygnanski, I.2000Re=1.5·105, F+=1.1
00.1%1.3%

Lift increase at constant angle of attack
−0.2
−0.1
0
0.1
0.2
0.3
0.4
0.5
0 0.2 0.4 0.6 0.8 1 1.2 1.4 1.6 1.8 2
∆CL
CµEMHD/[%]
F+=1
Re=5·104
α=17°
stationary forcingperiodic excitation

Maximum lift gain
PSfrag replacements
CL
α
max ∆CL
∆CLmax
∆CLcirc-0.05
0
0.05
0.1
0.15
0.2
0.25
0.3
0.35
0 0.2 0.4 0.6 0.8 1 1.2
∆CLm
ax
c’µeff/%
NACA 0012, Re=2.4·105, F+=1.5Greenblatt, D., Wygnanski, I. 2000

Conclusions
Transition delay:
• exponential profile• T–S waves and 3D disturbances are damped
Separation control by stationary Lorentz force:
• separation & circulation can be controlled• power consumption (too) high (for applications)
Separation control by oscillatory Lorentz force:
• characteristic phenomena comparable to alternativemethods in a quantitative sense
➡ comparable gain in efficiency achievable (?)