flow resistance in sinuous - earth and planetary …eps.berkeley.edu/people/lunaleopold/(065) flow...
TRANSCRIPT

Flow Resistance in Sinuous or Irregular hannels
I l a , I G E O L O G I C A L S U R V E Y P R O F E S S I O N A L P A P E R 2 8 2 - D

Flow Resistance in Sinuous or Irregular Channels By LUNA B. LEOPOLD, RALPH A. BAGNOLD, M. GORDON WOLMAN, and
LUCIEN M. BRUSH, JR.
PHYSIOGRAPHIC AND HYDRAULIC STUDIES OF RIVERS
G E O L O G I C S U R V E Y P R O F E S S I O N A L P A P E R 2 8 2 - D
U N I T E D STATES G O V E R N M E N T P R I N T I N G O F F I C E , WASHINGTON : 1960

UNITED STATES DEPARTMENT OF THE INTERIOR
FRED A. SEATON, Secretary
GEOLOGICAL SURVEY
Thomas B. Nolan, Director
For sale by the Superintendent of Documents, US. Government Printing Office Washington 25, D.C. - Price 25 cents (paper cover)
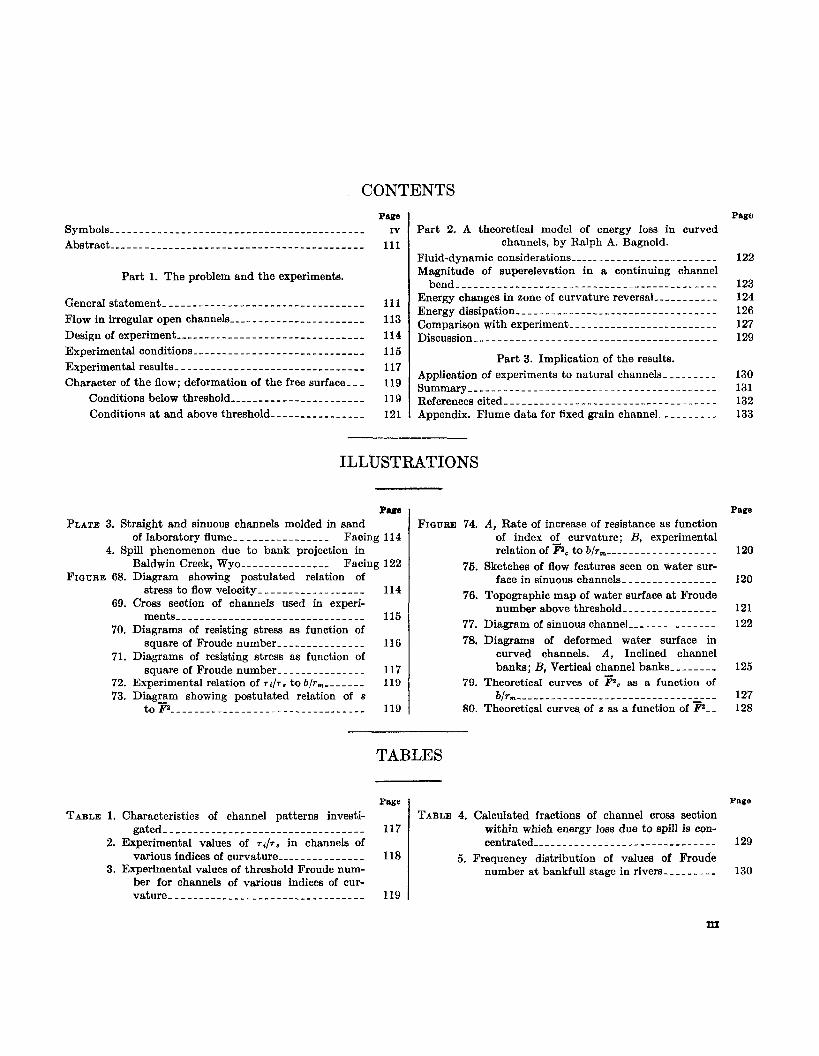
CONTENTS
Part 1. The problem and the experiments.
General statement _______- - - -_______________________ 111 Flow in irregular open channels _ _ _ - _ _ _ _ _ _ _ _ _ _ _ _ _ _ _ _ _ _ _ 113 Design of experiment _ _ _ _ _ _ _ _ _ _ _ _ _ _ _ _ _ _ _ _ _ _ _ _ _ _ _ _ _ _ _ _ 114 Experimental conditions- - - - _ - - _ - _ - - - _ - _ - _ - - - _ _ - - - - _ _ 115 Experimental results.. _ _ _ _ _ _ _ _ _ _ _ _ _ _ _ _ _ _ _ _ _ _ _ _ _ _ _ _ _ _ _ 117 Character of the flow; deformation of the free surface.. _ _ 119
Conditions below threshold _ _ _ _ _ _ - - - - _ _ _ _ - - _ - - - - - - 119 Conditions at and above threshold _ - - - - _ _ _ _ _ _ _ _ _ _ _ 121
Part 2. A theoretical model of energy loss in curved
Fluid-dynamic considerations_-- - - - - - - - - - - - - - - .. - - - _ - - - Magnitude of superelevation in a continuing channel
bend__- - -_ -_ - -_ - -_ - - - - - - - -_ - -_ - -_ - - -__ - -_ - - - - - -_ Energy changes in zone of curvature reversal _ _ _ _ _ _ _ _ _ _ _ Energy dissipation- _ - - - - - - - - _ - _ - - - - - _ - - _ - - - - - _ _ - - - - _ Comparison with experiment- - - - _ - _ _ - _ - - _ _ _ _ - _ _ _ - - - _ - Discussion_-------_-------- - - -_-__-_----__-----_--_
channels, by Ralph A. Bagnold.
Part 3. Implication of the results. Application of experiments to natural channels- - - - - - - - - Summary_-_---------------- . .-------------- . .-- . . -- .- References cited- _ _ _ _ _ _ _ _ _ _ _ _ _ _ _ _ _ _ _ - _ _ _ _ _ _ _ _ _ _ _ _ - - - Appendix. Flume data for fixed grain channel _ _ _ _ _ _ _ _ _ _
ILLUSTRATIONS
PUP PLATE 3. Straight and sinuous channels molded in sand
Facing 114 4. Spill phenomenon due to bank projection in
Facing 122 FIGURE 68. Diagram showing postulated relation of
stress to flow velocity . ._________________ 114 69. Cross section of channels used in experi-
ments -_____--__________-___________ 115 70. Diagrams of resisting stress as function of
square of Froude number . .______________ 116 71. Diagrams of resisting stress as function of
square of Froude number _ _ _ _ _ _ _ _ _ _ _ _ _ _ _ 117 72. Experimental relation of r i / r . to b / r , - - - - - _ . . 119 73. DiagEm showing postulated relation of s
to Fa_________________________________ 119
of laboratory flume _ _ _ _ _ _ _ _ _ _ _ _ _ _ _ _
Baldwin Creek, Wyo _ _ _ _ _ _ _ _ _ _ _ _ _ _ _
FIQURE 74. A, Rate of increase of resistance as function of index of. curvature; B, experimental relation of Fae to air, _ _ _ _ _ _ _ _ _ _ _ _ _ _ _ _ _ _ _
75. Sketches of flow features seen on water sur- face in sinuous channels- _ _ _ _ _ _ _ _ _ _ _ _ _ _ _
76. Topographic map of water surface at Froude number above threshold- - _ _ - _ _ - _ _ - _ - - - -
77. Diagram of sinuous channel _ _ _ _ _ _ _ _ _ _ _ _ _ _ _ 78. Diagrams of deformed water surface in
curved channels. A, Inclined channel banks; B, Vertical channel banks _ _ _ _ _ _ _ _
79. Theoretical curves of FSc as a function of b/r,,,__ - - - - - _ - - _ _ _ - - - - _ _ - _ - _ _ _ _ _ - _ - _ - - _
80. Theoretical curves, of z as a function of Bz-..
TABLES
Page TABLE 1. Characteristics of channel patterns investi-
gated _ _ _ _ _ _ _ _ _ _ _ _ _ _ _ _ _ _ _ _ _ _ _ _ _ _ _ _ _ _ _ _ _ _ 117 2. Experimental values of ~ i / r , in channels of
various indices of curvature _ _ _ _ _ _ _ _ _ _ _ _ _ _ _ 118 3. Experimental values of threshold Froude num-
ber for channels of various indices of cur- v a t u r e _ _ _ _ _ _ _ _ _ _ _ _ _ _ _ _ _ _ _ _ _ _ _ _ _ _ _ _ _ _ _ _ _ 119
TABLE 4. Calculated fractions of channel cross section within which energy loss due to spill is con- cent ra ted____-- -__-_-_-___-- - -__- - - -__- - -
5. Frequency distribution of values of Froude number at bankfull stage in rivers _ _ _ _ _ _ _ _ _
Pagu
122
123 124 126 127 129
130 131 132 133
Page
120
120
121 122
125
127 128
Page
129
130
m

SYMBOLS
a
A A
b
C d
E f
F
F Fc 9 H h. I L
e
2
-
Q P R rm
S
U
U
2
-
P 7
7 1
7 3
Ta
l
A measure of limiting depth near the bank at which local velocity
Semiamplitude of repeating bend in channel- - - -. - - - - - - - - - - - - - .. - - Cross-sectional area; A' cross-sectional area within which spill
resistance causes energy dissipation - - - - - - - - - - - - - - - - - - - _ - - - - - Width of flowing water-_ _ _ _ _ _ _ _ _ _ _ _ _ _ _ _ _ _ _ _ _ _ - - _ - _ - _ _ _ _ _ - _ _ - - Resistance coefficient. Chezy factor. Local depth of water _ _ _ _ _ _ _ _ _ _ _ _ _ _ _ _ _ _ _ _ _ _ _ _ _ _ _ _ _ _ _ _ _ _ _ _ _ _ _ _ - - Mean depth____-______________________________-- - - - - - - - - - - - - Discrete resistance. Friction factor. Froude number at a particular point, -.
Mean Froude number for whole flow -*
Threshold value of mean Froude number. Acceleration of gravity . . . . . . . . . . . . . . . . . . . . . . - _ - - - _ _ - _ - - - - - - - - Flow energy level _ _ _ _ _ _ _ _ _ _ _ _ _ _ _ _ _ _ _ _ - - - - _ - - - _ _ _ _ _ _ - - _ _ _ - - - - - - Local depth of water _ _ _ _ - - _ - - - - - - - - - - _ _ - - - - - - - - - - - - - - - - - - - - - - A length along a conduit--- - - - - - - - - _ - - - - - - - - - - - - - - - - - - - - - - - - Half the repeating distance analogous to half meander length in a
no longer approximates mean velocity.
. . .
U
4 3 -
Ilz U
Units
L
L* L
L L
LT-' L L L
m

PHYSIOGRAPHIC AND HYDRAULIC STUDIES OF RIVERS
FLOW RESISTANCE IN SINUOUS OR IRREGULAR CHANNELS
By LUNA B. LEOPOLD, RALPH A. BAGNOLD, M. GORDON WOLMAN, and LUCIEN M. BRUSH, JR.
ABS!I?RACT
The resistance to fully developed turbulent flow at constant depth in an open channel increases as the square of the mean velocity as long as the boundary conditions remain completely unchanged. The presence of the free water surface allows the possibility of departure from the relationship of resistance to the square of the velocity. Experimental evidence is given, which is in quantitative agreement with fluid dynamic theory, that such departure may be abrupt, with a marked increase of resist- ance. These departures are observed under conditions of boundary and flow which occur commonly in natural rivers.
It is shown that the condition under which this discontinuous increase in resistance occurs is definable by the mean Froude number for the whole flow which may be as small as 0.4. A t this initial state, the rate of resistance increase with the square of the velocity may be more than double.
The phenomenon, which is absent in straight uniform channels, is associated with excessive deformations of the free surface due to transverse deflections of the whole or a part of the flow by changes along the channel in the curvature of the flow boundary.
In the simple cases examined the critical Froude number at which the sudden jump occurs depends mainly on the ratio of channel width to mean radius of channel curvature, though the inclination of the banks appears also to have a minor effect.
Over the range of values of the above ratio usually to be found in natural rivers, the critical Froude number ranges between 0.4 and 0.55. The possible significance is discussed of the remark- able correspondence between this range of critical Froude number and the range of Froude number within which river flow at bankfull stage appears to be restricted.
PART 1. THE PROBLEM AND THE EXPERIMENTS
GENERAL STATEMENT
The resistance to flow in open channels is usually discussed by engineers in terms of a friction factor or coefficient. Though in American practice the factor most commonly employed is of the Manning type, this factor originates from the Chezy relation
ii=c*s
where E is the mean velocity, R is the hydraulic mean depth, and s is the slope of the energy grade line.
The Chezy factor C provided a link between the impelling force and the unaccelerated velocity. This link was a t the time of its development perforce an empirical one. The nature of internal shear stresses within the flow, upon which the velocities of both turbulent and viscous flow depend, was unknown at that time.
E20( force
was used because it was believed consistent with the fundamental Newtonian concept that force equals the time-rate of change of fluid momentum.
The d ' h c y school employed the same concept by expressing all the various elements of resistance exerted
Thus the general relation
by closed pipes in terms of the velocity head, U 2 / 2 g . The total head could be conveniently written
where the friction factor, f , represented the uniformly distributed wall friction per unit length of straight pipe, 1 the pipe length under consideration, and ZE the sum of the individual discrete resistances associated with various fittings.
For the case of open channels in steady uniform flow and considering only skin resistance, the discrete resist- ances, E, being mostly of an indefinable nature, we get
Since the drop in head per unit length is s,
which is the simple Chezy formula. It is now known that for fully developed turbulent
flow, the Newtonian concept covers shear resistance 8s well as direct fluid-dynamic force. Thus the Chezy
111

112 PHYSIOGRAPHIC AND HYDRAULIC STUDIES OF RIVERS
formula becomes theoretically correct in that all resist- ances, distributed or discrete, continue to vary as 9 provided there is no change in any part of the flow boundary as velocity is varied.
The application of the d’Arcy term “friction factor” beyond the context within which it was developed has tended to encourage the tacit assumption that flow resistance in open water courses is due principally to boundary friction associated with distributed skin roughness.
This simplified and traditional view of open-channel resistance disregards two facts. First, the “square- law” resistance may be appreciably increased, as it is in pipes, by the distortion of the flow at discrete bends and other large-scale channel irregularities. Second, such internal distortion is accompanied, inevitably, by some deformation of the free water surface. Such deformation invalidates the required condition that the whole boundary remains fixed and unchanging.
. Thus the possibility exists that appreciable departures from the square-law relation may occur. Such depar- tures need not be associated with the general resonance expected when Froude number has a value at or near unity.
Resistance in open channels, like that in closed pipes, is composed in reality of a t least three resistance ele- ments of different kinds.
In a straight uniform pipe the whole of the resistance to flow may be assumed uniformly distributed along the flow as a skin resistance. Assuming fully developed turbulence, this skin resistance, expressed as force per unit boundary area, depends, for any given shape and size of cross section, only on the square of the flow velocity and on the roughness of the boundary surface. Roughness may be considered to be measured by the mean size of distributed boundary irregularities which are small in relation to the pipe size.
In a run of piping, however, other additional resist- ances are exerted at discrete points wherever any bound- ary feature-bend, or other fitting-deflects the flow or part of it away from its former direction. In general any such deflection creates energy dissipation by eddy- ing, secondary circulation, and increased shear rate. It is usual in pipe work to estimate each of these flow- deflecting resistances separately and to add their total to the resistance of the straight piping. This type of resistance we will refer to as internal distortion resistance.
There is a third and important kind of resistance, also applied a t discrete places. It occurs when a sud- den reduction in velocity is forcibly imposed upon the flow, as at the sudden expansion just beyond a par- tially opened valve in a run of piping. The foot of a waterfall would be perhaps an extreme example in the case of open-channel flow.
When this kind of resistance occurs a t the sudden expansion of a closed pipe, it is often called impact resistance, the mathematical expression for the result- ing energy dissipation being of the same form as that for the dissipation resulting from inelastic solid-body impact.
A sudden forced reduction in flow velocity may be visualized as resulting in an abrupt telescoping of the streamlines, accompanied inevitably by violent local vorticity. This telescoping of streamlines may also result in violent vorticity due to internal breakaway or mushrooming not directly associated with a fixed boundary. This abrupt, discontinuous expansion of the streamlines is forced to take place when the flow is rigidly confined, as in a closed pipe, and must do so regardless of the oncoming velocity. The closed pipe does not permit any volume adjustment, so in this case this resistance element obeys the square-law. But owing to the volume adjustment permitted the flow in an open channel, a discontinuous telescoping and expansion of the streamlines becomes possible only when the oncoming flow is supercritical; that is, when its velocity exceeds that at which an increase of fluid pressure can be propagated upstream. No prior volume adjustment is then possible.
To avoid any ambiguity, this kind of resistance in open channels will in the present context be called spill resistance.
In natural river channels skin and internal distortion resistance are common, and it is probable that spill resistance is not uncommon in parts of the flow, even though the mean river flow is subcritical (F less than unity). Yet, for practical reasons, distortion and spill resistances are largely overlooked because large-scale and discrete boundary irregularities which cause them in natural channels are not easily described in quanti- tative terms; and therefore their resistance effects cannot easily be reduced to quantitative coeEcients of useful form, Further, the ordinary laboratory flume in which much of the experimental work on open channels is conducted is straight and uniform and wholly devoid of the large-scale boundary irregu- larities which cause distortion and spill resistance. As a consequence, the general resistance coefficient
is often thought of as synonymous with the skin fric- tion of pipes, even when the worker is dealing with natural channels. The large-scale irregularities of natural channels are conspicuous features. Indeed, few river channels are straight for distances exceeding 10 times the channel width (Leopold and Wolman, 1957, p. 53), and undulations and protuberances on the banks exist even in reaches of channel which in plan view appear straight.
Einstein and Barbarossa (1952) made an important

FLOW RESISTANCE IN SINUOUS OR IRREGULAR CHANNELS 113
advance when they broke down natural channel rough- ness into grain roughness and that caused by “sand bars, sand waves, and other irregularities of the chan- nel” (p. 1125). These latter elements they considered analogous in a mathematical sense to a series of “uni- formly sized and uniformly spaced protrusions of the stream bed, such as piles of single rocks” (p. 1125). In their analysis they postulated that the flow resistance created by these irregularities would be a function of sediment transport.
But relatively few experimental tests have been made under controlled conditions to assess the relative magni- tude of resistance due to boundry irregularities of large- scale as compared with small roughness elements. Nor have tests been made to verify the assumption that the overall resistance of natural open channels that include such large irregularities varies as the square of the veloc- ity through a wide range of velocities.
In the present paper some preliminary tests in the laboratory are described. The results suggest that the prevailing approach to resistance in natural rivers may be seriously oversimplified. The tests indicate that large boundary irregularities may greatly increase the square-law resistance over and above that attributable to boundary roughness. And further, in combination with the presence of a free water surface, these irregu- larities, by the creation of a spill resistance, may under certain conditions give rise to an astonishingly large upward departure from the square-law a t a threshold mean Froude number considerably less than unity.
The experiments were designed to explore the resist- ance effects of only one simple type of boundary irregu- larity that related to regular or repetitive sinuousity of a channel of uniform cross section. A mathematical model of flow under such conditions was not available when the experimental work was begun. A preliminary theoretical model was developed after the experimental results were complete, and for this reason it is the plan of the present paper to describe the experiments after a brief introductory discussion of flow in irregular chan- nels. Following this is a presentation of a mathematical model which appears to explain many of the observed features. We conclude with a discussion of some pos- sible implications of the theory in natural channels.
The sequence of development of the ideas will help explain why some phases of the experimental data are somewhat less complete than might be desired. The experiments should be viewed as preliminary, but they do imply that an extension of such investigations may yield interesting and informative results.
FLOW IN IBBEOULAB OPEN CHANNELS
When flow in a shallow open channel is locally deflected around a bulge in the bank boundary, the local water
is subjected to radial accelerations. As a consequence of the requirement for constant pressure a t the water surface, the radial forces are offset by an increase in the gravity head on the upstream and a decrease on the downstream side of the bulge. This creates a local fall in water-surface level, often large enough to be easily noticeable. An acceleration of local water dong the direction of flow is also noticed, as the water flows through this area of local fall in water surface.
Provided the velocity of the accelerated water does not exceed @, adjustments between velocity head and elevation head can take place with no energy loss specifically attributable to the deformation of the free surface.
But as the mean flow velocity is increased, a stage must be reached at which the accelerated local flow from high to low level begins to exceed the local prop- agation velocity, T d . At this stage the Bernoulli adjustment ceases to be possible; that is, elevation head and velocity head cannot be interchanged smooth- ly. Rather, the local high velocity flow impinges violently on slower water downstream at the lower level, with the creation of spill resistance as previously defined, and with an inevitable dissipation of energy.
To describe the types of resistances in terms of shear stress, let r5 represent the shear resulting from skin friction, and 71: a distributed stress equivalent to the resistance from internal distortion of flow by bank irregularities or bulges. Both elements may be ex- pected to increase as the square of the mean velocity, as in pipes. In terms of a mean distributed boundary stress, T = T ~ + T < and
.&z- TJf 71
C
where c is the overall resistance coefficient c=-=- ( 2’ 3 which should remain constant for flow of constant cross section through a given channel.
When, however, the energy dissipation due to spill is introduced, an expression for an equivalent distributed boundary stress might be in the form T = T ~ + T , + T ~
where rZ is the resistance due to energy dissipation in the spill process.
The total resistance, r, could no longer be expected to vary as the square of the mean velocity when rr is introduced, because, as mentioned earlier, spill resistance in an open channel cannot exist a t low velocities but must start increasing from zero at some finite mean velocity at which parts of the flow become Locally supercritical.
It is visualized that the extra resistance element r8 is not directly related to wave phenomena, nor should it necessarily be connected with any resonance
114 PHYSIOGRAPHIC AND HYDRAULIC S T U D I E S OF RIVERS
effect within the main flow as Froude number ap- proaches unity. Rather, the elevations and depres- sions of the water surface are the direct result of local radial accelerations, the positions of which are fixed by local curvatures of the bank. The positions do not depend on flow velocity and therefore cannot be re- garded as standing waves. T h e ve loc i ty mere ly determines the amplitude of the local water surface dislevelment, and thus the magnitude of excess local velocities.
DESIGN O F EXPERIMENT
The preliminary object of the experiments was to gain some idea of the relative magnitudes of the resistance elements represented by rs due to skin friction and r f due to internal distortion of the flow. It was further desired to discover whether the expected sudden departure from the square-law due to the postulated element rr might be sufficiently pronounced to be detected. The experiments were therefore designed to contrive a quantitative separation of these elements from one another.
Each of thesc elements of stress represents equivalent distributed values of force per unit of boundary area. It was desired to determine the separate effects of these three resistances on the flow velocity in a channel having a uniform cross section but analogous in shape to that of a natural river.
A quantitative expression of the relation between mean velocity, Z, and applied stress in a given channel cannot be derived analytically but only by experiment. Similarly, when the channel form is changed the new relation between Z and applied stress can be determined only by experiment. But the two relations may be compared to determine the effect of the change made in the channel.
Skin resistance can be measured in a straight channel of uniform and definable roughness. The resistance due to internal distortion or eddies, rl , can be com- pared with skin resistance, T ~ , only if the changes made in the channel do not alter either the flow cross section or the boundary texture roughness. Moreover, if it is desired to vary the type of channel irregularity, the effects can only be compared one to another if flow cross section and boundary roughness are again made identical.
This necessity unfortunately precludes the introduc- tion of abrupt baffles into a straight channel, because any experimental variation of the size or spacing of the baffles in relation to the channel cross-sectional dimensions a t once makes the cross section indeter- minate.
The simplest definable type of nonuniformity whose variation does not affect the cross section is a regular sinuosity of channel course. This was the type adopted.
Other types suggest themselves, all of which involve definable fluctuation of the cross section along the flow about a constant mean shape, and should be practicable provided the repetition distances down- stream are long compared to the cross-sectional di- mensions and provided the “bulges” are reasonably streamline. For example, the channel bed can be corrugated, the banks remaining straight; or the bank sinuosities can be brought into phase, to cause alternate expansions and contractions; or both bed and banks can be corrugated.
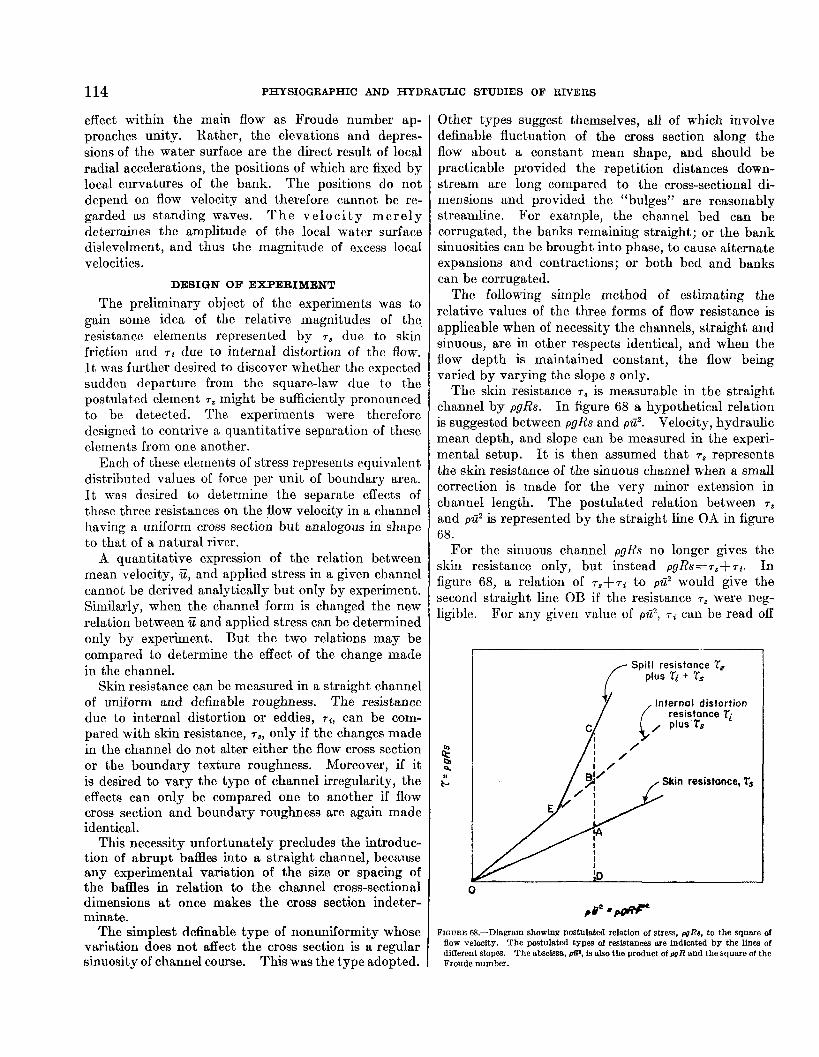
The following simple method of estimating the relative values of the three forms of flow resistance is applicabIe when of necessity the channels, straight and sinuous, are in other respects identical, and when the flow depth is maintained constant, the flow being varied by varying the slope s only.
The skin resistance 7, is measurable in the straight channel by pgRs. In figure 68 a hypothetical relation is suggested between pgRs and pa2. Velocity, hydraulic mean depth, and slope can be measured in the experi- mental setup. It is then assumed that T* represents the skin resistance of the sinuous channel when a small correction is made for the very minor extension in channel length. The postulated relation between rs and pa2 is represented by the straight line OA in figure 68.
For the sinuous channel pgRs no longer gives the skin resistance only, but instead p g R s = r s f r t . In figure 68, a relation of rS+ri to pa2 would give the second straight line OB if the resistance r2 were neg- ligible. For any given value of pa2, r , can be read off
Spill resistance ‘l‘, f plus Ti + 7,
Internal distortion
Ski resistance, T’,
0
d8 e& FIGURE 68.-Diagram showing postulated relation of stress. WR6, t o the square of flow velocity. The pmtulated types of resistances are indicated by the lines of different slopes. The abscissa, pW, is also the product of pgR and the square of the Froude number.


the figure as BD-AD. If, as thought, T~ is appreciable beyond some finite value of pa', E in figure 68, it should appear as a steepening of the line, sketched as EC in the figure. At higher values of pa', T~ can be read off the figure as CB.
Dividing both ordinate and abscissa by pgR, hy- draulic mean depth being kept constant in the experi- ment, the diagram is unaffEcted and the abscissa is then expressed in terms of F2=ii2/gR which is plotted against s. Theoverallresistance coefficient c=f/2 = g / P is equal to the slope of the straight h e OE in figure 68, which represents the linear relation between shear and the square of the velocity.
But the overall resistance coefficient will not be given by the changed slope of the curve beyond E. If such a resistance coefficient is required, it would at any given stage be proportional to the varying slope of a straight line OC. But since the elemental coeffi- cients are no longer additive, they appear to serve no useful purpose in the present context.
EXPERIMENTAL CONDITIONS
A trapezoidal channel was moulded in noncohesive sand contained in a flume having a length of 52 feet and a width of 4 feet. The adjustable-slope flume in which a channel could be moulded, built by the Geo- logical Survey in the hydraulics laboratory of the University of Maryland, is described elsewhere by Wolman and Brush and is similar to the one used for previous experiments at the California Institute of Technology (Leopold and Wolman, 1957).
The sand in which the channel was formed had a median diameter of 0.0067 ft (2.00 mm) and was rather well sorted.
In order to maintain a uniform cross section even around bends in the channel, the template used to mold the channel was not a thin plate but was turned on a wood lathe in a form resembling a round cake pan with sloping sides. All of the data discussed pertain to one cross-sectional shape made with the same template (see fig. 69).
The Trask sorting coefficient was 1.21.
1 Wolman, M. O., and Brush, Jr., L. M., Factors controlling the size and shape of Stream Channels in coarse noncohensive sands: U.S. Oeol. Survey Prof. Paper, in preparation.
In molding a straight channel the template was held rigidly in a carriage which rolled along the length of the flume. For a sinuous channel, the template was moved laterally by a mechanical linkage as it was pushed by hand along the length of the flume. Plate 3 shows two of the channels thus formed.
Because we desired to go to Froude numbers well above those observed in rivers and to maintain constant cross section of channel, it was necessary to prevent scour of grains. This was accomplished by spraying the molded channel with three thin coats of semigloss enamel paint. The grain roughness was still prominent and, in fact, the paint was so thin that it would not hold the grains indefinitely as the discharge was raised. The material used was fast-drying paint packaged in cans under pressure and equipped with a spray nozzle. It was found desirable to use a different color for each coat of paint, making it easy to see whether the new coat was of uniform thickness and covered the whole area.
The entrance consisted of a weir which discharged into a 2-foot approach channel having gradually converging metal sides terminating in a 4- fOOt reach of straight channel molded in the sand. The working length of channel was 46 feet. The discharge end of the flume was controlled by a vertically adjustable tailgate.
Water was delivered from a constant-head tank through either a 2-inch or 1-inch pipe to the entrance- box of the flume. Discharge was measured by piezom- eter tubes inserted in a 90' pipe bend, which was rated. Head was measured by a manometer containing carbon tetrachloride.
Elevations were measured by a point gage mounted on an overhead travelling carriage. The vernier could be read to 0.001 foot.
Runs were made for each of two depths of water. A run consisted of setting the flume to a desired slope, adjusting the discharge until the water depth in the channel was equal to the chosen value. Profile of the water surface was then measured to determine whether the water surface slope was parallel to the channel bed. Tailgate setting and discharge where then adjusted until the depth was the desired value and the flow
0.735 f t Water surface width, ful l depth
-'0.625 f t Water surface width."half"depth Water Wetted Area Hydraulic depth perimeter mean depth
0.090 0.685 0.045 0.066 133 .825 .075 .OS0
( f t ) ( f?) ( f t t ) ( f t )
0.385ft
FIOURE 69.-Orws section of all the channels used in tho experiments. The two values of depth shown were used In each channel pattern investigated. 543340-60-2

uniform. The discharge was then determined from the manometer reading and the slope and depth recorded.
The experimental conditions investigated consisted of the following channel patterns, each one of which was
,008
I- O 0 LI
.006 W
I- W
a
E ,004
f I
u,
,002 a 0 -I cn
run a t various discharges, and a t each of the two chosen depths. The dimensions of the cross section at each depth are shown in figure 69 and the definitions of L and A can be seen on the sketches of sinuous channels in figures 70 and 71.
. 2 .4 .6
F" G2/qR
2 L = 4 . 0 f t
0.0 IO
c 0 .000 B K W n
,006 I- W w LL
,004 z - - u)
w 0 cn
a -I . 0 0 2
.2 .4 .6 I
r2= Oz/gR
Depth ( d ) (feet)
0. I33 .090
Channel Sinuous Straight
0- -- +-- -_-
.e 1.0
k------ 2 L = 3.87 f t ------4 I I I
1
c 0
(L W n I- w W LL
5 c - u,
w 0 _I cn
a
F2 = 02/gR
FIGURE 7O.--Diagrams of channel slope, 8, proportional to resisting stress, plotted against the square of the Froude number. Data for the two depths of flow used in the experiments are represented by different symbols. As a standard for comparison, mean lines for the straight channels are shown. A, Data for straight channel; 2% sinuous channel having repenting length 4.00 ft, amplitudc 0.30 ft; and C, sinuous channel having repeating length 3.87 ft, amplitude 0.64 It

F L O W R E S I S T A N C E IN SINTJOUS OR IRREGULAR CHANNELS 117
t 0 0 LL
[r w
k- w W LL
n
f - v,
w a 0 -I v)
-
0.012
.OlO
,008
.O 06
.004
.002
Depth ( d ) Channel (feet) Sinuous Straight
0.133 0- -- .090 + - - - - - I
I i 1
jB .4 .6 .e I
F‘= F2/qR
FICURE ’il.-Diagrams of channel slope, 8, proportional l o resisting stress, plotted against the square of the Froude number. Data for the two depths of flow used in the experiments are represented by Merent symbols. As a standard for comparison, mean lines for the straight channels are shown on all the graphs. A, Sinuous channel having repeating length 2.12 ft, amplitude 0.30 ft; E, sinuous channel having repeating length 2.30 ft, amplitude 0.54 f t .
TABLE 1.-Characteristics of channel patterns investigated, expressed as length and amplitude of repeating sinuosities 1
Channel form Series No.
1-1-
~
1 The geometry of sinous channel patterns has previously been discussed (Leopold and Wolman, 1957), in terms of a meander f‘wavelength” and “amplitude,” usinz these terms as they are usually used to describe a sme curve. Since the presence of 8 keg water surface admits the possibility of true wave effects being found relevant in future discussions it may be advisable to reserve the term “wavelength” accord:
For meanders the term “meander length” will in the future perhaps be betta; than “wavele&th.” Amplitude is synonymod with “width’ of meander belt.” The molded curves of the present study are here described in terms of the ratio of repeatiy, length to amplitude, where repeatmg length is analogous to “meander length a downvalley straight lme distance between symmetrically located points on Huccessive channel curves. Amplitude is the total spread in height from wave crest to wave trough. L and A are respectively the semilength and semiamplitude.
The repeating distances shown above are average values for different curves along the length of the flume. Two basic lengths were molded, approximately 2 and 4 feet, and the slight variation from these values oc- curred in the molding of the channel. The bulge
forms were to the eye quite uniform, however, as can be seen in plate 3B.
EXPERIMENTAL RESULTS
The quantitative results are shown graphically in figures 70 and 71 in the form s plotted against F2. Val- ues of the stress element T and of i i 2 can be obtained by multiplying by pgR (see fig. 68). The original data are tabulated in the appendix.
Some scatter of the plotted points will be noted. This we found is not in excess of the scatter expected from random errors involved in reading the discharges from the rating curve.
In spite of the scatter it is clear from the plots that the simple square-law relation expected for turbulent flow was obeyed in the straight channel and also at low E’roude numbers in the sinuous channels. The smallest Reynolds number for the channel at the re- duced depth and at the lowest mean velocities measured was 3600. It is possible that at these low velocities turbulence was not fully developed in the shallows over the inclined banks. However, the data for the

118 PHPSIOGRAPHIC AND HYDRAULIC SI’OIUES OF RIVERS
6
Hydraulic nean depth (R, in feet)
straight channel as plotted in figure 70A discloses no significant departure from the linear relation between mean stress and the square of the mean velocity. It seems unlikely, therefore, that Reynolds number effects enter significantly into the results obtained at higher vel0 ci ties.
The square-law relation ceased to hold in the sinuous channels when a certain critical or threshold Froude number was exceeded. Beyond such a threshold the curves break sharply upward to a steeper slope, indi- cating the onset of additional energy loss.
At values of F 2 below the threshold-that is, in the square-law region-an idea of the relative magnitude of the extra square-law resistance rt introduced by channel curvature can be gained by considering the experimental values of the ratio T ~ / T ~ ; that is, the ratio of internal distortion resistance to skin-resistance of the straight channel. This ratio is that of AB to AD in figure 68, and can be read off the plots of figures 70 and 71. It is given in column 8 of table 2.
7
blr,
The variation of ri/rs with flow depth is peculiar. In the absence of any theoretical understanding of the
1 factors on which the square-law resistance of “irregular” channels depend, we offer no explanation. The general effect of the presence of irregularities is evidently very appreciable.
It will be noticed that the ratio ri/rs tends generally to increase with the increase in sharpness of bend. This sharpness depends not only on the radius of cmva- ture but on the ratio of channel width to radius. This ratio, b/r,, is used throughout the present paper as an index of channel curvature. The quantity 7, is the radius of a circle which passes through the centerline of the channel a t the points of inflexion and maximum amplitude.
I n figure 72 are plotted mean values of the ratio ri/rs for the two water depths. These mean values are plotted against mean values of the index of curvature, also computed as the mean value for the two water depths. The data appear in columns 9 and 10 of table 2.
0. 09 . 066 . 09 .066 . 0 9 .066 . 0 9 .066
TABLE 2.-Experimental values of ratio of internal distortion resistance, T;, to skin resistance, rq in channels of various indices of curvature
0. 22 . 1 9 . 3 9 . 3 3 . 7 3 . 6 2
1. 19 . 9 9
1 I 2 ( 3 ( 4 l 5
7 0 B - _ _ - _ _ _ - - _ - _ - _ _ _ _ _
7 0 C _ _ _ _ _ _ _ _ _ _ _ _ _ _ _ _ _ _
71A _ _ _ _ _ _ _ _ _ _ _ _ _ _ _ _ _ _ 7 1 B _ _ _ _ _ _ _ _ _ _ _ _ _ _ _ _ _ _
Series of runs in 1 Semi- 1 Semi- 1 Mean 1 Surface figure No. length amplitude radius width
(L. in feet) (A, in feet) (rm, in feet) (bJ in feet
2. 00 0. 15 3. 34 0.735 . 15 3. 34 . 625 . 2 7 1. 87 . 735 . 2 7 1. 87 .625 1. 93
1. 06 . 15 1. 00 .735 1. 06 . 15 . 1.00 . 625
. 2 7 . 7 4 .735
. 2 7 . 7 4 .625
[ :::: {
I I I I
:$ 1 78 :43
;: ;;
] 0 . 2
} } 1.09
} . 3 6
The data indicate that channel curvature alone can account for energy loss of the same order as that due to skin friction, and in tight curves may be double that quantity.
At values of Fz higher than the threshold the plots indicate an abrupt upward trend resembling that sketched in figure 68, but the experimental points do not provide any certain estimate of the abruptness of the departure from the square-law. A small but system- atic trend will be noticed which suggests that the relation beyond the threshold value, &, is curvilinear as indicated in figure 73, in which case the maximum gradient would occur at the point of departure, F;. That is, an actual discontinuity may occur. The theory to be outlined later suggests that this should be so.
Since the resistance to flow no longer obeys the square- law, the most useful way in which to discuss its varia- tion in this region is in terms of the magnitude of the
8 1 9 10
Mean T i h s
0
. 4 6
1. 10
2. 63
change of gradient. I n other words, the magnitude of the change in the rate of increase of resistance as B2 is increased.
If, as seems probable, the plots in this region are really curved, the relation will be as indicated in figure 73. As that figure indicates, the change of gradient at the actual threshold E would be measured by ds /d (p2) -ds /d (F2) , where F‘ refers to the Froude number just above Fc and B to that below.
The experimental values of the change of gradient are shown in column 7, and the relative values in column 8 of table 3. For each channel pattern indicated by the series number, data are given for full water depth, R=0.09 feet, and reduced depth, R=0.066 feet, if both are available.
In figure 74 the changes of gradient from column 7 are shown plotted against the channel curvature crite- rion b/rm. It will be seen that the results for the two

tween the change of gradient and the index of curvature, b l r m .
Figure 74B shows the experimental variation of the threshold f;;," with blr,,,. The trend is consistent with the requirement on general grounds that p: should approach unity as b/rm approaches zero (straight channel).
Semi- Length (L, in feet)
3.0
2.5
2 .o
I .5
I .o
.5
d s / d ( p l ) ds/d(&)
1.0 1.2 .2 .4 .6 .8 WIDTH TO C U R V A T U R E R A T I O , b
(percent)
47. 1 25. 0 70. 4 62. 5
1 ~ 1 n n n ~ 72.--Exyerirucnt~l rdation of ratio of lntcrnal distortion resistance, T;, to skin rcslstiincc, 7,. at various valuos of index of curvnture.
0. 37 .31 .31 . 3 1
steepest plots, series 71B, which in table 3 have values of 6 / ~ , equal to 0.99 and 1.19, have too small ordinate values in figure 74A. Estimates of gradients from plotted points are subject t o rapidly increasing error as the general inclination steepens. In figure 71B if the gradients shown in column 5 of table 3 had been deter- mined from the initial slope of curves drawn through individual plotted points, the values in column 5 would have been appreciably larger, and in figure 74A, the point 71B marked with a circle would plot a t an ordi- nate value of 0.038. With this correction there appears to be a reasonably good correlation in figure 74A be-
124. 0 213
95 88
P' __f
. _ _ - 2 1 . 2 1 . 16 . 16
FIOWRE ia.-Dlagram showing postulated relation of channel slope, 8, proportionnl to flow resistance, and square of mean Froude number, the relation becoming curvl- llnesr abovo n threshold value, Fz.
CHARACTER OF TEE FLOW; DEFORMATION O F THE FREE SURFACE
CONDITIONS BELOW THRESHOLD VALUE
A lee eddy occupied the upstream portion of each re-entrant in cdses of relatively high mean velocity and strong curvature. The eddy is shown in the surface
TABLE 3.-Values of threshold Froude number, Tc, for channels having various indices of curvature, b/rm
[Columns 7 and 8 show abrupt jump in rates of mistanca increase, and the threshold Froude number, p'. (column lo), at which they occur]
1 1 2 Series of runs in
figure No. Hydraulic
mean depth (R, in feet)
3
blr,
0. 22 .19 .39 .33 .73 . 62
1. 19 .90
I I
2. 00 2. 00 1. 93 1. 93 1. 06 1. 06 1. 15 1. 15
0.0125 . 010 . 023 . 0195 .056 . 0375 .072 . 047
0.0085 .008 . 0135 .012 . 025 , 012 . 037 . 025
7
Difference, column 4 minus
column 5
0.004 .002 .0095 .0075 . 031 . 0255 . '035 .022
8 1 9 Column 7 x 1 0 0 dsld(&
10
FC -
0. 61 .56 .56 .56 .46 . 4 6 .40 .40
543340-40-3

PHYSIOGRAPHIC A N D HYDRAULIC S T U D I E S OF RIVERS
I I 704
Series number
Runs ot depth 0 133 ft
Runs at depth 0 9 0 f t
0 ~~ . - '2 718
revised * 718
~- . A. .- - ____- --
o 718
A
2 4 .6 .8 IO I 2 1.4
W I D T H TO C U R V A T U R E R A T I O , b/rm
WIDTH TO C U R V A T U R E R A T I O , b/fm
FIGURE 74.-.4. Experimcntnl rrlatioii showi5x diffcrence in rate of increase of resistance abovc and hc~ow threshold value of Fa, as a function of indcx of curvature. B. Expcrimcntal relation of squarc of threshold Froude numhcr, 7: and indcx of channel curvature.
paths skctchcd in figure 75. The cffect of this eddy is to restrict the flow to a narrower cross section and t o create secondary, circulations. These effects undoilbt-
EXPLANATION OF FIGURE 75
FIauRE 75.-Sketches of flow fcatures Seen on water surfacc. The four diagrnms arc arranged with Froudc number increasing from top to bottom. Sorial numbers arc listed, with accompanying data, in the appendix.
A. Froude number below threshold value; no standing waves observed; eddic: are developed at concave beuk near center of curvature.
B. Froude number near threshold. Standing waves developed just upstrcam 0 points of maximum amplitude. Eddies located between polnt of convex bank and position of maximum amplitude of concave bank.
C. Froude number slightly above threshold. Slanting waves developed. Eddie! located downstream of point of inflection and upstream of position of maxi mum amplitude of concavc bank.
D. Froude number well above threshold. Standing waves well developed Prominently steepened water surface near convex bank just upstream of thl nose of each point. Eddies Just downstream of point and hugs convex bank
J = . 4 8 f p s Fc = .46
I b/r, = 6 2
IB
I I f t
I C
= 0.60 = . 88 fps = .46 = .62
' Serial No. 51
1 I
I ft
In this sector water surface steepened
D
Fc = .'
Run No 89, dota not included in appendix
Explanation f-
Direction of surface streamline
Standing wave on surface
Edge of eddy at surface
\ ---
.-
FIGURE 75

FLOW RESISTANCE IN SINUOUS OR IRREGULAR CHANNELS 121
edly are responsible for much of thc increase in the square-law resistance. A quantitative statement of the limiting conditions at which the eddy f i s t appears cannot be made from the available data.
In appearance, the effect of the eddy upon the flow was to reduce its real width and also to displace the phase of its sinuosity downstream with respect to the sinuosity of the channel banks, without however appre- ciably affecting the mean curvature.
The water surface was undisturbed by any travelling deformations other than a general h e texture of sur- face-tension ripples originating u t the grain-roughness a t the water’s edge.
The inevitable difference of local pressures imme- diately upstream and downstream of each bank convexity, which are due to the flow deflection, gave rise to slight local surface elevation upstream and a corresponding depression downstream. But the local current appeared to pass each bank convexity without nny discontinuity in the streamlines.
CONDITIONS A T AND ABOVE THRESHOLD VALUE
The critical stage as defined by the plots of figures 70 and 71 coincided with the formation of a system of small standing waves shown on figure 75B located just downstream of the point of inflection of the bank curvature and at or about the estimated point of
inflection of the mean flow path. The crests of these wavelets, starting nearly normally to the waterline, curved downstream as shown, fading out as they did so.
The critical stage also coincided with a marked change in the appearance of the flow past each bank convexity. This now assumed the nature of a plunge, or spill, from high level to low, with a pronounced local acceleration and a pronounced disturbance below where the descending water met the main stream.
As the flow velocity was further increased, the general appearance of the water surface when one looked upstream resembled that of a mountain torrent where jets of water deflected by boulders a t the stream bank impinge inwards upon the main flow.
Owing to the steepening of the local water surface slope past each bank convexity, the mounds and hollows were much more readily noticed. Figure 76 shows the configuration of the water surface in detail for conditions approximating_closely to those of figure 71A, and at a stage when F2 was approximately 29 percent in excess of E (13 percent in excess of E) . The surface contours have been drawn in planes parallel to that of the mean water surface; that is, having the same slope as the channel. It will be noticed that the surface pattern repeats itself in mirror image from one reach to the next.
0 = 0.071 cfs
r2= .27 u = ,947 fps
9 Contours on water surface above datum
Drawn relative to sloping datum of mean water surface
Observed elevation. in feel above datum
Observed elevation, in feet below datum 0
0 2 .4 .G 8 1.0 F E E T I I I -.u
PIQURE 76.-Topographic map of waccr surface in sinuous chanuel aL Froude number above threshold value. The datum Is a sloping plane parallel to and coiuclding with tho mean water surface elevation. The contour lines represent elevatlous above and depressions below that 8loplng p h e .

122 PHYSIOGRAPHIC AND HYDRAULIC STUDIES OF RIVERS
By drawing the surface contour lines relative to the mean channel slope and then assuming the slope to be zero, the surface topography thus represented should be a reasonable approximation to that of an idcal frictionless liquid subjected to the radial accelerations imposed by the boundary curvature. The only implicit assumption made here is that resistances remain uni- formly distributed.
The main features disclosed by this map are a pro- nounced mound of water upstream of each bank con- vexity, a pronounced hollow downstream of it, and an accelerated local flow from the mound towards the hollow.
A further feature which may be particularly noted is that the water surface remained free of any appreciable travelling distrubances. The deformations shown in the map were in fact static, located by the fixed curva- tures of the banks, their locations being independen t
of the mean velocity of the flow. The wholly static n a t u r e of t h e deformations appears to ruIe out wave propagation as an explanation of the energy dissipation which results in the extra resistance 7..
After observing the superelevated and depressed areas of water surface associated with the bulge in the sinuous channel of the laboratory, we sought similar phenomena in the field. An example is shown in plate 4 . The bulge was formed by a piece of sod col- lapsing into the channel. The superelevated water surface upstream from the obstruction and a depressed surface just downstream were noticeable in the field and can be discerned in the photograph.
The characteristics mentioned above also applied to the field example : accelerated local flow from mound to hollow, static deformation-that is, not travelling with the flow, but associated with the obstruction.
PART 2. A THEORETICAL MODEL OF ENERGY LOSS IN CURVED CHANNELS
By RALPH A. BAGNOLD
FLUID-DYNAMIC CONSIDERATIONS
In the conventional straight channel the body-force acceleration is g, which remains constant in both magnitude and direction. But when the whole or a part of a liquid flowing steadily in an open channel is subject to transverse acceleration due to some large- scale irregularity in the bank configuration, the direc- tion of the resultant body-force acceleration is no longer that of g, though its magnitude may for many practical purposes be taken as that of g. Changes in the direction of the resultant body-force acceleration along the channel give rise to certain special hydraulic conditions. Superelevation of the water surface along the concave bank is but one of the effects which are a matter of everyday observation. But these effects have not been investigated as extensively as their ubiquitous occurrence might warrant.
Transverse accelerations in the plane of the free surfaco occur whenever the local flow is deflected from a straight course by a boundary surface which has a curvature component in that plane. Such accelerations occur whenever one or both banks:of a stream has any kind of bulge. A single bulge, whether streamline or otherwise, deflects the streamlines in its neighborhood so as to create a reversal of their curvature. Thus the forces applied at the boundary which maintains the radial accelerations are reversed in sense. Be- cause the pressures must be constant everywhere, the free water surface is successively elevated and de- pressed. As a consequence the local water surface in the direction of local flow tends to fall steeply from a high to a low level as the flow passes the bulge.
In the case of n single bulge neither the pattern of the streamline curvature nor that of the velocity distribu- tion is readily definable. Because the precise pattern of the surface elevation is doubtful, the dynamical effects of the local fall in level are not easy to investigate quantitatively. But consider the simpler case where the whole flow in a channel of uniform cross section is deflected around an S-bend of definable curvature. In figure 77 let the velocity u a t any radius r , within the
PIRWE 77.-A sinuous ehanuel showing the center of curvature of a bend and symbols deslgnatlng the radii of curvaturn

EXAhIP1,E Oc’ Sl’ll,l, PHENOhlENON 1N A NATIJRAI, RLVER AS A RESIJ1,T O F A KANDOh1 HANK PRO.IE(:TION

FLOW RESISTANCE IN SINUOUS OR IRREGULAR C H A N N E L S 123
width b=r1-r2 of the water surface, be defined as the tangential component at r. Further, let this velocity u be the mean of the velocity through the vertical depth a t r. Thus defined, radial velocity components inward and outward due to internal motions cancel each other everywhere. It is further assumed that the flow is slow or subcritical; that is, u<m or 4 2
And let it also be assumed that the flow as it ap- proaches the section of curvature reversal has already reached a state of equilibrium under the constant applied forces due to the constant channel curvature. In t,his state the body-forces exerted on each unit mass of liquid a t radius r consist of the acceleration g up- wards, and the radial acceleration ur2/r horizontally inwards towards the center of channel curvature and therefore perpendicular to the local flow direction.
The resultant body-force is thus inclined to the fixed
vertical at an angle tan-’ ($); a pendulum moving
with the local current is tilted through this angle, and the local horizontal plane is likewise tilted. But an observer in a closed vessel drifting with the local current would not notice any peculiarity because his axes of reference are also tilted.’
The gradient of the free surface a t radius r, with respect to the fixed horizontal through the axis of chan- nel curvature, is u2/gr. Thus the increase in the water surface level a t radius r above that a t the inner bank
radius r2 is I ‘e dr. The total superelevation z over
the whole width b is ill2 r
Beyond the section of curvature reversal the sense of the radial forces acting on the fluid from the banks is reversed. The high water level along what was the outer bank has to be lowered through the distance z; and the low level along the other bank has to be raised through the same distance.
It is achieved progressively by an upward displacement of local water by tlie positive radial force of the inwardly advancing bank.
But the fall of level may cause a plunge or spill assum- ing the nature of a collapse, depending on the velocity u attained in the fall z, and on the local depth d. In the
The raising of level presents no problem.
1 The radial acceleration causes a small but real increase in the magnitude of “p”, from p to
&$. so the period of the pendulum is actually reduced, and the wave velocity is actually increased, But these changes are too small to be relevant in the present context.
event of such a spill, energy will be dissipated by local impact. The word ((spill” is used here in the context described on page 112.
MAGNITUDE OF THE SUPERELEVATION IN A CONTINUING CHANNEL BEND
The pattern of the internal flow in a continuing bend of a river or canal is imperfectly known. Particularly is observational evidence incomplete on the variation of u over a cross section for channel curves of diflerent radii.
But let u be some arbitrary functionj(r) or r. Then, making a number of alternative reasonable assumptions as tof(r), it appears that although the transverse profile of the water-surface elevation varies in shape from func- tion to function, the overall bank-to-bank supereleva- tion z is remarkably independent of the function as- summed. For instance:
Case 1: Assume that the velocity u a t various posi- tions across the channel is constant and equal to the mean channel velocity Z.
Then the equation for superelevation becomes
Because r1=r,+b/2 and ra=r,-bb/2
then g $=ln z (-) 2 + blrm 2 - b/r,
This case results in a logarithmic profile of water surface across the channel.
Case 2: u varies as r.
r1+r2 Zr u=- rrn and rm=- 2
The profile is the arc of a parabola having a vertical axis through the center of channel curvature.
Case 3: u constant everywhere, and flow such that the effective radius is constant a t r,.
This case might possibly be approximate to flow in a channel consisting of a succession of short alternatively reversed arcs. It might also approximate local flow round a single bulge in one bank with suitable local values given to b and r,.
-L=- r1-r2- -- b g z ii2 r, r ,
The profile is now a straight line.

124 P.EY&IOGRAPHIC A N D HYDRAULIC S T U D I E S OF RIVERS
Case 4: Whole discharge concentrated within a The profile is now steplike. narrow midchannel zone.
But again
Case 6: As a realistic modification of case 4, the probable velocity profile can be sketched for the conditions of a sinuous channel.
Making allowance for: a narrowing of the flow by an eddy against the inner bank such as is shown in figure 75B, a reduction in velocity towards both flow boun- daries because of friction, and for a consequent velocity increase towards the now modified midchannel radius, a graphical integration of uz/r gives a value to z which approximates very closely to that given by
z b 9 s=T,
(b and r,n referring to the whole material channel). The profile in case 5 resembles that of case 4 with
the abrupt step smoothed out to a flattened S. This profile bears a reasonable resemblance to that indicated by the contours of the experimental water surface shown in figure 76 if a transverse section is taken through the summit of the mound.
The choice of the expression most likely to give the true superelevation therefore seems to lie between b/rm and the log expression of case 1. And it happens that over a wide practical range of blr, the log expression approximates very closely to b / y , itself.
blrm 0.1 0.2 0.4 0.6 0.8 1.0
In - 2fbr’m 0.100 0.201 0.406 0.62 0.84 1.098
Finally, as experimental confirmation that the super- elevation z is really given to a close approximation by ;ii2b/grm the evidence of figure 76 may be referred to. Under the experimental conditions S was 0.95 ft per sec, b was 0.735 f t , and r, was 1.0 f t . Whence ;ii2b/grm= 0.0206 ft . The measured superelevation, as given by the overall drop between the mound top and the bottom of the hollow indicated by the contours, is 0.021 ft. I n another experimental run at half depth (R=0.09 ft) not pictured here, Z2b/grm=0.0135 ft and the measured superelevation 0.013 f t . The agreement is well within the limits of experimental error.
It is sometimes assumed that the existence of a secondary circulation may greatly reduce the super- elevation. But this seems unlikely. For whatever may be the internal motion the whole stream momen- tum pab per unit depth must certainly be changing a t the mean time rate ti/rm. Hence the excess pressure
Thus
2-bT/,
pa2b against the outer bank will be -; and to oppose this a
superelevation - is required.
Data giving the surveyed water surface profiles across meander bends in rivers or across bends in canals are not published in detail. Leliavsky (1955, p. 124) states that leveling across the Rhine confirmed a logarithmic variation analogous to case 1 above, but no data are given. In default of factual evidence, it will be assumed that the superelevation is given with fair accuracy by
z = 6 b / g r m
rrn $ b . grm
ENERGY CHANUES IN THE ZONE OF CURVATURE REVERSAL
Consider now the conditions in the transition zonc in the neighborhood of the reversal of curvature, along that bank a t which the water level falls.
Case A where this bank, locally, is inclined to the vertical; and case B where it is vertical.
Case A.-Banks inclined to the vertical. Let the following boundary conditions be assumed. The sur- face width of the stream is uniform and has a value equal to b, as previously supposed. But the cross section may vary in shape from section to section and may be asymmetrical to any reasonable extent. De- fining a reach as the curved channel between successive reversals of curvature, all the conditions, both of cross- sectional shape and of flow, are repeated from reach to reach, those in one reach being antisymmetrical, or in mirror image with respect to those in the next.
The asymmetry, and the variation, of the cross- sectional shape will affect the velocity distribution; but
as shown previously, the distance z=- through which
the side-water falls is unlikely to be affected to any appreciable extent.
Consider an element a, shown shaded in figure 78A, of discharge of this side-water flowing over the inclined bank. The lower sketch shows the element of discharge as it approaches the section Y-Y’ where the curvature reverses. It is reasonable to assume that q remains continuous and constant from a point upstream at which the curved channel flow has developed its full water-surface superelevation, as far downstream as the section Y-Y’. This superelevation is equal to 212 above the mean level. Moreover, within this restricted zone the curvature is small and may be neglected. Hence, it is legitimate to compare the action of this element p to flow in a straight channel over a local broad-crested weir.
There appear to be two rather different cases.
a2b V r n

FLOW RESISTANCE M SINUOUS OR IRREGULAR CHANNELS 125
A
Position downstre of inflection point
B
. I
FIGURE %--A (upper). Cross sectlons above and below point of inflection of channel curvature showing superelevated and depressed water surface along a sloping bank. (lower) Longitudinal profdenear bank through the samereach indicatingenergygrade h e (upper dashed curve), water surface, and channel bed. B, Same as A above but in a channel having vertical banks.
For lack of sufficiently definite knowledge of the distribution of flow velocity across a curved channel, let it be assumed as an approximation that the velocities u1 and u2 of p in the equilibrium zones upstream and downstream of the transition zone may both be repre- sented by the mean velocity a. And assuming that the inclined bank extends to a sufficient depth, the flow depth d of q will be the same both upstream and down- stream of the transition zone, figure 78A. Hence the total energy level H will have fallen, through the transi- tion zone, by the same distance z as the water level, though without ultimate change in either velocity or flow depth.
Now if we consider the case of straight-channel flow over a broad-crested weir, the flow energy,
U2 H=-+d 29
can be reduced without accompanying energy dissipa- tion by spill only by the amount represented by the differ- ence between HI upstream from the weir, and He over the crest, as shown in the longitudinal profile sketched at the bottom of figure 78A. The quantity H, is the
energy level a t critical depth and the minimum value
of the quantity -+d for constant p.
crested weir is as follows.
U2
29 An expression for this critical energy level for abroad-
Assuming a constant discharge p,
U2= Q2/d1 (1)
which substituted in the Bernouilli expression, equa- tion (1) above, gives
H=-+d=-+d U2 a" 2g 2gdz
To obtain the minimum value, H,, of the above, differ- entiate and equate to zero.
and
PHYSIOGRAPHIC AND HYDRAULIC STUDIES OF RIVERS 126
Because
Then
This merely states that the energy grade line over the weir a t critical depth is half as high again as the water level d,.
then In the present case, because q=ad
(3)
The maximum energy removal which can take place without accompanying dissipation is therefore given by HI - H,, or
(4)
This amount of energy is not lost by the stream as a whole, for it is transferable across to the opposite bank.
I t may be noted here that the critical velocityu, which occurs directly over a broad-crested weir in the case of a straight channel should occur in the present conditions at the section Y-Y' of curvature reversal, the dynamics involved in the reversal having here taken the place of the static thrust of the real weir. Thus the fall in water level should begin upstream of this point. This is consistent with the experimental evidence. The contour lines of figure 76 show the fall in level from the equilibrium state achieved a t the top of the mound to begin well upstream of the local point of inflection. Moreover figure 75 shows a system of standing wavelets indicative of the critical state situated just at the point of inflection and of curvature reversal.
ENERGY DISSIPATION
If z does not exceed Hl-H,, the stream should ex- perience no real energy loss arising specifically from the local deformation of the free surface; and for constant depth the averall resistance to flow should in- crease as the square of the mean velocity ;ii.
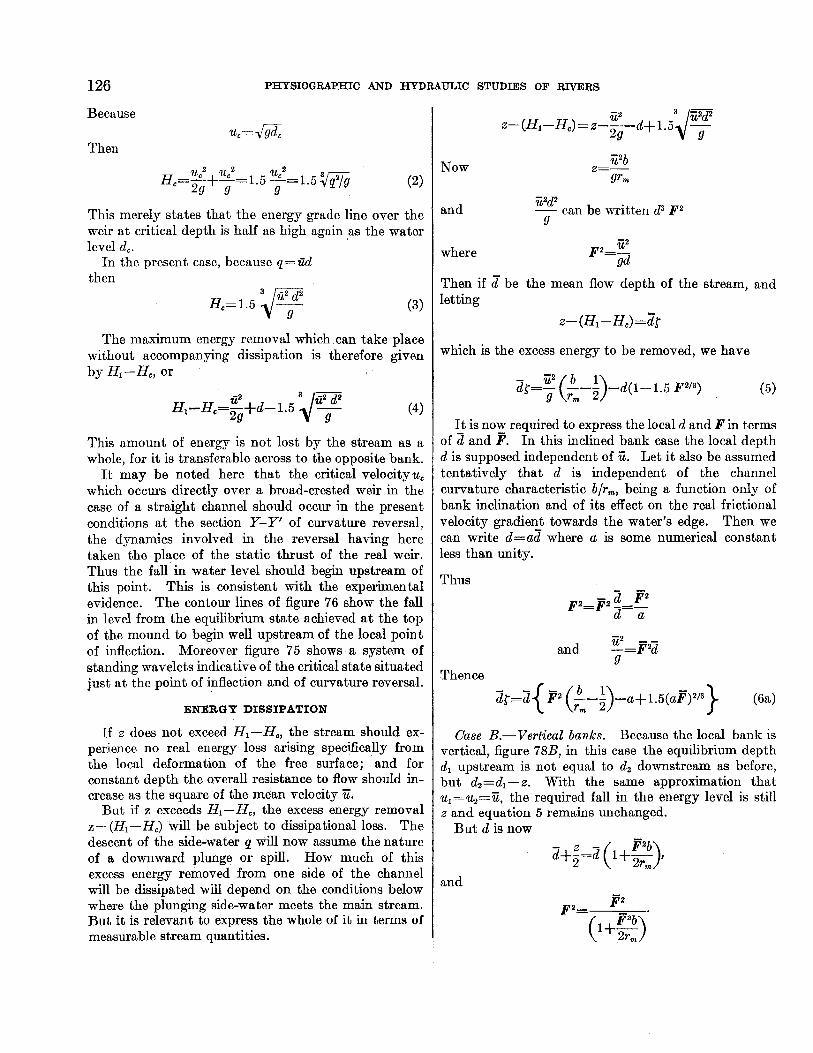
But if z exceeds Hl-H,, the excess energy removal z-(Hl--Hc) will be subject to dissipational loss. The descent of the side-water p will now assume the nature of a downward plunge or spill. How much of this excess energy removed from one side of the channel will be dissipated will depend on the conditions below where the plunging side-water meets the main stream. But it is relevant to express the whole of it in terms of measurable stream quantities.
Now
and
where
can be written d3 F2 9
Then if d' be the mean flow depth of the stream, and letting
2- (HI -Hc) =& which is the excess energy to be removed, we have
(5)
It is now required to express the local d and F i n terms of 2 and P. In this inclined bank case the local depth d is supposed independent of G. Let it also be assumed tentatively that d is independent of the channel curvature characteristic b/rm, being a function only of bank inclination and of its effect on the real frictional velocity gradient towards the water's edge. Then we can write d=az where a is some numerical constant less than unity.
Thus
;ii2 -- and -=F2d
9 Thence &=z{ p2 (--5)-a+1.5(aP)2/3) b 1 (sa)
Tm
Case B.-Vertical banks. Because the local bank is vertical, figure 78B, in this case the equilibrium depth d, upstream is not equal to dz downstream as before, but d2=dl-z. With the same approximation that uI=u2=ii, the required fall in the energy level is still z and equation 5 remains unchanged.
But d is now
and

FLOW RESISTANCE IN SINUOUS OR IRREGULAR CHANNELS 127
Equation 5 now becomes
In each case the theoretical threshold values Fz of F2, a t which a departure from the square law is to be expected, is obtained by equating the dimensionless quantity [ to zero and solving for pz by a simple graphical method. In case A some arbitrary assump- tion must be made as to the value of a (see below).
COMPARISON WITH EXPERIMENT
The theoretical threshold values pE of F2 are shown in figure 79, plotted against the channel characteristic
b/rm. The three continuous curves are obtained from equation 6a (inclined banks), for a=l , 0.8, and 0.5. The experimental values of @: as read from the plots of figures are also shown. The precise experimental values of F: for the longer channel radii are, however, difficult to determine from the plot; and these readings may be in appreciable error. The general trend of the theoretical F,Z as the channel curvature is varied is nevertheless in remarktible agreement with experiment. The best fit for the particular cross-sectional shape of the experimental channel used appears to be that for a=0.8.
The broken curve of figure 79 is that obtained from equation 6b (rectangular channel). As will be seen, it approximates closely to the curve for equation 6a,
WIDTH T O C U R V A T U R E RATIO, &/m, FICURE 7O.-Theoretical curves showing relation of square of threshold Froude number, F.2, to lnder of channel curvature. for various assumed values of factor a. This
factor is a meawre of the limiting depth of water near a bank at which the local velocity ceases to approximate the mean flow velocity. Points plotted represent experimental values of F> and b/r- for comparison wlth theory.

128 PHYSIOGRAPHIC A N D HYDRAULIC STUDIES OF RIVERS
for a=l. These two curves both give p!=1 for the extreme case of a straight channel, b/r,rO; whereas for a straight channel with inclined banks, F: is smaller, a t &=a in the general case where a<l. This is consistent with the simplifying assumption made that u,=Ti; that is, bank friction causes negligible reduction in the velocity with decreasing depth. So a can be regarded as defining the limiting reduced depth near the bank a t which, in practice, the local velocity ceases to approximate to ii, owing to bank friction.
The family of continuous curves in figure 80 show the values of { according to equation 6a as Fz is increased above the threshold F?. The two broken curves show the corresponding values according to equation 6b for the rectangular channel. It will be noted that in both sets of curves the gradient d {/d (Fz) has a finite and maximum value a t the threshold {=O and Fz=?2. This again is wholly consistent with the experimental results. The finite value indicates that the gradient of the overall resistance to flow changes discontinuously
F~WJRE 80.-Theoretical cnrves of the relation of flow reslatance tosquare of Froude number at values of higher than the threshold, F.1. Full lines represent condi- tions with sloping channel bank, and dashed lines with vertical bank. Curves are developed for various values of curvature index, b/rm. In each case the zero ordinate value off corresponds to the threshold value, z.2.
a t F? as the experimental results show. And the sub- - sequent decrease of gradient as is increased above F,2 can indeed be detected in the experimental plots by a close inspection of the individual plotted points, though in the absence of theoretical support, this tend- ency might well be taken as being due to systematic experimental error. The subsequent reversal of this tendency as shown by the plots to occur at still higher values of Fz may well be attributable to the onset of a general instability on the part of the whole flow as general resonance is approached towards i;”= 1.
The dimensionless quantity { bears the same relation to the specific and localized resisting force to which the local energy dissipation is equivalent as the dimen- sionless quantity s bears to the overall resisting force acting on the whole flow.
Over the length L containing one reversal of channel curvature the local energy dissipation is measurable by ( p g z { ) X (A’) where A‘ is the effective cross-sectional area of the side-flow p. Over the same length of channel the overall energy dissipation is pgLsXA. So the ratio of the overall resistance to the specific localized part of it which appears when F2>e is
s L A -.-.- 1 2 A’
assuming of course that the whole of the excess energy a{ is in fact dissipated.
Of particular relevance to the behavior of natural rivers is the magnitude of the discontinuous jump in the rate of resistance increase with velocity increase which occurs a t the threshold stage defined by F?.
From the experimental data the additional resisting force applied to the length L of the whole flow when pz exceeds Pp is measureable from the plots by (s,-se) XpgAL (fig. 7 3 ) . And in the limit when pz is brought very close to F: the discontinuous change of gradient is
where discontinuity and SIP is constant.
refers to conditions immediately beyond the to square-law conditions in which
The corresponding theoretical change of gradient is
Hence theory may be compared with experiment by considering the values of A’IA in
ds as --- A’ -= d ( p z ) d(F2) .- L (7) A d r 7
UI
d (F2)

FLOW RESISTANCE IN SINUOUS OR IRREGULAR CHANNELS
6
Difference, column 4
minus column 5
0. 004 .002 . 0095
129
7
dr/d(?s)
-__
0. 60 . 58
1. 156
It would be difficult to predict the proportion of the excess energy {z (or {R if the hydraulic mean depth is preferred) which will be dissipated, because it cannot be assumed that the side-flow p is definably continuous below the critical depth d,. Nor is it possible to cal- culate the cross section A’ involved, for this would require a knowledge of the actual distribution of the flow velocity over the channel section. From an inspection of the water surface map, figure 76, the area A’ involved might be guessed as being between one- tenth and one-third of the whole area A. Thus if it is assumed that the whole of the excess energy {z is dissipated, then the expression on the right of equation 7 when evaluated should give values between, say, 0.1 and 0.3. And these values should be reasonably constant from one experimental channel to another.
Hydraulic mean
depth ( E , in feet)
From (sa)
blr,
b 1 0.431 -___ - +-=-- for u=0.8 (8) rm 2 ( F 2 ) g
0. 09 . 066 . 0 9 . 066 . 09 . 066 . 0 9 . 066
\- , The precise experimental values of ds/d(p2) a t the
threshold stage F2 cannot be determined from the plots. And the alternative adoption of the mean gradient through all the plotted points may introduce appreciable error. With this understanding, the result- ing values of A‘IA, as given by equation 7 are shown in the following table. Values of dc/d(F*2) are wholly theoretical, having been calculated from equation 8 by giving F2 the appropriate theoretical values shown in figure 80.
0. 22 . 19 . 3 9 . 3 3 . 7 3 . 62
1. 19 . 9 9
TABLE 4.--Calculated fractions of cross section of $owing water within which energy loss occurs because of spill resistance
. 0075
.031
.0255
.035
.022
1
. 837 29. 3 1. 515 11. 7 1.345 16. 1 2. 14 12. 8 1. 85 17. 4
Series of runs in figure No.
2 1 3 4
ds/d(pz)
0. 0125 . 010 . 023 . 195 .056 . 0375 .072 .047
It will be seen from table 4 that the ratio A‘/A does in fact lie within the range of values expected on the assumption that the greater part of the excess energy is dissipated in the impact of plunging side-flow p against the main stream. And on this assumption the extra resisting force predictable from fundamental principles is adequate to explain the facts.
DISCUSSION
The foregoing conceptual model, based on funda- mental dynamic principles, appears capable of repro- ducing all the salient experimental features. It ex- plains the reason for the abrupt jump in the rate of increase of the flow resistance. It predicts correctly the threshold conditions a t which this jump occurs, the magnitude of the extra resistance, and the general trend of its increase. The model also predicts the pattern and the scale of the water surface deformation.
The special case chosen is a simple one. But the underlying prinoiples should apply to the effects of any single and discrete obstacle to the flow, provided the obstacle is such as to deflect some part of the flow
5
ds/d (Fa)
0. 0085 . 008 .0135 .012 .025 .012 .037 .025
8
LIR
-- 22. 2 30. 3 21. 5
9
A’IA
_____
0. 148 . 105 . 176 . 264 . 242 . 305 .209 . 207
which has a velocity comparable with the datum ve- locity zi. The effect would not be expected to result from the existence of a small obstacle in a shallow depth close to the water’s edge, for here the velocity of the deflected flow might well be considerably less than fi.
The stage @ a t which a discontinuous jump occurs in the rate of increase of resistance appears to be deter- mined by the shape of the obstacle as defined by the horizontal curvature of its boundary rather than by its size. For a small obstacle the relevant cross-sec- tional area A’ will be small in relation to t,he whole area A of the stream. But a number of small deflect- ing obstacles in a given length of channel may well give rise to as large an extra resistance as a single bend in the whole channel.
Moreover, it follows from the theory that it is not necessary that the obstacle shall form a part of a bank boundary. It could as well take the form of an island. This leads to the interesting question: to what extent will the effect occur in the case of a submerged island, such as an isolated bank or dune? This again leads

130 PHYSIOGRAPHIC AND HYDRAULIC STUDIES O F RIVERS
to a consideration of the effect of a meandering thalweg in an otherwise straight reach of river.
There thus appears to be scope for a great deal more experiment with fixed channels before conditions are further complicated by the presence of moving sedi- ment.
A further interesting problem arises from the local- ized nature of the effect. A discrete source of energy dissipation has been shown to occur, and this must in- evitably be associated with an equal resisting force ap-
plied at the flow boundary. How far, and where, is this extra resisting force concentrated a t discrete por- tions of the boundary? It seems probable that if it i s concentrated in the immediate neighborhood of the deflecting obstacle, which a t low values of F would tend to protect the bank boundaries elsewhere, the obstacle would tend to be eroded away if above-threshold va.lues of F were to be attained. As a consequence, the channel would widen.
PART 3. IMPLICATION OF THE RESULTS
APPLICATION OF EXPERIMENTS TO NATURAL GHANNELS
The present experiment appears to have a bearing on some aspects of the river width problem from two points of view. First, i t was found in the experiments that an additional resistance became appreciable at a threshold defined in terms of the hydraulic Froude number, and that the threshold tended to be restricted to limited range of values. In most natural rivers, observed values of Froude number tend to be less than this threshold range of values. This warrants comment and further investigation. Second, the observation that spill resistance was associated with a concentration of stress on some portions of the channel boundary sug- gests a mechanism which under certain conditions may contribute materially to adjustments in width of natural channels. These two inferences will now be discussed.
The mean Froude number of a river cross section expressed in terms of mean velocity and hydraulic radius is -
- u F=Jsrt
From the average change of velocity and depth (Leopold and Maddock, 1953) in a downstream direction, the downstream change of B with discharge can be expressed as
FaQ-O.’ With increasing discharge a t a given stream cross
section, on the other hand, Froude number incresses as a power function of discharge, the exponent having an average value of 0.23. The value of is thus greatest at high stage; that is, bankfull stage, and for head- water streams. But even for such conditions, long reaches of natural channel practically never achieve critical flow (F=l.O) except in some streams whose beds are composed predominantly of sand. On the contrary, in most rivers values of Froude number are much less than unity. A sample of values which occur in rivers can be obtained from velocity and depth data compiled from gaging station data.
For the computation of bankfull value of F, it was
necessary to restrict the examples to those gaging sta- tions for which an independent determination could be made of what discharge or stage represented bankfull conditions. These cases (see table 5) included stations a t which the authors had made field surveys relating gage datum to flood-plain level, or where a “flood stage” had been determined by actual flood experience, or where flood frequency curves could be used to check determinations based on a channel cross section. Even with these restrictions the determinations of bankfull stage for 62 gaging stations in the United States are of varying reliability. Once the bankfull stage or dis- charge has been chosen, data on velocity and mean depth are readily available. The reliability of the h a 1 values of is limited principally in the choice of bankfull stage.
- TABLE 5.--Frequency distribution of values of Froude number, F,
for rivers at bankfull stage Number Percent
Range o/% Of Cage8 O / C U 8 t 8
<o. 20 0. 20-. 25
.26-. 30
.31-. 35
. 3 6 . 4 0
. 41-. 45
.46-. 50
. 51-. 55
. 56-. 60 >. 60 -
6 10 1s 18 13 21 12 19 7 11 8 13 2 3
i } S 5 -- 62 100
Table 5 shows that there is no single value of Froude number around which a large percentage of the cases are clustered. The salient feature of the data is the fact that there is a sharp cutoff a t a value of 0.45, with only 8 percent (5 stations) of the cases exceeding this value, and only one case exceeding 0.60.
Were the value of Froude number a t bankfull stage a random consequence of various combinations of bank materials, river size, and other features representing the range of conditions included in the sample, an approxi- mation of a statistically normal distribution curve would be expected. In contrast the data do not ap-

FLOW RESISTANCE IN SINUOUS OR IRREGULAR CHANNELS 131
proximate a normal distribution. The sharp diminu- tion observed a t a value of 0.45 suggests strongly that there exists some kind of threshold beyond which proc- esses operating in a natural channel alter the hydraulic relations a t channel cross sections in such a way that the velocity-to-depth ratio is reduced, and thus the Froude number is limited.
Now the range of threshold values, Fc, observed in the present experiments is from 0.40 to 0.61 (table 3). Beyond Fc spill resistance becomes an appreciable and sometimes a dominant part of the flow resistance. The coincidence of the range of Fc observed and the cutoff value of Froude number in natural rivers is remarkable. Some inferences may be drawn from the theory present- ed previously which suggest that this coincidence is not merely fortuitous.
From equation 6a the graphs of figure 79 were plot- ted showing the relation of the square of the threshold Froude number, F?, to the curvature criterion, b/rm, for various values of the parameter a. As explained, this parameter is defined as a=d/x, and represents the ratio of local depth, d, over an inclined bank to the mean depth of the whole channel, 2, beyond which the local near-bank velocity no longer is approximated by the mean flow velocity in the whole channel. Thus the parameter a depends on the relation between bank in- clination and the effect of bank friction in reducing the local velocity over the inclined bank. For a, given bank inclination, the smoother the bank surface the closer to the water’s edge would the local velocity approxi- mate the mean velocity of the channel; and thus the smaller would be the value of a. Looking at figure 79, one can see that for any value of b/rm, the value of the threshold Froude number, F?, depends on the value of a, and by the above reasoning, depends then on the roughness of the bank boundary.
The experimental values of F2 plotted on figure 79 suggest a value of a equal to 0.8 for the experimental channel. If in natural rivers the value of a were slightly smaller, the threshold F) would be appreciably reduced, as can be seen in figure 79.
It seems possible that the wide range of values of Froude number shown for rivers in table 5 may be due to variations in bank roughness from river to river. Also differences in Reynolds number from river to river would probably cause some variation in a. High velocities would probably extend further toward the banks at high Reynolds number than at low, and to the extent that this were true, high Reynolds numbers would tend to be accompanied by lower values of a and
Thus, the theory suggests why the Froude numbers Fc.
for various rivers might vary through a range of values but are quite sharply limited by an upper value of about 0.45.
I t is necessary to discuss the elements of a physical mechanism by which the onset of spill resistance would set the upper limit for Froude number in a river. The experiments suggest that this mechanism operates through the fact that spill resistance represents a local- ized and concentrated dissipation of energy near the banks. I t might be expected, therefore, that this local dissipation affects bank erosion, or erosion of the bulge or projection causing the spill process. Further, the energy dissipation increases rapidly after the threshold value of Proude number is exceeded, and thus the erosion process would probably tend to increase in intensity with increase in F above Fc.
SUMMARY
Little is known in terms of quantitative mechanics about how river width is determined and maintained. Common observation indicates that among rivers of comparable discharge, those with cohesive banks tend to be narrow and deeper than those having sandy or less cohesive banks. Under certain conditions vege- tation must exert an important control on river width by encroachment on bars or banks that then become sta,bilized by roots. The stems and exposed roots also Locally reduce flow velocity and thus shield the bank materials from stress.
Even in the nearly ideal condition of cohesionless material, details of widthdetermining processes are but poorly known.
In general the experiments imply that an appreciable part of the whole flow resistance pgsR of an irregular channel is due to internal energy loss in eddies and vortices a t local deflections. The thrusts are probably borne by the projecting portions of the banks. A con- siderable portion of this thrust will consist of compo- nents normal to the local boundary and therefore of a nonerosive nature.
As a result, the river bed on the whole must be relieved of a portion of the overall tractive stress pgsR. Certain small parts of the bed may experience an exces- sive stress, but these may be expected to relieve them- selves of the tangential component of this excess by receding as local depressions.
It may well be, therefore, that a river which is defi- dent of bed material of large enough size to stabilize a straight channel may become stabilized in an irregular zhannel merely by creating random bank projections. Cn computing the bed stress necessary to dislodge bed material, the present experiments suggest that the stress

132
a t initial movement mag in reality be less than the I
PHYSIOGRAPHIC AND HYDRAULIC STUDIES OF RIVERB
REFERENCES CITED distributed stress given by pgsR.
The same reasoning may have implication to river meanders when the basic hydrodynamic mechanism becomes better understood. The meander form may represent one of the channel patterns to which the above generalization applies, only the random bank projections are replaced by somewhat symmetrical channel curves.
Finally, the experiments show that a great deal more needs to be known about open flow in irregular fixed channels in the absence of sediment movement, and that research on this subject might well proceed hand in hand with further research on sediment movement per se.
Einstein, H. A., and Barbarossa, N. L., 1952, River channel roughness: Am. SOC. Civil Engineers, Trans., v. 117, p.
Leliavsky, Serge, 1955, Introduction to fluvial hydraulics: Lon- don, Constable.
Leopold, L. B., and Maddock, Thomas, Jr., 1953, The hydraulic geometry of stream channels and some physiographic implications: U.S. Geol. Survey Prof. Paper 252.
Leopold, L. B., and Wolmen, M. G., 1957, River channel pat- terns-braided, meandering, and straight: U.S. Geol. Survey Prof. Paper 282-B.
Wolman, M. G., and Leopold, L. B., 1957, River flood pIains- Borne observations on their formation: U.S. Geol. Survey
1121-1 146.
I Prof. Paper 282-C.

~
Seria No.
- 1 2 3 4 5 6 7 8 9
10 11 12 13 14
15 16 17 18 19 20 21 22 23 24 25 26 27 28 29 30 31 32
33 34 35 36 37 38 39 40 41 42 43 44
45 46 47 48 49 50 51 52 53 54 55 56 57 58
59 60 61 62
Dis- charge (Q, in cfs)
0. 0255 . 032 .038 .045 .052 .058 .062 . 024 . 0395 . 055 .063 . 082 . 103 . 115
.017
. 025
.031
.037
.042
.047
. 053 . 059
. 064
. 0305
.043
.057
. 068 . 078
.087
.096
. 108
. 115
.023
.030
. 037
. 042
.046
. 051
. 041
.055
. 066
.077
. 084
.092
.022
.028
.031 . 033
.036
. 0375
.04
.030
.038 . 046
.051
.058
.061
. 066
.019
.027
.029
.032
Center. line
water depth (feet)
0.090 .090 .090 .090 .090 .090 .090 . 133 . 133 . 133 . 133 . 133 . 133 . 133
.090 * 090 .090 .090 .090 .090 .090 .090 .090 . 133 . 133 . 133 . 133 . 133 . 133 . 133 . 133 . 133
.090
.090
.090
.090
.090
.090 . 133 . 133
. 133 . 133 . 133 . 133
.090
.090
.090
.090
.090
.090
.090 . 133 . 133 . 133 . 133 . 133 . 133 . 133
.090
.090
.090
.090
FLOW RESISTANCE IN SINUOUS OR IRREGULAR CHANNELS
HY- draulic mean depth (R, in feet)
0.066 .066 .066 .066 .066 .066 .066 .090 .090 .090 .090 .090 .090 .090
.066
.066
.066
.066
.066
.066
.066
.066
.066
.090
.090
.090 . 090
.090
.090
.090
.090
.090
.066
.066
.066
.066 . 066
.066
.090
.090
.090
.090
.090 . 090
.066
.066
. 066
.066
.066 . 066
.066
.090 * 090 .090 .090 .090 .090 .090
.066
.066
.066
.066
APPENDIX
Flume data for $xed-grain channel having various sinuositim
Water surface
slope (s)
0. 00125 . 00175 . 00295 . 00395 . 00505 . 0062 . 00725 . 00033 . 00097 . 00146 . 00216 .00375 .0055 . 00754
. 00035 . 00097 . 00166
.00246 . 00337 . 00448
. 00559 . 00723 . 00853
.00036
. 00097 . 00156 . 00239
.00319
.00448
. 00559
. 00723
. 00853
.00124
.00255 . 00370 . 00544
. 00686 . 00914 . 00124
. 00255
. 00370
.00544
.00686
. 00914
.00112
.00217
.00297
.00382
.0050
. 00654
.0080
.00122
. 00224
. 00299 . 00396
.00516
.00658
.0081
.0022
.0042
.0058
.0072
Mean relpitg (u, in fP4
0.560 .703 .835 .989
1. 14 1. 27 1. 36 .32 . 5 3 . 73 . 84
1. 09 1. 37 1. 53
.374
.549 . 681 . 813
.923 1. 03 1. 16 1. 30 1. 41 .407 .573 .760 .907
1. 04 1. 16 1. 28 1. 44 1. 53
.505
. 659
. 813
.923
.547
.733
.880 1.027 1. 12 1. 227
.484
.615
.681
.725
. 791 . 824
.88
.400
.51
.61
. 68
.77
.81
.88
.417
.593
.637 . 703
1. 01 1. 12
0.314 .494 .697 .978
1. 30 1. 61 1. 85 . l o 2 .28 .54 .71
1. 20 1. 89 2. 34
. 140
.301
.464 . 661
.852 1. 06 1. 35 1. 69 1. 99 . 166 .328 .578 . 823
1. 08 1. 35 1. 64 2. 07 2. 34
. 255
.434 . 661 . 852
. 299
.537
.774
1. 02 1. 25
1. 05 1. 25 1. 51
.234
.378
.464
.526
.626 . 679
.774 . 16
.26
.38
.46 . 60 . 656
.774
. 174
.352
.406
.494
- F=U2 c
gR
0.148 .233 .329 .461 . 613 .759 . 873 .035 .096 . 185 . 243 .413 .65 .81
.066 . 142
.219
.312
.402
.500 . 637
.797
.939
.057 . 113 . 199
.284
.372
.466
.566
.714 . 807
.120
.205
.312
.402
.481 ,590 . 103 . 185 .267 ,362 .431 .521
. 110 . 178
.219
.248
.295
.320
.365
.055
.088 . 130 . 159
.206
.226 . 267
.082 . 166 . 192
.233
Froude oumbei (F)
0. 38 .48 .57 .68 . 78 .87 .93 . 187 .31 .43 .49 .64 .81 .90
.26
.38
.47
.56
.63 . 71
.79
.89
.97
.24
.34
.45
.53 . 61
.68
.75
.84
.90
.35 * 45 .56 .63 . 69 .77 . 32 .43 .52 .60 . 66 .72
.33
.42
.47
.50
.54
.56
.60
.23
.30
.36
.40
.46
. 48
.52
.29
.41
.44
.48
63 63 63 63 63 63 63 63 59 59 59 59 59 59
64 64 64 64 64 64 64 64 64 64 64 64 64 64 64 64 64 64
66 66 66 66 66 66 66 66 66 66 66 66
60 60 60 60 60 60 60 60 60 60 60 60 60 60
64 64 64 64
133
Remarks
Data plotted in fig. 70A. Straight channel.
Data plotted in fig. 70B. Repeating distance 2L=4.00 ft. Amplitude 2A = 0.30 ft. Thalweg len th 4.1 ft. Sinuosity rthzweg 1ength:valley
length) = 1.024.
Data plotted in fig. 70C. Repeating distance 2L=3.87 ft. Amplitude 2A = 0.54 ft. Thalweg length=4.09. Sinuosity (thalweg length: valley
length) = 1.056.
Data plotted in fig. 71A. Repeating distance 2L=2.12 ft. Amplitude 2A = 0.30 ft. Thalweg length=2.22 f t . Sinuosity (thalweg length: valley
length) = 1.048.
Data plotted in fig. 71B. Repeating distance 2L= 2.30 ft. Amplitude 2430.54 f t . Thalweg length=2.60 ft.
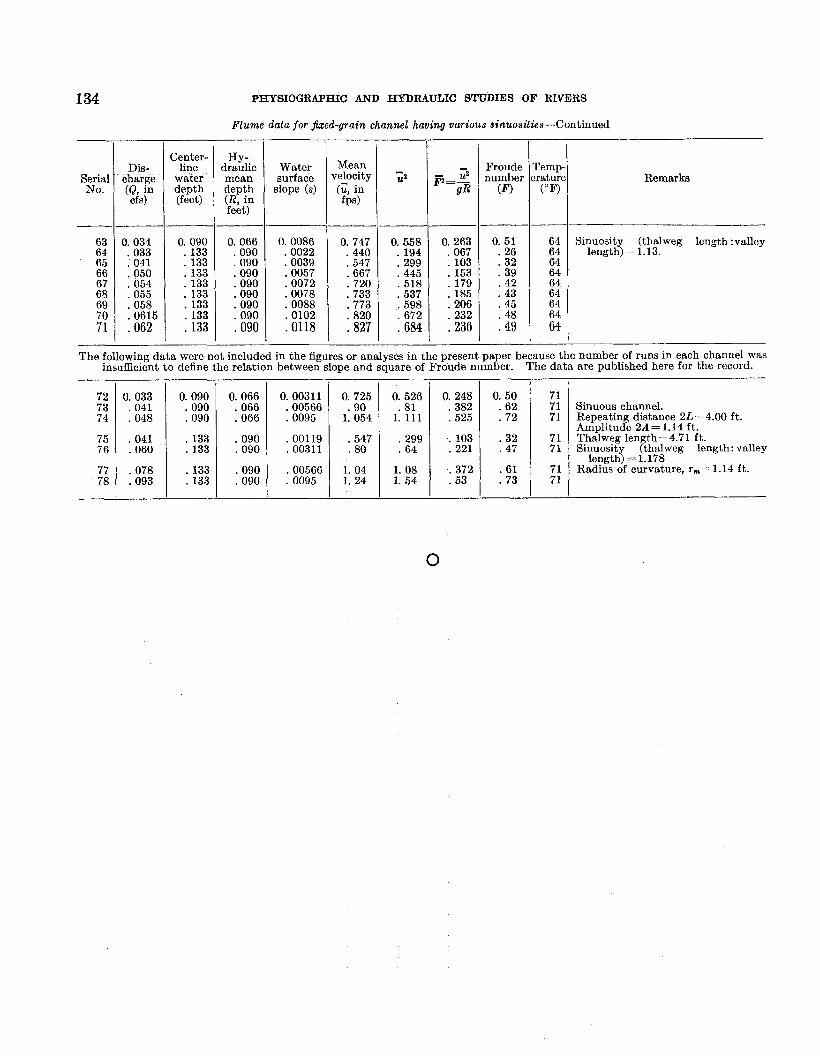
PHYSIOGRAPHIC AND HYDRAULIC STUDIES OF RIVERS
Flume data for jixed-grain channel having various sinuosities-Continued
HY-. drauhc mean depth (R, in feet)
Center- line
water depth (feet)
Froude number (F)
reap- rature (OF)
Dis- charge (Q , in cfs)
Water surface
slope (s)
Mean relocity (u, in fps)
Serial No.
Remarks
63 64 65 66 67 68 69 70 71
0.034 .033 . 041 . 050 ,054 .055 .058 .0615 .062
0.090 . 133 . 133 . 133 . 133 . 133 . 133 . 133 . 133
0.066 .090 .090 .090 .090 .090 .090 .090 .090
0. 0086 .0022 .0039 . 0057 .0072 .0078 .0088 .0102 .0118
0.747 . 440 .547 .667 . 720 .733 .773 .820 .827
0. 558 . 194 . 299 . 445 . 518 .537 .598 . 672 .684
0. 263 .067 . 103 . 153 . 179 . 185 .206 . 232 .236
0. 51 . 26 . 32 .39 . 42 . 43 . 45 .48 * 49
64 64 64 64 64 64 64 64 64 -
Sinuosity (thalweg length :valley length) = 1.13.
The following data were not included in the figures or analyses in the present paper because the number of runs in each channel was insufficient to define the relation between slope and square of Froude number. The data are published here for the record.
71 71 71
71 71
71 71
__
72 73 74
75 76
77 78
0.033 . 041 .048
.041
. 060
.078
.093
0.090 .090 .090
. 133 . 133
. 133
. 133
0.066 .066 . 066
.090
. 090
.090
.090
0. 725 .90
1.054
.547
. 80
1. 04 1. 24
0.526 . 81
1.111
0. 248 .382 .525
0. 50 . 62 . 72
0.003 11 .00566 . 0095
.00119
. 00311
. 00566
. 0095
Sinuous channel. Repeating distance 2L=4.00 f t . Amplitude 2A= 1.14 f t . Thalweg length=4.71 ft. Sinuosity (thalweg length: valley
Radius of curvature, r,=1.14 ft. length) = 1.178
. 299 103 .32
. 64 1 : 221 1 . 47
1. 08 1. 54
0