florida oral health workforce statewide needs assessment · pdf fileflorida oral health...
TRANSCRIPT
Florida Oral Health Workforce Statewide Needs Assessment
Prepared for the Florida Department of Health Public Health Dental Program
August 2009
Florida Oral Health Workforce Statewide Needs Assessment Page 2 Institute for Child Health Policy University of Florida
CONTRIBUTORS AND ACKNOWLEDGEMENTS Jill Boylston Herndon, Ph.D. Research Associate Professor Institute for Child Health Policy Department of Epidemiology and Health Policy Research College of Medicine, University of Florida Scott L. Tomar, M.P.H., D.M.D., Dr. P.H. Professor, Department of Community Dentistry and Behavioral Science College of Dentistry, University of Florida June M. Nogle, Ph.D. Research Associate Professor Institute for Child Health Policy Department of Epidemiology and Health Policy Research College of Medicine, University of Florida Diane C. Cowper, Ph.D. Research Health Scientist, Rehabilitation and Outcomes Research Center North Florida/South Georgia Veterans Health System Affiliate Associate Professor, Department of Epidemiology and Health Policy Research College of Medicine, University of Florida Briony Tatem, M.S. Research Coordinator and GIS Analyst Institute for Child Health Policy Department of Epidemiology and Health Policy Research College of Medicine, University of Florida Elizabeth A. Shenkman, Ph.D. Director, Institute for Child Health Policy Professor and Chair, Department of Epidemiology and Health Policy Research College of Medicine, University of Florida The authors thank Jingqin Zhu (Institute for Child Health Policy) for her excellent programming assistance and Eric Litt (North Florida/South Georgia Veterans Health System) for his expertise in GIS analysis and map preparation. We gratefully acknowledge the following agencies for their support and provision of data and information: The Florida Agency for Health Care Administration The Florida Department of Health The Florida Healthy Kids Corporation The University of Florida Bureau of Economic and Business Research
Florida Oral Health Workforce Statewide Needs Assessment Page 3 Institute for Child Health Policy University of Florida
I. INTRODUCTION The 2000 U.S. Surgeon General’s report on Oral Health in America created increased awareness about the oral health burden and oral health disparities in the United States and issued a call to action to promote greater access to oral health care.1 Since then, the state of Florida has undertaken several initiatives to promote oral health. In 2004, the Florida Department of Health’s (DOH) Public Health Dental Program established the Oral Health Florida Coalition to develop a State Oral Health Improvement Plan for Disadvantaged Persons. The coalition includes participants from public and professional organizations, government agencies, and universities. One of the key recommendations of the plan was to ensure a well-trained, diverse, and appropriately distributed dental workforce. In 2008, Florida’s State Surgeon General established an Oral Healthcare Workforce Ad Hoc Advisory Committee to advise the Governor on dental workforce issues. One outcome of these initiatives was the recognition that state-specific data about access to oral health care among disadvantaged and vulnerable populations are lacking. In 2008, the DOH successfully applied for funding from the Health Resources and Services Administration to continue the work of the SOHIP and Ad Hoc Workforce Committee to develop a statewide oral health workforce strategic plan (T12HP10686-01-00 Grants to Support Oral Health Workforce Activities). The planning process includes conducting a statewide oral health workforce needs assessment designed to provide additional data about access to oral health among disadvantaged and vulnerable populations. The Florida DOH contracted with the Institute for Child Health Policy (ICHP) and Department of Community Dentistry and Behavioral Science at the University of Florida to conduct this needs assessment. There are two main objectives of the needs assessment. The first is to conduct a statewide analysis of Florida’s oral health workforce relative to traditionally underserved populations. To do so, this report examines (a) the distribution and composition of the dental workforce in Florida’s sixty-seven counties, (b) variations in the oral health workforce distribution by county urban/rural status, and (c) variations in the oral health workforce distribution by economic and demographic county population characteristics. The second objective is to evaluate access to dental care among low-income children, including children with special health care needs (CSHCN), in Florida’s Medicaid and SCHIP programs and to identify the child and family characteristics that are associated with better access. To do so, this report examines (a) the percentage of low-income children who had a dental visit during state fiscal year 2006-2007 and (b) variations in dental visits by the children’s socio-demographic and health characteristics.
Florida Oral Health Workforce Statewide Needs Assessment Page 4 Institute for Child Health Policy University of Florida
II. STATEWIDE ANALYSIS OF THE ORAL HEALTH WORKFORCE DISTRIBUTION A. Data Sources To illustrate recent changes in the distribution and density of the oral health workforce, we obtained county-level data on the workforce-to-population ratio for census year 2000 and for 2007, the most recent year for which population data were available. The following data sources and measures were used: 1. Population Data. Population data were obtained from the University of Florida Bureau of
Economic and Business Research’s (BEBR) Florida Statistical Abstract and Florida Estimates of Population.2,3 Population data include statewide and county population totals for 2000 and 2007. Population data by race and ethnicity also were obtained for 2007.
2. Income Indicators. County-level median household income data for 2007 were obtained from the
U.S. Census Bureau’s Small Area Income and Poverty Estimates.4 3. Rural and Urban Classification. For statistical analyses that used a rural/urban dichotomous
classification, we used the definition used by the Florida DOH Office of Rural Health as provided for in the Florida Statutes: “an area with a population density of less than 100 individuals per square mile or an area defined by the most recent United States Census” (Chapter 381.0406, Florida Statutes). Using this definition, the following thirty-three counties were classified as rural: Baker, Bradford, Calhoun, Columbia, DeSoto, Dixie, Franklin, Gadsden, Gilchrist, Glades, Gulf, Hamilton, Hardee, Hendry, Highlands, Holmes, Jackson, Jefferson, Lafayette, Levy, Liberty, Madison, Monroe, Nassau, Okeechobee, Putnam, Sumter, Suwanee, Taylor, Union, Wakulla, Walton, and Washington.5 To depict the degree of urbanization for mapping purposes, counties were identified on a rural-urban continuum using the National Center for Health Statistics Urban-Rural Classification Scheme for Counties.6 The NCHS has a six-level urban-rural classification scheme: (1) large central metro, (2) large fringe metro, (3) medium metro, (4) small metro, (5) micropolitan, and (6) noncore.
4. Oral Health Workforce. Data on the number of active licensed dentists and dental hygienists by
county for 2007 were obtained from the Florida DOH Public Health Dental Program. Data for 2000 were obtained from the BEBR Florida Statistical Abstract.
5. Public Oral Health Workforce and Safety Net Providers. We obtained data on public health
dentists and dental hygienists from the membership directories of the American Association of Public Health Dentistry, Oral Health Section of the American Public Health Association, American Dental Association (members identifying public health dentistry as their area of specialization), and the Oral Health Section of the Florida Public Health Association. The DOH Public Health Dental Program provided information about Florida’s dental health professional shortage areas (DHPSAs) and county health department dental clinics. Data on Federally Qualified Health Centers was obtained from the Florida Association of Community Health Centers website, which is current as of 2008.7 Any main center or satellite that had dental or oral health services listed in the “services provided” description for each center was included. The FACHC noted that this list may be incomplete because they may not receive timely feedback from all of their members. Data on the number and location of dental education programs (e.g., DMD/DDS, dental hygiene, and pediatric dentistry residency programs) were obtained from the American Dental Association.8
Florida Oral Health Workforce Statewide Needs Assessment Page 5 Institute for Child Health Policy University of Florida
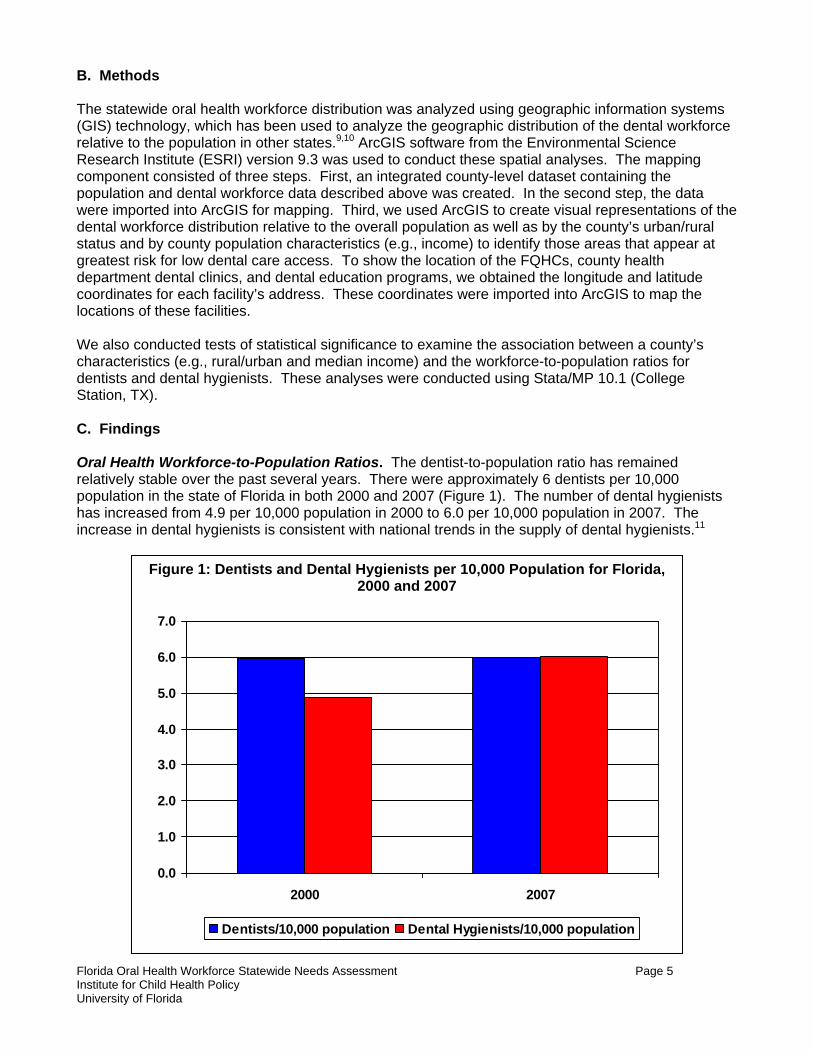
B. Methods The statewide oral health workforce distribution was analyzed using geographic information systems (GIS) technology, which has been used to analyze the geographic distribution of the dental workforce relative to the population in other states.9,10 ArcGIS software from the Environmental Science Research Institute (ESRI) version 9.3 was used to conduct these spatial analyses. The mapping component consisted of three steps. First, an integrated county-level dataset containing the population and dental workforce data described above was created. In the second step, the data were imported into ArcGIS for mapping. Third, we used ArcGIS to create visual representations of the dental workforce distribution relative to the overall population as well as by the county’s urban/rural status and by county population characteristics (e.g., income) to identify those areas that appear at greatest risk for low dental care access. To show the location of the FQHCs, county health department dental clinics, and dental education programs, we obtained the longitude and latitude coordinates for each facility’s address. These coordinates were imported into ArcGIS to map the locations of these facilities. We also conducted tests of statistical significance to examine the association between a county’s characteristics (e.g., rural/urban and median income) and the workforce-to-population ratios for dentists and dental hygienists. These analyses were conducted using Stata/MP 10.1 (College Station, TX). C. Findings Oral Health Workforce-to-Population Ratios. The dentist-to-population ratio has remained relatively stable over the past several years. There were approximately 6 dentists per 10,000 population in the state of Florida in both 2000 and 2007 (Figure 1). The number of dental hygienists has increased from 4.9 per 10,000 population in 2000 to 6.0 per 10,000 population in 2007. The increase in dental hygienists is consistent with national trends in the supply of dental hygienists.11
Figure 1: Dentists and Dental Hygienists per 10,000 Population for Florida, 2000 and 2007
0.0
1.0
2.0
3.0
4.0
5.0
6.0
7.0
2000 2007
Dentists/10,000 population Dental Hygienists/10,000 population
Florida Oral Health Workforce Statewide Needs Assessment Page 6 Institute for Child Health Policy University of Florida
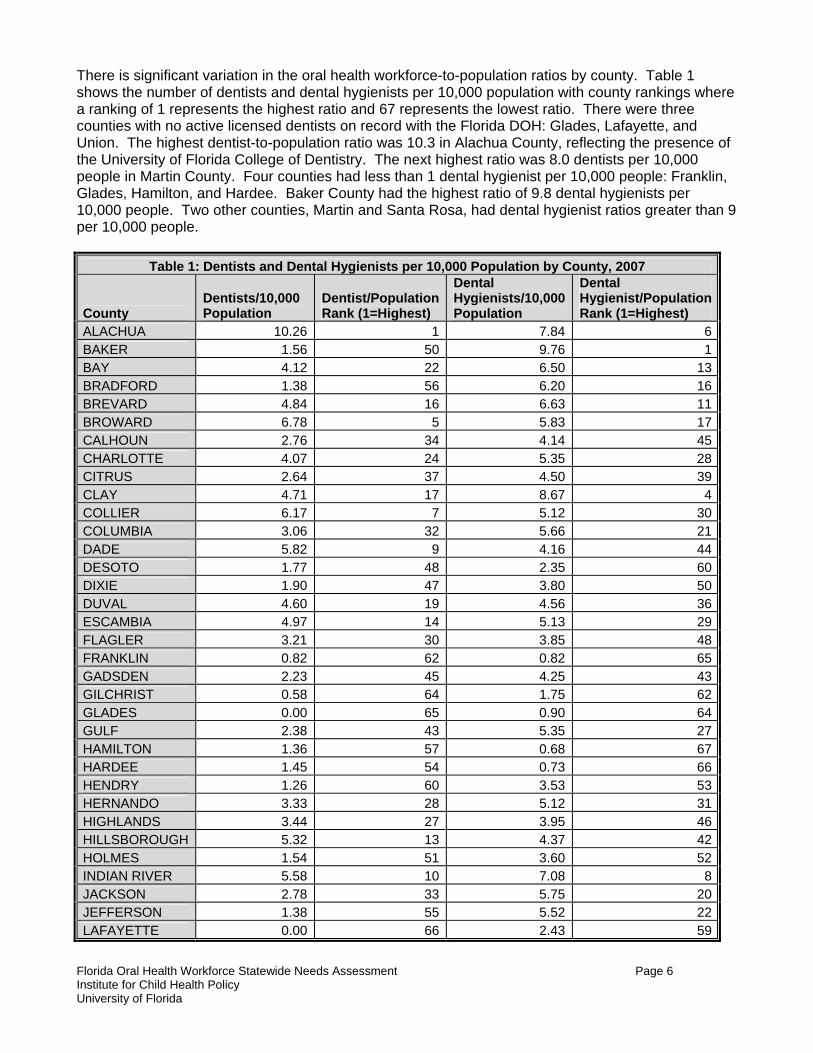
There is significant variation in the oral health workforce-to-population ratios by county. Table 1 shows the number of dentists and dental hygienists per 10,000 population with county rankings where a ranking of 1 represents the highest ratio and 67 represents the lowest ratio. There were three counties with no active licensed dentists on record with the Florida DOH: Glades, Lafayette, and Union. The highest dentist-to-population ratio was 10.3 in Alachua County, reflecting the presence of the University of Florida College of Dentistry. The next highest ratio was 8.0 dentists per 10,000 people in Martin County. Four counties had less than 1 dental hygienist per 10,000 people: Franklin, Glades, Hamilton, and Hardee. Baker County had the highest ratio of 9.8 dental hygienists per 10,000 people. Two other counties, Martin and Santa Rosa, had dental hygienist ratios greater than 9 per 10,000 people.
Table 1: Dentists and Dental Hygienists per 10,000 Population by County, 2007
County Dentists/10,000 Population
Dentist/Population Rank (1=Highest)
Dental Hygienists/10,000 Population
Dental Hygienist/Population Rank (1=Highest)
ALACHUA 10.26 1 7.84 6BAKER 1.56 50 9.76 1BAY 4.12 22 6.50 13BRADFORD 1.38 56 6.20 16BREVARD 4.84 16 6.63 11BROWARD 6.78 5 5.83 17CALHOUN 2.76 34 4.14 45CHARLOTTE 4.07 24 5.35 28CITRUS 2.64 37 4.50 39CLAY 4.71 17 8.67 4COLLIER 6.17 7 5.12 30COLUMBIA 3.06 32 5.66 21DADE 5.82 9 4.16 44DESOTO 1.77 48 2.35 60DIXIE 1.90 47 3.80 50DUVAL 4.60 19 4.56 36ESCAMBIA 4.97 14 5.13 29FLAGLER 3.21 30 3.85 48FRANKLIN 0.82 62 0.82 65GADSDEN 2.23 45 4.25 43GILCHRIST 0.58 64 1.75 62GLADES 0.00 65 0.90 64GULF 2.38 43 5.35 27HAMILTON 1.36 57 0.68 67HARDEE 1.45 54 0.73 66HENDRY 1.26 60 3.53 53HERNANDO 3.33 28 5.12 31HIGHLANDS 3.44 27 3.95 46HILLSBOROUGH 5.32 13 4.37 42HOLMES 1.54 51 3.60 52INDIAN RIVER 5.58 10 7.08 8JACKSON 2.78 33 5.75 20JEFFERSON 1.38 55 5.52 22LAFAYETTE 0.00 66 2.43 59

Florida Oral Health Workforce Statewide Needs Assessment Page 7 Institute for Child Health Policy University of Florida
Table 1: Dentists and Dental Hygienists per 10,000 Population by County, 2007
County Dentists/10,000 Population
Dentist/Population Rank (1=Highest)
Dental Hygienists/10,000 Population
Dental Hygienist/Population Rank (1=Highest)
LAKE 3.66 26 5.38 26LEE 4.21 20 5.41 24LEON 4.18 21 5.75 19LEVY 2.25 44 3.50 54LIBERTY 1.29 59 3.86 47MADISON 1.50 53 3.01 57MANATEE 4.62 18 6.43 14MARION 3.26 29 5.38 25MARTIN 8.00 2 9.04 3MONROE 3.92 25 4.68 33NASSAU 2.73 36 7.62 7OKALOOSA 5.34 12 5.09 32OKEECHOBEE 2.56 38 6.66 9ORANGE 4.96 15 4.50 38OSCEOLA 2.10 46 2.63 58PALM BEACH 7.47 3 6.59 12PASCO 2.76 35 4.44 40PINELLAS 6.14 8 6.64 10POLK 2.39 42 3.67 51PUTNAM 1.74 49 3.34 55SANTA ROSA 3.17 31 9.15 2SARASOTA 6.84 4 6.40 15SEMINOLE 5.50 11 5.78 18ST. JOHNS 6.32 6 7.88 5ST. LUCIE 2.46 40 4.67 34SUMTER 0.67 63 1.56 63SUWANNEE 1.51 52 4.54 37TAYLOR 1.33 58 2.22 61UNION 0.00 67 3.82 49VOLUSIA 4.11 23 5.45 23WAKULLA 1.02 61 4.42 41WALTON 2.45 41 3.33 56WASHINGTON 2.53 39 4.64 35
Using the GIS software, we classified counties into quartiles based on their workforce-to-population ratios. Map 1 provides a visual representation of the distribution of dentists by quartiles. The following counties were in the lowest quartile with dentists per 10,000 population ratios of less than 1.55: Bradford, Franklin, Gilchrist, Glades, Hamilton, Hardee, Hendry, Holmes, Jefferson, Lafayette, Liberty, Madison, Sumter, Suwanee, Taylor, Union, and Wakulla. Map 2 shows the distribution of dental hygienists by quartiles. The following counties were in the lowest quartile with dental hygienists per 10,000 population ratios of 3.67 or less: DeSoto, Franklin, Gilchrist, Glades, Hamilton, Hardee, Hendry, Holmes, Lafayette, Levy, Madison, Osceola, Polk, Putnam, Sumter, Taylor, and Walton.

Florida Oral Health Workforce Statewide Needs Assessment Page 8 Institute for Child Health Policy University of Florida
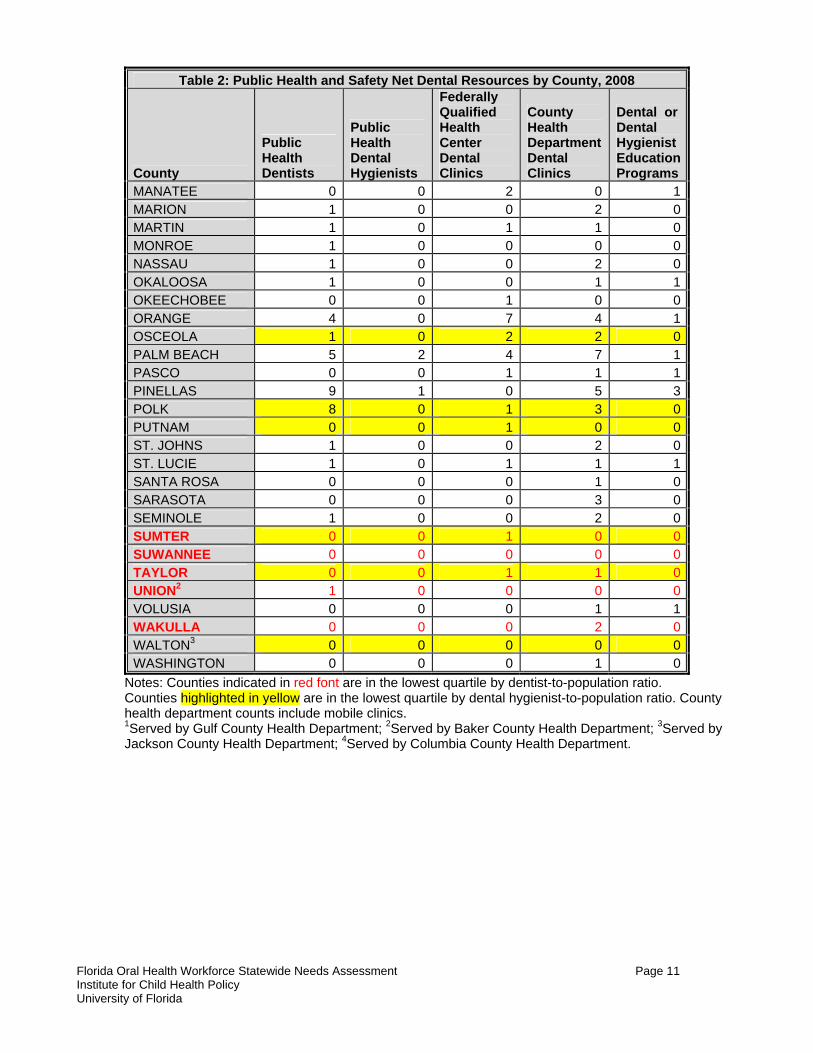
Oral Health Workforce Distribution by Dental Health Professional Shortage Areas. Health Professional Shortage Areas (HPSAs) are designated by the Health Resources and Services Administration within the U.S. Department of Health and Human Services as having a shortage of health care personnel (primary care, dental, or mental health).12 A HPSA can be a geographic area (e.g., a county), a population group within an area (e.g., low-income individuals or migrant workers), or a health care facility (e.g., a rural health clinic). Any agency or individual may apply for a HPSA designation for a geographic area, population group, or facility; however, most designation requests are submitted by state primary care offices. Although there are some concerns with the methodology used to designate HPSAs, these designations are widely used by federal programs to allocate resources or provide benefits.13 Maps 3 and 4 overlay the counties in the highest and lowest quartiles of the oral health workforce-to-population ratios onto maps prepared by the Florida Department of Health’s Office of Professional Recruitment that show each county’s federal dental HPSA (DHPSA) designation status. A special population designation for a whole county or part of a county indicates that there is a shortage of providers to meet the dental needs of low income, migrant, or other special populations.14 All of the counties that are in the lowest quartile of dentist-to-population ratios and dental hygienist-to-population ratios are also in counties designated as DHPSA Special Population Whole County areas. Oral Health Workforce Distribution by Population Characteristics. Populations that have traditionally experienced a greater burden of oral health disease include those living in rural areas and those with lower incomes. Therefore, we examined the association of counties’ urban/rural status and household median income with their oral health workforce-to-population ratios. Map 5 shows counties in the highest and lowest quartiles of the dentist-to-population ratios relative to the county’s degree of urbanization. All of the 17 counties that were in the lowest quartile are rural counties using the Florida DOH Office of Rural Health definition. Moreover, none of the rural counties were in the upper quartile. Fifteen of the 17 counties in the lowest quartile for dental hygienists were rural counties (Map 6). We also conducted statistical tests of association between county characteristics and workforce-to-population ratios. We used Wilcoxon-Mann-Whitney tests to compare the ratios for urban and rural counties. Rural counties had statistically significant fewer dentists and dental hygienists per 10,000 population than did urban counties (p<.0001). Maps 7 and 8 provide analogous information for low-income counties. Low-income counties were defined as those in the bottom quartile for median household income (median household income below $36,979). Seven of the counties with the lowest dentist-to-population (Franklin, Hamilton, Hardee, Holmes, Lafayette, Liberty, and Suwanee) and eight of the counties with the lowest dental hygienist-to-population ratios (DeSoto, Franklin, Hamilton, Hardee, Holmes, Lafayette, Levy, and Putnam) were also counties in the lowest median household income quartile. These same counties also are rural counties. We used the Spearman rank correlation coefficient to test the association between a county’s median household income and its oral health workforce supply. The correlation coefficient was 0.6384 (p<.0001) for dentists and 0.5865 (p<.0001) for dental hygienists, indicating a moderately strong association between a county’s household median income and its oral health workforce supply. Maps 9-14 summarize the workforce distribution relative to different racial and ethnic groups as a percentage of the county population. Using the Spearman rank correlation coefficient, we found modest, positive correlation of 0.2395 (p=.05) between the dentist supply and the percentage of the population that is Hispanic and a similar correlation of 0.2518 between the dental hygienist supply and the percentage of the population that is non-Hispanic white (p=0.04). We also examined the presence of the public health providers and other types of safety net providers. Table 2 and Maps 15-17 summarize the availability of these resources by county. For the purposes of
Florida Oral Health Workforce Statewide Needs Assessment Page 9 Institute for Child Health Policy University of Florida
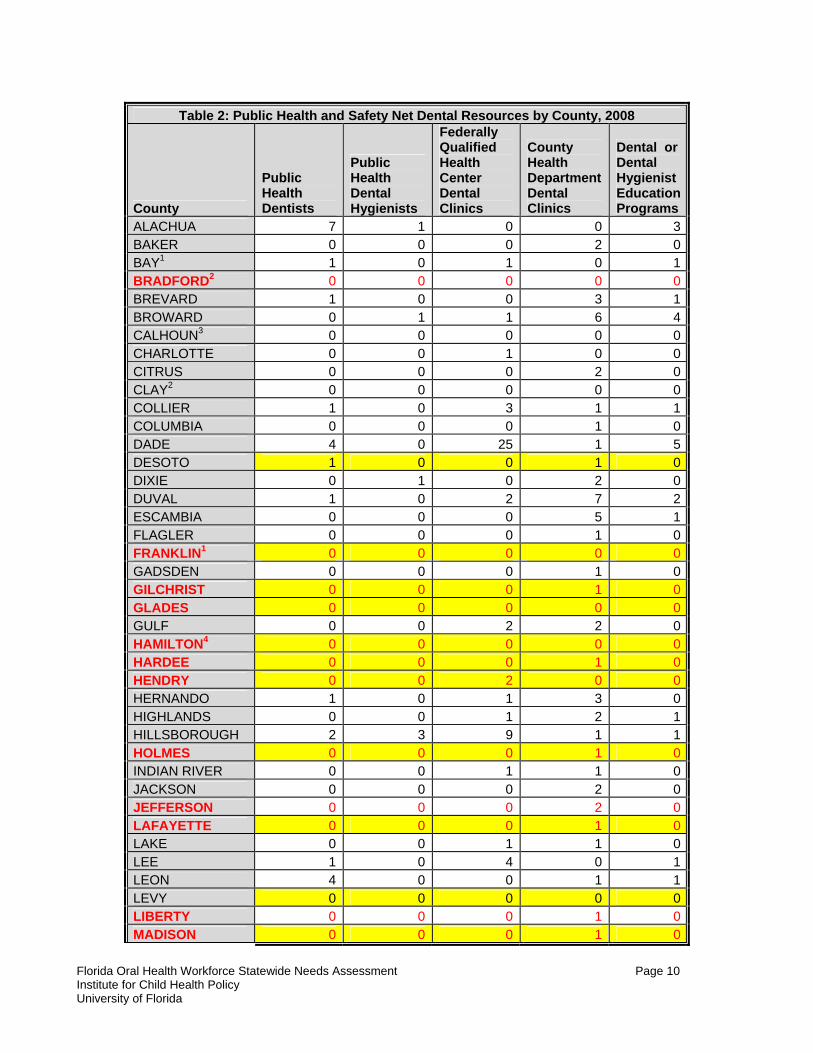
this analysis, public health dentists and hygienists are defined as those who have graduate education in public health. Because it is difficult to identify the graduate training of oral health professionals, we identified public health dentists and dental hygienists as those who are members of the American Association of Public Health Dentistry, Oral Health Section of the American Public Health Association, American Dental Association (members identifying public health dentistry as their area of specialization), and the Oral Health Section of the Florida Public Health Association. This measurement yielded 60 public health dentists and 9 public health hygienists statewide. This is likely a conservative estimate because of the difficulty in identifying public health dentists and dental hygienists. We also examined whether a county had a federally qualified health center with dental services, county health department dental clinic, and/or a dental or dental hygiene education programs. Education programs were included because they frequently provide care for underserved and vulnerable populations. Counties also may have other safety net providers of oral health services, but we did not have systematic data on these other types of safety net providers by county. To facilitate comparison with the workforce-to-population ratios, counties in the lowest quartile of dentist-population ratios are indicated in red font in Table 2 and those in the lowest quartile of dental hygienist-population ratios are highlighted in yellow. Most counties in the lowest workforce-to-population ratios had at least one form of public health provider or safety net resource among those that we identified. However, Glades County, which is in the lowest quartile for both dentist and dental hygienist workforce-to-population ratios, did not have any of these key public health resources. Glades County is a rural county and the third smallest county by population (11,055). Residents in this area may access dental care in neighboring counties or receive care from other types of safety net providers. Public health insurance that includes dental benefits also plays an important role in providing access to care for low-income populations, particularly children. To better understand access to dental services among publicly insured populations, publicly insured children’s receipt of dental services is examined in Section III of this report.
Florida Oral Health Workforce Statewide Needs Assessment Page 10 Institute for Child Health Policy University of Florida
Table 2: Public Health and Safety Net Dental Resources by County, 2008
County
Public Health Dentists
Public Health Dental Hygienists
Federally Qualified Health Center Dental Clinics
County Health Department Dental Clinics
Dental or Dental Hygienist Education Programs
ALACHUA 7 1 0 0 3BAKER 0 0 0 2 0BAY1 1 0 1 0 1BRADFORD2 0 0 0 0 0BREVARD 1 0 0 3 1BROWARD 0 1 1 6 4CALHOUN3 0 0 0 0 0CHARLOTTE 0 0 1 0 0CITRUS 0 0 0 2 0CLAY2 0 0 0 0 0COLLIER 1 0 3 1 1COLUMBIA 0 0 0 1 0DADE 4 0 25 1 5DESOTO 1 0 0 1 0DIXIE 0 1 0 2 0DUVAL 1 0 2 7 2ESCAMBIA 0 0 0 5 1FLAGLER 0 0 0 1 0FRANKLIN1 0 0 0 0 0GADSDEN 0 0 0 1 0GILCHRIST 0 0 0 1 0GLADES 0 0 0 0 0GULF 0 0 2 2 0HAMILTON4 0 0 0 0 0HARDEE 0 0 0 1 0HENDRY 0 0 2 0 0HERNANDO 1 0 1 3 0HIGHLANDS 0 0 1 2 1HILLSBOROUGH 2 3 9 1 1HOLMES 0 0 0 1 0INDIAN RIVER 0 0 1 1 0JACKSON 0 0 0 2 0JEFFERSON 0 0 0 2 0LAFAYETTE 0 0 0 1 0LAKE 0 0 1 1 0LEE 1 0 4 0 1LEON 4 0 0 1 1LEVY 0 0 0 0 0LIBERTY 0 0 0 1 0MADISON 0 0 0 1 0
Florida Oral Health Workforce Statewide Needs Assessment Page 11 Institute for Child Health Policy University of Florida
Table 2: Public Health and Safety Net Dental Resources by County, 2008
County
Public Health Dentists
Public Health Dental Hygienists
Federally Qualified Health Center Dental Clinics
County Health Department Dental Clinics
Dental or Dental Hygienist Education Programs
MANATEE 0 0 2 0 1MARION 1 0 0 2 0MARTIN 1 0 1 1 0MONROE 1 0 0 0 0NASSAU 1 0 0 2 0OKALOOSA 1 0 0 1 1OKEECHOBEE 0 0 1 0 0ORANGE 4 0 7 4 1OSCEOLA 1 0 2 2 0PALM BEACH 5 2 4 7 1PASCO 0 0 1 1 1PINELLAS 9 1 0 5 3POLK 8 0 1 3 0PUTNAM 0 0 1 0 0ST. JOHNS 1 0 0 2 0ST. LUCIE 1 0 1 1 1SANTA ROSA 0 0 0 1 0SARASOTA 0 0 0 3 0SEMINOLE 1 0 0 2 0SUMTER 0 0 1 0 0SUWANNEE 0 0 0 0 0TAYLOR 0 0 1 1 0UNION2 1 0 0 0 0VOLUSIA 0 0 0 1 1WAKULLA 0 0 0 2 0WALTON3 0 0 0 0 0WASHINGTON 0 0 0 1 0
Notes: Counties indicated in red font are in the lowest quartile by dentist-to-population ratio. Counties highlighted in yellow are in the lowest quartile by dental hygienist-to-population ratio. County health department counts include mobile clinics. 1Served by Gulf County Health Department; 2Served by Baker County Health Department; 3Served by Jackson County Health Department; 4Served by Columbia County Health Department.
Florida Oral Health Workforce Statewide Needs Assessment Page 12 Institute for Child Health Policy University of Florida
Discussion The analyses of the geographic distribution of the oral health workforce in Florida indicate that the workforce-to-population ratio is lowest in rural counties and low-income counties with less variation based on the racial and ethnic composition of the population. These findings are consistent with a recent county-level national analysis of the distribution of dentists in the United States that found population to be the strongest predictor of dentists’ location, followed by income.15 Basic economic theory predicts that areas with lower population and lower income will have a lower demand for dental services than more densely populated and higher income areas and, therefore, will attract fewer dental providers. Empirical analyses have long confirmed that there is a positive and significant relationship between a state’s population and per capita income and the number of dentists in the state.16 Sparsely populated and low income areas often lack a sufficient population of patients who are both willing and able to pay for dental services to support a dental practice. However, lack of sufficient demand in rural and low income areas to support a dental practice does not imply the absence of need in that area. Moreover, our measurement of the workforce-to-population ratios should be considered a conservative measurement because we did not have information on the number of hours worked weekly for each actively licensed provider and, therefore, assumed that each provider worked full time (i.e., 1.0 FTE). We also examined the availability of public health dentists and dental hygienists, community health department dental clinics, FQHCs, and dental or dental hygiene education programs. We found that virtually all of the counties in the lowest quartile of workforce-to-population ratios had one of these major types of safety net providers. In addition, vulnerable and disadvantaged populations may be served through other types of community resources not captured in our measurements, such as nonprofit organizations and volunteer dental providers. The Florida DOH Public Health Dental Program maintains a website of county dental resources for disadvantaged populations that includes these additional types of safety net providers (http://www.doh.state.fl.us/Family/dental/resources/index.html). The workforce-to-population analyses presented in this report were conducted at the county level. However, even within counties that have high workforce-to-population ratios, there may be subpopulations and areas within those counties that have unmet dental needs and face barriers to care. Although it is beyond the scope of the current project, assessments of unmet dental needs could be conducted in high-risk areas to determine whether the existing public health providers and other community organizations are addressing the oral health care needs of these populations. Such assessments would entail primary data collection in these areas (e.g., community-based surveys of households and oral health providers to evaluate access to and delivery of oral health care services). Areas for which there are significant unmet needs could be addressed through various demand-side and supply-side strategies. Possible strategies include facilitating patient transportation to existing dental clinics or providers, using mobile clinics to reach patients in outlying areas, expanding public coverage of dental services for low-income populations, increasing reimbursement to providers who serve publicly insured populations, and education loan forgiveness for providers who practice in underserved areas. In addition, educating patients about the importance of oral health and preventive care will encourage them to use the available resources. Given budgetary constraints, the expected cost of each strategy considered should be weighed against the expected benefits.
Florida Oral Health Workforce Statewide Needs Assessment Page 13 Institute for Child Health Policy University of Florida
III. CHILDREN’S ACCESS TO DENTAL CARE IN FLORIDA’S MEDICAID & SCHIP PROGRAMS A. Data Sources Under contracts with the Agency for Health Care Administration and the Florida Healthy Kids Corporation, the Institute for Child Health Policy conducts annual evaluations of the Florida KidCare program.17 Florida KidCare provides Medicaid (Title XIX) and SCHIP (Title XXI) coverage to the state’s uninsured children through the following four program components:
1. Medicaid for Children - provides coverage for children birth through age 18 meeting the Title XIX eligibility requirements;
2. MediKids - a “Medicaid look alike” program that provides the equivalent of the Medicaid
benefit package for children ages 1 through 4 with Title XXI funding;
3. Florida Healthy Kids Program - provides health coverage for children ages 5–18 who meet Title XXI eligibility requirements; and
4. Children’s Medical Services Network (CMSN) - provides coverage for children ages 0–18
who have special physical or behavioral health care needs and who are eligible for either Title XIX or Title XXI funding. Children in this program must meet specific medical eligibility criteria.
To carry out these evaluations, the ICHP houses administrative enrollment and claims and encounter data and conducts telephone surveys of families whose children are enrolled in the Florida KidCare Program. These data sources are described below. 1. Medicaid and SCHIP Administrative Enrollment Data. The ICHP houses person-level
administrative enrollment data for Florida’s Medicaid and SCHIP programs. The enrollment files contain information about each child’s monthly program enrollment and length of enrollment as well as such demographic information the child’s age, gender, and place of residence.
2. Healthcare Claims and Encounter Data. The ICHP also houses person-level claims and
encounter data for enrollees in the Florida Healthy Kids Program (SCHIP), the Medicaid Primary Care Case Management Program, and the CMSN-Title XIX enrollees. The claims and encounter data contain Physician’s Current Procedural Terminology (CPT) codes, Current Dental Terminology (CDT) codes, and International Classification of Diseases, 9th Revision (ICD 9-CM) codes, and they provide information about the children’s diagnoses and services rendered. The claims and encounter data were used to identify the children’s dental service utilization and to classify their health status using the Clinical Risk Groups (CRGs).
The CRGs uses ICD-9-CM diagnosis codes from all health care encounters, except those associated with providers known to frequently report unreliable codes (e.g., non-clinician providers and ancillary testing providers), to assign individuals to a hierarchically defined core health status group.18 The CRGs has been tested and validated for identifying children with special health care needs.18,19 Children more than 12 months old must be enrolled for at least six months to be classified. Children less than 12 months old must be enrolled for at least three months to be classified. The CRGs has nine health status categories that were reduced to the following five groups using instructions from the developers: (1) healthy (including non-users of health care services), (2) significant acute conditions (e.g., meningitis and traumatic brain injury), (3) minor chronic conditions (e.g., attention deficit disorder), (4) moderate chronic conditions (e.g., diabetes and depression), and (5) major chronic conditions (e.g., cystic fibrosis, cancer, and
Florida Oral Health Workforce Statewide Needs Assessment Page 14 Institute for Child Health Policy University of Florida
schizophrenia). Children not meeting the minimum enrollment criteria of six months for CRG classification are labeled “unclassified.” Unclassified children include new enrollees and children who cycle in and out of the program.
3. Telephone Surveys. Under contract with the Agency for Health Care Administration, the Institute
for Child Health Policy conducts annual surveys of families whose children are enrolled in Florida KidCare, including children in Medicaid PCCM, Medicaid Managed Care, SCHIP, and the CMSN. These surveys include the Consumer Assessment of Healthcare Providers and Systems (CAHPS, formerly known as the Consumer Assessment of Health Plans Survey). The CAHPS is recommended by the National Commission on Quality Assurance for health plans to use when assessing enrollees’ satisfaction with the health care plan. The CAHPS survey instrument addresses several aspects of care in the six or twelve months preceding the interview, including questions about dental care use. The KidCare Evaluation surveys also include the Children with Special Health Care Needs Screener, an instrument designed to assess whether a child has special health care needs, and questions about the child’s race/ethnicity, age, and gender.
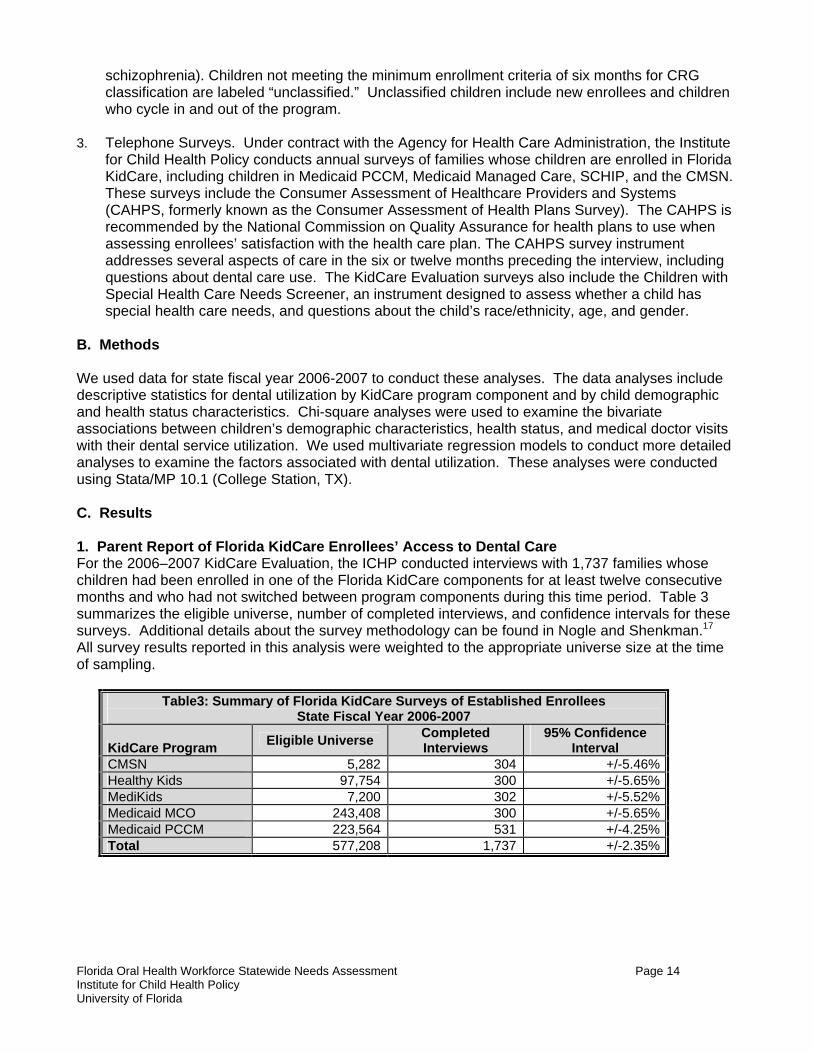
B. Methods We used data for state fiscal year 2006-2007 to conduct these analyses. The data analyses include descriptive statistics for dental utilization by KidCare program component and by child demographic and health status characteristics. Chi-square analyses were used to examine the bivariate associations between children’s demographic characteristics, health status, and medical doctor visits with their dental service utilization. We used multivariate regression models to conduct more detailed analyses to examine the factors associated with dental utilization. These analyses were conducted using Stata/MP 10.1 (College Station, TX). C. Results 1. Parent Report of Florida KidCare Enrollees’ Access to Dental Care For the 2006–2007 KidCare Evaluation, the ICHP conducted interviews with 1,737 families whose children had been enrolled in one of the Florida KidCare components for at least twelve consecutive months and who had not switched between program components during this time period. Table 3 summarizes the eligible universe, number of completed interviews, and confidence intervals for these surveys. Additional details about the survey methodology can be found in Nogle and Shenkman.17 All survey results reported in this analysis were weighted to the appropriate universe size at the time of sampling.
Table3: Summary of Florida KidCare Surveys of Established Enrollees State Fiscal Year 2006-2007
KidCare Program Eligible Universe Completed Interviews
95% Confidence Interval
CMSN 5,282 304 +/-5.46%Healthy Kids 97,754 300 +/-5.65%MediKids 7,200 302 +/-5.52%Medicaid MCO 243,408 300 +/-5.65%Medicaid PCCM 223,564 531 +/-4.25%Total 577,208 1,737 +/-2.35%
Florida Oral Health Workforce Statewide Needs Assessment Page 15 Institute for Child Health Policy University of Florida
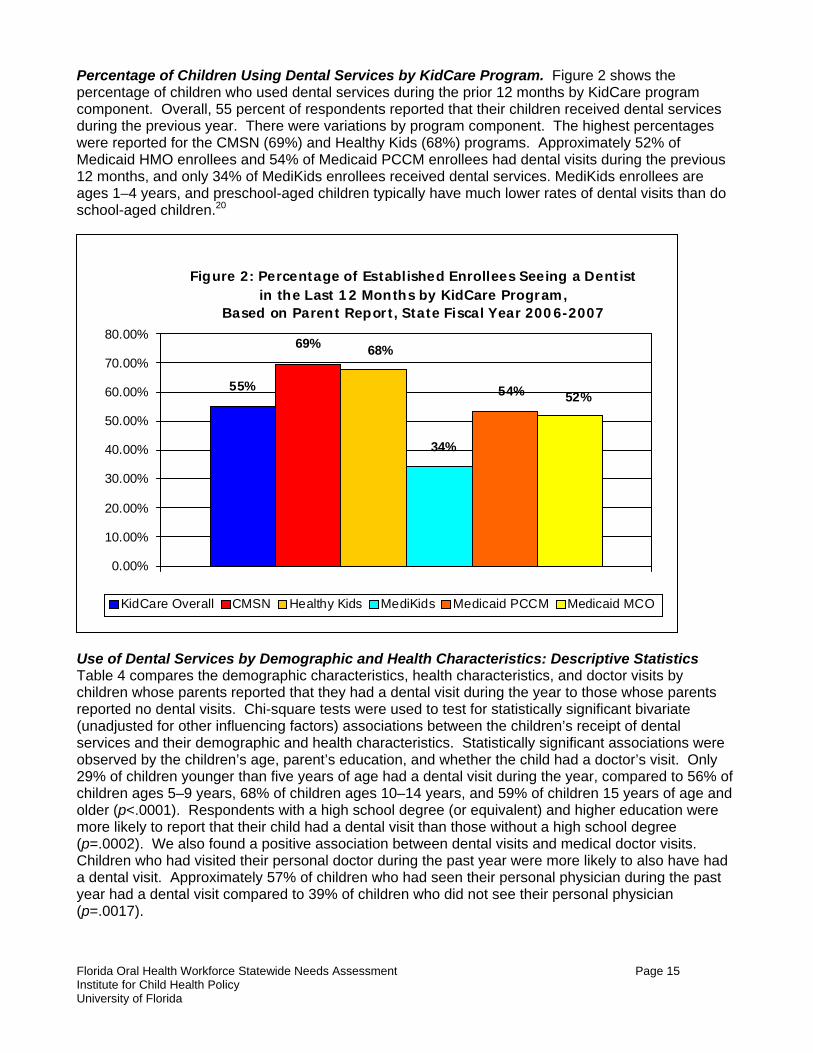
Percentage of Children Using Dental Services by KidCare Program. Figure 2 shows the percentage of children who used dental services during the prior 12 months by KidCare program component. Overall, 55 percent of respondents reported that their children received dental services during the previous year. There were variations by program component. The highest percentages were reported for the CMSN (69%) and Healthy Kids (68%) programs. Approximately 52% of Medicaid HMO enrollees and 54% of Medicaid PCCM enrollees had dental visits during the previous 12 months, and only 34% of MediKids enrollees received dental services. MediKids enrollees are ages 1–4 years, and preschool-aged children typically have much lower rates of dental visits than do school-aged children.20
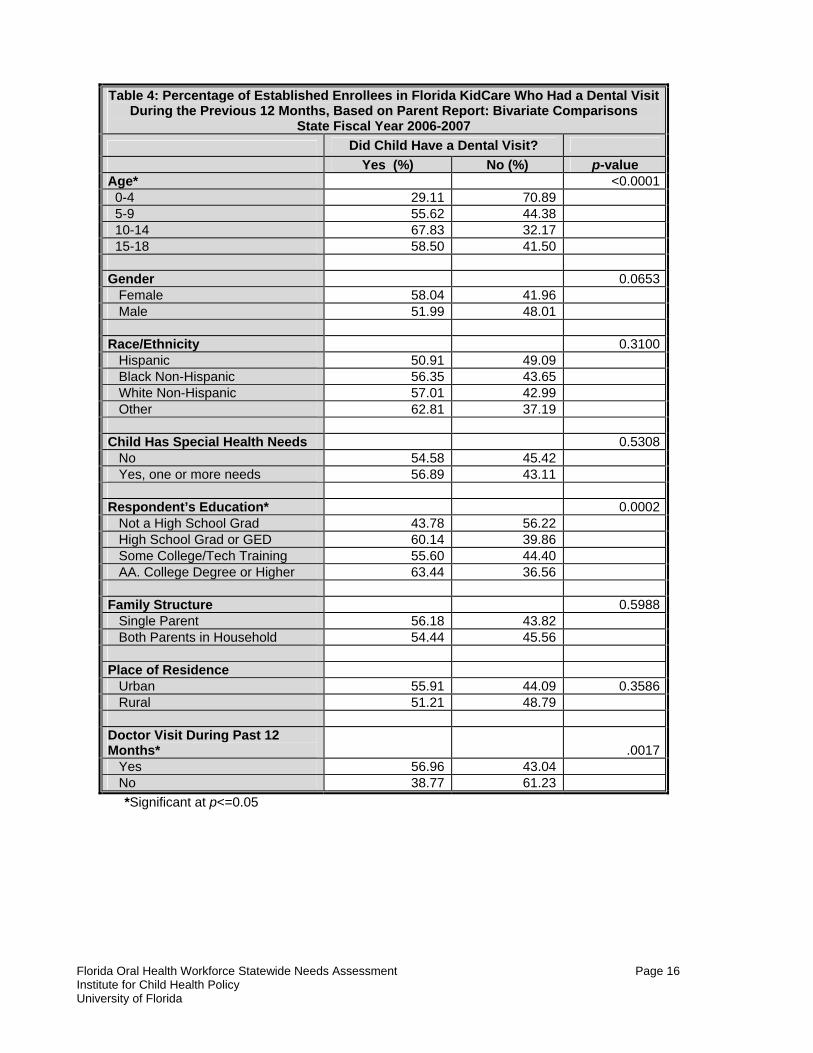
Use of Dental Services by Demographic and Health Characteristics: Descriptive Statistics Table 4 compares the demographic characteristics, health characteristics, and doctor visits by children whose parents reported that they had a dental visit during the year to those whose parents reported no dental visits. Chi-square tests were used to test for statistically significant bivariate (unadjusted for other influencing factors) associations between the children’s receipt of dental services and their demographic and health characteristics. Statistically significant associations were observed by the children’s age, parent’s education, and whether the child had a doctor’s visit. Only 29% of children younger than five years of age had a dental visit during the year, compared to 56% of children ages 5–9 years, 68% of children ages 10–14 years, and 59% of children 15 years of age and older (p<.0001). Respondents with a high school degree (or equivalent) and higher education were more likely to report that their child had a dental visit than those without a high school degree (p=.0002). We also found a positive association between dental visits and medical doctor visits. Children who had visited their personal doctor during the past year were more likely to also have had a dental visit. Approximately 57% of children who had seen their personal physician during the past year had a dental visit compared to 39% of children who did not see their personal physician (p=.0017).
Figure 2: Percentage of Established Enrollees Seeing a Dentist in the Last 12 Months by KidCare Program,
Based on Parent Report, State Fiscal Year 2006-2007
55%
69% 68%
34%
54% 52%
0.00%
10.00%
20.00%
30.00%
40.00%
50.00%
60.00%
70.00%
80.00%
KidCare Overall CMSN Healthy Kids MediKids Medicaid PCCM Medicaid MCO
Florida Oral Health Workforce Statewide Needs Assessment Page 16 Institute for Child Health Policy University of Florida
Table 4: Percentage of Established Enrollees in Florida KidCare Who Had a Dental Visit
During the Previous 12 Months, Based on Parent Report: Bivariate Comparisons State Fiscal Year 2006-2007
Did Child Have a Dental Visit? Yes (%) No (%) p-value Age* <0.0001 0-4 29.11 70.89 5-9 55.62 44.38 10-14 67.83 32.17 15-18 58.50 41.50 Gender 0.0653 Female 58.04 41.96 Male 51.99 48.01 Race/Ethnicity 0.3100 Hispanic 50.91 49.09 Black Non-Hispanic 56.35 43.65 White Non-Hispanic 57.01 42.99 Other 62.81 37.19 Child Has Special Health Needs 0.5308 No 54.58 45.42 Yes, one or more needs 56.89 43.11 Respondent’s Education* 0.0002 Not a High School Grad 43.78 56.22 High School Grad or GED 60.14 39.86 Some College/Tech Training 55.60 44.40 AA. College Degree or Higher 63.44 36.56 Family Structure 0.5988 Single Parent 56.18 43.82 Both Parents in Household 54.44 45.56 Place of Residence Urban 55.91 44.09 0.3586 Rural 51.21 48.79 Doctor Visit During Past 12 Months* .0017 Yes 56.96 43.04 No 38.77 61.23
*Significant at p<=0.05
Florida Oral Health Workforce Statewide Needs Assessment Page 17 Institute for Child Health Policy University of Florida
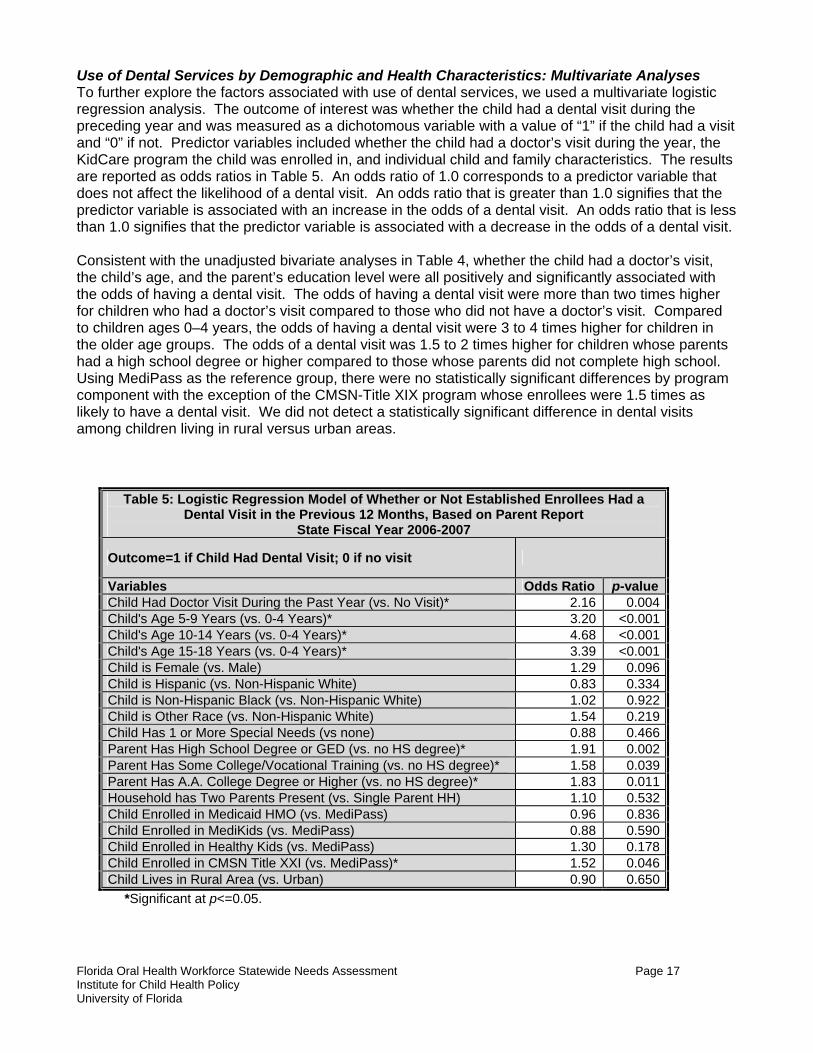
Use of Dental Services by Demographic and Health Characteristics: Multivariate Analyses To further explore the factors associated with use of dental services, we used a multivariate logistic regression analysis. The outcome of interest was whether the child had a dental visit during the preceding year and was measured as a dichotomous variable with a value of “1” if the child had a visit and “0” if not. Predictor variables included whether the child had a doctor’s visit during the year, the KidCare program the child was enrolled in, and individual child and family characteristics. The results are reported as odds ratios in Table 5. An odds ratio of 1.0 corresponds to a predictor variable that does not affect the likelihood of a dental visit. An odds ratio that is greater than 1.0 signifies that the predictor variable is associated with an increase in the odds of a dental visit. An odds ratio that is less than 1.0 signifies that the predictor variable is associated with a decrease in the odds of a dental visit. Consistent with the unadjusted bivariate analyses in Table 4, whether the child had a doctor’s visit, the child’s age, and the parent’s education level were all positively and significantly associated with the odds of having a dental visit. The odds of having a dental visit were more than two times higher for children who had a doctor’s visit compared to those who did not have a doctor’s visit. Compared to children ages 0–4 years, the odds of having a dental visit were 3 to 4 times higher for children in the older age groups. The odds of a dental visit was 1.5 to 2 times higher for children whose parents had a high school degree or higher compared to those whose parents did not complete high school. Using MediPass as the reference group, there were no statistically significant differences by program component with the exception of the CMSN-Title XIX program whose enrollees were 1.5 times as likely to have a dental visit. We did not detect a statistically significant difference in dental visits among children living in rural versus urban areas.
Table 5: Logistic Regression Model of Whether or Not Established Enrollees Had a Dental Visit in the Previous 12 Months, Based on Parent Report
State Fiscal Year 2006-2007
Outcome=1 if Child Had Dental Visit; 0 if no visit
Variables Odds Ratio p-valueChild Had Doctor Visit During the Past Year (vs. No Visit)* 2.16 0.004Child's Age 5-9 Years (vs. 0-4 Years)* 3.20 <0.001Child's Age 10-14 Years (vs. 0-4 Years)* 4.68 <0.001Child's Age 15-18 Years (vs. 0-4 Years)* 3.39 <0.001Child is Female (vs. Male) 1.29 0.096Child is Hispanic (vs. Non-Hispanic White) 0.83 0.334Child is Non-Hispanic Black (vs. Non-Hispanic White) 1.02 0.922Child is Other Race (vs. Non-Hispanic White) 1.54 0.219Child Has 1 or More Special Needs (vs none) 0.88 0.466Parent Has High School Degree or GED (vs. no HS degree)* 1.91 0.002Parent Has Some College/Vocational Training (vs. no HS degree)* 1.58 0.039Parent Has A.A. College Degree or Higher (vs. no HS degree)* 1.83 0.011Household has Two Parents Present (vs. Single Parent HH) 1.10 0.532Child Enrolled in Medicaid HMO (vs. MediPass) 0.96 0.836Child Enrolled in MediKids (vs. MediPass) 0.88 0.590Child Enrolled in Healthy Kids (vs. MediPass) 1.30 0.178Child Enrolled in CMSN Title XXI (vs. MediPass)* 1.52 0.046Child Lives in Rural Area (vs. Urban) 0.90 0.650
*Significant at p<=0.05.
Florida Oral Health Workforce Statewide Needs Assessment Page 18 Institute for Child Health Policy University of Florida
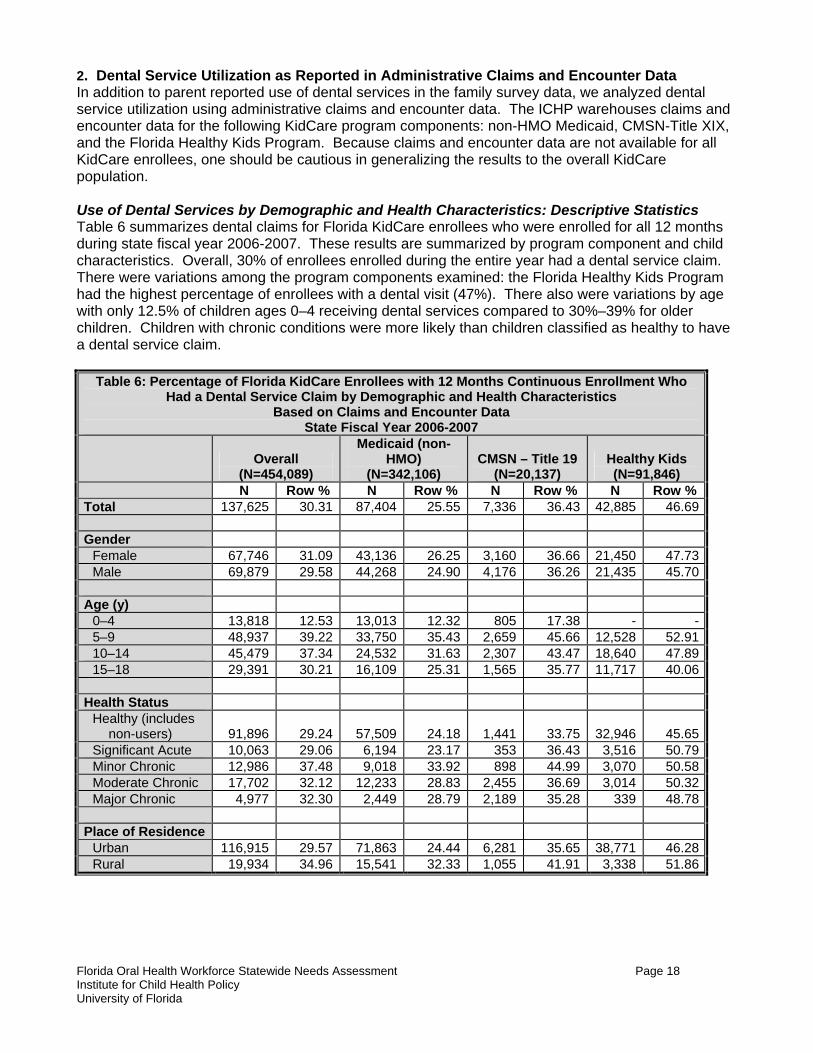
2. Dental Service Utilization as Reported in Administrative Claims and Encounter Data In addition to parent reported use of dental services in the family survey data, we analyzed dental service utilization using administrative claims and encounter data. The ICHP warehouses claims and encounter data for the following KidCare program components: non-HMO Medicaid, CMSN-Title XIX, and the Florida Healthy Kids Program. Because claims and encounter data are not available for all KidCare enrollees, one should be cautious in generalizing the results to the overall KidCare population. Use of Dental Services by Demographic and Health Characteristics: Descriptive Statistics Table 6 summarizes dental claims for Florida KidCare enrollees who were enrolled for all 12 months during state fiscal year 2006-2007. These results are summarized by program component and child characteristics. Overall, 30% of enrollees enrolled during the entire year had a dental service claim. There were variations among the program components examined: the Florida Healthy Kids Program had the highest percentage of enrollees with a dental visit (47%). There also were variations by age with only 12.5% of children ages 0–4 receiving dental services compared to 30%–39% for older children. Children with chronic conditions were more likely than children classified as healthy to have a dental service claim.
Table 6: Percentage of Florida KidCare Enrollees with 12 Months Continuous Enrollment Who Had a Dental Service Claim by Demographic and Health Characteristics
Based on Claims and Encounter Data State Fiscal Year 2006-2007
Overall
(N=454,089)
Medicaid (non-HMO)
(N=342,106) CMSN – Title 19
(N=20,137) Healthy Kids (N=91,846)
N Row % N Row % N Row % N Row % Total 137,625 30.31 87,404 25.55 7,336 36.43 42,885 46.69 Gender Female 67,746 31.09 43,136 26.25 3,160 36.66 21,450 47.73 Male 69,879 29.58 44,268 24.90 4,176 36.26 21,435 45.70 Age (y) 0–4 13,818 12.53 13,013 12.32 805 17.38 - - 5–9 48,937 39.22 33,750 35.43 2,659 45.66 12,528 52.91 10–14 45,479 37.34 24,532 31.63 2,307 43.47 18,640 47.89 15–18 29,391 30.21 16,109 25.31 1,565 35.77 11,717 40.06 Health Status Healthy (includes
non-users) 91,896 29.24 57,509 24.18 1,441 33.75 32,946 45.65 Significant Acute 10,063 29.06 6,194 23.17 353 36.43 3,516 50.79 Minor Chronic 12,986 37.48 9,018 33.92 898 44.99 3,070 50.58 Moderate Chronic 17,702 32.12 12,233 28.83 2,455 36.69 3,014 50.32 Major Chronic 4,977 32.30 2,449 28.79 2,189 35.28 339 48.78 Place of Residence Urban 116,915 29.57 71,863 24.44 6,281 35.65 38,771 46.28 Rural 19,934 34.96 15,541 32.33 1,055 41.91 3,338 51.86
Florida Oral Health Workforce Statewide Needs Assessment Page 19 Institute for Child Health Policy University of Florida
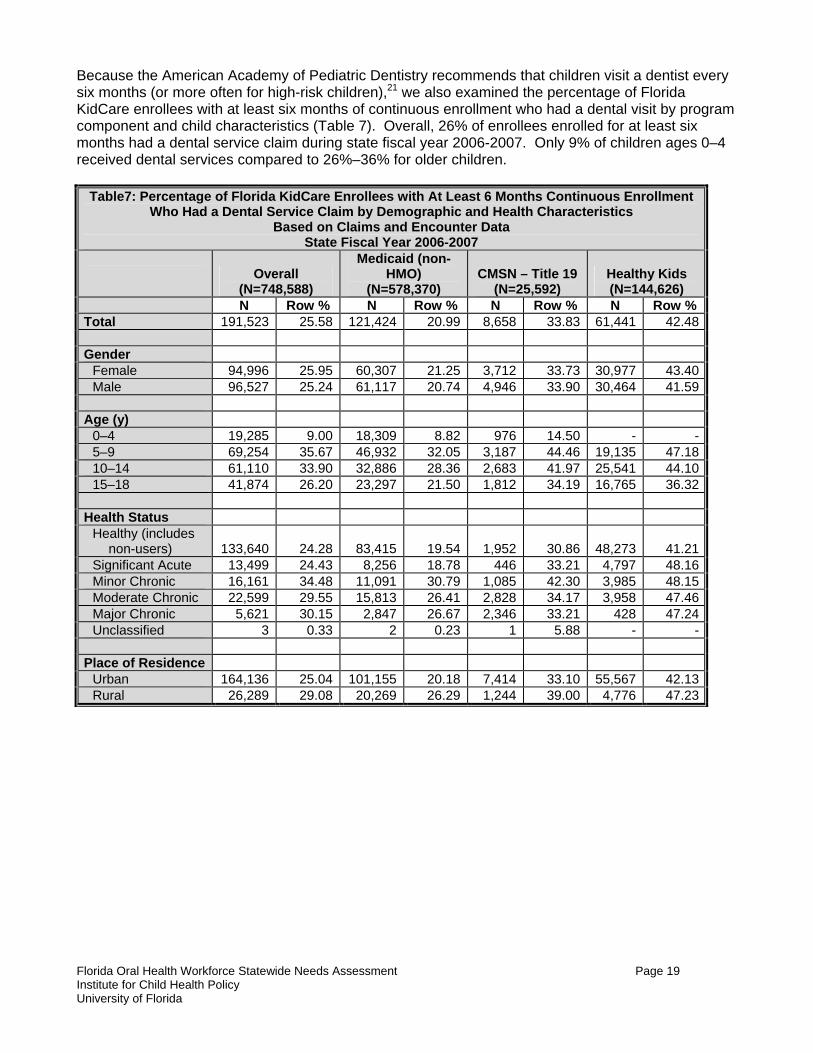
Because the American Academy of Pediatric Dentistry recommends that children visit a dentist every six months (or more often for high-risk children),21 we also examined the percentage of Florida KidCare enrollees with at least six months of continuous enrollment who had a dental visit by program component and child characteristics (Table 7). Overall, 26% of enrollees enrolled for at least six months had a dental service claim during state fiscal year 2006-2007. Only 9% of children ages 0–4 received dental services compared to 26%–36% for older children.
Table7: Percentage of Florida KidCare Enrollees with At Least 6 Months Continuous Enrollment Who Had a Dental Service Claim by Demographic and Health Characteristics
Based on Claims and Encounter Data State Fiscal Year 2006-2007
Overall
(N=748,588)
Medicaid (non-HMO)
(N=578,370) CMSN – Title 19
(N=25,592) Healthy Kids (N=144,626)
N Row % N Row % N Row % N Row % Total 191,523 25.58 121,424 20.99 8,658 33.83 61,441 42.48 Gender Female 94,996 25.95 60,307 21.25 3,712 33.73 30,977 43.40 Male 96,527 25.24 61,117 20.74 4,946 33.90 30,464 41.59 Age (y) 0–4 19,285 9.00 18,309 8.82 976 14.50 - - 5–9 69,254 35.67 46,932 32.05 3,187 44.46 19,135 47.18 10–14 61,110 33.90 32,886 28.36 2,683 41.97 25,541 44.10 15–18 41,874 26.20 23,297 21.50 1,812 34.19 16,765 36.32 Health Status Healthy (includes
non-users) 133,640 24.28 83,415 19.54 1,952 30.86 48,273 41.21 Significant Acute 13,499 24.43 8,256 18.78 446 33.21 4,797 48.16 Minor Chronic 16,161 34.48 11,091 30.79 1,085 42.30 3,985 48.15 Moderate Chronic 22,599 29.55 15,813 26.41 2,828 34.17 3,958 47.46 Major Chronic 5,621 30.15 2,847 26.67 2,346 33.21 428 47.24 Unclassified 3 0.33 2 0.23 1 5.88 - - Place of Residence Urban 164,136 25.04 101,155 20.18 7,414 33.10 55,567 42.13 Rural 26,289 29.08 20,269 26.29 1,244 39.00 4,776 47.23
Florida Oral Health Workforce Statewide Needs Assessment Page 20 Institute for Child Health Policy University of Florida
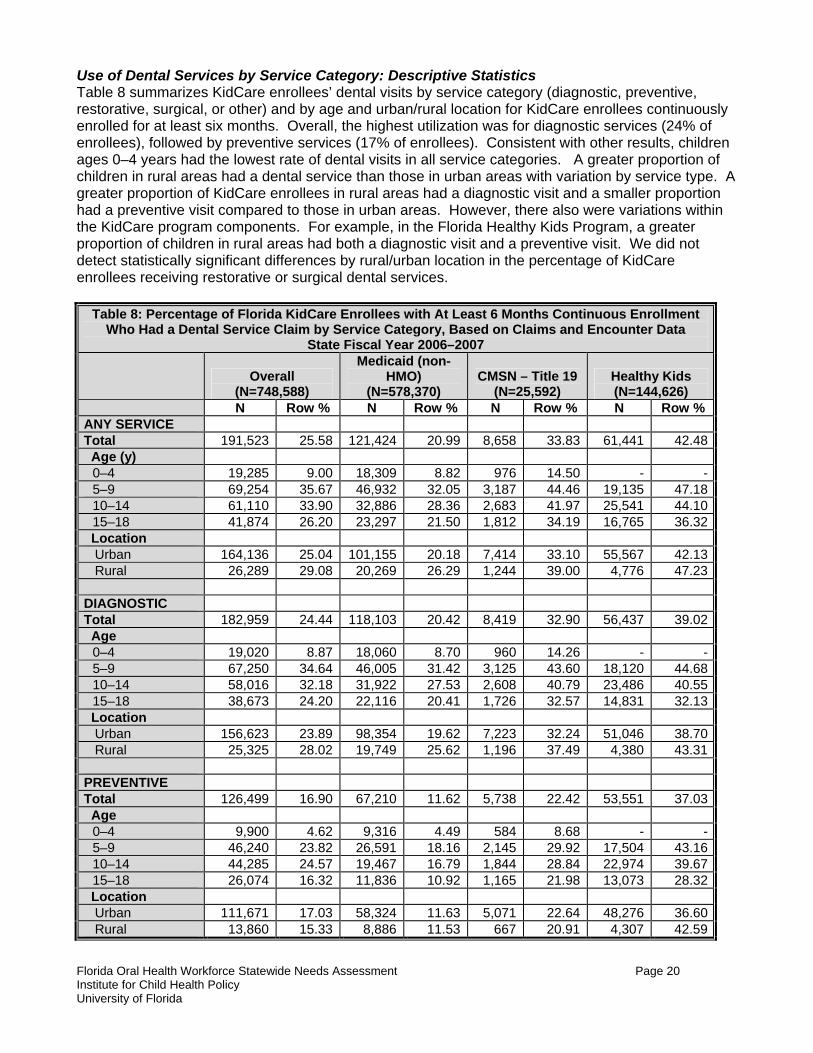
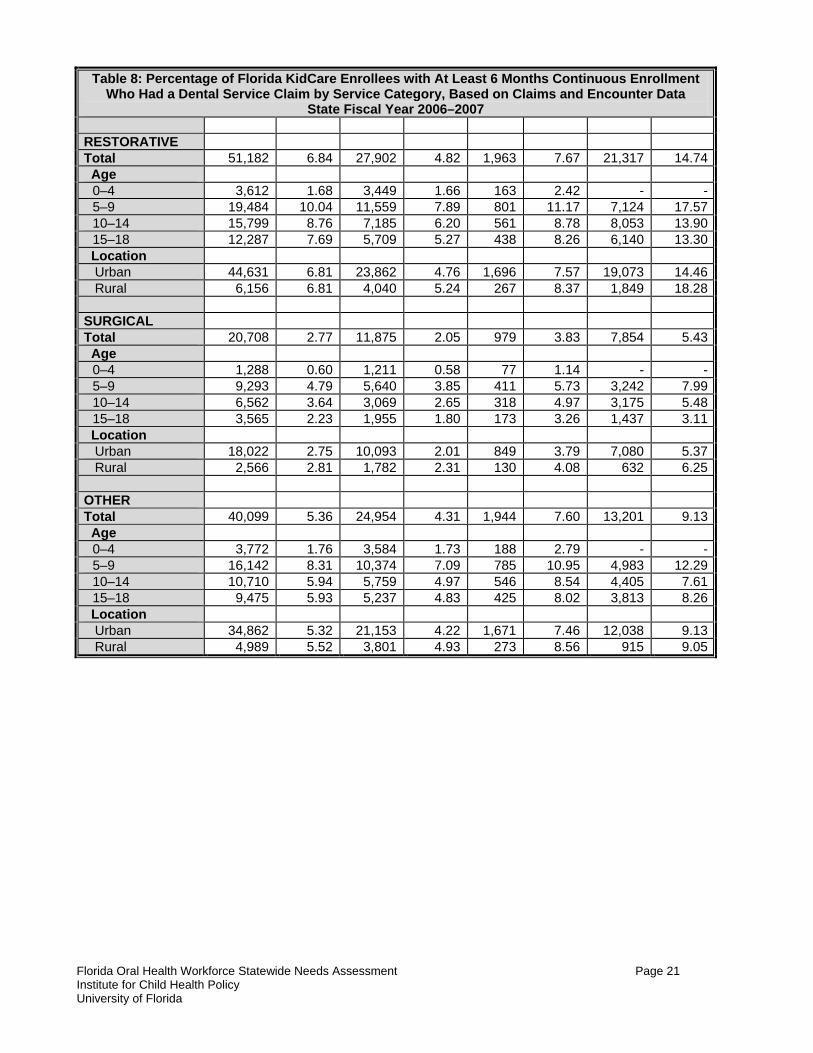
Use of Dental Services by Service Category: Descriptive Statistics Table 8 summarizes KidCare enrollees’ dental visits by service category (diagnostic, preventive, restorative, surgical, or other) and by age and urban/rural location for KidCare enrollees continuously enrolled for at least six months. Overall, the highest utilization was for diagnostic services (24% of enrollees), followed by preventive services (17% of enrollees). Consistent with other results, children ages 0–4 years had the lowest rate of dental visits in all service categories. A greater proportion of children in rural areas had a dental service than those in urban areas with variation by service type. A greater proportion of KidCare enrollees in rural areas had a diagnostic visit and a smaller proportion had a preventive visit compared to those in urban areas. However, there also were variations within the KidCare program components. For example, in the Florida Healthy Kids Program, a greater proportion of children in rural areas had both a diagnostic visit and a preventive visit. We did not detect statistically significant differences by rural/urban location in the percentage of KidCare enrollees receiving restorative or surgical dental services.
Table 8: Percentage of Florida KidCare Enrollees with At Least 6 Months Continuous Enrollment Who Had a Dental Service Claim by Service Category, Based on Claims and Encounter Data
State Fiscal Year 2006–2007
Overall (N=748,588)
Medicaid (non-HMO)
(N=578,370) CMSN – Title 19
(N=25,592) Healthy Kids (N=144,626)
N Row % N Row % N Row % N Row % ANY SERVICE Total 191,523 25.58 121,424 20.99 8,658 33.83 61,441 42.48 Age (y) 0–4 19,285 9.00 18,309 8.82 976 14.50 - - 5–9 69,254 35.67 46,932 32.05 3,187 44.46 19,135 47.18 10–14 61,110 33.90 32,886 28.36 2,683 41.97 25,541 44.10 15–18 41,874 26.20 23,297 21.50 1,812 34.19 16,765 36.32 Location Urban 164,136 25.04 101,155 20.18 7,414 33.10 55,567 42.13 Rural 26,289 29.08 20,269 26.29 1,244 39.00 4,776 47.23 DIAGNOSTIC Total 182,959 24.44 118,103 20.42 8,419 32.90 56,437 39.02 Age 0–4 19,020 8.87 18,060 8.70 960 14.26 - - 5–9 67,250 34.64 46,005 31.42 3,125 43.60 18,120 44.68 10–14 58,016 32.18 31,922 27.53 2,608 40.79 23,486 40.55 15–18 38,673 24.20 22,116 20.41 1,726 32.57 14,831 32.13 Location Urban 156,623 23.89 98,354 19.62 7,223 32.24 51,046 38.70 Rural 25,325 28.02 19,749 25.62 1,196 37.49 4,380 43.31 PREVENTIVE Total 126,499 16.90 67,210 11.62 5,738 22.42 53,551 37.03 Age 0–4 9,900 4.62 9,316 4.49 584 8.68 - - 5–9 46,240 23.82 26,591 18.16 2,145 29.92 17,504 43.16 10–14 44,285 24.57 19,467 16.79 1,844 28.84 22,974 39.67 15–18 26,074 16.32 11,836 10.92 1,165 21.98 13,073 28.32 Location Urban 111,671 17.03 58,324 11.63 5,071 22.64 48,276 36.60 Rural 13,860 15.33 8,886 11.53 667 20.91 4,307 42.59
Florida Oral Health Workforce Statewide Needs Assessment Page 21 Institute for Child Health Policy University of Florida
Table 8: Percentage of Florida KidCare Enrollees with At Least 6 Months Continuous Enrollment Who Had a Dental Service Claim by Service Category, Based on Claims and Encounter Data
State Fiscal Year 2006–2007 RESTORATIVE Total 51,182 6.84 27,902 4.82 1,963 7.67 21,317 14.74 Age 0–4 3,612 1.68 3,449 1.66 163 2.42 - - 5–9 19,484 10.04 11,559 7.89 801 11.17 7,124 17.57 10–14 15,799 8.76 7,185 6.20 561 8.78 8,053 13.90 15–18 12,287 7.69 5,709 5.27 438 8.26 6,140 13.30 Location Urban 44,631 6.81 23,862 4.76 1,696 7.57 19,073 14.46 Rural 6,156 6.81 4,040 5.24 267 8.37 1,849 18.28 SURGICAL Total 20,708 2.77 11,875 2.05 979 3.83 7,854 5.43 Age 0–4 1,288 0.60 1,211 0.58 77 1.14 - - 5–9 9,293 4.79 5,640 3.85 411 5.73 3,242 7.99 10–14 6,562 3.64 3,069 2.65 318 4.97 3,175 5.48 15–18 3,565 2.23 1,955 1.80 173 3.26 1,437 3.11 Location Urban 18,022 2.75 10,093 2.01 849 3.79 7,080 5.37 Rural 2,566 2.81 1,782 2.31 130 4.08 632 6.25 OTHER Total 40,099 5.36 24,954 4.31 1,944 7.60 13,201 9.13 Age 0–4 3,772 1.76 3,584 1.73 188 2.79 - - 5–9 16,142 8.31 10,374 7.09 785 10.95 4,983 12.29 10–14 10,710 5.94 5,759 4.97 546 8.54 4,405 7.61 15–18 9,475 5.93 5,237 4.83 425 8.02 3,813 8.26 Location Urban 34,862 5.32 21,153 4.22 1,671 7.46 12,038 9.13 Rural 4,989 5.52 3,801 4.93 273 8.56 915 9.05
Florida Oral Health Workforce Statewide Needs Assessment Page 22 Institute for Child Health Policy University of Florida
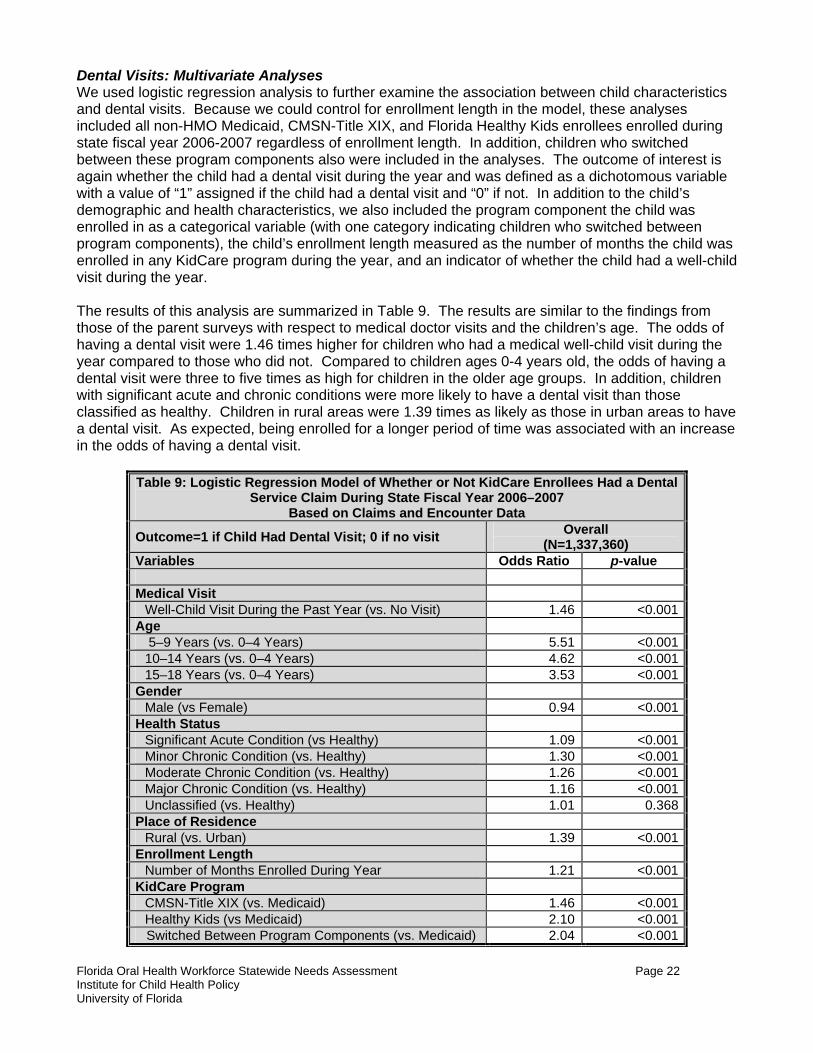
Dental Visits: Multivariate Analyses We used logistic regression analysis to further examine the association between child characteristics and dental visits. Because we could control for enrollment length in the model, these analyses included all non-HMO Medicaid, CMSN-Title XIX, and Florida Healthy Kids enrollees enrolled during state fiscal year 2006-2007 regardless of enrollment length. In addition, children who switched between these program components also were included in the analyses. The outcome of interest is again whether the child had a dental visit during the year and was defined as a dichotomous variable with a value of “1” assigned if the child had a dental visit and “0” if not. In addition to the child’s demographic and health characteristics, we also included the program component the child was enrolled in as a categorical variable (with one category indicating children who switched between program components), the child’s enrollment length measured as the number of months the child was enrolled in any KidCare program during the year, and an indicator of whether the child had a well-child visit during the year. The results of this analysis are summarized in Table 9. The results are similar to the findings from those of the parent surveys with respect to medical doctor visits and the children’s age. The odds of having a dental visit were 1.46 times higher for children who had a medical well-child visit during the year compared to those who did not. Compared to children ages 0-4 years old, the odds of having a dental visit were three to five times as high for children in the older age groups. In addition, children with significant acute and chronic conditions were more likely to have a dental visit than those classified as healthy. Children in rural areas were 1.39 times as likely as those in urban areas to have a dental visit. As expected, being enrolled for a longer period of time was associated with an increase in the odds of having a dental visit.
Table 9: Logistic Regression Model of Whether or Not KidCare Enrollees Had a Dental Service Claim During State Fiscal Year 2006–2007
Based on Claims and Encounter Data
Outcome=1 if Child Had Dental Visit; 0 if no visit Overall (N=1,337,360)
Variables Odds Ratio p-value Medical Visit
Well-Child Visit During the Past Year (vs. No Visit) 1.46 <0.001Age
5–9 Years (vs. 0–4 Years) 5.51 <0.00110–14 Years (vs. 0–4 Years) 4.62 <0.00115–18 Years (vs. 0–4 Years) 3.53 <0.001
Gender Male (vs Female) 0.94 <0.001
Health Status Significant Acute Condition (vs Healthy) 1.09 <0.001Minor Chronic Condition (vs. Healthy) 1.30 <0.001Moderate Chronic Condition (vs. Healthy) 1.26 <0.001Major Chronic Condition (vs. Healthy) 1.16 <0.001Unclassified (vs. Healthy) 1.01 0.368
Place of Residence Rural (vs. Urban) 1.39 <0.001
Enrollment Length Number of Months Enrolled During Year 1.21 <0.001
KidCare Program CMSN-Title XIX (vs. Medicaid) 1.46 <0.001Healthy Kids (vs Medicaid) 2.10 <0.001
Switched Between Program Components (vs. Medicaid) 2.04 <0.001
Florida Oral Health Workforce Statewide Needs Assessment Page 23 Institute for Child Health Policy University of Florida
Discussion The analyses of dental visits among KidCare enrollees based both on parent report and on claims and administrative data indicate that: (1) a substantial proportion of children are not obtaining recommended preventive dental care; and (2) the youngest children, those ages 0–4 years, are significantly less likely than older children to have a dental visit. The particularly low rates of dental service use among children ages 0–4 years is not a surprising finding as it is well established that preschool-aged children typically have low rates of dental visits.20 However, it is concerning because early childhood caries is one of the most common, yet preventable, diseases of early childhood.1 The American Dental Association, the American Academy of Pediatric Dentistry, and the American Academy of Pediatrics all recommend that children have a dental home established by 12 months of age. The low reported utilization rates using the administrative claims and encounter data are very similar to findings in other state Medicaid and SCHIP programs that have examined utilization using claims and encounter data. For example, a study of children enrolled in New Hampshire’s Medicaid program found that 24% had a dental visit in the preceding year.22 A study of dental utilization in Iowa’s Medicaid and SCHIP programs found that only 10% of children ages 1–3 years and 26%–31% of older children who were enrolled for 6 months had a dental visit.23 Our finding that parent-reported rates of dental visits are significantly higher than utilization rates as measured in the administrative claims and encounter data also is consistent with findings in other states that there is a discrepancy between parent reported and administrative claims-based measures of children’s health care utilization.24 Possible reasons for this discrepancy include parents over-reporting their adherence to recommended dental care and underreporting of claims by dental providers. We also found that there were no statistically significant differences between rural and urban enrollees in dental visits based on parent-reported measures and rural enrollees were more likely to have a dental visit in the claims and encounter measures. These findings suggest that public insurance may help to mitigate geographic barriers to care. Finally, we found that children who had not visited their primary medical care provider during the year also were less likely to have had a dental visit. This may reflect broader barriers faced by these enrollees in accessing the health care system in general.
Florida Oral Health Workforce Statewide Needs Assessment Page 24 Institute for Child Health Policy University of Florida
IV. DATA LIMITATIONS AND RECOMMENDATIONS FOR FURTHER STUDY These analyses were restricted in scope by the availability of data. The following are recommendations for additional data collection and analyses:
Dental provider characteristics. We did not have demographic data on dental providers (e.g., age, gender, and race/ethnicity) that would have allowed for a more comprehensive analysis of the distribution of the oral health workforce relative to the population. For example, gender and age have important implications for the dental workforce supply and practice patterns (e.g., proportion of providers approaching retirement, hours worked per week, and so forth). In addition, existing research indicates that health professionals from racial and ethnic minority and socioeconomically disadvantaged backgrounds are more likely than non-Hispanic white professionals or those from more affluent backgrounds to serve disadvantaged populations. There also is evidence that minority and non-English speaking patients receive better interpersonal care from practitioners of their own race or ethnicity and who speak their language.25,26 Therefore, collecting demographic data on the oral health workforce would make it possible to (1) better assess current and future workforce supply and (2) compare the demographic characteristics of providers relative to population characteristics.
Unmet needs and barriers to accessing care. The scope of the current project was restricted to county-level analyses and secondary data analyses. To better understand what areas of the state have the greatest need for oral health services, assessments of unmet dental needs and barriers to care could be conducted, particularly for at-risk and vulnerable populations. Such assessments could be accomplished through a statewide surveillance system and/or through targeted surveys of at-risk populations. Reasons for nonuse and barriers to accessing care among KidCare enrollees. Surveys of families who participate in the KidCare Program could be conducted to better understand the reasons for use or nonuse of dental services as well as barriers that families face in accessing dental services. In addition, the analyses in the present study did not include children enrolled in Medicaid HMOs due to lack of claims and encounter data availability. To have a complete picture of dental utilization among publicly insured children, it is necessary to obtain and analyze these data. Provider recruitment and retention. Provider surveys and focus groups could be conducted to better understand their reasons for participation or nonparticipation in public insurance programs, such as KidCare, in particular and the challenges and barriers in recruiting and retaining providers to serve disadvantaged and vulnerable populations more generally.
Florida Oral Health Workforce Statewide Needs Assessment Page 25 Institute for Child Health Policy University of Florida
V. SUMMARY The key findings are as follows:
• The workforce-to-population ratio is lowest in rural counties and low-income counties with less variation based on the racial and ethnic composition of the population.
• Counties in the lowest quartile of workforce-to-population ratios typically had at least one type
of safety net provider.
• A substantial proportion of publicly insured children are not receiving recommended preventive dental care.
• The youngest publicly insured children, those ages 0–4 years, are significantly less likely than
older children to have a dental visit.
• KidCare enrollees with significant acute or chronic conditions (versus healthy), those whose parents had a high school education or greater (versus no high school degree), and those who had a primary care provider medical visit (versus no visit) were more likely to have a dental visit.
• Although the workforce-to-population ratio is lowest in rural counties, we did not find lower rates
of dental utilization among KidCare enrollees in rural areas compared to urban areas. These findings are consistent with other state and national analyses of the oral health workforce distribution and dental utilization of publicly insured children. Additional data collection and analyses are recommended to better understand the reasons for use and non-use of dental care services among vulnerable and disadvantaged populations, the barriers that they face in accessing care, and the challenges and barriers to recruiting and retaining providers to serve these populations.
Florida Oral Health Workforce Statewide Needs Assessment Page 26 Institute for Child Health Policy University of Florida
END NOTES 1 U.S. Department of Health and Human Services. 2000. Oral Health in America: A Report of the Surgeon General. Rockville, MD: US Department of Health and Human Services, National Institute of Dental and Craniofacial Research, National Institutes of Health. 2 Florida Statistical Abstract 2008, Bureau of Economic and Business Research, Warrington College of Business, University of Florida. 3 Florida Estimates of Population 2008, Bureau of Economic and Business Research, Warrington College of Business, University of Florida. 4 U.S. Census Bureau. Small Area Income & Poverty Estimates. Available at: http://www.census.gov//did/www/saipe/. 5 Florida Department of Health Office of Rural Health. Available at: http://www.doh.state.fl.us/Workforce/RuralHealth/ruralhealthhome.html. 6 Ingram DD, Franco S. 2006 NCHS Urban-Rural Classification Scheme for Counties. Available at: http://www.cdc.gov/nchs/r&d/rdc_urbanrural.htm. 7 Florida Association of Community Health Centers. Member Centers. Available at: http://www.fachc.org/about-member-centers.php; and Peters, M. (Accounting and Data Coordinator, Florida Association of Community Health Centers), e-mail communication, August 18, 2009. 8 American Dental Association. Dental Schools and Programs. Available at: http://www.ada.org/prof/ed/programs/search_index.asp. 9 Krause D, Frate DA, May WL. 2005. Demographics and Distribution of Dentists in Mississippi: A Dental Work Force Study. Journal of the American Dental Association 136: 668-677. 10 Susi L, Mascarenhas AK. 2002. Using a Geographical Information System to Map the Distribution of Dentists in Ohio. Journal of the American Dental Association 133:636-642. 11 Brown LJ. 2005. A Look at Allied Dental Education in the United States. Journal of the American Dental Association. 136: 797-804. 12 Health Resources and Services Administration, U.S. Department of Health and Human Services. Shortage Designation: HPSAs, MUAs & MUPs. Available at: http://bhpr.hrsa.gov/shortage/. 13 U.S. Government Accountability Office. 2006. Health Professional Shortage Areas: Problems Remain with Primary Care Shortage Area Designation System. GAO-07-84. Washington, DC: U.S. Government Accountability Office. Available at: www.gao.gov/new.items/d0784.pdf. 14 Florida Department of Health Office of Health Professional Recruitment. Shortage Designations/Underserved Areas. Available at: http://www.doh.state.fl.us/workforce/recruit1/shortdesig.html. 15 Brown LJ. 2005. Adequacy of Current and Future Dental Workforce: Theory and Analysis. Chicago: American Dental Association, Health Policy Resources Center.
Florida Oral Health Workforce Statewide Needs Assessment Page 27 Institute for Child Health Policy University of Florida
16 Benham L, Maurizi A, Reder MW. 1968. Migration, Location, and Remuneration of Medical Personnel: Physicians and Dentists. Review of Economics and Statistics. 50: 332-47. 17 Nogle JM, Shenkman E. The Florida KidCare Evaluation Report Year 9: State Fiscal Year 2006-2007. Institute for Child Health Policy. University of Florida, Gainesville, Florida. Available at: https://www.healthykids.org/documents/evaluation/institute/2008/Florida+KidCare+Evaluation+Report+2008.pdf. 18 Neff JM, Sharp V, Muldoon J, Graham J, Popalisky J, Gay, J. 2001. Identifying and Classifying Children with Chronic Conditions Using Administrative Data with the Clinical Risk Group Classification System. Journal of Ambulatory Pediatrics, 2(1): 72-29. 19 Bethell CD, Read D, Stein REK, Blumberg SJ, Wells N, and Newacheck PW. 2002. Identifying Children with Special Health Care Needs: Development and Evaluation of a Short Screening Instrument. Ambulatory Pediatrics, 2:38-48. 20 Dye BA, Tan S, Smith V, Lewis BG, Barker LK, Thornton-Evans G, et al. 2007. Trends in Oral Health Status: United States, 1988–1994 and 1999–2004. National Center for Health Statistics. Vital Health Statistics: 11(248). 21 American Academy of Pediatric Dentistry. 2007. Guideline on Periodicity of Examination, Preventive Dental Services, Anticipatory Guidance/Counseling, and Oral Treatment for Infants, Children, and Adolescents. 22 Chi D, Milgrom P. 2009. Preventive Dental Service Utilization for Medicaid-Enrolled Children in New Hampshire: A Comparison of Care Provided by Pediatric Dentists and General Dentists. Journal of Health Care for the Poor and Underserved, 20(2):458-72. 23 Damiano PC, Momany ET, Carter KD, Jones MP, Askelson NM. 2008. Time to First Dental Visit After Initially Enrolling in Medicaid and S-SCHIP. Medical Care, 46(12):1234-9. 24 Sommers A, Howell E, Hill I. 2007. Utilization in the Los Angeles Healthy Kids Program: A Preliminary Study of Health Plan Administrative Data. Urban Institute. Available at: http://www.urban.org/publications/411517.html. 25 Mofidi M, Konrad TR, Porterfield DS, Niska R, Wells B. 2002. Provision of Care to the Underserved Populations by National Health Service Corps Alumni Dentists. Journal of Public Health Dentistry, 62(2): 102-108. 26 Saha S, Shipman SA. 2008. Race-Neutral Versus Race-Conscious Workforce Policy to Improve Access to Care. Health Affairs, 27(1): 234-245.