flood forecasting and inundation mapping in the … · flood forecasting and inundation mapping in...
TRANSCRIPT

Flood Forecasting and Inundation Mapping in the Mahanadi River Basin: A Collaborative Effort between India and the United States S.K. Sengupta1, J.D. Bales2, R. Jubach3, A.C. Scott4, and M.D. Kane5
1S.K. Sengupta: Central Water Commission, Plot No. A/13&14, Mahanadi Bhawan
Bhoi Nagar, Bhubaneswar, Orissa, India, 751022; email: [email protected]; phone: 0674-2545536; fax: 0674- 2545537.
2J.D. Bales: U.S. Geological Survey, 3916 Sunset Ridge Road, Raleigh, NC, USA 27607; email: [email protected]; phone: 919-571-4048; fax: 919-571-4041 (corresponding author).
3R. Jubach: Hydrologic Research Center, 12780 High Bluff Drive, Suite 250, San Diego, CA USA 92130-2069; email: [email protected]; phone: 858-794-2726; fax: 858-792-2519.
4A.C. Scott: University of Arizona, Tucson, AZ, USA, 85719; email: [email protected]; phone: 520-626-4393.
5M.D. Kane, Riverside Technology, 2290 East Prospect Road, Suite 1, Fort Collins, CO, USA 80525-9768; email [email protected]; phone: 970-484-7573.
ABSTRACT
Through a collaborative effort of several governmental agencies in India and the United States, a flood-forecasting and flood-inundation mapping system is being implemented for the flood-prone Mahanadi River basin on the east coast of India. The National Weather Service River Forecast System (NWSRFS) is being implemented and calibrated using hydrologic records for the Mahanadi basin. Central Water Commission (CWC) engineers in India are receiving training on the implementation, initialization, operation and calibration of the NWSRFS. Data-collection and telemetry are being enhanced through the efforts of Indian agencies. Flood-inundation maps are being developed through the collection of detailed topographic data and application of two-dimensional steady-flow models. These combined efforts will reduce the vulnerability of citizens in the Mahanadi River basin to floods, improve warning capabilities of the CWC, and increase long-term collaboration between Indian and American hydrologists and meteorologists.
INTRODUCTION
Approximately 16 percent of the world’s population lives in India on about 2.45 percent of the earth’s land. The country is subject to a variety of natural hazards, including droughts, flash floods, widespread flooding from monsoonal rains, severe thunderstorms, cyclones, tsunamis, landslides, and earthquakes. In 2003, the Government of India (GOI) and the United States Agency for International Development (USAID) initiated the Disaster Management Support (DMS) project as a collaborative effort to reduce the vulnerability of the Indian population to a variety of natural hazards. The DMS project includes implementation of a flood-forecasting and flood-inundation mapping system for the Mahanadi River basin as a demonstration
1
project. The purpose of this paper is to describe the Mahanadi River basin demonstration project and provide background information on the DMS project.
CLIMATE FORECASTING SYSTEMS COMPONENT OF THE GOVERNMENT OF INDIA – USAID DISASTER MANAGEMENT PROJECT
The Climate Forecasting Systems (CFS) component of the DMS project supports the use of climate and weather forecasts as tools to enhance early warning of floods and other hazards, promote better decisionmaking at the local level, and enhance allocation of scarce natural resources. Through a set of demonstration projects, which are being implemented during 2005 – 2007, and peer-to-peer interactions, improvements are being made in the capacity of GOI agencies to predict the occurrence of hydrometeorological events and to develop more effective plans at the national, state, and local levels to mitigate the adverse effects of these events. CFS activities promote dialogue and cooperation among different Indian agencies, including the CWC, Indian Meteorological Department (IMD), government ministries and departments at the national and state levels, and universities and research institutes for climate hazards.
The CFS component of the DMS project includes five subprojects: (1) tropical cyclone forecasting and warning; (2) local severe storms, including flash floods; (3) extreme temperatures; (4) flood forecasting, including flood inundation mapping; and (5) forecast communications. Pilot early-warning and disaster preparedness systems, which directly reduce vulnerability at the local level, are being implemented through these subprojects. The systems are incorporating the needs of users through institutionalized dialogue among interested stakeholders.
MAHANADI RIVER BASIN FLOOD MITIGATION PILOT PROJECT
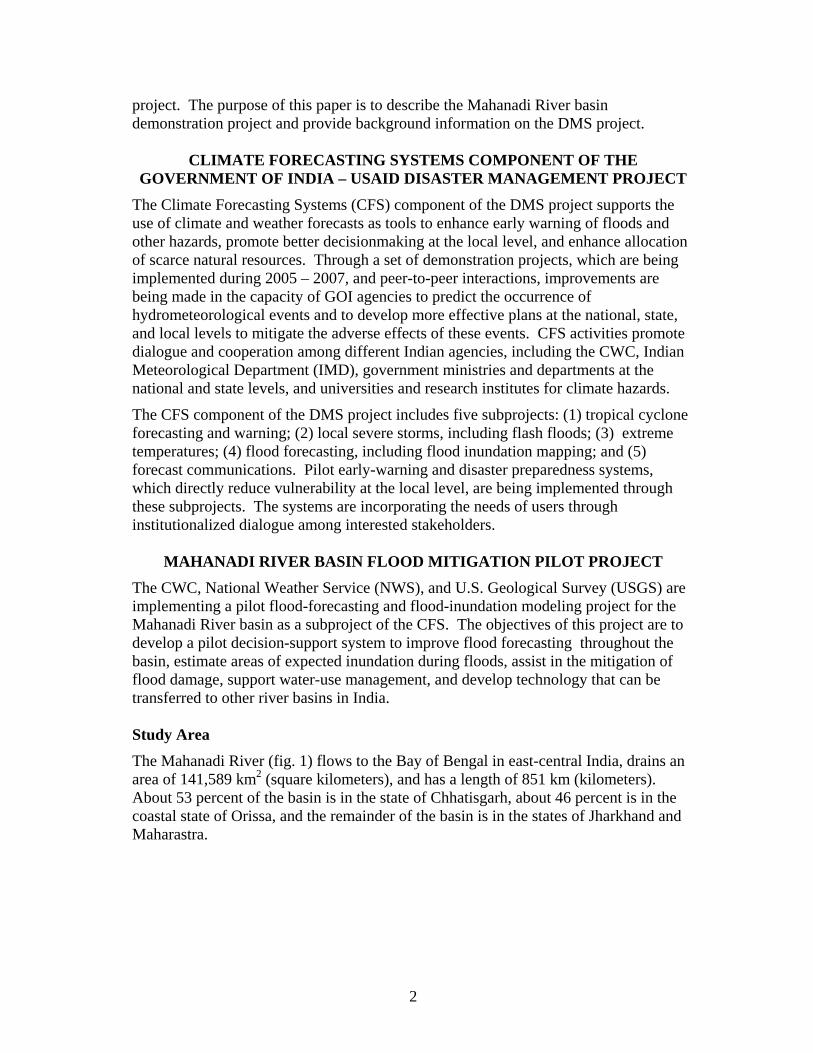
The CWC, National Weather Service (NWS), and U.S. Geological Survey (USGS) are implementing a pilot flood-forecasting and flood-inundation modeling project for the Mahanadi River basin as a subproject of the CFS. The objectives of this project are to develop a pilot decision-support system to improve flood forecasting throughout the basin, estimate areas of expected inundation during floods, assist in the mitigation of flood damage, support water-use management, and develop technology that can be transferred to other river basins in India. Study Area The Mahanadi River (fig. 1) flows to the Bay of Bengal in east-central India, drains an area of 141,589 km2 (square kilometers), and has a length of 851 km (kilometers). About 53 percent of the basin is in the state of Chhatisgarh, about 46 percent is in the coastal state of Orissa, and the remainder of the basin is in the states of Jharkhand and Maharastra.
2
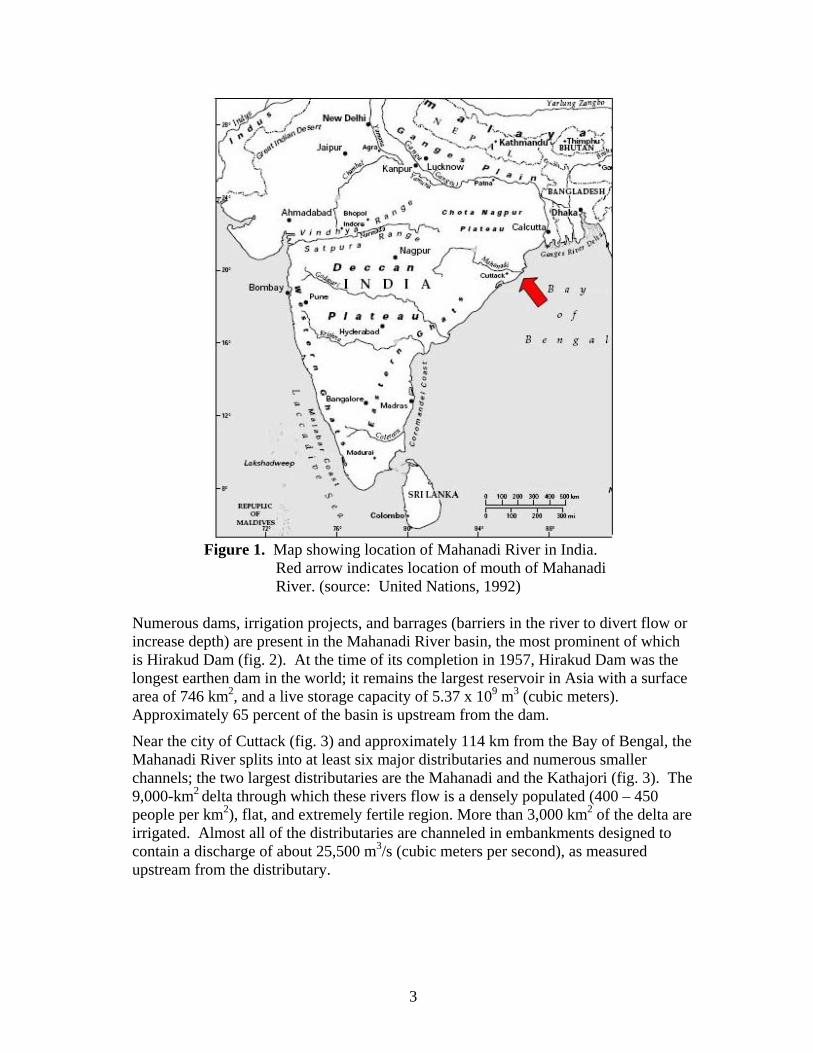
Figure 1. Map showing location of Mahanadi River in India.
Red arrow indicates location of mouth of Mahanadi River. (source: United Nations, 1992)
Numerous dams, irrigation projects, and barrages (barriers in the river to divert flow or increase depth) are present in the Mahanadi River basin, the most prominent of which is Hirakud Dam (fig. 2). At the time of its completion in 1957, Hirakud Dam was the longest earthen dam in the world; it remains the largest reservoir in Asia with a surface area of 746 km2, and a live storage capacity of 5.37 x 10⁹ m3 (cubic meters). Approximately 65 percent of the basin is upstream from the dam.
Near the city of Cuttack (fig. 3) and approximately 114 km from the Bay of Bengal, the Mahanadi River splits into at least six major distributaries and numerous smaller channels; the two largest distributaries are the Mahanadi and the Kathajori (fig. 3). The 9,000-km2 delta through which these rivers flow is a densely populated (400 – 450 people per km2), flat, and extremely fertile region. More than 3,000 km2 of the delta are irrigated. Almost all of the distributaries are channeled in embankments designed to contain a discharge of about 25,500 m3/s (cubic meters per second), as measured upstream from the distributary.
3
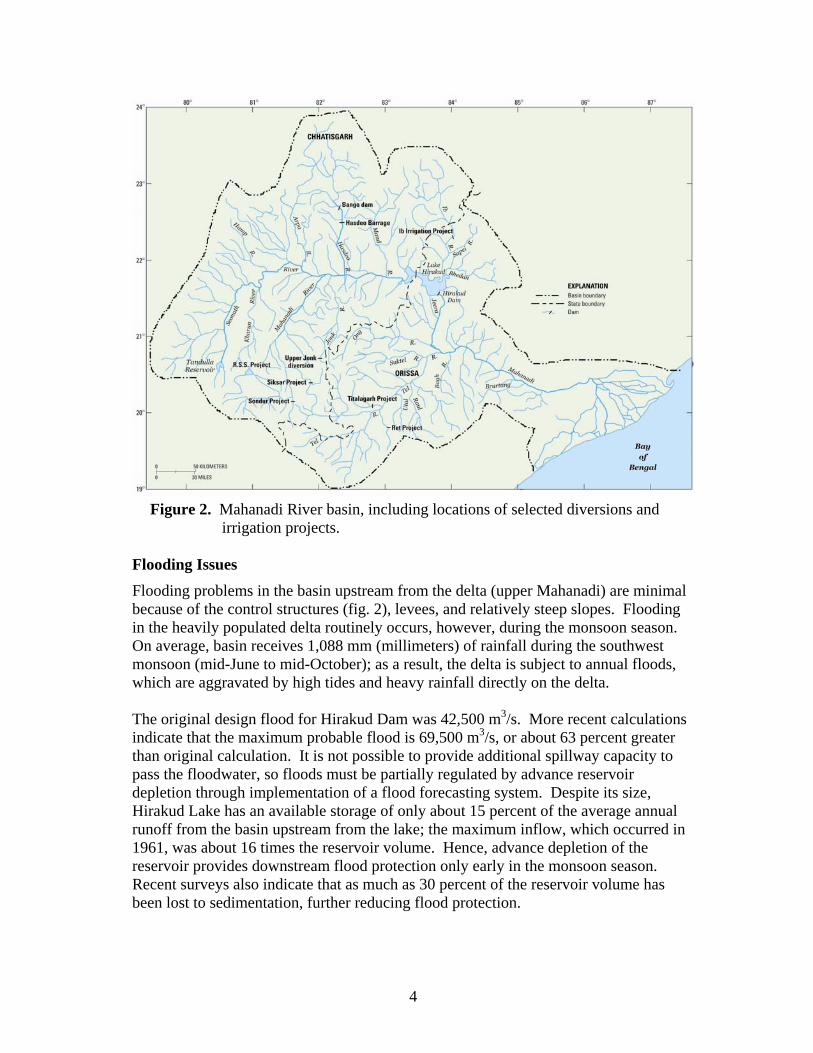
Figure 2. Mahanadi River basin, including locations of selected diversions and
irrigation projects. Flooding Issues Flooding problems in the basin upstream from the delta (upper Mahanadi) are minimal because of the control structures (fig. 2), levees, and relatively steep slopes. Flooding in the heavily populated delta routinely occurs, however, during the monsoon season. On average, basin receives 1,088 mm (millimeters) of rainfall during the southwest monsoon (mid-June to mid-October); as a result, the delta is subject to annual floods, which are aggravated by high tides and heavy rainfall directly on the delta. The original design flood for Hirakud Dam was 42,500 m3/s. More recent calculations indicate that the maximum probable flood is 69,500 m3/s, or about 63 percent greater than original calculation. It is not possible to provide additional spillway capacity to pass the floodwater, so floods must be partially regulated by advance reservoir depletion through implementation of a flood forecasting system. Despite its size, Hirakud Lake has an available storage of only about 15 percent of the average annual runoff from the basin upstream from the lake; the maximum inflow, which occurred in 1961, was about 16 times the reservoir volume. Hence, advance depletion of the reservoir provides downstream flood protection only early in the monsoon season. Recent surveys also indicate that as much as 30 percent of the reservoir volume has been lost to sedimentation, further reducing flood protection.
4
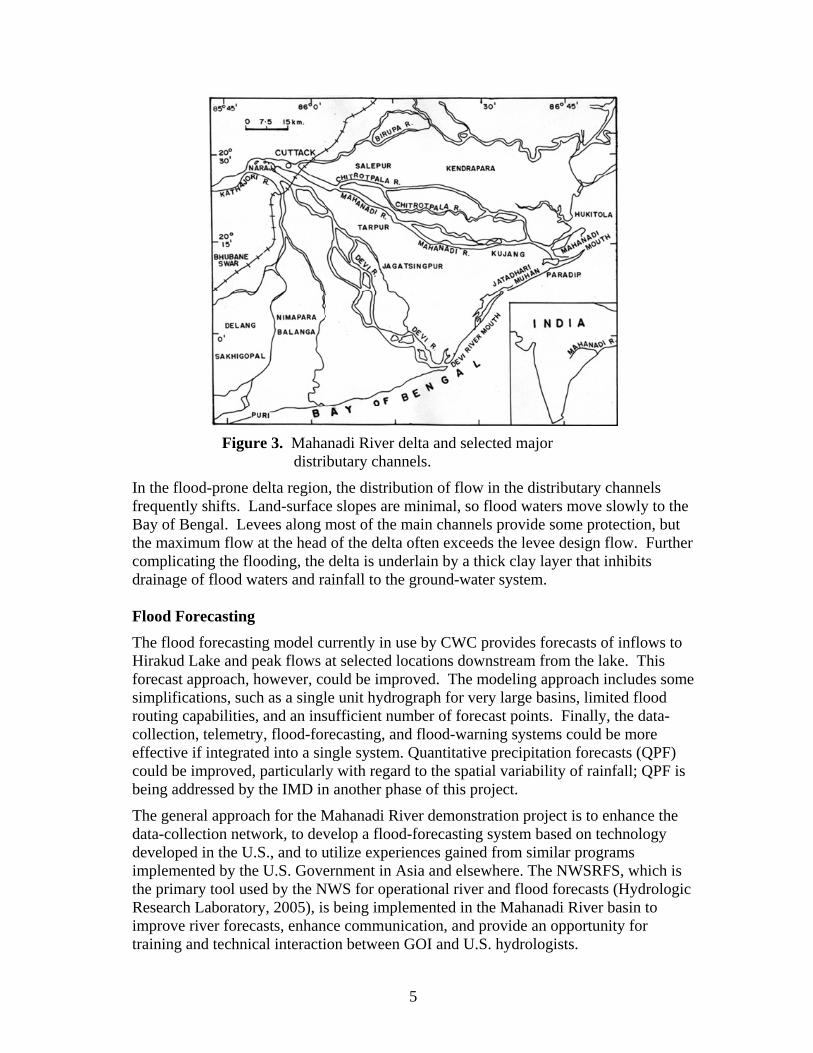
Figure 3. Mahanadi River delta and selected major
distributary channels.
In the flood-prone delta region, the distribution of flow in the distributary channels frequently shifts. Land-surface slopes are minimal, so flood waters move slowly to the Bay of Bengal. Levees along most of the main channels provide some protection, but the maximum flow at the head of the delta often exceeds the levee design flow. Further complicating the flooding, the delta is underlain by a thick clay layer that inhibits drainage of flood waters and rainfall to the ground-water system. Flood Forecasting The flood forecasting model currently in use by CWC provides forecasts of inflows to Hirakud Lake and peak flows at selected locations downstream from the lake. This forecast approach, however, could be improved. The modeling approach includes some simplifications, such as a single unit hydrograph for very large basins, limited flood routing capabilities, and an insufficient number of forecast points. Finally, the data-collection, telemetry, flood-forecasting, and flood-warning systems could be more effective if integrated into a single system. Quantitative precipitation forecasts (QPF) could be improved, particularly with regard to the spatial variability of rainfall; QPF is being addressed by the IMD in another phase of this project.
The general approach for the Mahanadi River demonstration project is to enhance the data-collection network, to develop a flood-forecasting system based on technology developed in the U.S., and to utilize experiences gained from similar programs implemented by the U.S. Government in Asia and elsewhere. The NWSRFS, which is the primary tool used by the NWS for operational river and flood forecasts (Hydrologic Research Laboratory, 2005), is being implemented in the Mahanadi River basin to improve river forecasts, enhance communication, and provide an opportunity for training and technical interaction between GOI and U.S. hydrologists.
5
The NWSRFS is designed to efficiently process large amounts of data to produce forecasts at multiple locations. The system is capable of producing deterministic and probabilistic forecasts, including flood forecasts, general river forecasts, reservoir inflow forecasts, water-supply forecasts, and seasonal flood outlooks. NWSRFS is a modular system and contains multiple individual hydrologic models for (1) snowmelt, (2) soil moisture accounting and runoff generation, (3) streamflow routing, and (4) reservoir simulation; users can select individual models from each of these four major classes of models.
The NWSRFS includes a calibration system (CS), an ensemble streamflow prediction (ESP) system, and an operational forecast system (OFS) that is augmented by the interactive forecast program (IFP) (fig. 4). The OFS is a continuous river forecasting system which provides the forecaster with predictions of river flow to use in producing flood forecasts and other hydrologic products. The system uses the calibrated models to continuously produce short-term river and flood forecasts and to maintain model hydrologic state variables. The IFP has a graphical user interface that allows the forecaster to use hydrologic expertise and judgment to develop a forecast. The CS is used to generate time series of hydrologic variables based on historical data and to determine model parameters for a given application. The software is intended for use on a single segment of a river at a given time, but is applied using many years of historic data. The ESP system uses the current state of the calibrated models and historical data to generate long-term probabilistic forecasts.
The NWSRFS is being calibrated for 19 subbasins in the Mahanadi River basin. Historical records from a network of more than 40 streamflow and rainfall gauges are being used in the calibration. Most gauges have more than 20 years of record. Additional forecast points are being added to the system, including a forecast point at the head of the delta. The automated data assimilation capabilities of the NWSRFS are being implemented concurrently with an expansion of the data-collection network and enhancement of telemetry. The system is expected to be fully operational in 2007. Flood-Inundation Mapping Flood-inundation mapping, when combined with reliable flood forecasts, can provide local authorities with important information for emergency flood response. Flood-inundation mapping in the Mahanadi delta, however, is complicated by a number of factors. Some of these factors include numerous flow channels, inadequate topographic information, storm surge and tidal effects at the mouth of the delta (for example, Dube et al., 2005), potential levee failure that would result in flooding that would not be expected based on river flow alone, changes in the distribution of flow in the distributary channels, and flooding resulting from high rainfall directly on the delta.
6

Figure 4. Schematic diagram of components of the National Weather Service
River Forecast System (Larson and Kaplafka, 2002) The development of reliable flood-inundation maps is dependent on accurate, up-to-date digital topographic information for the delta. As originally planned in 2004, the National Remote Sensing Agency (NRSA) of India was to collect detailed terrain data using an airborne laser terrain mapper, and the USGS and NRSA were to collaboratively develop a detailed digital elevation model (DEM) for inundation mapping. Terrain data collection was delayed for several reasons, but is scheduled to begin in late 2006 or 2007. Fairly detailed land surveys of the delta also are available, but these surveys are not in digital form and considerable effort would be required to create digital maps. The USGS and CWC also investigated using data from the Shuttle Radar Topography Mission (U.S. Geological Survey, 2006), but the resolution of these data is insufficient for inundation mapping. Finally, the CWC and USGS are investigating the use of data from the CARTOSAT-1 satellite (India Space Research Organization, 2006). Twin sensors aboard the satellite acquire stereo image pairs, allowing for the development of DEMs with a spatial resolution of 2.5 meters.
After the DEM for the delta is available, the plan is to implement the two-dimensional (2D) flow model, UnTRIM (Cheng et al., 1993; Casulli and Walters, 2000). The model operates using an unstructured grid, allowing for greater detail near channels and levees, and is computationally efficient. Steady-flow models are to be developed for a range of inflows at the head of the delta and tidal conditions at the Bay of Bengal. A library of inundation maps then are to be prepared for key locations in the delta, with each map representing an inflow and tidal elevation pair. Subsequent development
7

may allow the use of forecast peak flows at the head of the delta to develop maximum inundation maps for a particular storm. Nevertheless, these inundation maps will not account for levee failure or flooding from rainfall directly on the delta.
SUMMARY Through collaborative efforts of several GOI and U.S. agencies, primarily CWC, IMD, USAID, NWS, and USGS, a flood-forecasting and flood-inundation mapping system is being implemented for the flood-prone Mahanadi River basin. The NWSRFS is being implemented and calibrated using hydrologic records for the Mahanadi basin. CWC engineers are receiving training, both in India and the U.S. on the use of NWSRFS. Data collection and telemetry are being enhanced through the efforts of CWC. The IMD is working with NWS through another project to improve QPF for the basin. Flood-inundation maps are being developed through the collection of detailed topographic data and application of 2D steady-flow models. Combined, these efforts will reduce the vulnerability of citizens in the Mahanadi River basin to floods, improve warning capabilities of the CWC, and increase long-term collaboration between GOI and U.S. hydrologists and meteorologists.
REFERENCES
Casulli, B., and Walters, R.A. (2000). “An unstructured grid, three-dimensional model based on the shallow water equations.” Int. J. Num. Methods in Fluids, 32, 331-348.
Cheng, R.T., Casulli, V., and Gartner, J.W. (1993). “Tidal, residual, intertidal mudflat (TRIM) model and its applications to San Francisco Bay, California.” Est., Coastal, Shelf Sci., 36, 235 – 280.
Dube, S.K., Sinha, P.C., Rao, A.D., Jain, I., and Afnihotri, N. (2005). “Effect of the Mahanadi River on the Development of Storm Surge Along the Orissa Coast of India: A Numerical Study.” Pure Appl. Geophys. 162, 1673-1688.
Hydrologic Research Laboratory (2005). NWSRFS users manual, National Weather Service, National Oceanic and Atmospheric Administration, Silver Spring, Maryland, variously paged.
India Space Research Organization (2006). CARTOSAT-1, http://www.isro.org/Cartosat/Page3.htm (Aug. 2, 2006).
Larson, L.W., and Kaplafka, J. (2002). Introduction to National Weather Service River Forecast System, NWSRFS, http://www.nws.noaa.gov/iao/InternationalHydrologyCourseCD2/NWSRFSLarson/NWSRFS.html (Aug. 2, 2006).
United Nations (1992). Physical features of India: Map No. 3665, http://www.un.org/Depts/Cartographic/map/profile/india.pdf (Aug. 2, 2006).
U.S. Geological Survey (2006). Shuttle Radar Topography Mission http://srtm.usgs.gov/ (Aug. 2, 2006).
8