flexible conductive polymer electrodes for...
TRANSCRIPT
Flexible Conductive Polymer Electrodes for
Applications in Tissue Electrical Impedance
Scanning (EIS)
by
Daehan Chung
B.Sc., Korea University, 2008
Thesis Submitted in Partial Fulfillment
of the Requirements for the Degree of
Master of Applied Science
in the
School of Engineering Science
Faculty of Applied Science
Daehan Chung 2012
SIMON FRASER UNIVERSITY
Summer 2012
All rights reserved. However, in accordance with the Copyright Act of Canada, this work may
be reproduced, without authorization, under the conditions for “Fair Dealing.” Therefore, limited reproduction of this work for the
purposes of private study, research, criticism, review and news reporting is likely to be in accordance with the law, particularly if cited appropriately.

ii
Approval
Name: Daehan Chung
Degree: Master of Applied Science
Title of Thesis: Flexible Conductive Polymer Electrodes for Applications in Tissue Electrical Impedance Scanning (EIS)
Examining Committee:
Chair: Behraad Bahreyni, P. Eng, Assistant Professor, School of Engineering Science
Bonnie L. Gray, P. Eng Senior Supervisor Associate Professor, School of Engineering Science
Ash M. Parameswaran, P.Eng Supervisor Professor, School of Engineering Science
Kirpal S. Kohli Examiner Head Medical Physics Fraser Valley Cancer Centre
Date Defended/Approved: August 10, 2012

iii
Partial Copyright Licence
iv
Abstract
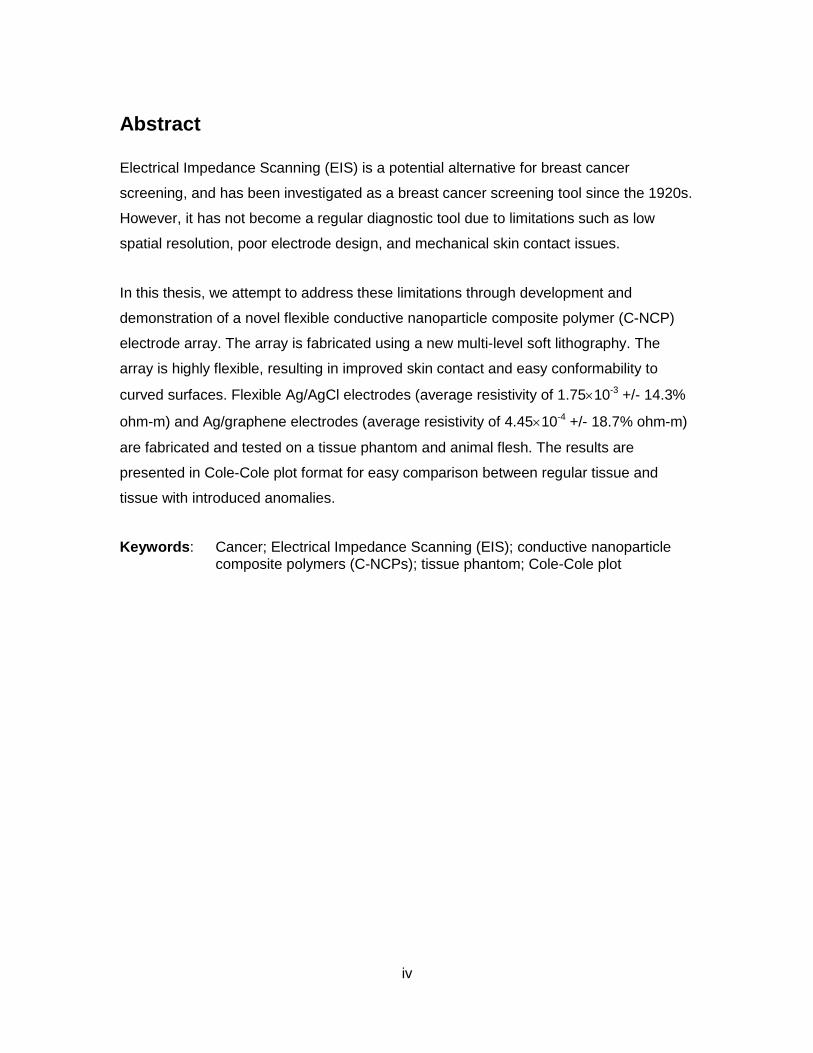
Electrical Impedance Scanning (EIS) is a potential alternative for breast cancer
screening, and has been investigated as a breast cancer screening tool since the 1920s.
However, it has not become a regular diagnostic tool due to limitations such as low
spatial resolution, poor electrode design, and mechanical skin contact issues.
In this thesis, we attempt to address these limitations through development and
demonstration of a novel flexible conductive nanoparticle composite polymer (C-NCP)
electrode array. The array is fabricated using a new multi-level soft lithography. The
array is highly flexible, resulting in improved skin contact and easy conformability to
curved surfaces. Flexible Ag/AgCl electrodes (average resistivity of 1.7510-3 +/- 14.3%
ohm-m) and Ag/graphene electrodes (average resistivity of 4.4510-4 +/- 18.7% ohm-m)
are fabricated and tested on a tissue phantom and animal flesh. The results are
presented in Cole-Cole plot format for easy comparison between regular tissue and
tissue with introduced anomalies.
Keywords: Cancer; Electrical Impedance Scanning (EIS); conductive nanoparticle composite polymers (C-NCPs); tissue phantom; Cole-Cole plot

v
Dedication
To God and my family, my strength and love

vi
Acknowledgements
I would like to thank to my senior supervisor Dr. Bonnie L. Gray first for her
patience, support, and guidance through my studies. Without her encouragement and
support, the project in this thesis would never succeed. I could not have asked for more.
I also would like to thank my defense committee members, Professor Ash M.
Parameswaran, Professor Behraad Bahreyni, and Kirpal S. Kohli from BC Cancer
Centre for taking time to review my work.
I would like to thank all the members within the Microinstrumentation Laboratory.
Thanks for all your suggestions and helpful discussions. Especially, Ajit, your ideas and
mentoring gave me inspiration that became the key point in this thesis. I also would like
thank the Canadian National Engineering and Science Research Council (NSERC) for
their financial support.
Finally, my deepest gratitude goes to God and my family. Without the support
and pray of my family, I would not be where I am today.
vii
Table of Contents
Approval .......................................................................................................................... ii Partial Copyright Licence ............................................................................................... iii Abstract .......................................................................................................................... iv
Dedication ....................................................................................................................... v
Acknowledgements ........................................................................................................ vi Table of Contents .......................................................................................................... vii List of Tables .................................................................................................................. ix
List of Figures.................................................................................................................. x
List of Acronyms or Glossary ......................................................................................... xii
1. Introduction .......................................................................................................... 1
2. Methods for Breast Cancer Detection ................................................................. 4
2.1. Mammography ....................................................................................................... 5
2.2. Ultrasonography ..................................................................................................... 6
2.3. Magnetic Resonance Imaging (MRI) ...................................................................... 7
2.4. Chapter Summary .................................................................................................. 8
3. Electrical Impedance Scanning (EIS) as a Cancer Screening Method ............ 11
3.1. Electrical Impedance Scanning (EIS) System ....................................................... 11
3.2. Electrical Properties of Tissue .............................................................................. 12
3.2.1. Normal Tissue ........................................................................................... 13
3.2.2. Cancerous Tissue ..................................................................................... 14
3.3. Cole-Cole Plot ...................................................................................................... 14
3.4. EIS for Breast Cancer Detection ........................................................................... 16
3.4.1. Prior EIS Research ................................................................................... 16
3.4.2. Limitations of Current EIS Systems ........................................................... 17
4. Development of the Flexible Electrode Array ................................................... 19
4.1. Desired Properties of Flexible Conductive Electrodes .......................................... 19
4.1.1. Uniform Conductivity of the Electrode ....................................................... 19
4.1.2. Perfectly Nonpolarizable Electrode ........................................................... 20
4.1.3. Flexibility ................................................................................................... 21
4.2. General Prototype Design .................................................................................... 21
4.3. Fabrication of Flexible Conductive Electrodes ...................................................... 22
4.3.1. Conductive Nanoparticle Composite Polymers (C-NCPs) as a New Material for EIS Electrode Arrays .............................................................. 22
4.3.2. Choice of Materials for Conductive Nanocomposite Polymer Electrode Arrays ....................................................................................... 25
4.3.2.1. Base Polymer ............................................................................. 25
4.3.2.2. Material for Molds ....................................................................... 26
4.3.2.3. Conductive Nanoparticles ........................................................... 26
4.3.3. New Fabrication Technique for Flexible EIS Electrode Array .................... 28
4.3.3.1. PMMA Molds Preparation ........................................................... 28
4.3.3.2. Fabrication Process and Development of Electrode Array .......... 32

viii
5. Experimentation ................................................................................................. 39
5.1. Preparation ........................................................................................................... 39
5.1.1. Conductive nanoparticle composite polymer (C-NCP) electrodes ............. 39
5.1.2. Tissue Phantom ........................................................................................ 41
5.2. Baseline and Anomaly Detection Experiments ..................................................... 44
5.2.1. Anomaly Detection in Gelatin Phantom with Four Ag/AgCl Electrodes ................................................................................................. 44
5.2.2. Anomaly Detection in Agar Phantom with Ten Ag/AgCl Electrodes ........... 47
5.2.3. Common Results ...................................................................................... 51
5.3. Comparison of Ag/AgCl Electrodes with Ag/graphene Electrodes ........................ 52
5.3.1. Impedance Measurements with Ag/AgCl electrodes ................................. 53
5.3.2. Impedance Measurements with Ag/graphene electrodes .......................... 54
5.3.3. Comparisons of the Results ...................................................................... 55
5.4. Real Tissue Impedance Measurements ................................................................ 57
6. Future Works, Contributions, and Conclusions ............................................... 60
6.1. Future Works ........................................................................................................ 60
6.1.1. Electrodes Design ..................................................................................... 60
6.1.2. More Experiments ..................................................................................... 61
6.2. Contributions ........................................................................................................ 62
6.3. Conclusions .......................................................................................................... 62
References ................................................................................................................... 64
Appendices .................................................................................................................. 71
Appendix A. List of Publications ................................................................... 72
Appendix B. Data of Experiments ................................................................. 73
Appendix C. Layout of PMMA Mold Designs ................................................ 85
Appendix D. Initial Experiment with Ag/AgCl Electrodes ............................... 89
Appendix E. Equipment List .......................................................................... 91

ix
List of Tables
Table 1. Sensitivity and Specificity of Different Screening Methods in Detection of Breast Cancer ............................................................................................ 9
Table 2. Impedance Difference between Ag/AgCl Electrode and Ag/graphene Electrode ..................................................................................................... 56
Table 3. Impedance Difference between Base Impedance and Impurity Embedded Area’s Impedance, and Their Comparison ................................. 57
x
List of Figures
Figure 1. The Equivalent Circuit Model to Represent the Electrical Properties of Tissues ........................................................................................................ 13
Figure 2. An Ideal Cole-Cole Impedance Map of Biological Tissue ............................. 16
Figure 3. Prototype Design of Electrode Array ........................................................... 22
Figure 4. Pictures of Gold Sputtered PDMS: a) Patterned Gold Film on PDMS; b) Damaged Gold Film after Skin Test ......................................................... 23
Figure 5. Pictures of PMMA Molds: a) V Shaped Cross-View; b) Uneven Surface after Laser Ablation ........................................................................ 30
Figure 6. Pictures of the One-Layer Electrode Mold: a) Top-View; b) Cross-View ............................................................................................................ 31
Figure 7. Pictures of the Two-Layer Electrode Mold: a) Top-View; b) Cross-View ............................................................................................................ 32
Figure 8. Fabrication Process for Making One Layer C-NCP Electrodes Array Using Blocking “pipes” so that the Electrode Surfaces Sit Above the PDMS Surface ............................................................................................. 33
Figure 9. Fabrication Process for Making Two Layers C-NCP Electrodes Array Using Blocking “pipes” so that the Electrode Surfaces Sit Above the PDMS Surface ............................................................................................. 34
Figure 10. Picture of Single Layer Electrode: a) Before Second Level PDMS; b) After Second Level PDMS ........................................................................... 35
Figure 11. Picture of Two Layer Electrode: a) Before Second Level PDMS; b) After Second Level PDMS ........................................................................... 36
Figure 12. Picture of an Ag Electrodes Array after Chlorination: a) Before Chlorination; b) After Chlorination ................................................................ 37
Figure 13. Picture of Ag/AgCl Electrodes Array: a) Wires Are Connected to the Electrodes; b) Flexibility of the Array ............................................................ 38
Figure 14. V-I Characteristics of Ag/AgCl Electrode and Ag/graphene Electrode .......... 40
Figure 15. Pictures of the Gelatin Phantom: a) Top-View; b) Cross-View ..................... 42
Figure 16. Pictures of the Agar Phantom: a) Top-View; b) Cross-View ......................... 43
Figure 17. Surface Property of the Phantoms When the Electrodes are Attached: a) The Gelatin Phantom; b) The Agar Phantom ........................................... 44

xi
Figure 18. Picture of the Impedance Analyzer .............................................................. 45
Figure 19. Anomaly Detection Test with 4 Electrodes: a) Illustration of Top-View of the Tissue Phantom; b) Measured Impedance Maps ............................... 47
Figure 20. Pictures of Electrode Array after attaching to the PMMA Substrate for Pressurization: a) Bottom-View before Wire Connection; b) Cross-View after Wire Connection ......................................................................... 49
Figure 21. Anomaly Detection Test with 10 Electrodes: a) Illustration of Top-view of the Tissue Phantom; b) Measured Impedance Maps ............................... 50
Figure 22. Concept of Ag/AgCl Electrodes and Ag/graphene Electrodes Comparison Experiment .............................................................................. 53
Figure 23. Ag/AgCl Electrodes Comparison with Ag/graphene Electrodes. The Results of Ag/AgCl Electrodes ..................................................................... 54
Figure 24. Ag/AgCl Electrodes Comparison with Ag/graphene Electrodes. The Results of Ag/graphene Electrodes .............................................................. 55
Figure 25. Impedance Map of the Chicken Thigh .......................................................... 59
Figure 26. Impedance Measurement of Real Tissue: a) Chicken Thigh with Ag/AgCl Electrodes on It; b) Overall Impedance Measurement.................... 59
Figure D1. Anomaly Detection Test with 4 Electrodes: a) Illustration of Top-view of the Tissue Phantom; b) Measured Impedance Maps ............................... 89

xii
List of Acronyms or Glossary
MRI Magnetic Resonance Imaging
EIS Electrical Impedance Scanning
EIT Electrical Impedance Tomography
C-NCP Conductive Nanoparticle Composite Polymer
MEMS Microelectromechanical systems
LOC Lab-on-a-Chip
PDMS Polydimethylsiloxane
RTV Room Temperature Vulcanizing
CNT Carbon Nanotube
PMMA Polymethyl methacrylate
1
1. Introduction
Cancer is a leading cause of death worldwide, with different types of cancers
having established methods of screening that range in effectiveness, cost, and ease and
availability of the procedure. While a significant improvement in survival rate has
resulted from breast cancer screening technique such as mammography, ultrasound
imaging, and Magnetic Resonance Imaging (MRI) [1, 2], disadvantages and limitations
still exist according to the types of cancer, sex of the patients, or age of the patients. For
example, breast cancer is the most common cancer in women with the exception of non-
melanoma skin cancers, and the most common cause of death in women between the
ages of 20 and 59 [3]. However, mammography exposes the breast to radiation which
can possibly cause breast cancer later in life [4]. As a breast cancer screening technique,
MRI has a high false-positive rate and a high biopsy rate [2], and ultrasound imagining is
highly dependent on the skill of the operator with lack of standardized scanning protocols
[5].
Electrical Impedance Scanning (EIS) systems have been suggested as an
alternative method of detecting cancer as cancerous tissues have difference electrical
characteristics from normal tissue [6]. Cancerous tissues have higher impedance than
normal tissues regardless of age, sex, and types of the cancer. Different types of
cancers possess different impedances, but the impedances are all lower than the
impedance of their respective normal tissues. By applying an AC current to an object via
multiple electrodes in an array, an EIS system produces an impedance map of the object
based on spatial electrical characteristics throughout the volume of the object. Many
studies that have used EIS for cancer detection proved that EIS systems can distinguish
cancerous tissues from normal tissues [7, 8, 9, 10, 11, 12]. However, although EIS has
great potential for cancer tissue detection, it has not become a regular diagnostic tool
due to limitations such as low spatial resolution, poor electrode design, and mechanical
and high impedance skin contact issues [9, 13, 14, 15, 16].

2
In order to overcome some of the limitations of current EIS systems, this thesis
proposes the use of microfabrication to produce high density electrode arrays on a
flexible material that can conform to, e.g., breast tissue during measurement. Flexible
electrodes arrays are expected to have better mechanical skin contact, especially for
applications such as breast imaging or localized skin tissue measurements. While many
researchers have tried to develop flexible electrodes for other applications (e.g.,
actuators and other types of sensors) by sputtering thin metal film on flexible substrates
and etching [17, 18], or via various lift-off processes [19], this thesis proposes a new
type of highly flexible conformable electrode array based on nanocomposite polymers.
For these new electrodes, conductive flexible polymers are fabricated by modified soft
lithography technology. New processes for multi-level structures are developed and
applied for the flexible conductive polymers.
In this thesis, the flexible conductive polymers are developed by dispersing
suitable conductive nanoparticles into silicone-based elastomers and applied to EIS
system as working electrodes for the first time. These highly flexible electrode arrays
have the potential to greatly improve current EIS systems for spatial density, skin contact,
and patient comfort. The flexible electrodes are patterned on a non-conductive polymer
substrate to form flexible electrodes arrays. Silver nanoparticles and graphene
nanoplates are used to make Ag/AgCl electrodes and Ag/graphene electrodes. Several
new multi-level micromolding processes are developed in order to realize suitable
electrode structures with the electrode surface raised above the flexible base, enabling
improved tissue contact.
To test and prove the electrodes’ capability, tissue phantoms are also developed.
Two types of phantoms, gelatin phantom and agar phantom, are developed that possess
different characteristics, and the impedances of the phantoms are measured through the
flexible electrode array. In addition to base impedance of the phantoms, detection of
impurities that are inserted into different regions of the phantoms are also measured and
compared. Different types of electrodes are also tested on the same phantom to
compare each electrode’s test results. Ag/AgCl electrodes are used as both reference
electrodes and working electrodes, and Ag/graphene electrodes, as working electrodes,
are used for comparison. Lastly, the flexible electrodes are tested on real chicken tissue
to demonstrate compatibility with biological systems.
3
The organization of this thesis is as follows. In chapter 2, the principles,
advantages, and limitations of current breast cancer screening methods (mammography,
ultrasound imaging, and MRI) are discussed; as existing EIS systems have been
primarily developed as alternatives for breast cancer screening, it is important to discuss
current state-of-the-art methods for breast cancer screening/detection. Chapter 3
introduces EIS systems. Basic information on EIS, its application in cancer detection,
prior works, and limitations are described, along the electrical properties of tissues. In
chapter 4, new novel methods of developing flexible conductive polymer are presented.
The necessity of flexible electrodes to improve EIS is explained, and new fabrication
processes are presented. Chapter 5 shows the experimental methods and results using
the new electrodes. Impedance measurements of tissue phantoms and their impedance
differences after inserting impurities are compared and demonstrated. Also, impedance
differences caused by using different types of electrode are presented. Finally,
conclusions and proposed future work are discussed in chapter 6, along with a summary
of contributions.
4
2. Methods for Breast Cancer Detection
Cancer is a leading cause of death and major public health problem worldwide.
Many researchers and doctors have researched methods to screen and detect cancers
according to each cancer’s type, and different methods have been developed and
applied to patients.
Breast cancer, specifically, is the most common cancer in women with the
exception of non-melanoma skin cancers, and occurs primarily in females 50-69 years of
age [3]. The American Cancer Society reported that breast cancer continues to be the
most frequently diagnosed cancer in women. Over 230,408 diagnosed new cases and
39,520 deaths among them have been reported in U.S.A in 2011 [3].
Although breast cancer rates for both males and females have increased
continuously, breast cancer mortality rate has been decreasing since the mammography
technique was developed. Mammography is the main screening tool for detecting breast
cancer, and adjunct techniques such as breast ultrasound and MRI also can be used for
the diagnosis. The survival rate of breast cancer has become more than 88%, in part
due to these screening and detection techniques [3].
However, while mammography is still the gold standard and the other techniques
have also been widely adopted, these diagnostic tools still have limitations and
disadvantages that make diagnosis complicated and uncertain. Indeed, EIS, which will
be discussed in Chapter 3, has been primarily developed as a breast cancer screening
tool offering an alternative to these methods. In the remaining sections of this chapter,
the basic concepts, function, and limitations of mammography, ultrasound, and MRI
technologies are reviewed, so that EIS may be placed in the context of these other
techniques.
5
2.1. Mammography
Mammography is the process of using low-dose amplitude X-rays to detect
human breast cancer early and is used as a main diagnostic tool. In mammography,
ionizing radiation is used to create the image of the breast. After radiation penetrates the
breast, radiologists analyze the image of the breast for any abnormal findings. During
the procedure, the breast is compressed using parallel plates to increase image quality
by reducing the thickness of tissue, decreasing the amount of the radiations, and holding
the breast firmly so that the breast cannot move.
As the cancer is not equally curable at every clinical stage, early detection is
critical for the treatment. The use of mammography as a breast cancer diagnostic tool
leads to early detection of the cancer, and has reduced mortality associated with breast
cancer. A study that has been done in Sweden showed that mammography can reduce
mortality by 24% [20]. Another study about mammography and its effect on mortality
also concluded that mammography reduced morality rates in women aged 55-74 years
by 19.9% [21].
However, although mammography has improved the survival rate of women and
is the most effective method for breast cancer detection, it has several limitations: 1)
False negatives and false positives. Mammography has a false-negative rate of 4%-34%
[22]. This is because of dense tissues which are obscuring cancer, and the picture of
cancer on mammograms that overlaps the picture of normal tissues. In addition, in
patients with dense breast tissue, the radiation cannot penetrate the breast deeply, and
this week penetration causes less difference between the images of abnormalities and
normal tissues. Besides false-negatives, false-positives also exist. Mammography or
any other screening procedure is intended to have very high sensitivity so as to not miss
any small cancers. However, a large number of suspicious results are detected due to
this high sensitivity even in normal breast without any abnormality or cancer. These
false-positives lead to unnecessary biopsies. 2) The radiation exposure is a potential risk
of screening [4]. Mammography exposes the breast to a small but significant amount of
radiation, which can be a risky treatment, especially for young patients with many years
of life expectancy over which do develop breast cancer. This radiation can lead to breast
cancer in later stages of life. 3) Patient comfort and convenience. Mammography is
6
generally considered to be uncomfortable because the breast is compressed and the
patient cannot move during the procedure. It may also not be convenient for patients to
travel to a center with the proper mammography equipment, especially if they live in
remote regions.
These limitations of mammography cause unnecessary biopsies or additional
screening procedure to confirm cancer, or, even worse, may miss cancer in patients due
to false negatives or patients avoiding an inconvenient or uncomfortable procedure.
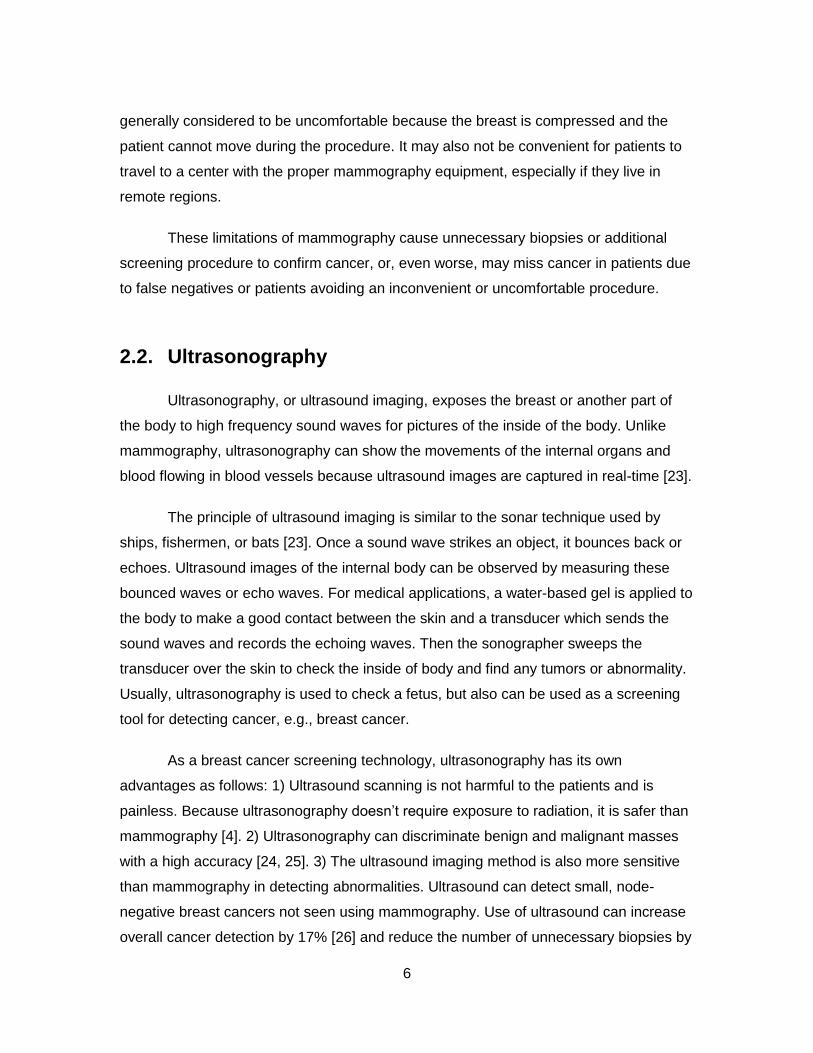
2.2. Ultrasonography
Ultrasonography, or ultrasound imaging, exposes the breast or another part of
the body to high frequency sound waves for pictures of the inside of the body. Unlike
mammography, ultrasonography can show the movements of the internal organs and
blood flowing in blood vessels because ultrasound images are captured in real-time [23].
The principle of ultrasound imaging is similar to the sonar technique used by
ships, fishermen, or bats [23]. Once a sound wave strikes an object, it bounces back or
echoes. Ultrasound images of the internal body can be observed by measuring these
bounced waves or echo waves. For medical applications, a water-based gel is applied to
the body to make a good contact between the skin and a transducer which sends the
sound waves and records the echoing waves. Then the sonographer sweeps the
transducer over the skin to check the inside of body and find any tumors or abnormality.
Usually, ultrasonography is used to check a fetus, but also can be used as a screening
tool for detecting cancer, e.g., breast cancer.
As a breast cancer screening technology, ultrasonography has its own
advantages as follows: 1) Ultrasound scanning is not harmful to the patients and is
painless. Because ultrasonography doesn’t require exposure to radiation, it is safer than
mammography [4]. 2) Ultrasonography can discriminate benign and malignant masses
with a high accuracy [24, 25]. 3) The ultrasound imaging method is also more sensitive
than mammography in detecting abnormalities. Ultrasound can detect small, node-
negative breast cancers not seen using mammography. Use of ultrasound can increase
overall cancer detection by 17% [26] and reduce the number of unnecessary biopsies by
7
40% [27]. 4) Ultrasonography also can detect cancer even in dense breast tissue which
can be a problem in mammography [26, 28]. Ultrasound is more useful for women under
35 ages because young women usually have dense breast tissue. 5) Ultrasound is easy
to use, less expensive, and can be used widely than other imaging techniques.
However, even if ultrasound imaging has lots of advantages, it is mostly used as
adjunct to mammography due to its limitations. 1) Ultrasonography is much more
operator-dependent than mammography [4]. Operators could detect microcalcification
using ultrasound only when they already know the position of the microcalcification [29].
Even trained experts may have a high inter-observer variation rate due to lack of
standardized scanning protocols. Well-trained and experienced radiologists are required
to read ultrasound images, and also computer-aided diagnosis is needed to help
radiologists [30]. 2). False positives and false negatives. Many types of cancers are
invisible on ultrasound, and many calcifications seen on mammography cannot be seen
on ultrasonography due to high rates of false negative and false positive outcomes.
These high rates of false positive and false negative lead to further investigation. [31, 32,
33, 34]. 3) Long testing times. Examination of the whole breasts is time consuming and
recording whole hard copy images is not practical [30]. Furthermore, many facilities don’t
offer ultrasound screening.
For these reasons, the ultrasound imaging technique is not used as the sole
scanning technique. Most suspicious findings on ultrasound require additional
examination such as biopsy, or mammography, in conjunction.
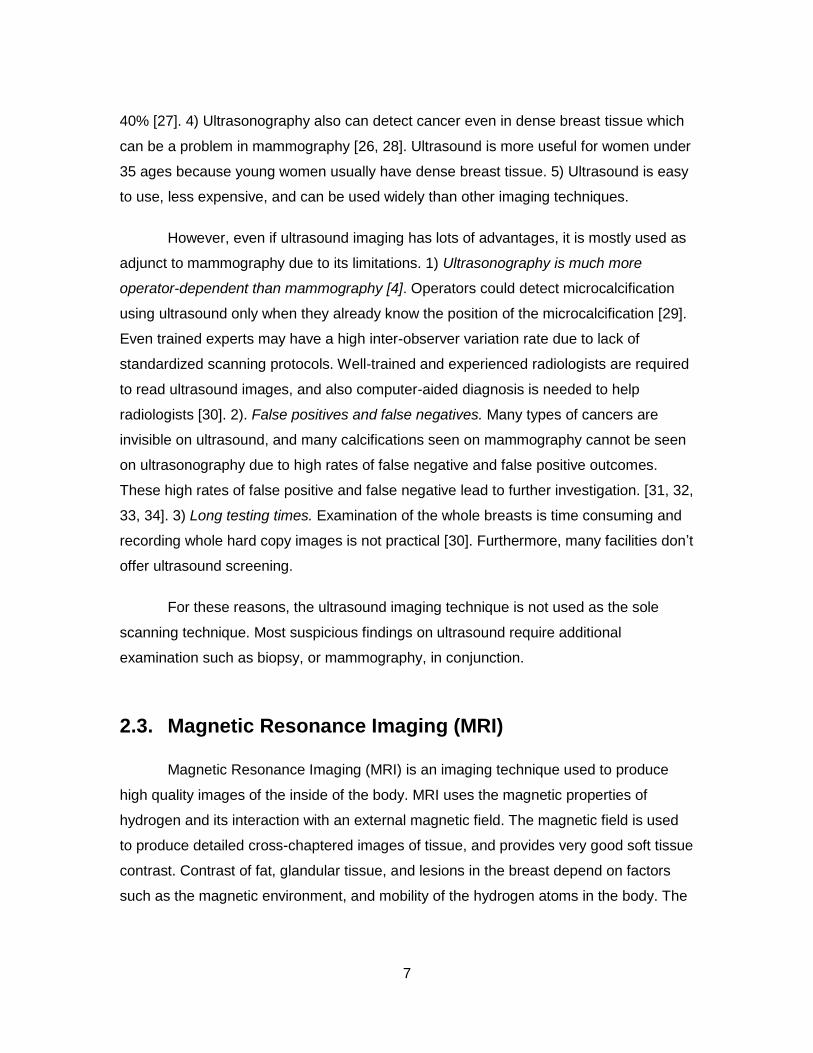
2.3. Magnetic Resonance Imaging (MRI)
Magnetic Resonance Imaging (MRI) is an imaging technique used to produce
high quality images of the inside of the body. MRI uses the magnetic properties of
hydrogen and its interaction with an external magnetic field. The magnetic field is used
to produce detailed cross-chaptered images of tissue, and provides very good soft tissue
contrast. Contrast of fat, glandular tissue, and lesions in the breast depend on factors
such as the magnetic environment, and mobility of the hydrogen atoms in the body. The

8
brightness of tissues is determined by these factors. By comparing the brightness
differences in the image, doctors can detect the cancer.
The biggest advantage of MRI is that it has significantly higher sensitivity (71%-
91%) than mammography (33%-50%), ultrasonography (17%-52%), or even a
combination of mammography and ultrasonography (37.5%-83.3%). Many studies have
demonstrated very high sensitivity of MRI [35, 36, 37, 38].
Although MRI has the highest sensitivity, it also has disadvantages: 1) False
positives. MRI has a higher false-positive rate and a higher biopsy rate. For example, in
a study, MRI group’s biopsy recommendation rate was 8.5% while mammography
group’s biopsy recommendation rate was 2.2% [39]. 2) Low specificity. The specificity of
MRI is much lower than that of mammography or ultrasonography in many studies
resulting in more recalls and biopsies [1, 2, 35, 36, 37, 38]. Call-back rates for additional
imaging rates are 8%-17% in MRI, and biopsy rates are 3%-15% [35, 36, 39, 40]. 3)
Finding small tumours. Most of the cancers detected by MRI screening were 10-20mm in
size [40]. Finding smaller cancers can be difficult with MRI. 4) Very expensive cost.
While mammography costs roughly $100 to $150, MRI costs about $2,000 or more at
some medical centers [41]. Expensive cost makes the burden heavy for the poor, or
even the middle class, and places burden on Canada’s health care system.
2.4. Chapter Summary
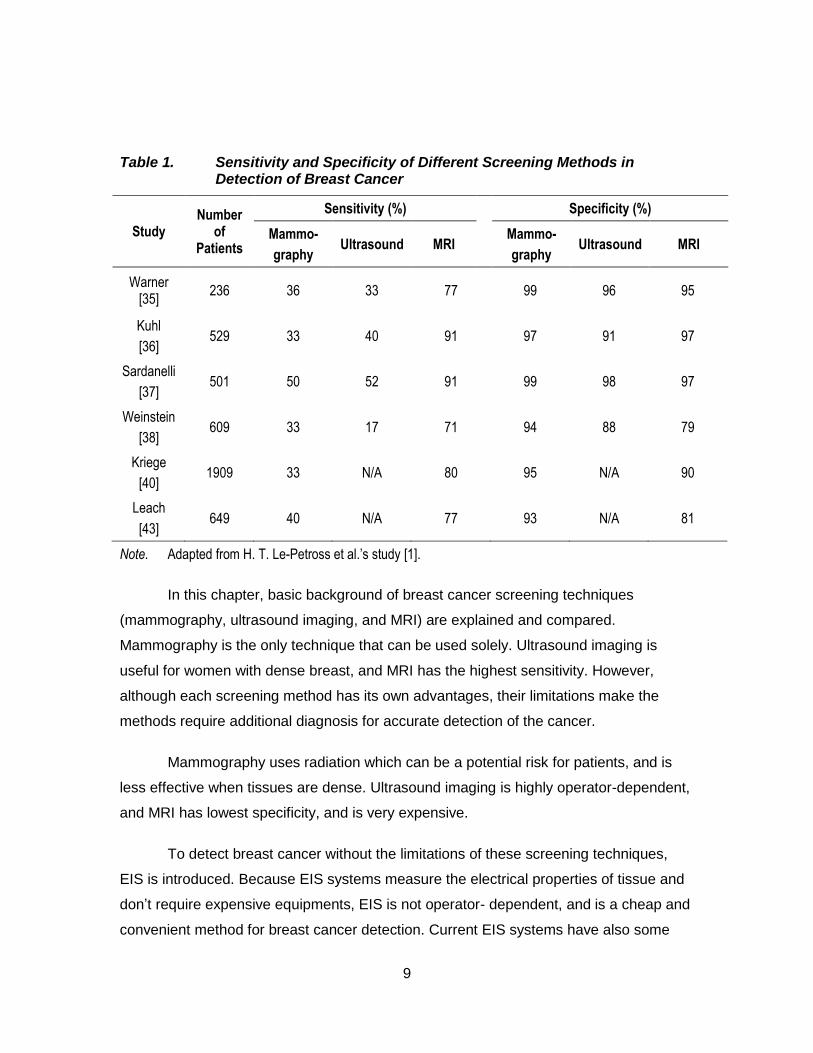
Table 1 summarizes and compares the sensitivity and specificity of each
screening technique. As mentioned above, MRI shows the highest sensitivity among the
techniques, but the lowest specificity which is most significant in two of the studies [40,
42, 43]. On the contrary, mammography has the highest specificity, but low sensitivity
compared to MRI.
9
Table 1. Sensitivity and Specificity of Different Screening Methods in Detection of Breast Cancer
Study Number
of Patients
Sensitivity (%) Specificity (%)
Mammo-
graphy Ultrasound MRI
Mammo-
graphy Ultrasound MRI
Warner [35]
236 36 33 77 99 96 95
Kuhl
[36] 529 33 40 91 97 91 97
Sardanelli
[37] 501 50 52 91 99 98 97
Weinstein
[38] 609 33 17 71 94 88 79
Kriege
[40] 1909 33 N/A 80 95 N/A 90
Leach
[43] 649 40 N/A 77 93 N/A 81
Note. Adapted from H. T. Le-Petross et al.’s study [1].
In this chapter, basic background of breast cancer screening techniques
(mammography, ultrasound imaging, and MRI) are explained and compared.
Mammography is the only technique that can be used solely. Ultrasound imaging is
useful for women with dense breast, and MRI has the highest sensitivity. However,
although each screening method has its own advantages, their limitations make the
methods require additional diagnosis for accurate detection of the cancer.
Mammography uses radiation which can be a potential risk for patients, and is
less effective when tissues are dense. Ultrasound imaging is highly operator-dependent,
and MRI has lowest specificity, and is very expensive.
To detect breast cancer without the limitations of these screening techniques,
EIS is introduced. Because EIS systems measure the electrical properties of tissue and
don’t require expensive equipments, EIS is not operator- dependent, and is a cheap and
convenient method for breast cancer detection. Current EIS systems have also some

10
limitations such as poor electrode design, skin contact problem, and low spatial
resolution, but these limitations may be solved by developing flexible conductive polymer
electrodes. While exact comparisons to the numbers in Table 1 are not discussed in EIS
reports, other comparisons are made, as discussed in the next chapter that shows EIS
as a promising technique.
11
3. Electrical Impedance Scanning (EIS) as a Cancer Screening Method
In this chapter, the general concept of EIS is explained. The advantages of an
EIS system as a screening tool are described with an explanation of electrical properties
of normal tissues and cancerous tissues. Other researchers’ prior work and the
limitations that they encountered are also reviewed as well.
3.1. Electrical Impedance Scanning (EIS) System
Electrical Impedance Scanning (EIS) is a promising alternative way to detect
cancer, especially breast cancer, because the electrical properties of normal tissues and
cancerous tissues are different [6]. The impedance map of an object can be produced by
an EIS system, and if the object has any impurity in it, different impedances will be
observed. An impedance analyzer helps to measure the impedance of the object. The
impedance analyzer uses very mild electrical pulses (AC current) to measure the
impedance (both resistance and reactance) of the object being scanned. When the AC
current passes through tissue via two electrodes on the skin, the analyzer measures the
impedance of the tissue between the two electrodes by Ohm’s law, and sends the
results to a computer. Then the computer software divides the impedance into reactance
and resistance, and can draw a Cole-Cole plot (resistance vs. reactance graph).
EIS is a promising avenue of research to diagnose breast cancer less invasively
compared to mammography because it does not pose any radiation threat or have any
other known hazards. In addition, unlike mammography, EIS has the potential for more
accurate diagnosis than mammography because EIS is a technique based on the
electrical properties of individual’s tissues; no matter how dense or soft the tissues are,
and no matter how old or young the patient is, EIS has the advantage of comparing the
difference between normal tissue and cancerous tissue in that specific patient. If a
12
person has breast cancer, the impedance of the position where the cancer is located will
have different values from the impedance of normal tissue. On the contrary, if the person
doesn’t have cancer, every position’s measured impedance will have quite similar results.
As a result, the EIS method can be very useful for detecting cancers that may have not
been detected by mammography previously because EIS is not affected by the patient’s
age, sex, density of tissue; it relies solely on comparison within the patient.
Electrical Impedance Tomography (EIT) is a similar technique to EIS. EIT
acquires the impedance information through electrodes placed on the body surface just
like EIS, but the results are processed by a computer to produce reconstructed
tomographic 2D or 3D images of the impedance distribution within the body through a
reconstruction algorithm [6]. Many researchers have applied EIT and EIS systems for
detection of cancer.
3.2. Electrical Properties of Tissue
To understand the electrical properties of human tissues, we need to discuss the
basic electric elements such as resistance, conductance, capacitance, and permittivity,
before placing them into the context of biological tissue. First, resistance is a measure of
an object’s opposition to the passage of an electric current. Resistance is proportional to
length and inversely proportional to cross-sectional area, and proportional to the
resistivity of the material. Conductance is the inverse of resistance. Conductance means
how easily electricity flows along a certain path through an object. Next, capacitance is a
property of opposing a change in voltage across an object. A capacitance consists of
two conductors with each conductor oppositely charged to the other and separated by a
dielectric material. Capacitance is related to the surface area of the conductor and
inversely related to their separation distance (in the case of conductors that are parallel
plates, these relations are directly proportional). Lastly, permittivity indicates how much
resistance is encountered when forming and electric field. Permittivity is a measure of
how an electric field affects a dielectric material.
The complex impedance (Z) of RC circuit can be described as Z = R+jXc, where
Xc = 1/C and f (f is frequency). The impedance also can be described as Z =
13
Z/where Z is the magnitude (Z2 = R2+Xc2) and is the phase angle of the impedance
( = arctan(Xc/R)).
3.2.1. Normal Tissue
Human tissues consist of cells and extracellular medium, and cells consist of the
cellular membrane and the intracellular medium [13]. As a result, electrical properties of
tissues are determined by these three components. More specifically, the extracellular
medium consists primarily of ionic solutions that act like a resistance, and the cellular
membrane consists of a lipid bilayer and proteins. The cellular membrane is slightly
permeable to ions, and thus, acts like a capacitor because of its bilayer structure. The
intracellular medium is an ionic solution similar to extracellular medium. We can study
electrical properties of tissues by developing a similar RC circuit.
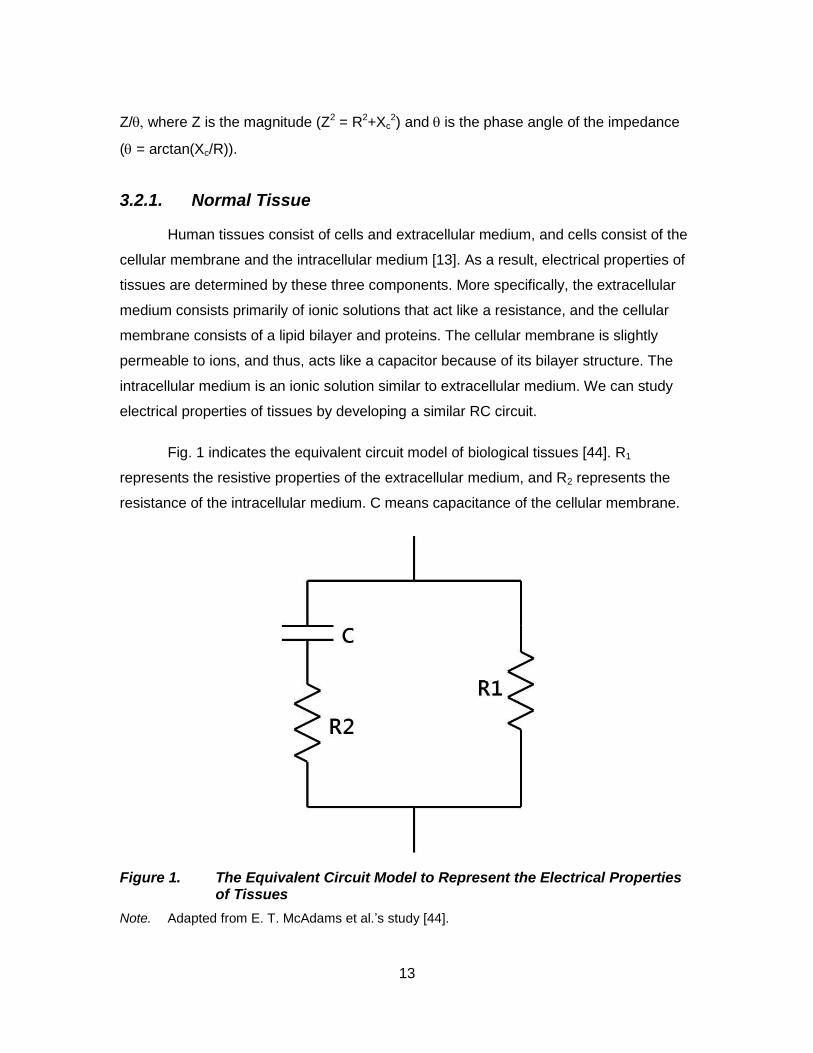
Fig. 1 indicates the equivalent circuit model of biological tissues [44]. R1
represents the resistive properties of the extracellular medium, and R2 represents the
resistance of the intracellular medium. C means capacitance of the cellular membrane.
Figure 1. The Equivalent Circuit Model to Represent the Electrical Properties of Tissues
Note. Adapted from E. T. McAdams et al.’s study [44].
14
Although tissues can be described using electrical elements, real electrical
phenomenon in tissues is different from a simple RC circuit. This is because the
contribution of each component (extracellular medium, cell membrane, and intracellular
medium) to the tissue impedance is varying at different frequencies. At low frequency
(less than 1KHz), most of the tissue impedance is from the ionic extracellular fluid, which
are primarily conductance values. At higher frequencies, on the other hand, capacitance
of the cell membrane forms a larger portion of the impedance.
3.2.2. Cancerous Tissue
Researchers have studied cancerous cells and tissue and have shown that
cancerous tissues have different electrical properties from normal tissues’ electrical
properties. First, cell membranes of cancer cells have different electrochemical
properties and a different distribution of electrical charges than normal tissues. A healthy
cell membrane potential is strongly related to the control of cell membrane transport
mechanisms. However, cancer cells cannot maintain a normal membrane potential, and
this change in potential causes electronic dysfunctions [44, 45]. Cancer cells exhibit
lower electrical membrane potentials due to this lower membrane potential which means
they have weak electrical field strength. The metabolic functions of cancerous cells are
altered by this weakened electric field. Concentration of potassium in the cell is reduced
and concentrations of sodium and water are increased [46]. In addition, cancer cells
have altered membrane composition and membrane permeability, and have different
lipid and sterol content than normal cells [47].
According to this prior research, it is certain that cancerous tissues have higher
intracellular sodium and water, and lower intracellular potassium, magnesium and
calcium concentrations. These abnormalities result in lower membrane potentials than
normal tissues and altered membrane permeability. As a result, cancerous tissues have
higher conductivity than normal tissues.
3.3. Cole-Cole Plot
The Cole-Cole plot method helps to easily interpret the electrical impedance
characteristics of an object [13]. In a Cole-Cole plot, the real component R (resistance) is
15
plotted versus the imaginary component X (reactance) in the complex series impedance
(R+jX) with the frequency as a parameter. The Cole-Cole plot method is very important
for prototyping purposes because it is the easiest and most certain way for comparing
the impedance difference between two tissues.
Cancerous tissue has higher electrical conductivity than normal tissue because
tumor cells possess more water and sodium than normal cells. If a patient doesn’t have
cancer, the impedance of the whole measured area will present the same Cole-Cole
plots. On the contrary, if the patient has cancer, the impedance of cancerous part will
present a different Cole-Cole plot. By comparing these Cole-Cole plots, we can detect
the breast cancer lesion.
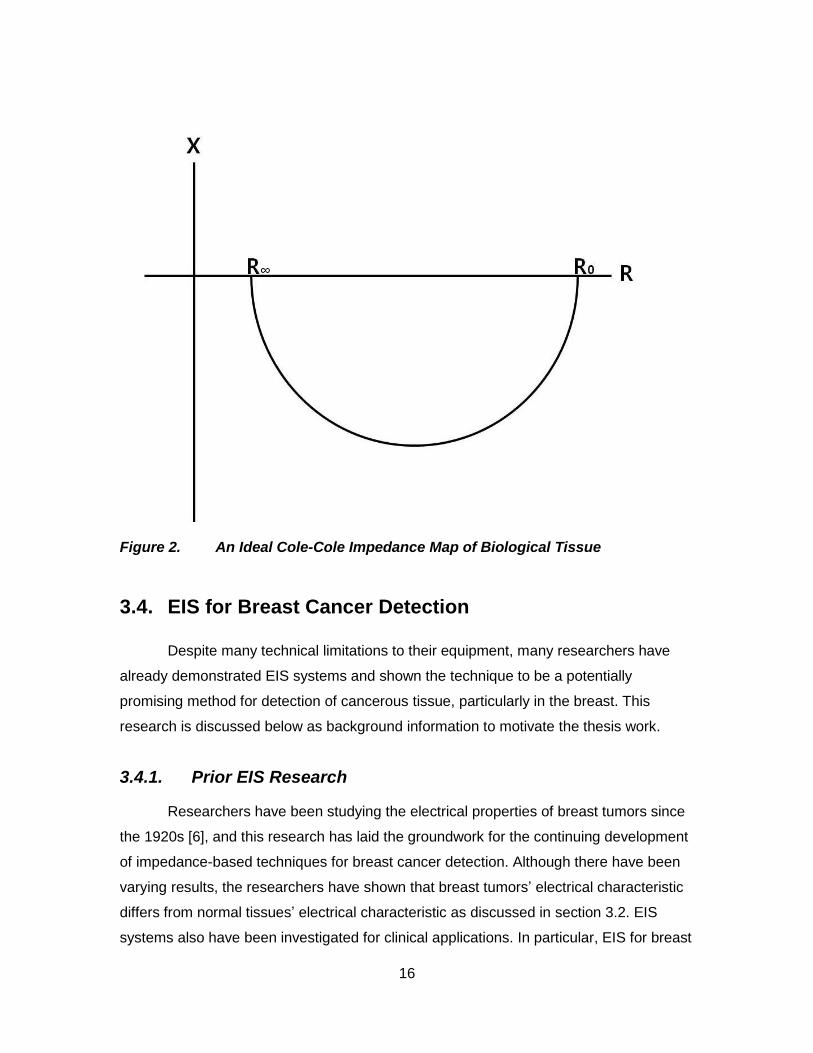
Figure 2 shows an ideal Cole-Cole plot. R represents resistance and X
represents reactance. R0 is the resistance at zero frequency, and Roo is the resistance at
infinite frequency. The ideal Cole-Cole plot is a semicircle with radius (R0-Roo)/2 ideally.
As described in Figure 1 with its explanation, the cell membrane acts like a capacitor,
and there is no inductive behavior in the cells or in the cell models. As the result, the
imaginary part (reactance) of the impedance always has negative values, and cannot be
positive. The current always leads the voltage.
16
Figure 2. An Ideal Cole-Cole Impedance Map of Biological Tissue
3.4. EIS for Breast Cancer Detection
Despite many technical limitations to their equipment, many researchers have
already demonstrated EIS systems and shown the technique to be a potentially
promising method for detection of cancerous tissue, particularly in the breast. This
research is discussed below as background information to motivate the thesis work.
3.4.1. Prior EIS Research
Researchers have been studying the electrical properties of breast tumors since
the 1920s [6], and this research has laid the groundwork for the continuing development
of impedance-based techniques for breast cancer detection. Although there have been
varying results, the researchers have shown that breast tumors’ electrical characteristic
differs from normal tissues’ electrical characteristic as discussed in section 3.2. EIS
systems also have been investigated for clinical applications. In particular, EIS for breast
17
cancer detection has been actively studied. The following review discusses important
representative works.
In 1990, G. Piperno et al. [48] performed the EIS technique on 6000 patients.
They used an 8 x 8 matrix of square electrodes, and four images were obtained for each
breast. Every patient underwent palpation, thermography, ultrasonic examination,
mammography, and EIS. In five cases, EIS identified malignancies, and in nine cases, it
identified cancerous lesions when other tests showed negative results. Due to the high
degree of false negatives associated with the gold standard of mammography, this result
is significant.
Melloul et al. [8] also used an EIS system to detect breast cancer. In their study,
121 patients with identified breast lesions participated in the examination, and eighteen
of them had breast carcinoma. Melloul and colleagues could detect lesions 3mm in
diameter at their first examination. In 2000, they performed EIS again, and palpation,
mammography, and ultrasound methods are included in this study. Fifty eight suspicious
lesions were biopsied and EIS provided 10 false-positive results.
Cherepenin et al. [9] used the EIT technique to make 3D images of breast tissue.
They developed a compact array of cylindrical protruding stainless steel electrodes, and
the electrodes were arranged in a rigid dielectric plane. In that study, 21 women
participated in the test, and Cherepenin et al. reported that 86% of examinations were
found to fully or partially agree with diagnoses done by mammography and biopsy. 14%
of the discrepancies were caused by enlarged breasts that hampered examination due
to limited scanning depth. Also, some examinations were performed after medical
treatments like puncture, biopsy, or x-ray therapy which influenced the results.
3.4.2. Limitations of Current EIS Systems
Although EIS has great potential for breast cancer detection as described above,
it has not become a regular diagnostic tool due to some limitations. Limitations include
low spatial resolution, poor electrode design, and skin contact issues. These limitations
are primarily due to problems interfacing to the patient or inherent to the electrode
designs, which tend to be macro scale electrodes developed using conventional
18
machining techniques. The large size, small number, and inflexibility of electrodes result
in poor electrical contact with the skin and low spatial resolution.
For example, Morimoto et al. used a three-electrode method to measure the
impedance of breast tumor in vivo [10, 11]. A coaxial needle electrode which consisted
of two working electrodes in the needle was used in this study, and a large plate
electrode was also placed on the abdomen due to its large size as a reference electrode.
However, needle type electrodes are not desirable because needles are invasive and
many people have a fear of needles due to the pain and invasive nature of needles.
Cherepenin et al. used a compact array of stainless steel electrodes that are
arranged in a rigid dielectric plane [9]. Two additional electrodes are used as potential
reference and ac current source. The electrode plane is pressed against the breast
flattening it toward the chest. However in this method, the patient can feel uncomfortable
when the large electrode plate is pressed. Furthermore, there is no way to characterize
the electrode/skin contact to confirm that the electrodes make a good contact with breast.
In Osterman et al.’s research [12], 16 electrodes were in direct contact with the
breast through a ‘radially translating interface’. The electrode array was located below an
examination table, on which a participant would lie face down with the breast to be fit in
the electrode array. However, this method is available only for a subset of persons
because the size of electrode array is unchangeable.
All these methods mentioned above provided some good results as already
outlined previously; however, many limitations are still required to be solved. First, the
electrodes should not be harmful, invasive, or uncomfortable to the patient. Electrodes
like a needle type which causes pain or large heavy stainless steel plate that should be
pressed against the breast are undesirable in actual application. Also, the electrodes
should make a good contact with tissue to acquire exact results, and should have small
size to get a good spatial resolution. Lastly, the electrodes should be available for all
types of patients and conform to a wide set of breast shapes and sizes. This thesis work
was shaped by these goals.
19
4. Development of the Flexible Electrode Array
To overcome the limitations of current breast cancer screening techniques and
improve current EIS technology to make it a competitive alternative screening technique,
this thesis proposes a new type of highly flexible and micropatternable electrode array.
The flexible electrodes are developed using new micromolding process employing novel
highly conductive nanocomposite polymers.
In this chapter, the required proper characteristics of the electrode will be
discussed first. For the application of the electrode array to EIS systems, the electrode
should satisfy several conditions such as uniform conductivity, non-polarizability, and
flexibility. These conditions are explained with desired electrode array design. Next,
fabrication processes of the electrode array are introduced. New fabrication processes
are developed and implemented. Also, actual electrode arrays are fabricated following
the new process.
4.1. Desired Properties of Flexible Conductive Electrodes
4.1.1. Uniform Conductivity of the Electrode
The electrodes employed for tissue measurements should possess stable and
uniform conductivity. If the conductivity is not stable, it is impossible to measure the
exact tissue impedance. The key point of achieving stable and uniform conductivity is
the amount of particles used to dope the base polymer.
The amount of the particles is also important in developing successful conductive
polymers. If the amount of particles is too high compared with the amount of the base
polymer, the mixture of the nanoparticle and polymer will lose its flexibility or even will
not be cured at all. On the other hand, if the amount of the particles is too small, the
mixture will not be sufficiently conductive due to lack of conductive paths in the mixture.
20
At a certain amount of nanoparticles, the particles are sufficiently connected to
form conductive pathway through the composite and the conductivity of the nanoparticle
composite polymer increases sharply [49]. The point that the conductivity increases
sharply is called percolation threshold. To make the polymer conductive, the amount of
the nanoparticles should be higher than the percolation threshold.
4.1.2. Perfectly Nonpolarizable Electrode
In this project, the electrodes will be used for medical purpose, i.e., the
electrodes will be in contact with human skin for impedance measurements. In the
human body, water is the most common molecule, and hence it is the most abundant
solvent. A majority of the chemical reactions involve molecules dissolved in water,
known as an ion electrolyte. In addition to chemical reactions, current in the body is also
carried by ions. Thus, the electrodes should serve as a transducer because current in
the electrodes is carried by electrons.
The electrodes should be able to change an ionic current into an electronic
current, and vice versa. Generally, two types of electrodes are possible: perfectly
polarizable electrodes, and perfectly nonpolarizable electrodes [50]. The difference
between these two types of electrodes depends on what happens to the electrodes
when a current passes between them and the electrolyte. Perfectly polarizable
electrodes change their potential when current is applied, and act like a capacitor. Hence,
current can’t pass the electrode-electrolyte interface freely and flow upon a change of
potential. Normal metal electrodes are perfectly polarizable electrodes so they are not
suitable for accurate tissue impedance measurements.
On the other hand, perfectly nonpolarizable electrodes are practically not
polarizable. The potential of the electrodes will not change from its equilibrium potential
even when a large current is applied. That is, current can pass freely across the
electrode-electrolyte interface without any energy to make the transition. Therefore,
perfectly nonpolarizable electrodes are more suitable for measuring accurate tissue
impedance.
21
4.1.3. Flexibility
The main advantage of conductive nanocomposite polymer electrodes is their
high degree of mechanical flexibility. As mentioned in section 3.4.2, electrodes such as
large metal plates or needles are used for tissue impedance measurements, and these
electrodes caused poor spatial resolution and poor electrical contact between the
electrode and skin. However, development of micropatternable, flexible electrode arrays
could potentially solve all these problems because flexible substrate provides conformal
contact to curved surface, and high spatial resolution is possible.
4.2. General Prototype Design
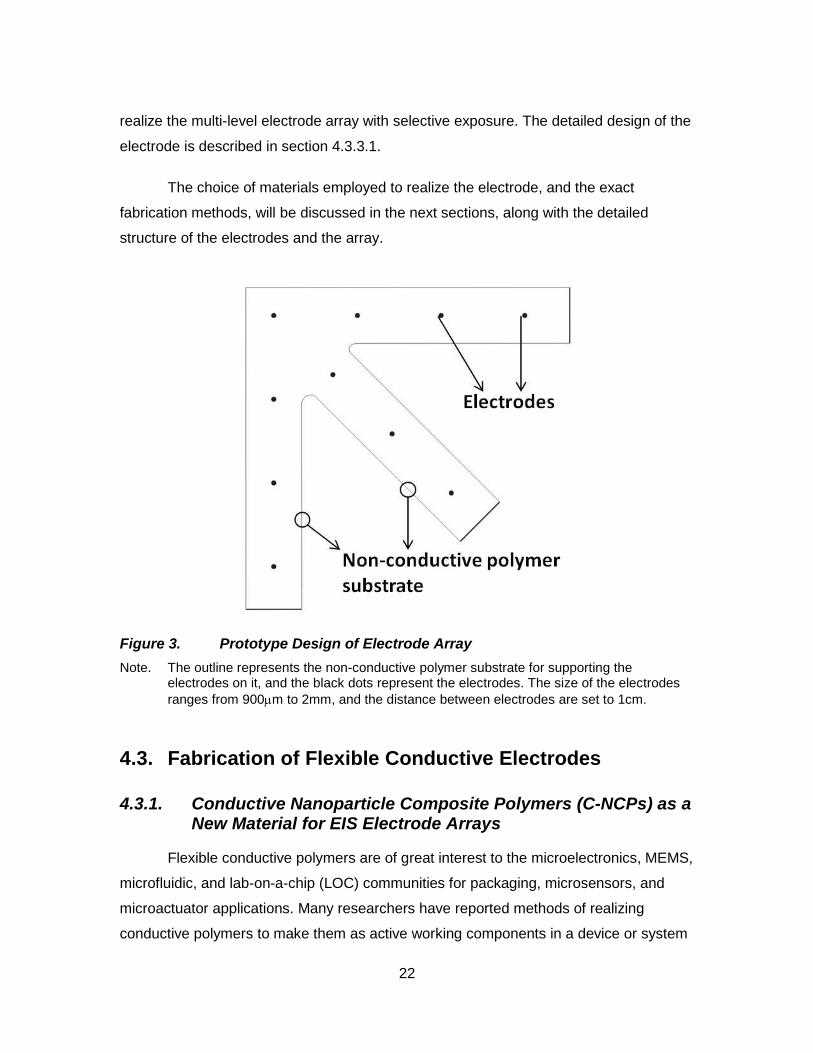
In this thesis, an electrode array that consists of ten electrodes is developed as a
prototype array. Figure 3 illustrates the design of the electrode array. The array has
three branches so that each branch can be attached to a different portion of the curved
subject without loss of contact between the electrode and the subject, and each branch
has three electrodes (shown as the labelled black dots in the figure) on it. As a prototype,
the pitch between the electrodes are set to 1cm, but can be decreased down
significantly to several millimeters or even the micron scale. The size of each electrode
ranges from 900m to 2 mm in diameter depending on design.
This design was developed as shown for several reasons. First, the design
shows one-quarter of full circular design, with the idea that the behavior of a full circular
array of electrodes can be extracted via symmetry, while the one-quarter design is
easier to work with as a manually handled prototype than a full circular array would be.
Secondly, the spacing was chosen to be denser than many in currently available studies
[9, 10, 11, 12] while still being easy to work with for prototyping purposes. As noted, this
spacing could be decreased even if the electrode size was kept the same. In this thesis,
the spacing is set to 1cm, and the electrode contact areas ranged from 900m to 2mm
depending on design because this is sufficiently large to provide good contact. Different
sizes (900m and 2mm in diameter) and structures (single layer and two layers) of
electrodes are developed and tested as prototype electrode and working electrode to
22
realize the multi-level electrode array with selective exposure. The detailed design of the
electrode is described in section 4.3.3.1.
The choice of materials employed to realize the electrode, and the exact
fabrication methods, will be discussed in the next sections, along with the detailed
structure of the electrodes and the array.
Figure 3. Prototype Design of Electrode Array
Note. The outline represents the non-conductive polymer substrate for supporting the electrodes on it, and the black dots represent the electrodes. The size of the electrodes
ranges from 900m to 2mm, and the distance between electrodes are set to 1cm.
4.3. Fabrication of Flexible Conductive Electrodes
4.3.1. Conductive Nanoparticle Composite Polymers (C-NCPs) as a New Material for EIS Electrode Arrays
Flexible conductive polymers are of great interest to the microelectronics, MEMS,
microfluidic, and lab-on-a-chip (LOC) communities for packaging, microsensors, and
microactuator applications. Many researchers have reported methods of realizing
conductive polymers to make them as active working components in a device or system
23
[51, 52]. For the EIS application, one possible method of fabricating flexible electrode
arrays is to deposit thin metal film on a flexible polymer substrate. For example, Patel et
al. fabricated flexible glucose sensors by depositing thin gold film on
polydimethylsiloxane (PDMS) [17]. Although the sensors were not used as an electrode
for EIS in Patel’s project, the metal-on-polymer samples were tested for impedance
measurements and proved that this method is not suitable for EIS because of the weak
adhesion between the metal film and PDMS substrate. Furthermore, when a highly
flexible PDMS substrate is bent, flexed, or twisted, microcracks occur in the metal film.
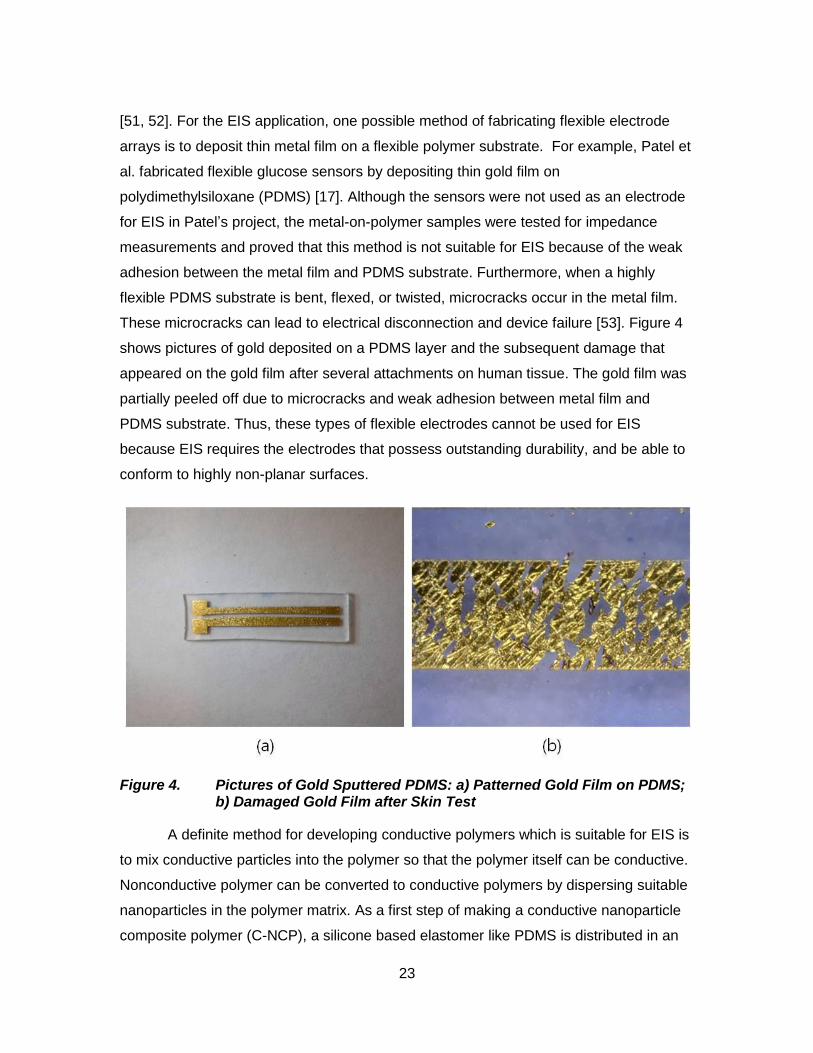
These microcracks can lead to electrical disconnection and device failure [53]. Figure 4
shows pictures of gold deposited on a PDMS layer and the subsequent damage that
appeared on the gold film after several attachments on human tissue. The gold film was
partially peeled off due to microcracks and weak adhesion between metal film and
PDMS substrate. Thus, these types of flexible electrodes cannot be used for EIS
because EIS requires the electrodes that possess outstanding durability, and be able to
conform to highly non-planar surfaces.
Figure 4. Pictures of Gold Sputtered PDMS: a) Patterned Gold Film on PDMS; b) Damaged Gold Film after Skin Test
A definite method for developing conductive polymers which is suitable for EIS is
to mix conductive particles into the polymer so that the polymer itself can be conductive.
Nonconductive polymer can be converted to conductive polymers by dispersing suitable
nanoparticles in the polymer matrix. As a first step of making a conductive nanoparticle
composite polymer (C-NCP), a silicone based elastomer like PDMS is distributed in an
24
organic solvent such as heptane to loosen the tight bonds of the elastomer [53]. After the
elastomer is distributed well in the solvent, conductive particles are added and
distributed to the polymer-heptane solvent, and mixed through ultrasonication until the
heptane is evaporated, resulting in a uniform distribution of nanoparticles in the polymer
matrix, which remains during curing.
Electrodes employed for tissue measurements should possess stable and
uniform conductivity. If the conductivity of the electrodes is unstable and varies, tissue
impedance cannot be measured precisely. Acquiring uniform electrode conductivity
depends on dispersion of nanoparticles in the elastomer. The more nanoparticles that
are dispersed evenly, the higher and more uniform the electrode conductivity. Dispersion
is the key for developing the conductive polymer. However, mixing nanoparticles in the
polymer matrix evenly is not easy because the nanoparticles tend to agglomerate.
Physical dispersion and chemical dispersion can be used for nanoparticle’s
dispersion [53]. For this project, physical dispersion, especially ultrasonic agitation, is
used to disperse the nanoparticles. Ultrasonication is the act of applying ultrasonic
waves (> 20KHz) to agitate particles in a sample. Ultrasonication is the most popular
method to ensure that nanoparticles are distributed evenly in a solvent, and follows
manual stirring. The ultrasonic waves lead collisions between the nanoparticles, and the
agglomerated nanoparticles are separated from each other so that they can be
distributed throughout the solvent evenly. Shear mixing and ball milling are also possible
for nanoparticle dispersion [53], but better dispersion is achieved in a shorter time when
ultrasonication is used.
To summarize, the general process for making C-NCPs are as follow:
1. Distribute the base polymer in an organic solvent such as heptane or toluene via ultrasonication.
2. Add the desired quantity of conductive nanoparticles to the solvent in which the polymer is diluted.
3. Mix the nanoparticles with the diluted polymer using ultrasonication until the organic solvent evaporate.
4. Pattern the nanoparticle composite polymer using molds (explained in detail in section 4.3.3).
25
4.3.2. Choice of Materials for Conductive Nanocomposite Polymer Electrode Arrays
4.3.2.1. Base Polymer
In this thesis, conductive nanocomposite polymer electrode arrays were
developed for the EIS system. The electrodes should be flexible and biocompatible
because the array will be attached on non-planar human tissue as mentioned in section
4.1, and should be supported by a non-conductive polymer substrate. As a result, a base
polymer should be flexible, biocompatible, and non-conductive. As a base polymer that
satisfies all these properties, polydimethylsiloxane (PDMS) (Dow Corning, Sylgard 184
Elastomer Kit) and a silicone based elastomer sealant (Dow Corning 734) were chosen
to develop prototype conductive flexible electrodes.
PDMS, a silicone based elastomer, has many useful properties including [54]:
• PDMS has a good chemical stability. PDMS is chemically inert and non-toxic.
• PDMS is not hydroscopic, i.e., PDMS doesn’t swell with humidity.
• PDMS is optically transparent down to 300nm, and has good thermal stability up to 186°C in air. PDMS can be cured thermally.
• PDMS is isotropic and homogeneous.
• PDMS is durable. For example, a PDMS stamp can be used more than 50 times over a period of several months without noticeable degradation in performance [55]. Using PDMS as supporting substrate will make the electrode array durable.
• PDMS is flexible and biocompatible. PDMS can be deformed mechanically to change its structure or patterns, and can be applicable for medical purpose.
• PDMS is cheap, and has low electrical conductivity.
Although PDMS has many advantages mentioned above, PDMS requires a
curing agent to be cured, and the curing time is 48 hours at room temperature. To avoid
these disadvantages, a silicone based elastomer sealant was also used. The sealant
has quite similar properties to PDMS but was also used as a base polymer because the
sealant can be cured very quickly at room temperature (within 24 hour) and doesn’t
require any additional material such as curing agent as it is a one-part room temperature
vulcanizing (RTV) material. Faster curing prevents the nanoparticles from accumulation
26
and agglomerating, and enables the uniform distribution of nanoparticles during the
curing process.
4.3.2.2. Material for Molds
For most soft lithography processes involving molding of PDMS, a
photolithographically produced mold employing thick film photoresist such as SU-8 has
traditionally been employed. SU-8 molds enable nano-sized structures. For example,
Wang et al. patterned microfluidic channels (250nm width and 200nm depth) on SU-8
using UV cured imprinting [56]. However, due to the solvents required for good
nanoparticle dispersion, SU-8 molds were found to be unsuitable as the solvent, heptane,
altered the SU- 8 structures [53]. The structures on SU-8 mold were deformed by the
swelling of SU-8.
To overcome this problem, various low cost materials were tried, and polymethyl
methacrylate (PMMA) was chosen for its low cost, chemical inertness, biocompatibility,
mechanical strength, and optical properties. PMMA is optically transparent, chemically
inert, and does not swell or otherwise alter in the presence of solvent. Unlike an SU-8
mold, PMMA can be used for a long time due to its hardness and chemical inert without
any damage or swelling. More detailed information is explained in section 4.3.3.1.
4.3.2.3. Conductive Nanoparticles
According to Publicly Available Specification 71 (PAS71) document developed in
the UK, a nanoparticle is a particle of the order of 100nm or less. At least one dimension
of the particle should be smaller than 100nm. Many properties of nanoparticles are
different from those that have sizes measured in micrometers, or from bulk material.
Many types of nanoparticles that consist of metal (gold, aluminum, or silver), elements
(graphene, CNT’s, or carbon), alloys (Zinc Iron, or Nobium), or oxides (Iron III oxide)
have become commercially available [53] which makes researching with these particles
easier than in previous years.
Nanoparticles can be classified according to their shape: nanopowders,
nanotubes, nanoflakes, nanoplates, nanowires, etc. A nanoparticle’s shape is an
important factor to be considered when developing a conductive polymer employing the
nanoparticle because the shape of the particle affects the electrical properties of the

27
conductive polymer significantly. According to the electromagnetic wave percolation
theory, if the dimension of the conductive particle is in a nanometer size and retains a
high-aspect ratio, the particles can more easily form a conductive network with small
amount [57]. In other words, it is easier to get high conductivity with high aspect ratio
particles such as nanotubes or nanorods because these particles can make electrical
paths more easily. It has been also proven that the needed amount of particles will be
reduced if the particles have high-aspect ratio [58]. The percolation threshold mentioned
in section 4.1.2 is inversely proportional to the aspect ratio of the particle. The particles
with high-aspect ratio can decrease the percolation threshold; decreased percolation
threshold results in smaller amount of the particles.
For this project, silver (Ag) nanopowders (NanoAmor, 99% purity, 90-210nm size)
were chosen as the conductive material. Other materials such as gold or platinum are
also available, but Ag particles were chosen for their high conductivity, and their
potential to make perfectly nonpolarizable electrodes through a subsequent surface
chlorination step resulting in silver/silver chloride (Ag/AgCl). As mentioned in section
4.1.2, the electrodes should perfectly nonpolarizable for accurate impedance
measurements, and the Ag/AgCl electrode is a practical electrode that satisfies the
characteristics of a perfectly nonpolarizable electrode, and can be used as a reference
electrode as well.
Graphene is also used for developing another type of electrode. Graphene is
chosen for its shape and conductivity. As mentioned above, the shape of particles
affects the conductivity of the electrodes and the required amount of the particles greatly.
Graphene is an allotrope of carbon and made of carbon atoms that arranged on a
honeycomb structure [59]. The honeycomb structure of the graphene can increase the
chances of connection between conductive particles inside the base polymer and
chances of creating electrical paths. Graphene nanoplatelet (CheapTubes, 8nm
thickness, 2m diameter, 4-5 layers) was purchased, and mixed with Ag particles to
develop Ag/Graphene electrodes for comparison with Ag/AgCl electrodes. Justification
for development of Ag/graphene electrodes, even though they are polarizable, is
covered in section 5.3.
28
4.3.3. New Fabrication Technique for Flexible EIS Electrode Array
This section discusses a newly developed fabrication processing technique. First,
the development of the molds will be discussed. The micromachining process of PMMA
is explained in detail including information of the reason why the process is chosen, how
the process makes the molds, and what advantages and disadvantages the process has.
Next, a new multi-level fabrication process developed specifically for the electrode array
will be demonstrated. Two optimized fabrication processes for the electrode array are
introduced. Every single fabrication step is explained in detail, and photos of the actual
electrode are presented to support the explanation. Lastly, two different types of
electrodes, Ag/AgCl and Ag/graphene, are introduced. Information such as the
nanoparticle’s type, used weight percentage of the particles, and the chlorination
process are discussed.
4.3.3.1. PMMA Molds Preparation
For micromachining process of PMMA, various methods such as electron beam
lithography, plasma etching, CO2 laser ablation technique, etc can be used [60, 61, 62].
It is possible to make a PMMA molds with nano-sized structures using electron beam
lithography, but, in this thesis, the CO2 laser ablation technique is used to make PMMA
molds for below reasons:
• Although the laser ablation machine has resolution limits of approximately
50m or so, for prototype electrode arrays, and even in actual electrodes for medical application, this resolution is likely to be sufficient. Microstructures
that have 100m size can be easily etched with the laser ablation machine [62].
• Usage of the laser ablation machine provides an easy and inexpensive way to achieve microstructures on a hard substrate. Laser ablation doesn’t require masks for ablation. The desired structure designs can be drawn using the CorelDRAW program, and the laser ablation machine receives the design from the computer directly, and ablates the PMMA substrate automatically. Actual masks for etching or ablation are not needed.
• When PMMA is etched photolithographically, more controlled environments such as clean room and fume hood, and procedures such as coating of photoresist, mask alignment, or chemical etching are required. These processes are more complicated, dangerous, and time consuming, and are not needed unless higher resolution than that achievable with laser machining is required. However, for CO2 laser ablation, only computer files of desired design and laser ablation machine are all needed. Using the CO2 laser
29
ablation machine requires less time for patterning, and is very simple, convenient, and safe.
• Structures that have deep depth (> 1mm) cannot be achieved through other micromachining process like plasma etching, or electron beam lithography.
For this project, a laser ablation machine (VLS3.50, VersaLASER) that has a
laser cartridge with a maximum rated power of 60 watts is used. It is observed that the
channel depth increases linearly with the power of the laser and decreased exponentially
with the laser beam speed [53].
While the laser ablation method has many advantages, and is sufficient for
micromold development in terms of the resolution, structure sizes, and speed of making
molds, some disadvantages also exist:
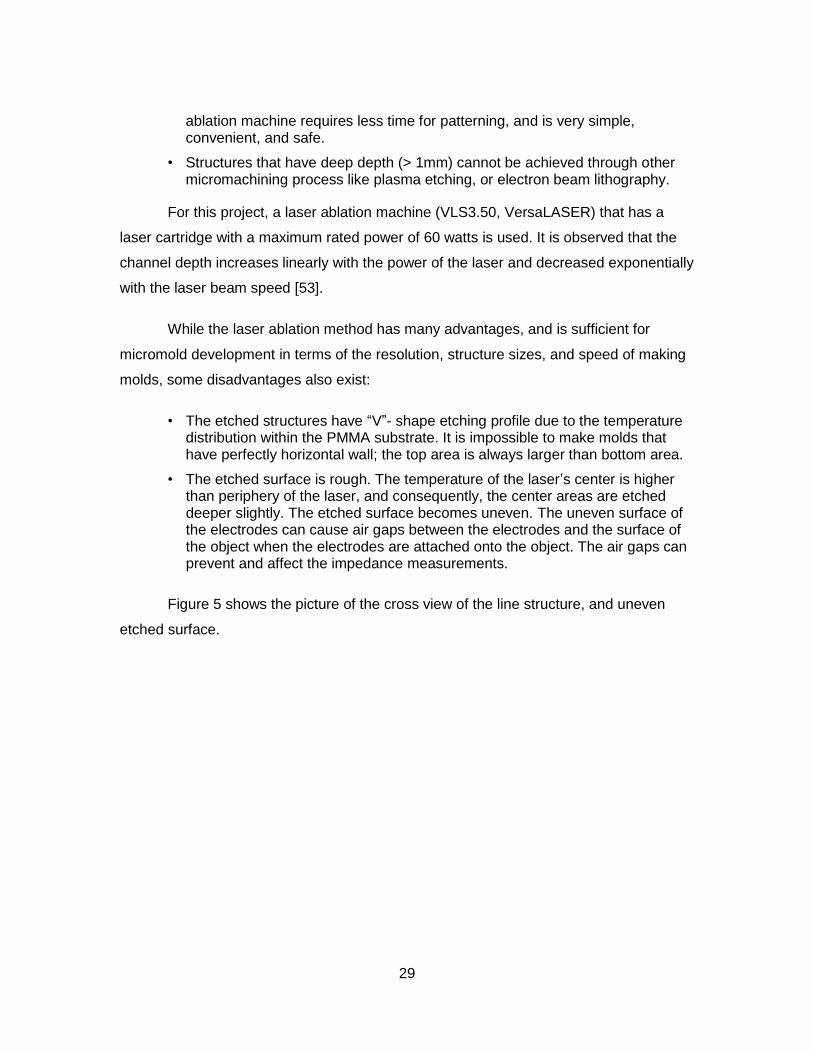
• The etched structures have “V”- shape etching profile due to the temperature distribution within the PMMA substrate. It is impossible to make molds that have perfectly horizontal wall; the top area is always larger than bottom area.
• The etched surface is rough. The temperature of the laser’s center is higher than periphery of the laser, and consequently, the center areas are etched deeper slightly. The etched surface becomes uneven. The uneven surface of the electrodes can cause air gaps between the electrodes and the surface of the object when the electrodes are attached onto the object. The air gaps can prevent and affect the impedance measurements.
Figure 5 shows the picture of the cross view of the line structure, and uneven
etched surface.
30
Figure 5. Pictures of PMMA Molds: a) V Shaped Cross-View; b) Uneven Surface after Laser Ablation
For development of the C-NCP electrode array, two PMMA molds were first
prepared: 1) a mold with a single layer of structures in it; 2) a mold with two layers of
structures in it. The single layer electrodes were designed as the first prototype
electrodes. To make a good contact with a subject, this prototype design has large
surface area, 2mm in diameter. Also, for convenience of making wire connections, the
single layer electrode is designed to have 2mm height. Connections to each electrode
were made using wires due to simplicity for prototyping. Wire connection was achieved
by sticking the wire into the electrode. Attaching the wire on the surface of the electrode
was impossible because a non-conductive PDMS layer covered the electrodes. When
the wire was stuck into the electrode, the connection between the wire and the electrode
was poor if the electrode had thin depth. To make a confirmed connection, a thicker
(2mm) depth was required. This 2mm height proves that structures with relatively tall
height and at least 1:1 aspect ratio can be fabricated using laser ablation and the
processes introduced in this thesis.
The electrodes that have two layer structures were developed to make the
electrode array more applicable for an actual medical application to EIS. The diameter of
the bottom area is reduced to 900m to show that features <1 mm can be fabricated
using the process, but the top area still has 2mm diameter for easy of manual wire
connection. Besides these reasons, the main reason of two-layer electrodes’
development is to prove that multi level structure with selective exposure is possible
31
using the new processes introduced in this thesis, as the bottom layer could also be
studied for electronic routing in future work.
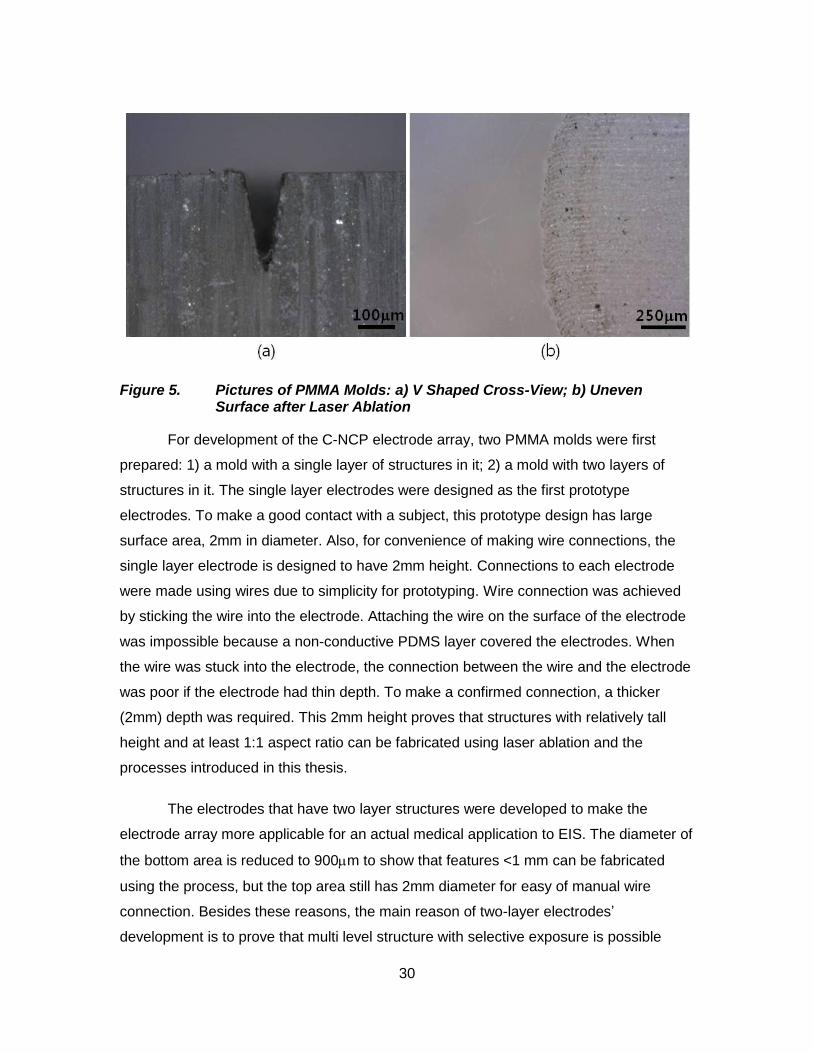
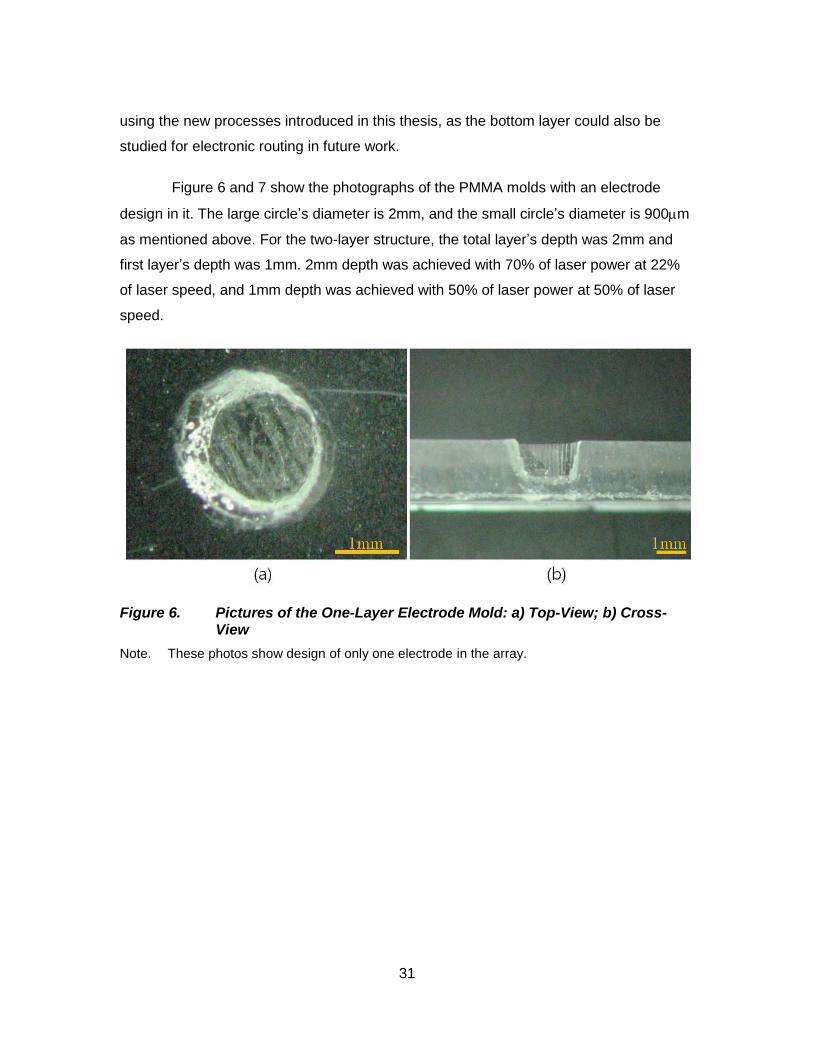
Figure 6 and 7 show the photographs of the PMMA molds with an electrode
design in it. The large circle’s diameter is 2mm, and the small circle’s diameter is 900m
as mentioned above. For the two-layer structure, the total layer’s depth was 2mm and
first layer’s depth was 1mm. 2mm depth was achieved with 70% of laser power at 22%
of laser speed, and 1mm depth was achieved with 50% of laser power at 50% of laser
speed.
Figure 6. Pictures of the One-Layer Electrode Mold: a) Top-View; b) Cross-View
Note. These photos show design of only one electrode in the array.
32
Figure 7. Pictures of the Two-Layer Electrode Mold: a) Top-View; b) Cross-View
Note. These photos show design of only one electrode in the array.
4.3.3.2. Fabrication Process and Development of Electrode Array
Figure 8 shows the fabrication process of the single-layer electrodes, and Figure
9 shows the fabrication process of the two-layer electrodes. Both processes are almost
same. First, after making a PMMA molding master using a laser ablation machine, the
mixture of nanoparticles and elastomer is poured onto the master. Then, the
unnecessary excess part of the mixture is scraped off from the mold leaving the mixture
only in the mold recesses, and the patterned mixture is cured at 70°C using a hot plate
for 3 hours. Once the mixture is cured, undoped PDMS is poured on the mold again and
cured to serve as a substrate. The assembly is then peeled off from the PMMA molding
master resulting in electrodes patterned on a base of non-conducting PDMS. Figure 10
(a) and Figure 11 (a) show photographs of a single Ag/AgCl electrode after the electrode
was patterned on the first PMDS level. Next, PMMA “pipes” were fit on the electrode
active areas to prevent them from being covered by PDMS, and PDMS was poured on
the electrode array again so that only the top part of the electrodes can be exposed as
the second level of PDMS self-levels around the “pipes”. Figure 10 (b) and Figure 11 (b)
shows photographs of the electrode after the second level of PDMS was poured. The
picture shows that only the top of the electrode is exposed. In the case of the two layer
electrode, only the first layer is covered by PDMS.
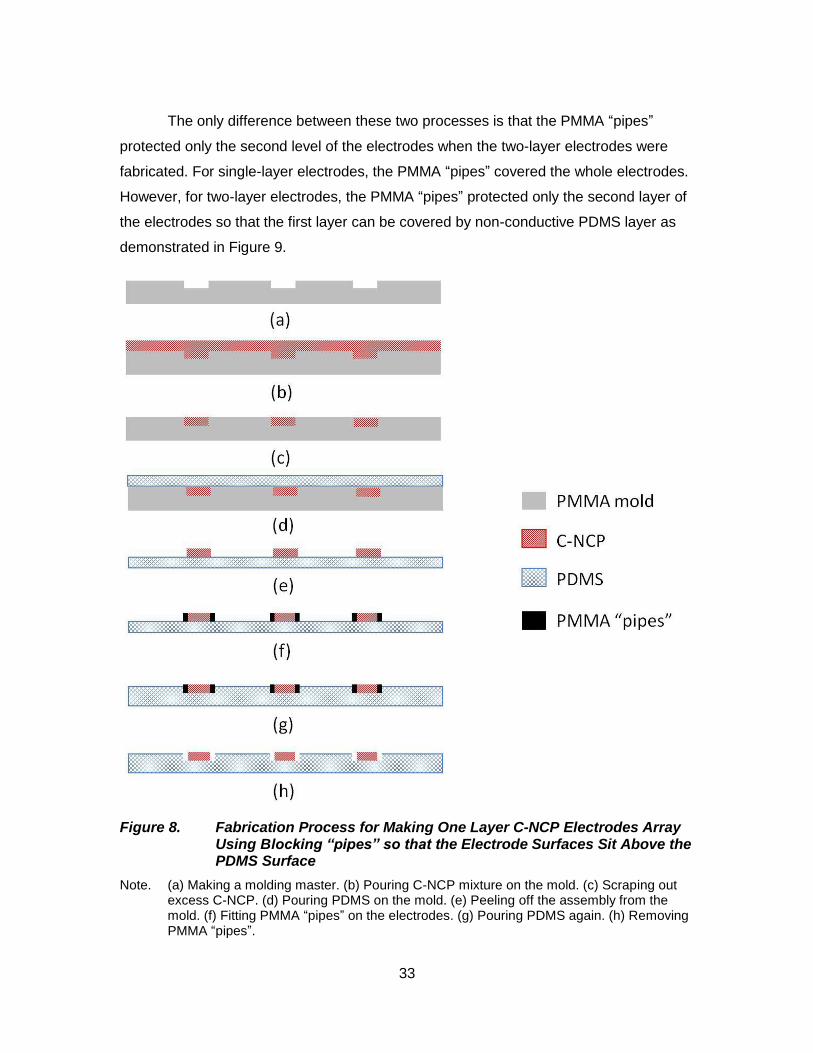
33
The only difference between these two processes is that the PMMA “pipes”
protected only the second level of the electrodes when the two-layer electrodes were
fabricated. For single-layer electrodes, the PMMA “pipes” covered the whole electrodes.
However, for two-layer electrodes, the PMMA “pipes” protected only the second layer of
the electrodes so that the first layer can be covered by non-conductive PDMS layer as
demonstrated in Figure 9.
Figure 8. Fabrication Process for Making One Layer C-NCP Electrodes Array Using Blocking “pipes” so that the Electrode Surfaces Sit Above the PDMS Surface
Note. (a) Making a molding master. (b) Pouring C-NCP mixture on the mold. (c) Scraping out excess C-NCP. (d) Pouring PDMS on the mold. (e) Peeling off the assembly from the mold. (f) Fitting PMMA “pipes” on the electrodes. (g) Pouring PDMS again. (h) Removing PMMA “pipes”.
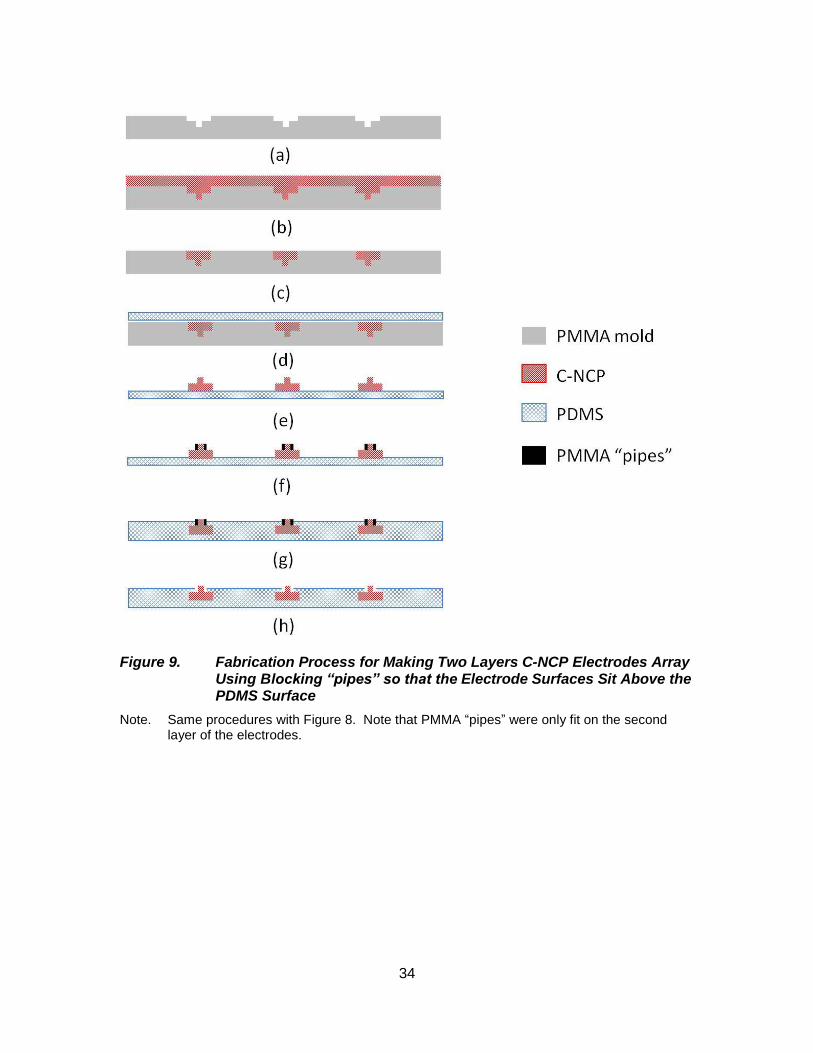
34
Figure 9. Fabrication Process for Making Two Layers C-NCP Electrodes Array Using Blocking “pipes” so that the Electrode Surfaces Sit Above the PDMS Surface
Note. Same procedures with Figure 8. Note that PMMA “pipes” were only fit on the second layer of the electrodes.
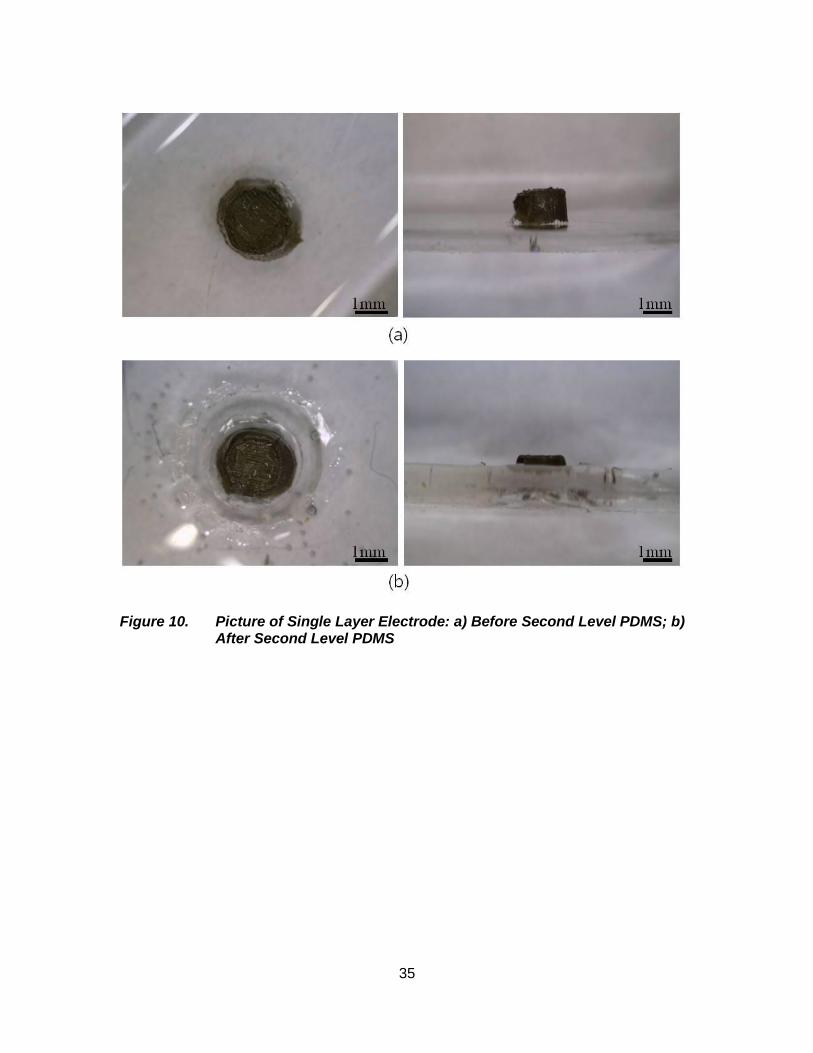
35
Figure 10. Picture of Single Layer Electrode: a) Before Second Level PDMS; b) After Second Level PDMS
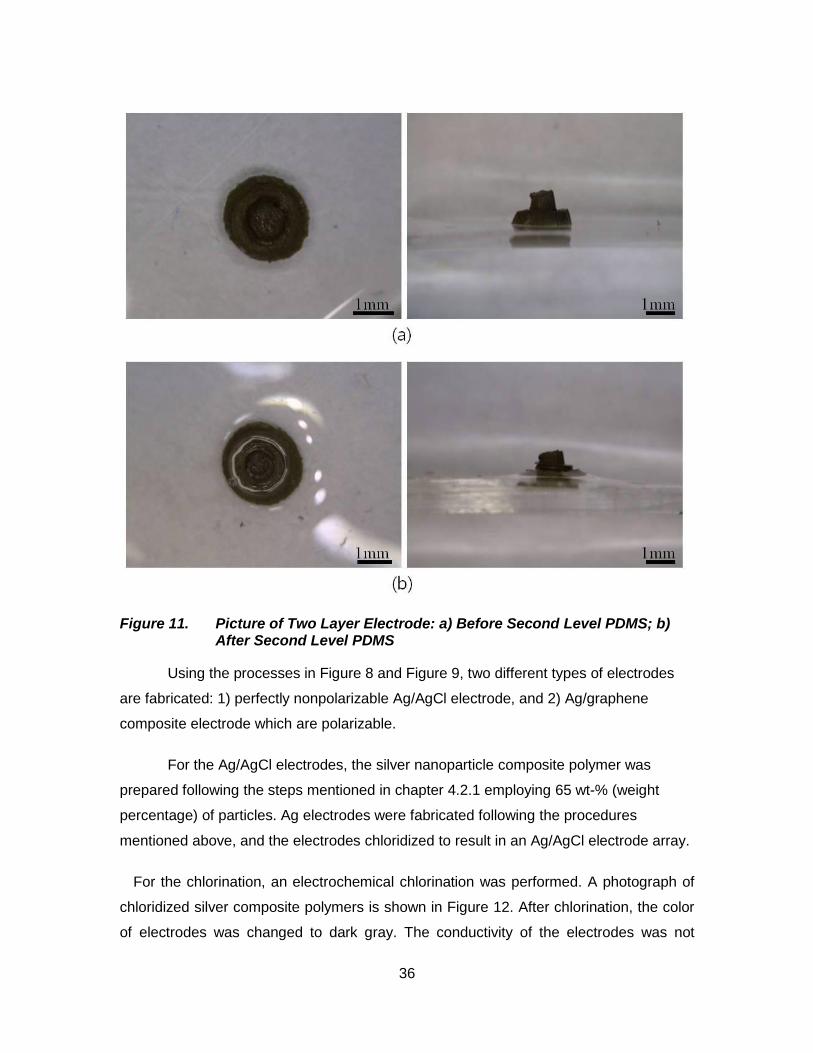
36
Figure 11. Picture of Two Layer Electrode: a) Before Second Level PDMS; b) After Second Level PDMS
Using the processes in Figure 8 and Figure 9, two different types of electrodes
are fabricated: 1) perfectly nonpolarizable Ag/AgCl electrode, and 2) Ag/graphene
composite electrode which are polarizable.
For the Ag/AgCl electrodes, the silver nanoparticle composite polymer was
prepared following the steps mentioned in chapter 4.2.1 employing 65 wt-% (weight
percentage) of particles. Ag electrodes were fabricated following the procedures
mentioned above, and the electrodes chloridized to result in an Ag/AgCl electrode array.
For the chlorination, an electrochemical chlorination was performed. A photograph of
chloridized silver composite polymers is shown in Figure 12. After chlorination, the color
of electrodes was changed to dark gray. The conductivity of the electrodes was not
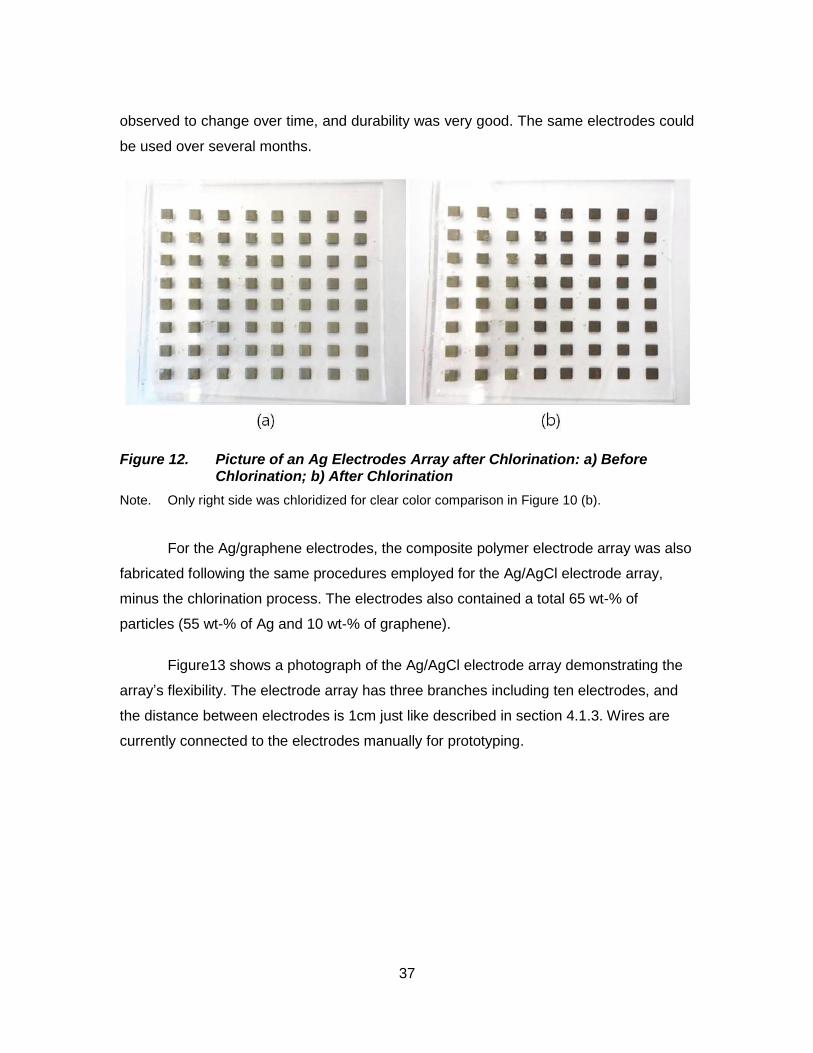
37
observed to change over time, and durability was very good. The same electrodes could
be used over several months.
Figure 12. Picture of an Ag Electrodes Array after Chlorination: a) Before Chlorination; b) After Chlorination
Note. Only right side was chloridized for clear color comparison in Figure 10 (b).
For the Ag/graphene electrodes, the composite polymer electrode array was also
fabricated following the same procedures employed for the Ag/AgCl electrode array,
minus the chlorination process. The electrodes also contained a total 65 wt-% of
particles (55 wt-% of Ag and 10 wt-% of graphene).
Figure13 shows a photograph of the Ag/AgCl electrode array demonstrating the
array’s flexibility. The electrode array has three branches including ten electrodes, and
the distance between electrodes is 1cm just like described in section 4.1.3. Wires are
currently connected to the electrodes manually for prototyping.
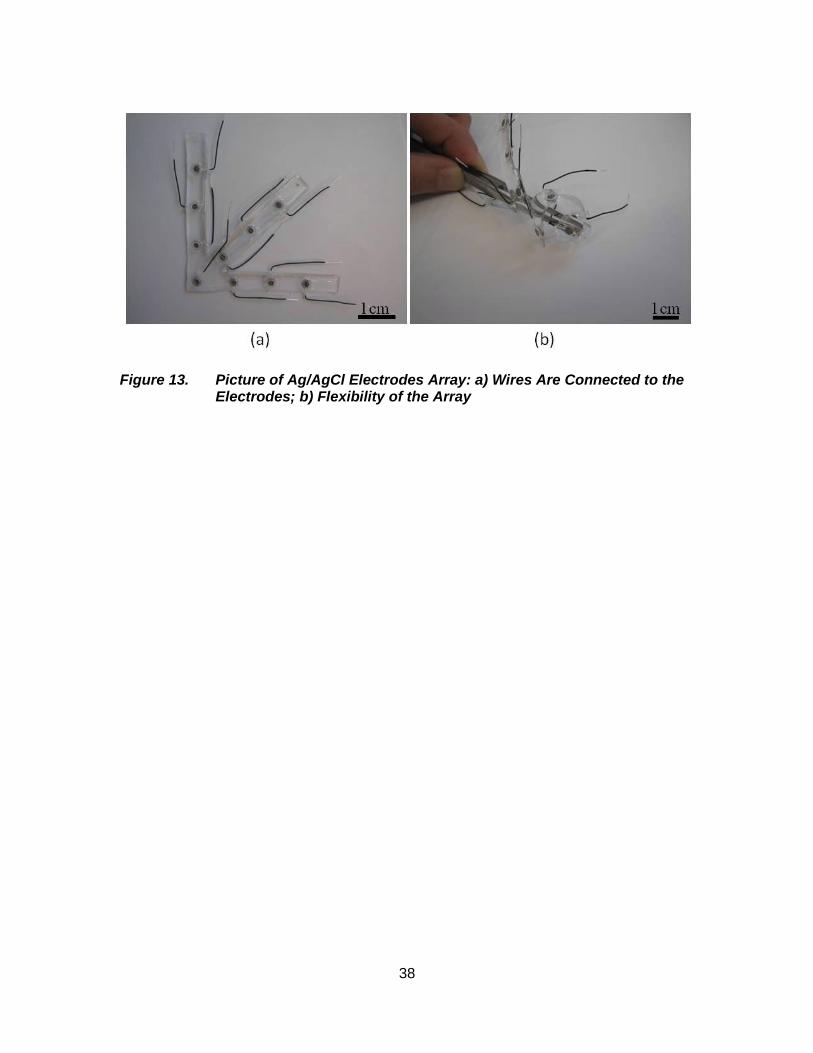
38
Figure 13. Picture of Ag/AgCl Electrodes Array: a) Wires Are Connected to the Electrodes; b) Flexibility of the Array
39
5. Experimentation
To evaluate the electrodes’ electrical characteristics and uniformity, the
electrodes’ resistance characteristics were evaluated first independently of EIS related
measurements. After sufficient uniformity was obtained, the electrodes were tested using
an impedance analyzer on both tissue phantoms and chicken thigh tissue, in order to
evaluate the C-NCP electrodes for employment in EIS systems. Two different types of
tissue phantoms were developed and tested, and differences between Ag/AgCl
electrodes and Ag/graphene electrodes were also compared on the gelatin phantom.
Finally, the impedance of real chicken tissues was measured to show that the electrode
array works on actual flesh, and not just on tissue phantoms. Finally, the impedance of
real chicken tissues was measured to show that the electrode can obtain measurements
from actual flesh.
5.1. Preparation
5.1.1. Conductive nanoparticle composite polymer (C-NCP) electrodes
As mentioned in section 4.2.3.2, the Ag/AgCl electrodes and the Ag/graphene
electrodes were fabricated. For Ag/AgCl electrodes, 65 wt-% of silver particles were
mixed with silicone base elastomer and chloridized. The resistance of Ag/AgCl electrode
sample (5mm x 5mm x 0.5mm in size) was 5.964 Ω, and calculated resistivity was 1.75 x
10-3 +/- 14.3% Ω⋅m. Ag/graphene electrodes consisted of 55 wt-% of silver particles and
10 wt-% of graphene plates. The resistance of Ag/graphene electrode sample (5mm x
5mm x 0.5mm in size) was 0.647 Ω, and calculated resistivity was 4.45 x 10⁻⁴ +/- 18.7%
Ω⋅m.
Figure 14 shows the V-I (voltage vs. current) characteristics of each electrode.
Both electrode samples were attached with wires, and each electrode’s V-I
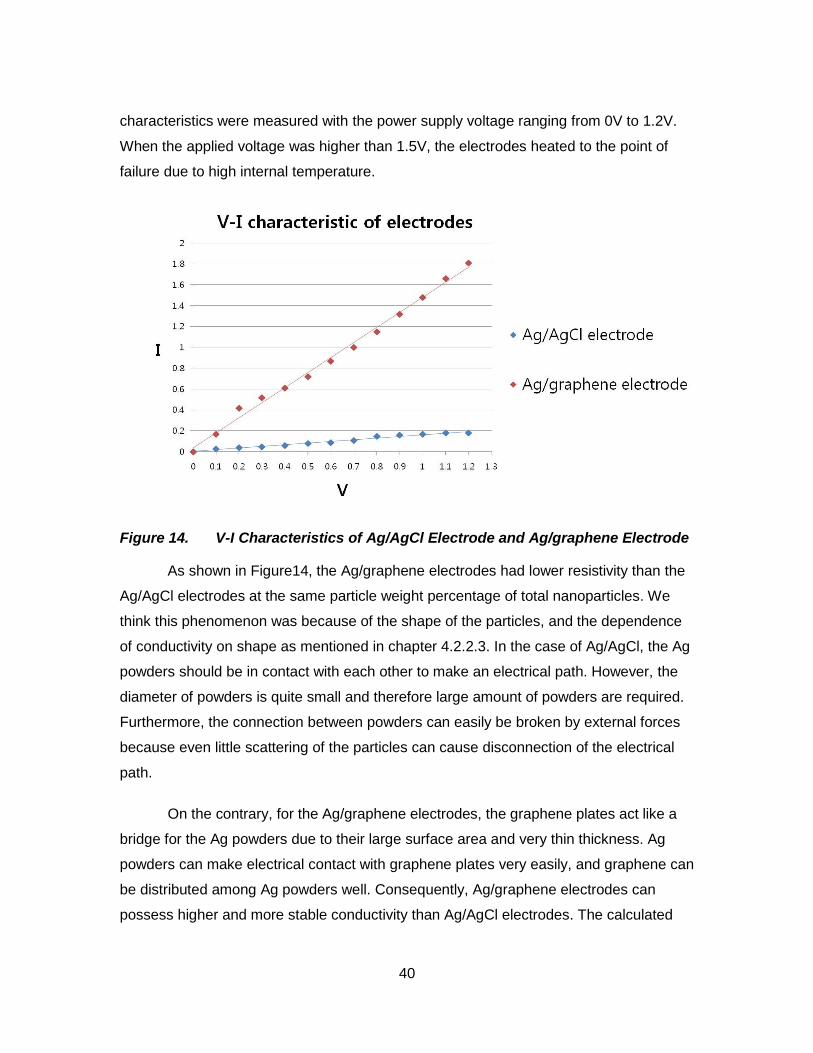
40
characteristics were measured with the power supply voltage ranging from 0V to 1.2V.
When the applied voltage was higher than 1.5V, the electrodes heated to the point of
failure due to high internal temperature.
Figure 14. V-I Characteristics of Ag/AgCl Electrode and Ag/graphene Electrode
As shown in Figure14, the Ag/graphene electrodes had lower resistivity than the
Ag/AgCl electrodes at the same particle weight percentage of total nanoparticles. We
think this phenomenon was because of the shape of the particles, and the dependence
of conductivity on shape as mentioned in chapter 4.2.2.3. In the case of Ag/AgCl, the Ag
powders should be in contact with each other to make an electrical path. However, the
diameter of powders is quite small and therefore large amount of powders are required.
Furthermore, the connection between powders can easily be broken by external forces
because even little scattering of the particles can cause disconnection of the electrical
path.
On the contrary, for the Ag/graphene electrodes, the graphene plates act like a
bridge for the Ag powders due to their large surface area and very thin thickness. Ag
powders can make electrical contact with graphene plates very easily, and graphene can
be distributed among Ag powders well. Consequently, Ag/graphene electrodes can
possess higher and more stable conductivity than Ag/AgCl electrodes. The calculated
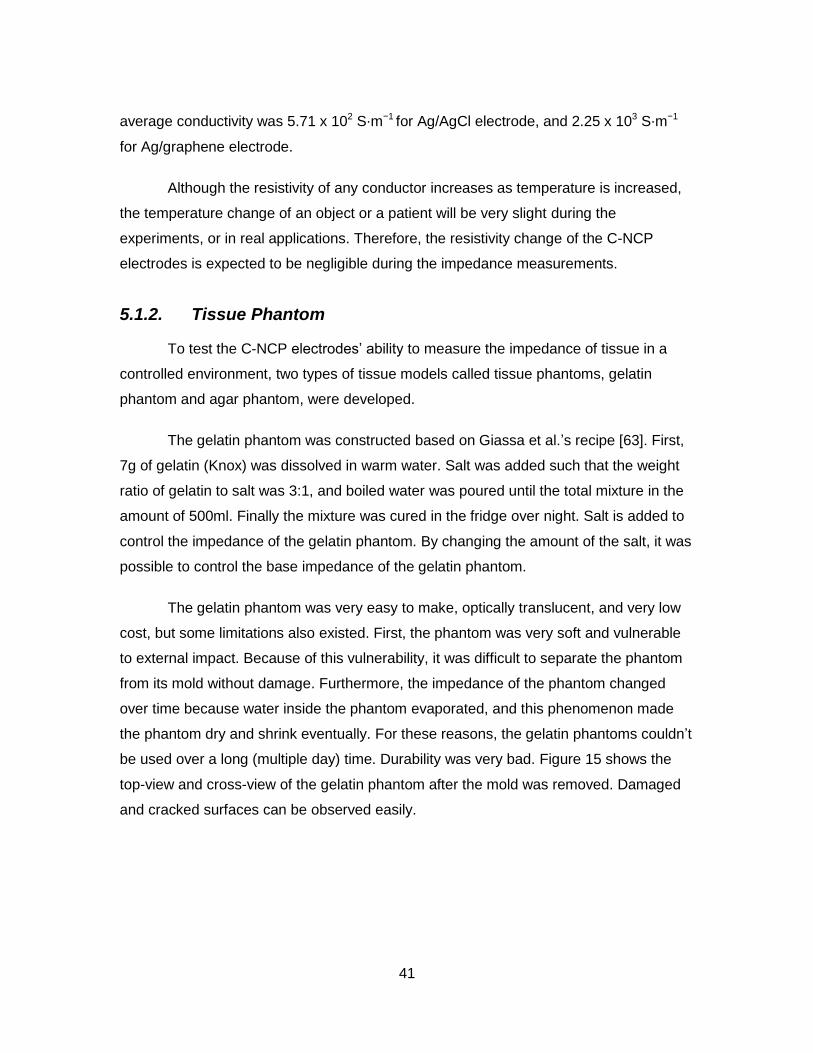
41
average conductivity was 5.71 x 10² S⋅m−1 for Ag/AgCl electrode, and 2.25 x 10³ S⋅m−1
for Ag/graphene electrode.
Although the resistivity of any conductor increases as temperature is increased,
the temperature change of an object or a patient will be very slight during the
experiments, or in real applications. Therefore, the resistivity change of the C-NCP
electrodes is expected to be negligible during the impedance measurements.
5.1.2. Tissue Phantom
To test the C-NCP electrodes’ ability to measure the impedance of tissue in a
controlled environment, two types of tissue models called tissue phantoms, gelatin
phantom and agar phantom, were developed.
The gelatin phantom was constructed based on Giassa et al.’s recipe [63]. First,
7g of gelatin (Knox) was dissolved in warm water. Salt was added such that the weight
ratio of gelatin to salt was 3:1, and boiled water was poured until the total mixture in the
amount of 500ml. Finally the mixture was cured in the fridge over night. Salt is added to
control the impedance of the gelatin phantom. By changing the amount of the salt, it was
possible to control the base impedance of the gelatin phantom.
The gelatin phantom was very easy to make, optically translucent, and very low
cost, but some limitations also existed. First, the phantom was very soft and vulnerable
to external impact. Because of this vulnerability, it was difficult to separate the phantom
from its mold without damage. Furthermore, the impedance of the phantom changed
over time because water inside the phantom evaporated, and this phenomenon made
the phantom dry and shrink eventually. For these reasons, the gelatin phantoms couldn’t
be used over a long (multiple day) time. Durability was very bad. Figure 15 shows the
top-view and cross-view of the gelatin phantom after the mold was removed. Damaged
and cracked surfaces can be observed easily.
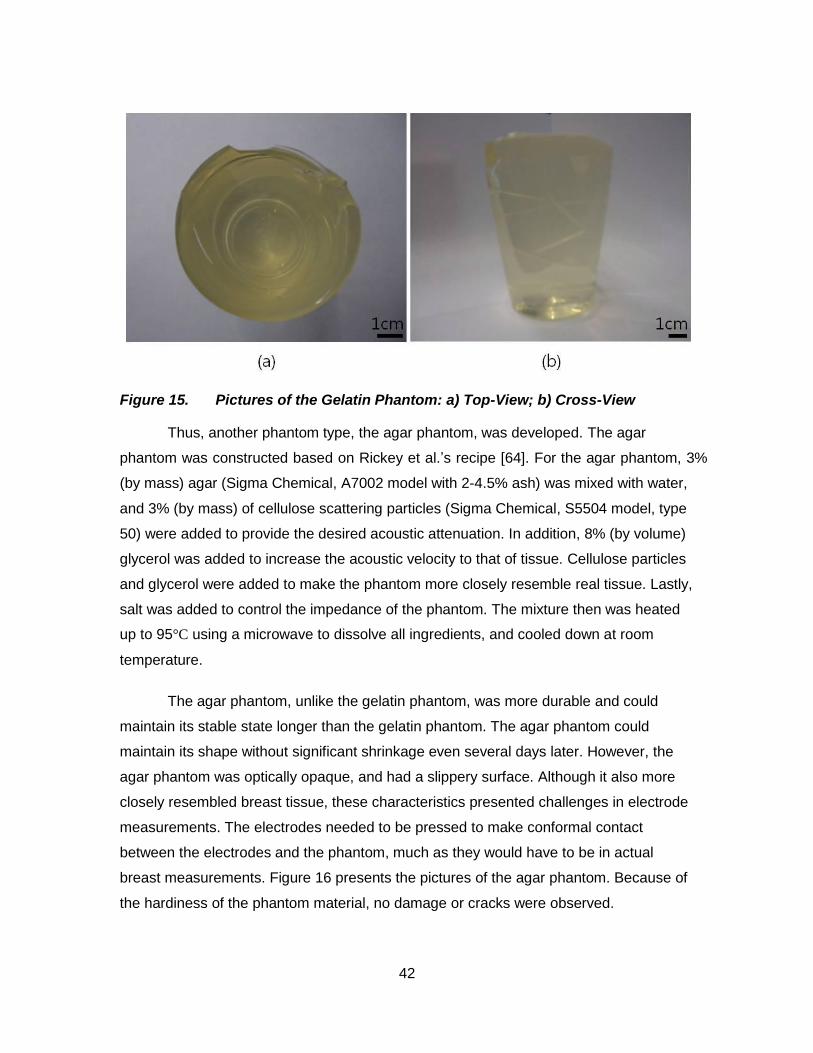
42
Figure 15. Pictures of the Gelatin Phantom: a) Top-View; b) Cross-View
Thus, another phantom type, the agar phantom, was developed. The agar
phantom was constructed based on Rickey et al.’s recipe [64]. For the agar phantom, 3%
(by mass) agar (Sigma Chemical, A7002 model with 2-4.5% ash) was mixed with water,
and 3% (by mass) of cellulose scattering particles (Sigma Chemical, S5504 model, type
50) were added to provide the desired acoustic attenuation. In addition, 8% (by volume)
glycerol was added to increase the acoustic velocity to that of tissue. Cellulose particles
and glycerol were added to make the phantom more closely resemble real tissue. Lastly,
salt was added to control the impedance of the phantom. The mixture then was heated
up to 95°C using a microwave to dissolve all ingredients, and cooled down at room
temperature.
The agar phantom, unlike the gelatin phantom, was more durable and could
maintain its stable state longer than the gelatin phantom. The agar phantom could
maintain its shape without significant shrinkage even several days later. However, the
agar phantom was optically opaque, and had a slippery surface. Although it also more
closely resembled breast tissue, these characteristics presented challenges in electrode
measurements. The electrodes needed to be pressed to make conformal contact
between the electrodes and the phantom, much as they would have to be in actual
breast measurements. Figure 16 presents the pictures of the agar phantom. Because of
the hardiness of the phantom material, no damage or cracks were observed.
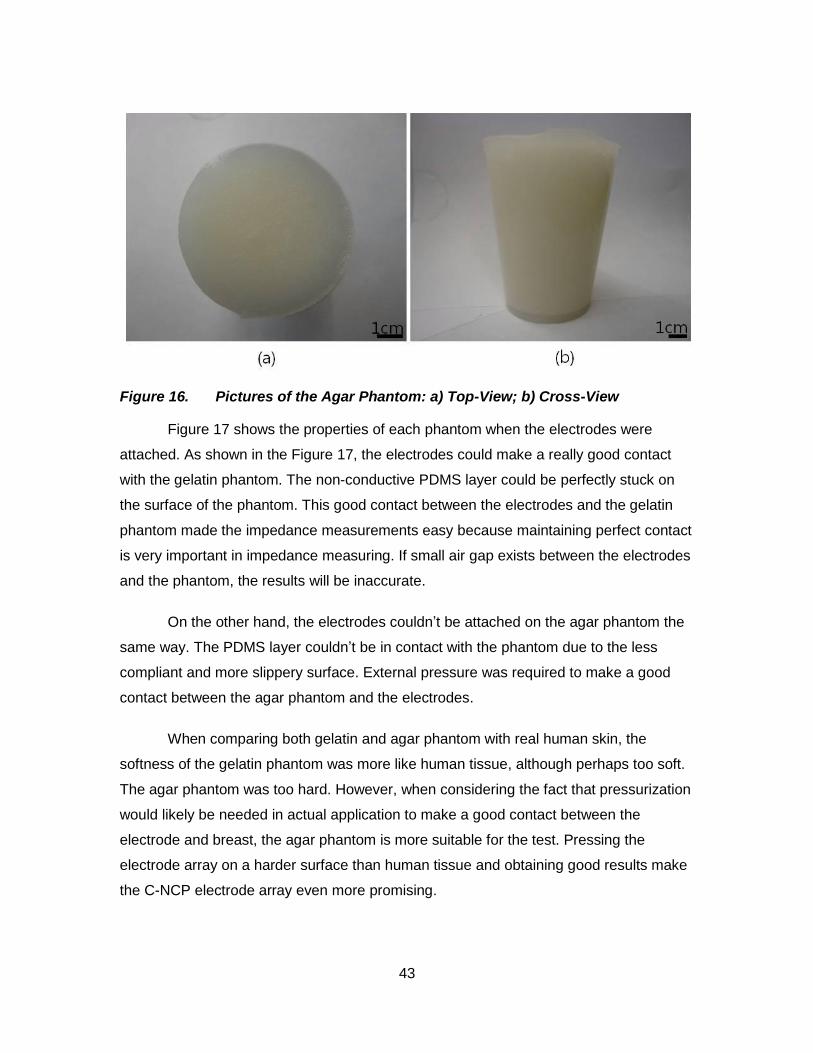
43
Figure 16. Pictures of the Agar Phantom: a) Top-View; b) Cross-View
Figure 17 shows the properties of each phantom when the electrodes were
attached. As shown in the Figure 17, the electrodes could make a really good contact
with the gelatin phantom. The non-conductive PDMS layer could be perfectly stuck on
the surface of the phantom. This good contact between the electrodes and the gelatin
phantom made the impedance measurements easy because maintaining perfect contact
is very important in impedance measuring. If small air gap exists between the electrodes
and the phantom, the results will be inaccurate.
On the other hand, the electrodes couldn’t be attached on the agar phantom the
same way. The PDMS layer couldn’t be in contact with the phantom due to the less
compliant and more slippery surface. External pressure was required to make a good
contact between the agar phantom and the electrodes.
When comparing both gelatin and agar phantom with real human skin, the
softness of the gelatin phantom was more like human tissue, although perhaps too soft.
The agar phantom was too hard. However, when considering the fact that pressurization
would likely be needed in actual application to make a good contact between the
electrode and breast, the agar phantom is more suitable for the test. Pressing the
electrode array on a harder surface than human tissue and obtaining good results make
the C-NCP electrode array even more promising.
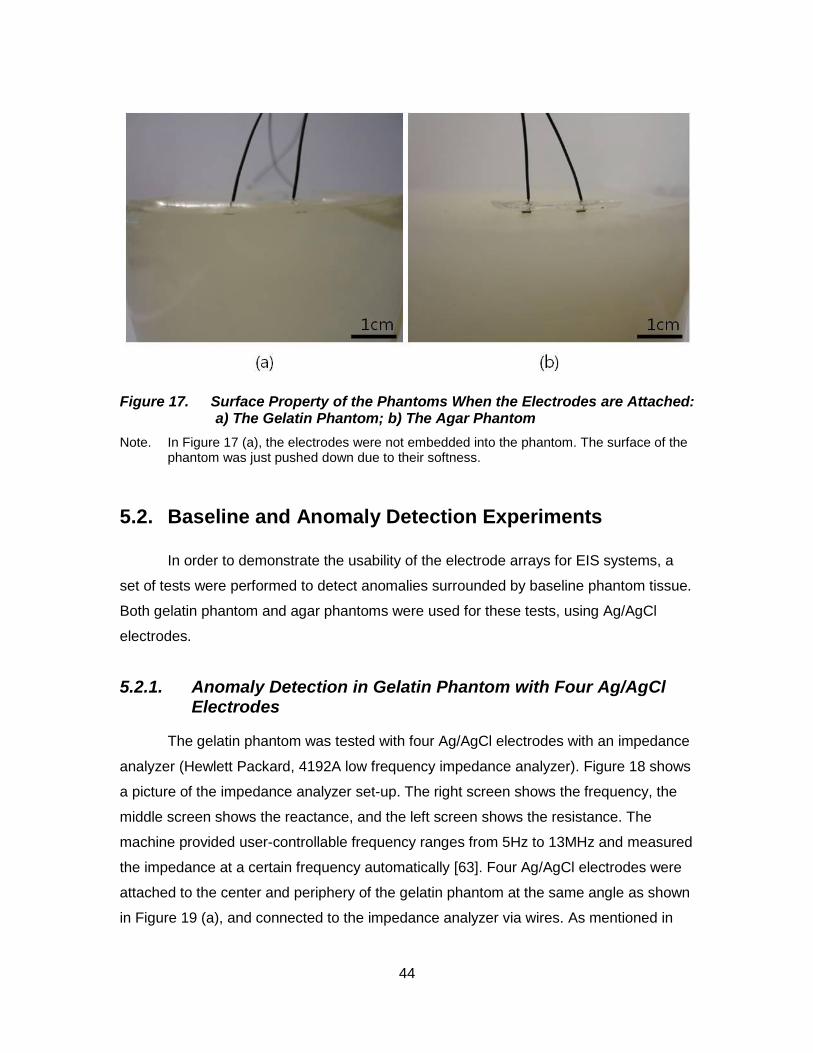
44
Figure 17. Surface Property of the Phantoms When the Electrodes are Attached: a) The Gelatin Phantom; b) The Agar Phantom
Note. In Figure 17 (a), the electrodes were not embedded into the phantom. The surface of the phantom was just pushed down due to their softness.
5.2. Baseline and Anomaly Detection Experiments
In order to demonstrate the usability of the electrode arrays for EIS systems, a
set of tests were performed to detect anomalies surrounded by baseline phantom tissue.
Both gelatin phantom and agar phantoms were used for these tests, using Ag/AgCl
electrodes.
5.2.1. Anomaly Detection in Gelatin Phantom with Four Ag/AgCl Electrodes
The gelatin phantom was tested with four Ag/AgCl electrodes with an impedance
analyzer (Hewlett Packard, 4192A low frequency impedance analyzer). Figure 18 shows
a picture of the impedance analyzer set-up. The right screen shows the frequency, the
middle screen shows the reactance, and the left screen shows the resistance. The
machine provided user-controllable frequency ranges from 5Hz to 13MHz and measured
the impedance at a certain frequency automatically [63]. Four Ag/AgCl electrodes were
attached to the center and periphery of the gelatin phantom at the same angle as shown
in Figure 19 (a), and connected to the impedance analyzer via wires. As mentioned in
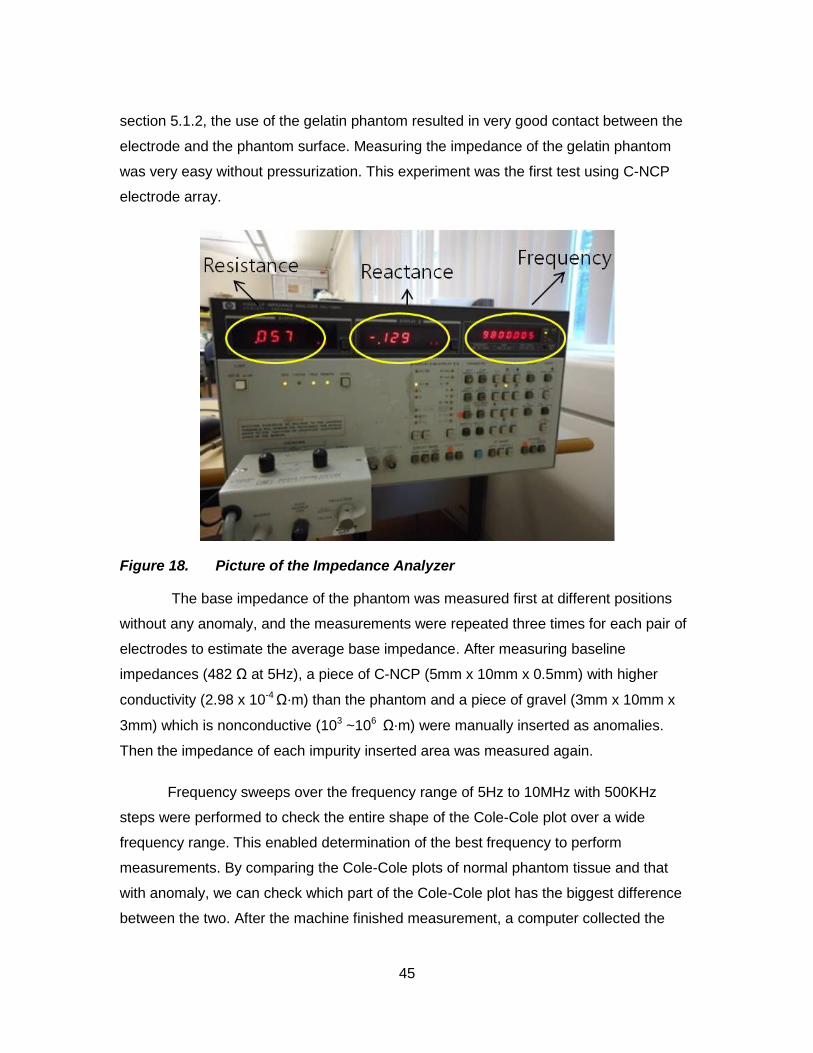
45
section 5.1.2, the use of the gelatin phantom resulted in very good contact between the
electrode and the phantom surface. Measuring the impedance of the gelatin phantom
was very easy without pressurization. This experiment was the first test using C-NCP
electrode array.
Figure 18. Picture of the Impedance Analyzer
The base impedance of the phantom was measured first at different positions
without any anomaly, and the measurements were repeated three times for each pair of
electrodes to estimate the average base impedance. After measuring baseline
impedances (482 Ω at 5Hz), a piece of C-NCP (5mm x 10mm x 0.5mm) with higher
conductivity (2.98 x 10⁻⁴ Ω⋅m) than the phantom and a piece of gravel (3mm x 10mm x
3mm) which is nonconductive (103 ~106 Ω⋅m) were manually inserted as anomalies.
Then the impedance of each impurity inserted area was measured again.
Frequency sweeps over the frequency range of 5Hz to 10MHz with 500KHz
steps were performed to check the entire shape of the Cole-Cole plot over a wide
frequency range. This enabled determination of the best frequency to perform
measurements. By comparing the Cole-Cole plots of normal phantom tissue and that
with anomaly, we can check which part of the Cole-Cole plot has the biggest difference
between the two. After the machine finished measurement, a computer collected the
46
data, divided the impedance into reactance and resistance, and converted it into Cole-
Cole plots.
Figure 19 presents an illustration of the anomaly detection tests and the results.
For the baseline impedance, an average impedance of measurements labelled 1, 2, and
3 in the figure were calculated with deviation bars. Although measurement 1, 2, and 3
didn’t overlap exactly, the deviation was quite small (maximum 3.6% for resistance, 5.4%
for reactance). Deviations likely resulted from differences in the electrode conductivity,
and noise in the impedance measurement equipment. After insertion of the anomalies, a
clear impedance differences between the baseline impedance and that with the
anomalies occurred as expected. The region with gravel showed much higher
impedance, and the C-NCP inserted region showed lower impedance than the baseline
impedance.
The difference between the gravel and baseline was a maximum of 26.7% for
resistance and 42% for reactance, and the difference between the C-NCP and baseline
was a maximum 12.7% for resistance, and 19.4% for reactance.
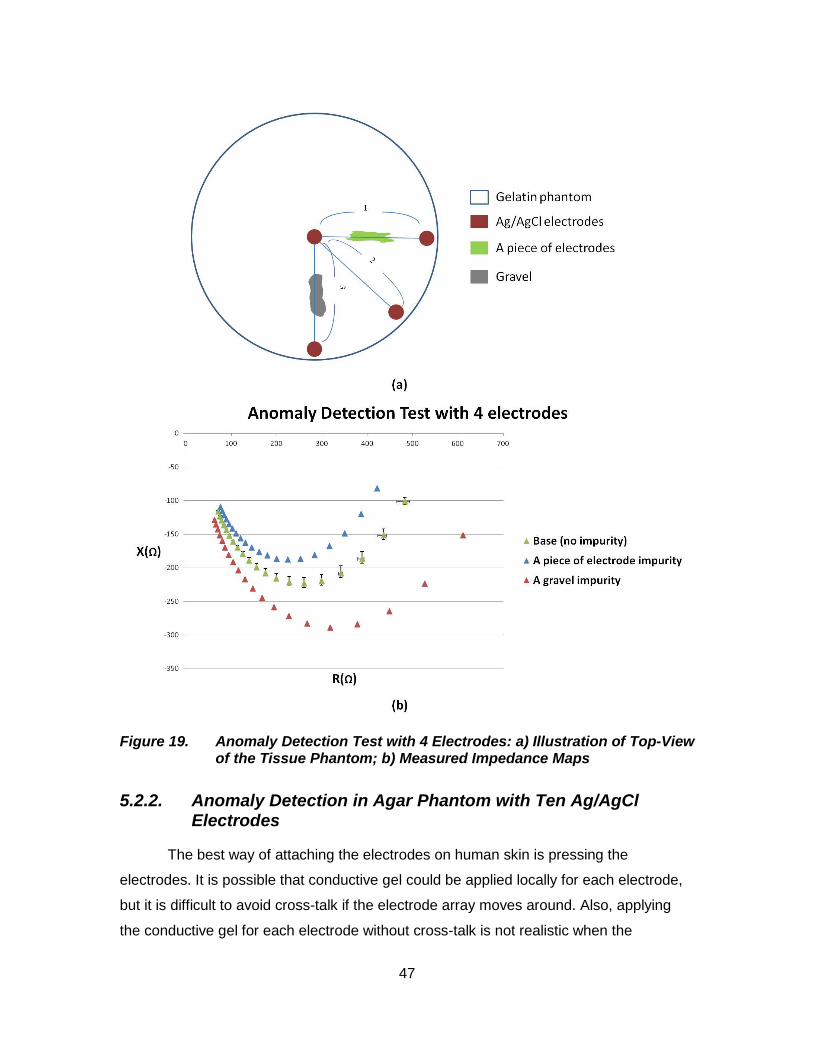
47
Figure 19. Anomaly Detection Test with 4 Electrodes: a) Illustration of Top-View of the Tissue Phantom; b) Measured Impedance Maps
5.2.2. Anomaly Detection in Agar Phantom with Ten Ag/AgCl Electrodes
The best way of attaching the electrodes on human skin is pressing the
electrodes. It is possible that conductive gel could be applied locally for each electrode,
but it is difficult to avoid cross-talk if the electrode array moves around. Also, applying
the conductive gel for each electrode without cross-talk is not realistic when the
48
electrode array has a large number of small electrodes. In section 5.2.1, the gelatin
phantom was used to demonstrate the usability of the electrode array, but only four
electrodes were used and pressurization wasn’t performed. In this section, similar
experiments to those presented in section 5.2.1 were performed, but the number of
electrodes was increased and the agar phantom was used to perform pressurization to
make the test as realistic as possible.
The agar phantom was used for this test because the agar phantom was more
stable and even harder than real tissue as mentioned in section 5.1.2., and ten Ag/AgCl
electrodes were used. The electrodes were attached on the agar phantom in a similar
way to the gelatin phantom’s test. However, as noted earlier, the electrodes had to be
pressurized to the phantom for good contact. For pressurization of the electrodes, a
PMMA substrate (6cm x 7.5cm x 5mm) with ten holes (1mm in diameter) on it was
prepared. Then the PDMS layer of the electrode array was attached to the PMMA
substrate so that only the wires would come out of the through holes on the PMMA
substrate. Finally, the electrode array attached on the PMMA substrate was placed on
the phantom, and four weights (total 500g) were placed on the each corner of the PMMA
substrate so that the weights could press the electrodes. Figure 20 shows the pictures of
the electrode array after attachment to the PMMA substrate for pressurization. While in
actual practice is has been suggested that air pressurization such as in a blood pressure
cuff could be used, the PMMA plate method is a simple testing mechanism for
pressurizing the electrodes against tissue.
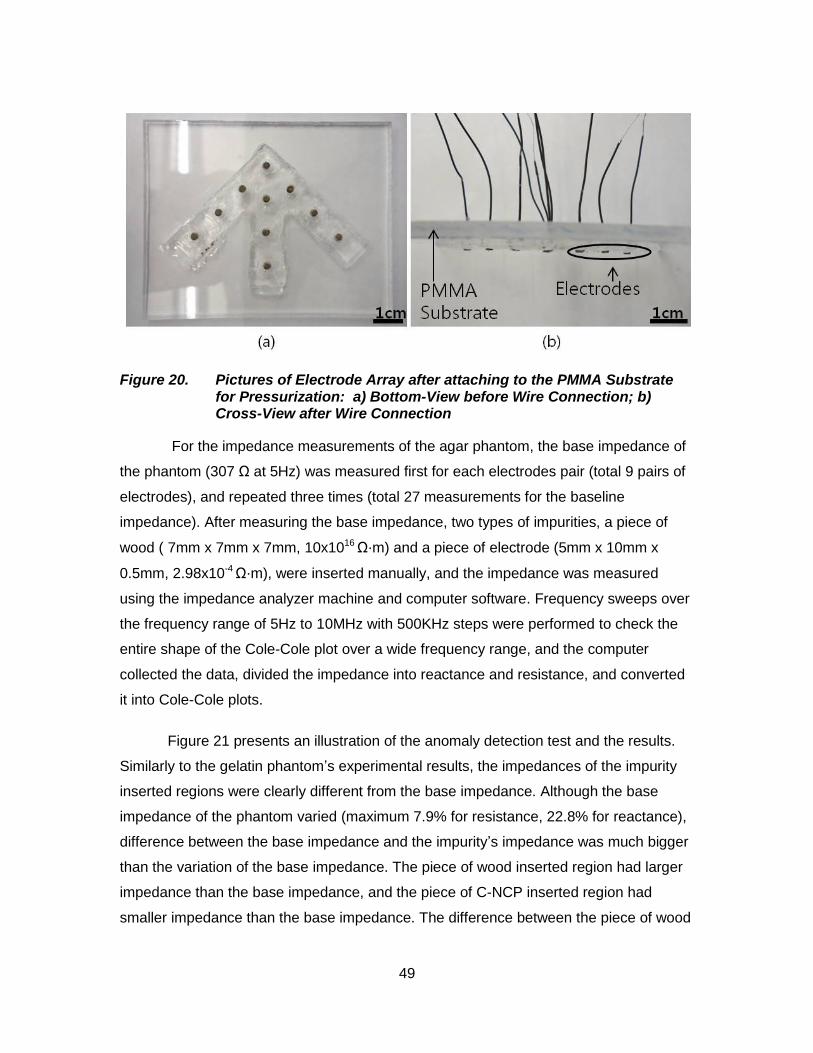
49
Figure 20. Pictures of Electrode Array after attaching to the PMMA Substrate for Pressurization: a) Bottom-View before Wire Connection; b) Cross-View after Wire Connection
For the impedance measurements of the agar phantom, the base impedance of
the phantom (307 Ω at 5Hz) was measured first for each electrodes pair (total 9 pairs of
electrodes), and repeated three times (total 27 measurements for the baseline
impedance). After measuring the base impedance, two types of impurities, a piece of
wood ( 7mm x 7mm x 7mm, 10x1016 Ω⋅m) and a piece of electrode (5mm x 10mm x
0.5mm, 2.98x10⁻⁴ Ω⋅m), were inserted manually, and the impedance was measured
using the impedance analyzer machine and computer software. Frequency sweeps over
the frequency range of 5Hz to 10MHz with 500KHz steps were performed to check the
entire shape of the Cole-Cole plot over a wide frequency range, and the computer
collected the data, divided the impedance into reactance and resistance, and converted
it into Cole-Cole plots.
Figure 21 presents an illustration of the anomaly detection test and the results.
Similarly to the gelatin phantom’s experimental results, the impedances of the impurity
inserted regions were clearly different from the base impedance. Although the base
impedance of the phantom varied (maximum 7.9% for resistance, 22.8% for reactance),
difference between the base impedance and the impurity’s impedance was much bigger
than the variation of the base impedance. The piece of wood inserted region had larger
impedance than the base impedance, and the piece of C-NCP inserted region had
smaller impedance than the base impedance. The difference between the piece of wood
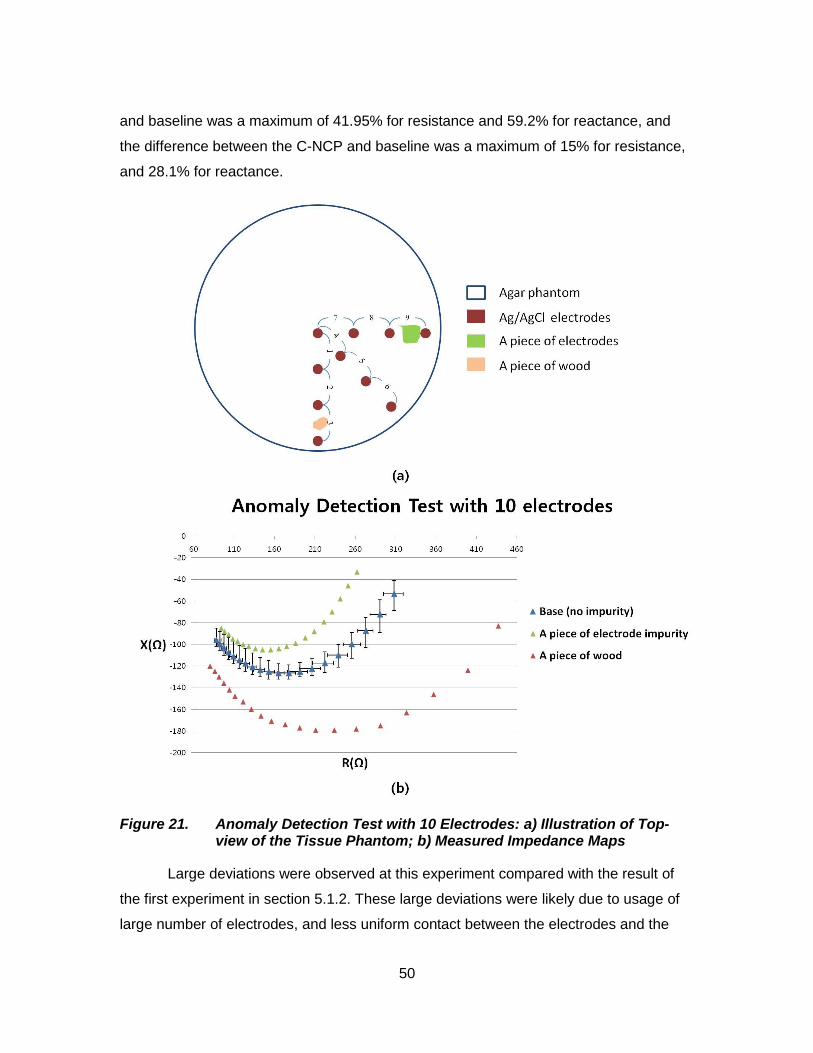
50
and baseline was a maximum of 41.95% for resistance and 59.2% for reactance, and
the difference between the C-NCP and baseline was a maximum of 15% for resistance,
and 28.1% for reactance.
Figure 21. Anomaly Detection Test with 10 Electrodes: a) Illustration of Top-view of the Tissue Phantom; b) Measured Impedance Maps
Large deviations were observed at this experiment compared with the result of
the first experiment in section 5.1.2. These large deviations were likely due to usage of
large number of electrodes, and less uniform contact between the electrodes and the
51
phantom since the pressurization method was quite crude. Although pressure was
applied through the PMMA substrate, the center area was pressed more weakly than
edge area because the weights couldn’t be placed on the center area. As shown in
Figure 20, the density of the electrodes was higher at the center area. There wasn’t
enough space for weights due to the wires. As a result, maintaining the pressure
uniformly for all the electrodes to make a good contact was very difficult. Furthermore, in
the gelatin phantom test, the center electrode was used for all measurements as a
common electrode when only four electrodes were used in the case of the gelatin
phantom. This common electrode minimized the deviations. However, when ten
electrodes were used for the impedance measurements for the agar phantom, a
common electrode did not exist. Little conductivity differences between electrodes
caused the deviation. Also, the surface of the electrodes surface was slightly uneven as
described in chapter 4.2.2.2. This uneven surface of the electrode caused poor contact
as well. Still, the results clearly show detection of anomalies in the phantom.
5.2.3. Common Results
In both experiments, the impedance difference was very clear. When a certain
impurity had lower impedance than the base impedance, the impedance of the impurity
inserted region decreased. Similarly, when the impurity had higher impedance than the
base impedance, the impurity inserted region’s impedance increased. While these
differences may be higher than that to be expected between cancerous and
noncancerous tissue, it demonstrates for the first time the use of C-NCP highly flexible
electrode arrays for impedance maps on tissue-like objects. However, as pressure
needed to be applied to make good contact to the agar phantom, that test is perhaps
even closer to actual EIS system measurements.
The biggest impedance difference between the anomaly region and the base
region took place at relatively low frequency region (upper-right region). This indicates
that for an actual EIS system employing the electrodes, such a large range (up to
10MHz) of frequency sweep is not required. Only three to five measurements from the
lowest frequency for each electrode pair should be enough for detection, and this
narrower frequency range will greatly reduce data acquisition times down to 3~5
seconds for one pair of electrode because it took 1 second for measuring the impedance
52
at a certain frequency. A narrow frequency sweep will also have less effect on human
tissue than a large frequency sweep, as well. These advantages make an EIS system
with the flexible C-NCP electrodes even more attractive as a possibility.
5.3. Comparison of Ag/AgCl Electrodes with Ag/graphene Electrodes
Use of perfectly nonpolarizable electrodes is critical for measuring exact tissue
impedance as mentioned in chapter 4.2.2. If the electrodes are polarizable, potential
difference occur on the surface of skin during the impedance measurements. However,
this project’s goal is not measuring the exact tissue impedance. The goal is measuring
the impedance difference between normal tissue and cancerous tissue. Even if potential
difference exists on the skin surface, the impedance difference between normal tissue
and cancerous tissue will not change as long as the potential difference is same for all
skin area. Thus, it is expected that polarizable electrodes could also provide a usable
impedance map if detecting anomalies (e.g., cancer) is the goal.
To support this proposition, polarizable Ag/graphene electrodes were developed
and tested. One pair of Ag/AgCl electrodes and one pair of Ag/graphene electrodes
were fabricated with the same total particle weight percentage (total 65 wt-%). A gelatin
phantom that contained a piece of copper (5mm x 5mm x 3mm, 16.78x10⁻⁹ Ω⋅m ) and a
piece of Ag/graphene electrode (5mm x 10mm x 0.5mm, 4.45x10⁻⁴ Ω⋅m) as impurities
were also prepared. Both impurities possessed higher conductivity than the phantom,
but each impurity’s conductivity was different. Every experimental condition was exactly
the same except for the type (and conductivity) of the electrodes. Figure 22 presents the
concept of this experiment.
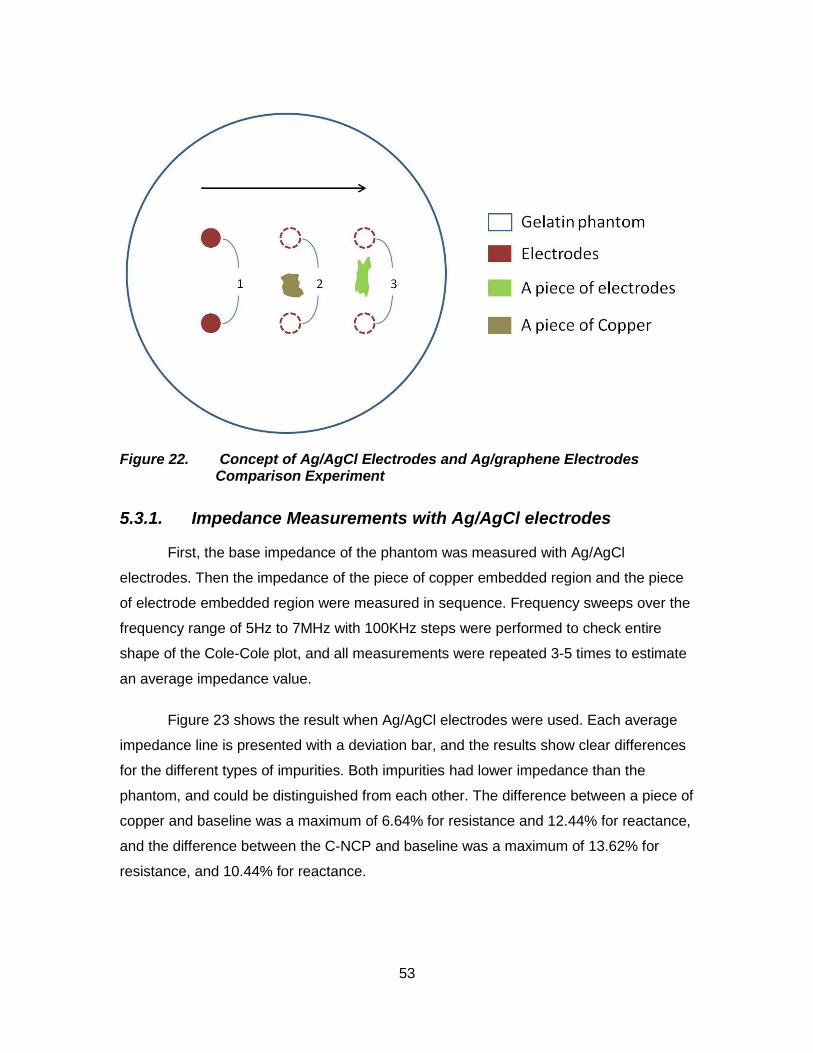
53
Figure 22. Concept of Ag/AgCl Electrodes and Ag/graphene Electrodes Comparison Experiment
5.3.1. Impedance Measurements with Ag/AgCl electrodes
First, the base impedance of the phantom was measured with Ag/AgCl
electrodes. Then the impedance of the piece of copper embedded region and the piece
of electrode embedded region were measured in sequence. Frequency sweeps over the
frequency range of 5Hz to 7MHz with 100KHz steps were performed to check entire
shape of the Cole-Cole plot, and all measurements were repeated 3-5 times to estimate
an average impedance value.
Figure 23 shows the result when Ag/AgCl electrodes were used. Each average
impedance line is presented with a deviation bar, and the results show clear differences
for the different types of impurities. Both impurities had lower impedance than the
phantom, and could be distinguished from each other. The difference between a piece of
copper and baseline was a maximum of 6.64% for resistance and 12.44% for reactance,
and the difference between the C-NCP and baseline was a maximum of 13.62% for
resistance, and 10.44% for reactance.
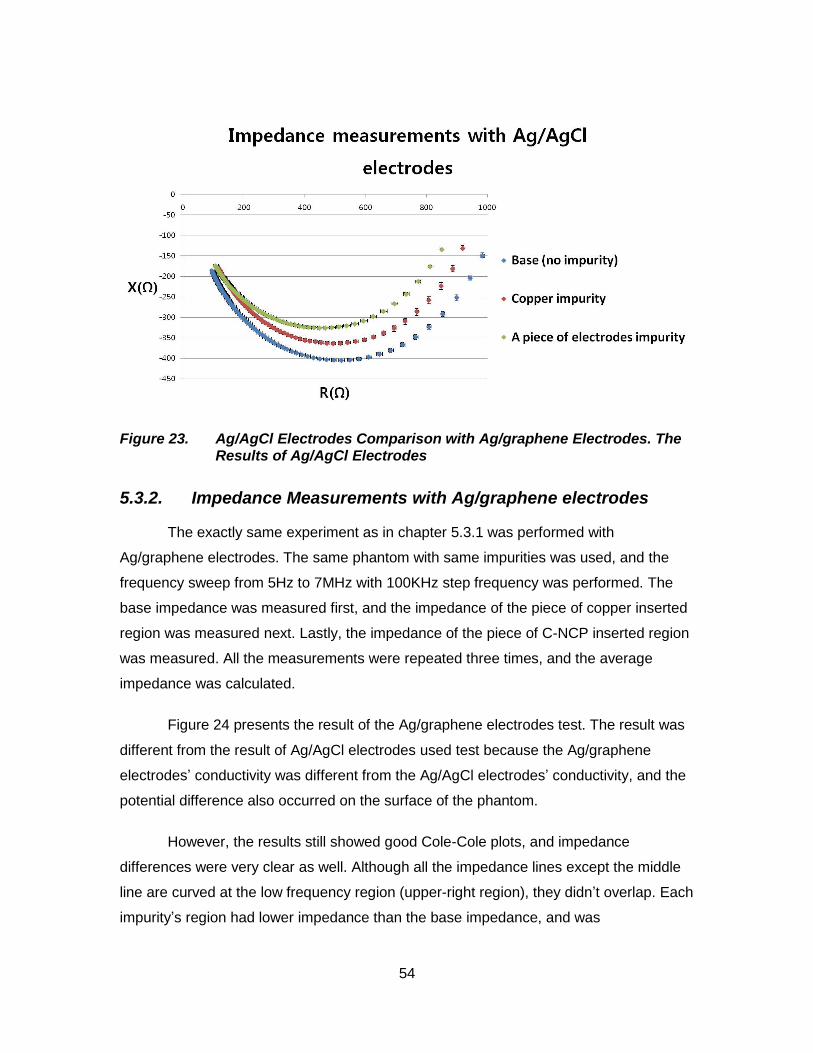
54
Figure 23. Ag/AgCl Electrodes Comparison with Ag/graphene Electrodes. The Results of Ag/AgCl Electrodes
5.3.2. Impedance Measurements with Ag/graphene electrodes
The exactly same experiment as in chapter 5.3.1 was performed with
Ag/graphene electrodes. The same phantom with same impurities was used, and the
frequency sweep from 5Hz to 7MHz with 100KHz step frequency was performed. The
base impedance was measured first, and the impedance of the piece of copper inserted
region was measured next. Lastly, the impedance of the piece of C-NCP inserted region
was measured. All the measurements were repeated three times, and the average
impedance was calculated.
Figure 24 presents the result of the Ag/graphene electrodes test. The result was
different from the result of Ag/AgCl electrodes used test because the Ag/graphene
electrodes’ conductivity was different from the Ag/AgCl electrodes’ conductivity, and the
potential difference also occurred on the surface of the phantom.
However, the results still showed good Cole-Cole plots, and impedance
differences were very clear as well. Although all the impedance lines except the middle
line are curved at the low frequency region (upper-right region), they didn’t overlap. Each
impurity’s region had lower impedance than the base impedance, and was
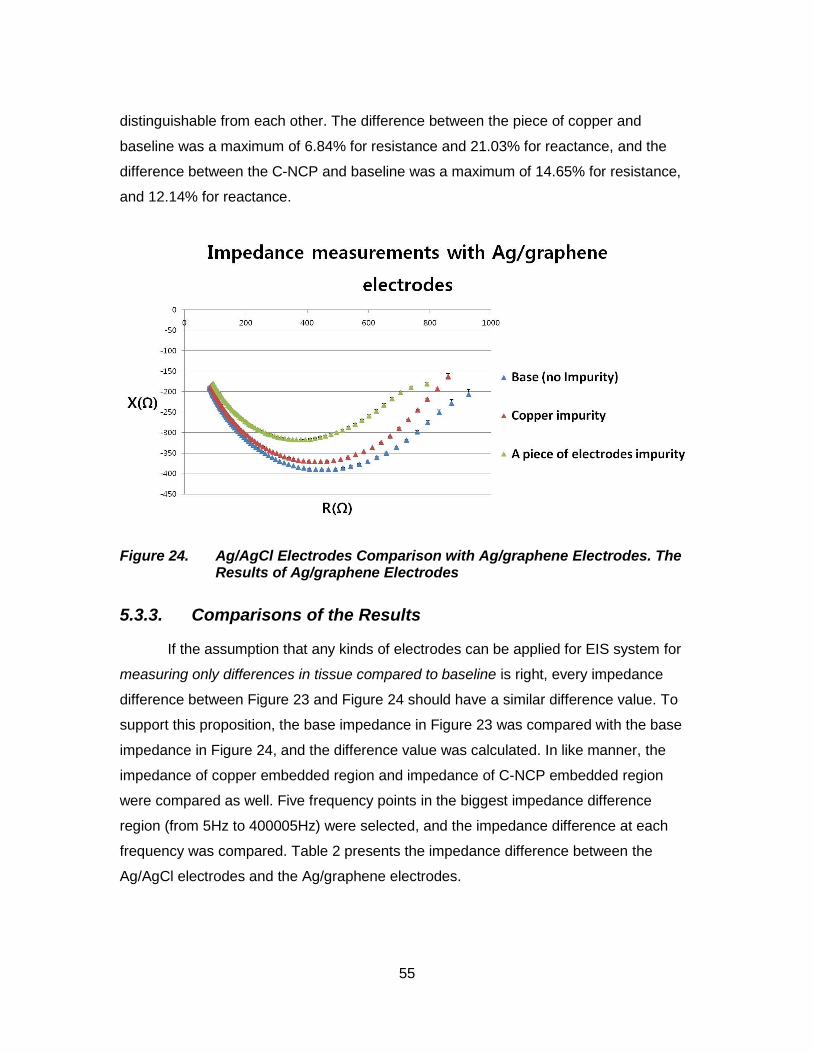
55
distinguishable from each other. The difference between the piece of copper and
baseline was a maximum of 6.84% for resistance and 21.03% for reactance, and the
difference between the C-NCP and baseline was a maximum of 14.65% for resistance,
and 12.14% for reactance.
Figure 24. Ag/AgCl Electrodes Comparison with Ag/graphene Electrodes. The Results of Ag/graphene Electrodes
5.3.3. Comparisons of the Results
If the assumption that any kinds of electrodes can be applied for EIS system for
measuring only differences in tissue compared to baseline is right, every impedance
difference between Figure 23 and Figure 24 should have a similar difference value. To
support this proposition, the base impedance in Figure 23 was compared with the base
impedance in Figure 24, and the difference value was calculated. In like manner, the
impedance of copper embedded region and impedance of C-NCP embedded region
were compared as well. Five frequency points in the biggest impedance difference
region (from 5Hz to 400005Hz) were selected, and the impedance difference at each
frequency was compared. Table 2 presents the impedance difference between the
Ag/AgCl electrodes and the Ag/graphene electrodes.
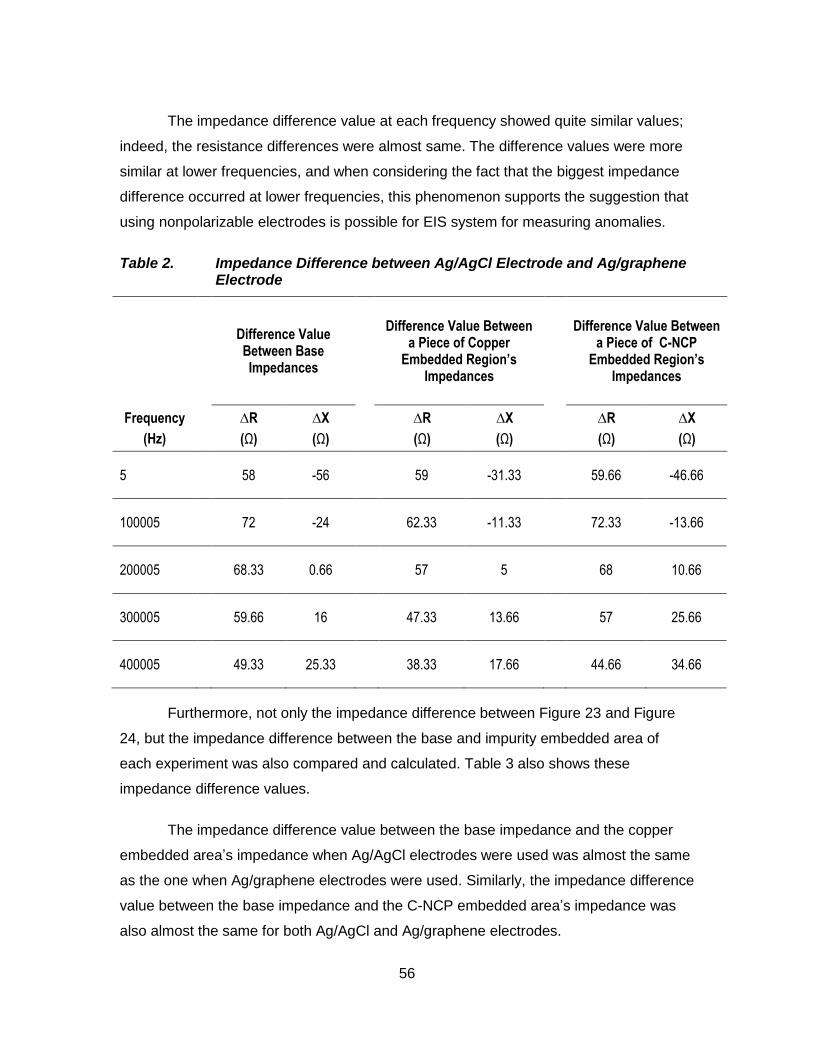
56
The impedance difference value at each frequency showed quite similar values;
indeed, the resistance differences were almost same. The difference values were more
similar at lower frequencies, and when considering the fact that the biggest impedance
difference occurred at lower frequencies, this phenomenon supports the suggestion that
using nonpolarizable electrodes is possible for EIS system for measuring anomalies.
Table 2. Impedance Difference between Ag/AgCl Electrode and Ag/graphene Electrode
Difference Value Between Base Impedances
Difference Value Between a Piece of Copper
Embedded Region’s Impedances
Difference Value Between a Piece of C-NCP
Embedded Region’s Impedances
Frequency
(Hz)
∆R
(Ω)
∆X
(Ω)
∆R
(Ω)
∆X
(Ω)
∆R
(Ω)
∆X
(Ω)
5 58 -56 59 -31.33 59.66 -46.66
100005 72 -24 62.33 -11.33 72.33 -13.66
200005 68.33 0.66 57 5 68 10.66
300005 59.66 16 47.33 13.66 57 25.66
400005 49.33 25.33 38.33 17.66 44.66 34.66
Furthermore, not only the impedance difference between Figure 23 and Figure
24, but the impedance difference between the base and impurity embedded area of
each experiment was also compared and calculated. Table 3 also shows these
impedance difference values.
The impedance difference value between the base impedance and the copper
embedded area’s impedance when Ag/AgCl electrodes were used was almost the same
as the one when Ag/graphene electrodes were used. Similarly, the impedance difference
value between the base impedance and the C-NCP embedded area’s impedance was
also almost the same for both Ag/AgCl and Ag/graphene electrodes.
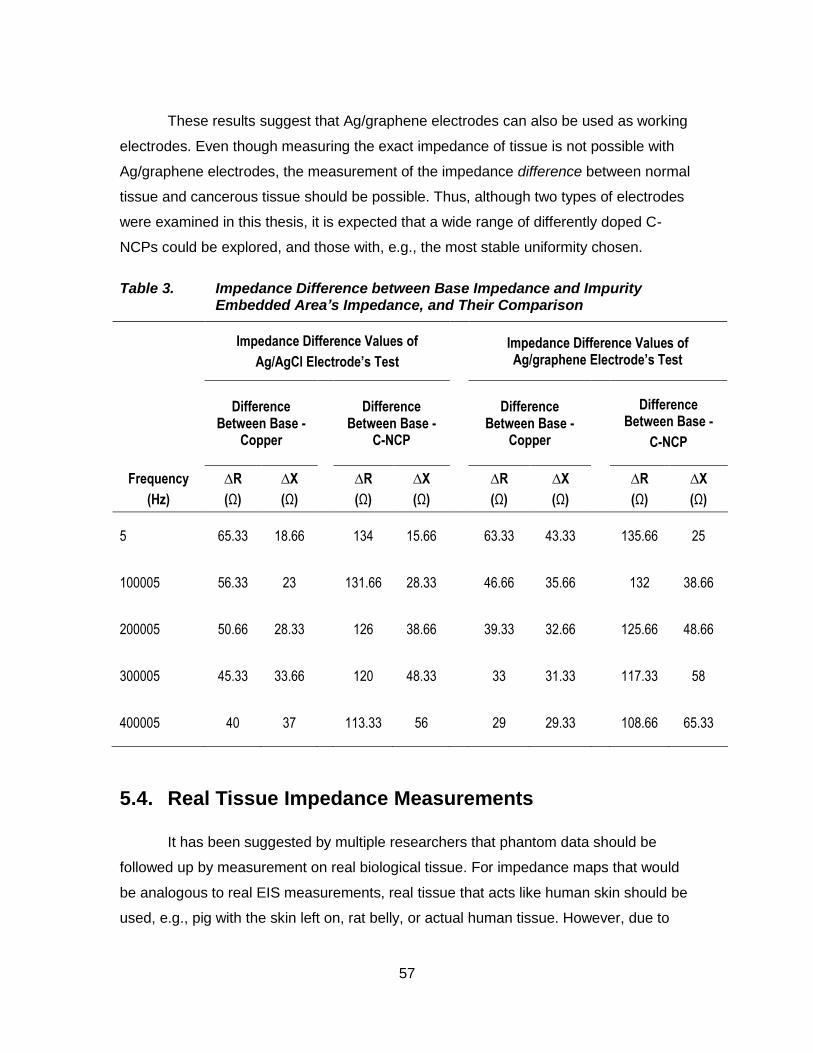
57
These results suggest that Ag/graphene electrodes can also be used as working
electrodes. Even though measuring the exact impedance of tissue is not possible with
Ag/graphene electrodes, the measurement of the impedance difference between normal
tissue and cancerous tissue should be possible. Thus, although two types of electrodes
were examined in this thesis, it is expected that a wide range of differently doped C-
NCPs could be explored, and those with, e.g., the most stable uniformity chosen.
Table 3. Impedance Difference between Base Impedance and Impurity Embedded Area’s Impedance, and Their Comparison
Impedance Difference Values of
Ag/AgCl Electrode’s Test
Impedance Difference Values of Ag/graphene Electrode’s Test
Difference
Between Base - Copper
Difference
Between Base - C-NCP
Difference
Between Base - Copper
Difference Between Base -
C-NCP
Frequency
(Hz)
∆R
(Ω)
∆X
(Ω)
∆R
(Ω)
∆X
(Ω)
∆R
(Ω)
∆X
(Ω)
∆R
(Ω)
∆X
(Ω)
5 65.33 18.66 134 15.66 63.33 43.33 135.66 25
100005 56.33 23 131.66 28.33 46.66 35.66 132 38.66
200005 50.66 28.33 126 38.66 39.33 32.66 125.66 48.66
300005 45.33 33.66 120 48.33 33 31.33 117.33 58
400005 40 37 113.33 56 29 29.33 108.66 65.33
5.4. Real Tissue Impedance Measurements
It has been suggested by multiple researchers that phantom data should be
followed up by measurement on real biological tissue. For impedance maps that would
be analogous to real EIS measurements, real tissue that acts like human skin should be
used, e.g., pig with the skin left on, rat belly, or actual human tissue. However, due to
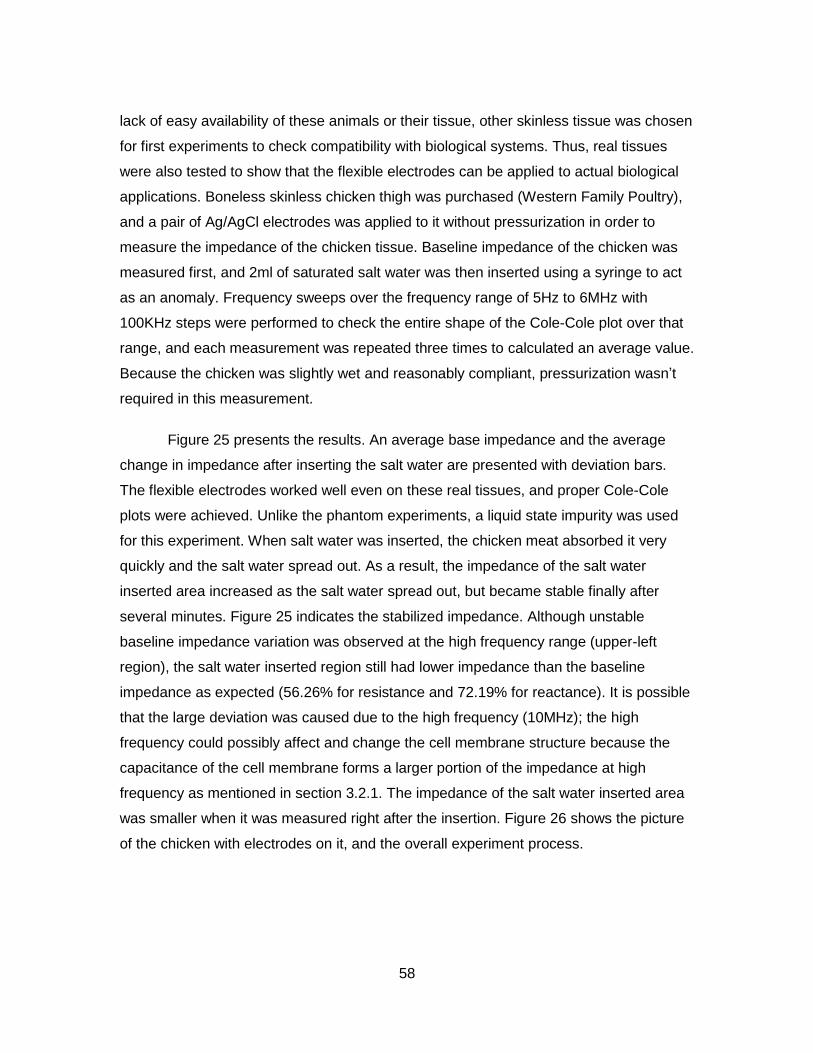
58
lack of easy availability of these animals or their tissue, other skinless tissue was chosen
for first experiments to check compatibility with biological systems. Thus, real tissues
were also tested to show that the flexible electrodes can be applied to actual biological
applications. Boneless skinless chicken thigh was purchased (Western Family Poultry),
and a pair of Ag/AgCl electrodes was applied to it without pressurization in order to
measure the impedance of the chicken tissue. Baseline impedance of the chicken was
measured first, and 2ml of saturated salt water was then inserted using a syringe to act
as an anomaly. Frequency sweeps over the frequency range of 5Hz to 6MHz with
100KHz steps were performed to check the entire shape of the Cole-Cole plot over that
range, and each measurement was repeated three times to calculated an average value.
Because the chicken was slightly wet and reasonably compliant, pressurization wasn’t
required in this measurement.
Figure 25 presents the results. An average base impedance and the average
change in impedance after inserting the salt water are presented with deviation bars.
The flexible electrodes worked well even on these real tissues, and proper Cole-Cole
plots were achieved. Unlike the phantom experiments, a liquid state impurity was used
for this experiment. When salt water was inserted, the chicken meat absorbed it very
quickly and the salt water spread out. As a result, the impedance of the salt water
inserted area increased as the salt water spread out, but became stable finally after
several minutes. Figure 25 indicates the stabilized impedance. Although unstable
baseline impedance variation was observed at the high frequency range (upper-left
region), the salt water inserted region still had lower impedance than the baseline
impedance as expected (56.26% for resistance and 72.19% for reactance). It is possible
that the large deviation was caused due to the high frequency (10MHz); the high
frequency could possibly affect and change the cell membrane structure because the
capacitance of the cell membrane forms a larger portion of the impedance at high
frequency as mentioned in section 3.2.1. The impedance of the salt water inserted area
was smaller when it was measured right after the insertion. Figure 26 shows the picture
of the chicken with electrodes on it, and the overall experiment process.
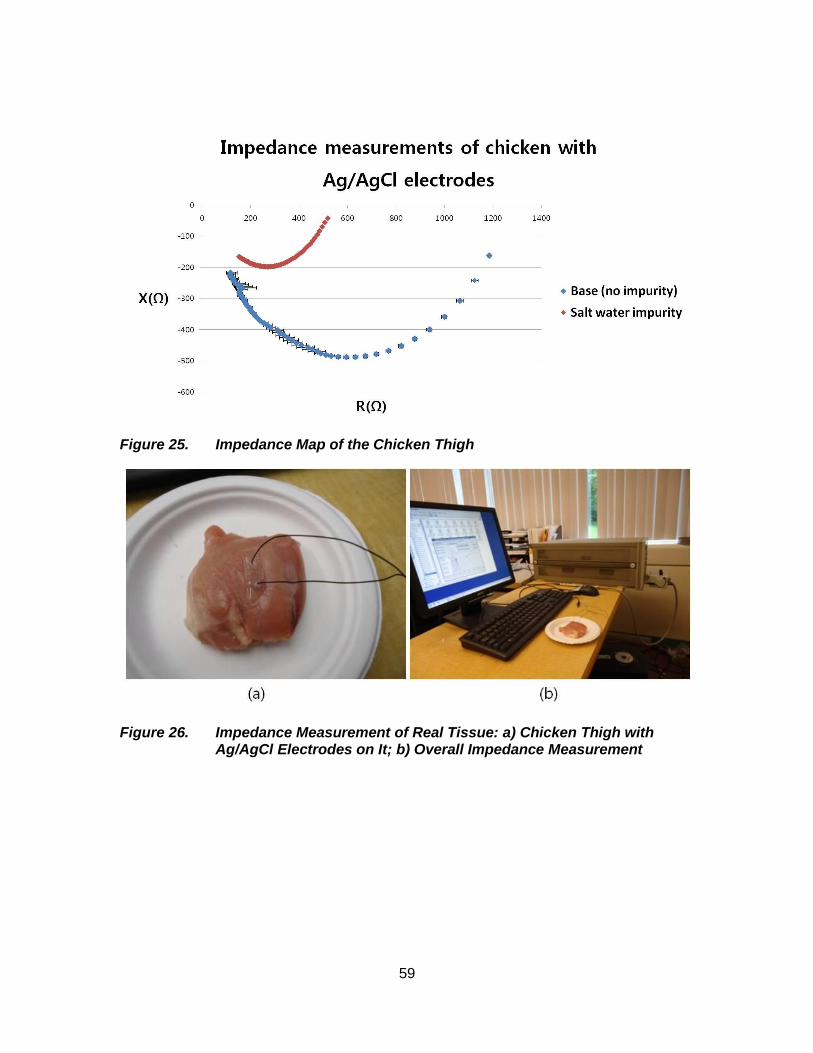
59
Figure 25. Impedance Map of the Chicken Thigh
Figure 26. Impedance Measurement of Real Tissue: a) Chicken Thigh with Ag/AgCl Electrodes on It; b) Overall Impedance Measurement
60
6. Future Works, Contributions, and Conclusions
6.1. Future Works
In the course of the work described in the thesis, several possible improvements
were identified for future work.
6.1.1. Electrodes Design
In this thesis, flexible C-NCP electrodes were developed and tested to prove their
capability, but these electrodes were not optimized. Optimization works are needed for
application of the electrodes in actual cancer detecting EIS apparatus.
To optimize the electrodes, it is important to minimize the size of single electrode
while maintaining its ability to properly contact and measure impedance. Smaller
electrode size would enable detection of very tiny anomalies in tissue with higher spatial
resolution. The C-NCP electrodes’ size can be reduced down to 100m. Patterning
100m structures on a PMMA substrate with CO2 laser ablation machine has already
been demonstrated [62]. Even smaller sizes of electrodes also can be fabricated if
another type of mold, e.g., an SU-8 mold, is used. But this method is not recommended
due to the solvent susceptibility of SU-8. SU-8 molds can also be damaged during the
scraping-off process of the nanoparticle composite polymer mixture or the peeling off
process of the cured PDMS. Still, even using laser ablated molds, the electrode size and
shape could be optimized.
An electrode array that consists of several hundreds of electrodes is also needed
for actual applications, and this is quite possible because micropatterning on large
PMMA substrate has already been demonstrated [62]: 12 inch x 24 inch PMMA
substrates have been micropatterned with structures in size between 100m and 1mm
61
using a CO2 laser ablation machine for the molds. This process could be adapted to a
large array that could fit over, e.g., the entire breast surface.
Next, finding the threshold weight percentage of nanoparticles is very critical for
electrode fabrication. As described in chapter 4.2, poor particle percentage makes the C-
NCP non-conductive, and too much particles will make the C-NCP unable to cure
properly. In addition, the electrical conductivity of the C-NCP varies with the
nanoparticle’s percentage. The electrodes’ conductivity can be optimized by finding the
best nanoparticle percentage, and types of nanoparticle(s).
6.1.2. More Experiments
Impurity distinction experiments were done, and good results were achieved in
this thesis that show promise, especially as this is, to our knowledge, the first time that
nanocomposite electrodes have ever been employed for such a function. However, more
experiments are required to make an improved EIS system capable in actual cancer
detecting applications. For example:
1) The impurity inserted region’s impedance will change with the depth of
impurity. Measurement of the impedance change and standardization of data
is needed to find the available detection range. In addition, electrodes test on
highly curved surface is also needed.
2) Although the impedance of chicken was measured, it was the impedance of
skinless chicken. However, the electrode array will be placed on dermis in
real application. The existence of the dermis may affect and change the result.
To check the influence of the dermis on impedance measurement, more
animal tests on rat belly or shin of pig without skin removal are required.
3) More importantly, clinical demonstration is essential. Collecting and
standardization of data from actual human tissues are required for medical
applications. Once the data collected and standardized, EIS systems with
flexible electrodes can be developed as a cancer screening tool.
62
4) Also, the radiopacity of the C-NCP electrodes should be tested. When
consider combining EIS system with mammography to detect the breast
cancer, it is better for the electrodes not to be seen on the mammography
images. Although PDMS is radiolucent, the radiodensity of nanoparticle
composite polymer is not tested. The radiopacity of C-NCP electrodes should
be tested.
6.2. Contributions
This work has resulted in a number of publications. Initial experiments with
flexible Ag/AgCl electrodes were published and presented at the SPIE Photonics West
2011 conference [65], and large patterning of microstructures on 12 inch x 24 inch
PMMA substrate was also published and presented at the same conference [62]. Lastly,
gelatin phantom tests with Ag/AgCl electrodes with new fabrication process was
published and presented at the 2011 IEEE Sensors conference [66]. Please also see
Appendix A.
6.3. Conclusions
This thesis has made significant progress towards the development of flexible
conductive nanoparticle composite polymer (C-NCP) electrodes to use in Electrical
Impedance Scanning (EIS) systems. It describes the first development of highly flexible
C-NCP electrodes arrays for tissue impedance scanning that we are aware of.
While existing EIS systems have been successfully employed for breast cancer
detection, they are plagued by problems due to poor electrode designs and low spatial
resolution. To overcome these technical challenges, this thesis demonstrates novel
fabrication processes that use PMMA molds and “pipes” for single and multi-level C-
NCP/undoped polymer hybrid processing. The electrodes could be developed in both
macro- and micro-size (from 900m to 2mm), and the fabrication of multilevel structures
with selective exposure was possible with the new process. The Ag/AgCl electrodes
array with the resistivity of 1.75 x 10⁻³ +/- 14.3% Ω⋅m at 65 wt-% and the Ag/graphene
63
electrodes array with the resistivity of 4.45 x 10⁻⁴ +/- 18.7% Ω⋅m at 65wt-% were
developed and tested. In addition, these processes could find other uses for different
structures, such as multilevel routing through the vias.
The C-NCP electrode experiments showed that the electrodes worked very well
and show great promise in application to real cancer detecting applications. Impedance
of anomalies and impurities inserted regions was clearly different from baseline
impedance values, and different types of impurities were distinguished even from each
other by checking and comparing the impedance map. When the impedance of the
chicken thigh was measured, the impedance difference after injecting salt water into the
chicken was 56.26% for resistance and 72.19% for reactance.
It is expected that the flexible C-NCP electrode arrays can be applied to EIS
systems for breast cancer detection. In addition, when considering that the only way to
find skin cancer is biopsy, the flexible electrodes could also hold great potential in EIS
systems for skin cancer diagnostics.
64
References
[1] H. T. Le-Petross and M. K. Shetty, “Magnetic Resonance Imaging and breast ultrasonography as an adjunct to mammographic screening in high-risk patients”, Seminars in Ultrasound, CT, and MRI, vol. 32, no. 4, pp. 266-272, Aug. 2011.
[2] R. Siegel, E. Ward, O. Brawley and A. Jemal, “Caner statistics, 2011.”, CA Cancer Journal for Clinicians, vol. 61, no. 4, pp. 212-236, Jul./Aug. 2011. [Online]. Available: http://onlinelibrary.wiley.com/doi/10.3322/caac.20121/full. [Accessed Jul. 09, 2012].
[3] D. Saslow, C. Boetes, W. Burke, S. Harms, M. O. Leach, C. D. Lehman, E. Morris, E. Pisano, M. Schnall and S. Sener, “American Cancer Society guidelines for breast screening with MRI as an adjunct to mammography”, CA Cancer Journal for Clinicians, vol. 57, no. 2, pp. 75-89, Mar./Apr. 2007.[Online]. Available: http://onlinelibrary.wiley.com/doi/10.3322/canjclin.57.2.75/full. [Accessed Jul. 09, 2012].
[4] H. D. Cheng, J. Shan, W. Ju, Y. Guo and L. Zhang, “Automated breast cancer detection and classification using ultrasound images: A survey”, Pattern Recognition, vol. 43, pp. 299-317, Jan. 2010.
[5] W. A. Berg, J. D. Blume, J. B. Cormack, E. B. Mendelson, D. Lehrer, M. Böhm-Vélez, E. D. Pisano, R. A. Jong, W. P. Evans and M. J. Morton, "Combined screening with ultrasound and mammography vs mammography alone in women at elevated risk of breast cancer," The Journal of the American Medical Association, vol. 299, pp. 2151-2163, May 2008.
[6] Y. Zou and Z. Guo, “A review of electrical impedance techniques for breast cancer detection”, Medical Engineering & Physics, vol. 25, no. 2, pp. 79-90, Mar. 2003.
[7] G. Piperno, E. H. Frei and M. Moshitzky, “Breast cancer screening by impedance measurements”, Frontiers of Medcal and Biological Engineering, vol. 2, no. 2, pp. 111-117, 1990.
[8] M. Melloul, A. Paz, G. Ohana, O. Laver, D. Michalevich, R. Koren, Y. Wolloch and R. Gal, “Double phase 99mTc-sestamibi scintimammography and trans-scan in diagnosing breast cacner”, Journal of Nuclear Medicine, vol. 40, no. 3, pp.376-380, 1999.
65
[9] V. Cherepenin, A. Karpov, A. Korjenevsky, V. Kornienko, A. Mazaletskaya and D. Mazourov, “A 3D electrical impedance tomography (EIT) system for breast cancer detection”, Physiological Measurement, vol. 22, pp. 9-18, Feb. 2001.
[10] T. Morimoto, Y. Kinouchi, T. Iritani, S. Kimura, Y. Konishi and N. Mitsuyama, “Measurement of the electrical bio-impedance of breast tumors”, European Surgical Research, vol. 22, no. 2, pp. 86-92, 1990.
[11] T. Morimoto, S. Kimura, Y. Konishi, K. Komaki, T. Uyama and Y. Monden, “A study of the electrical bioimpedance of tumors”, Journal of Investigative Surgery, vol. 6, no. 1, pp. 25-32, 1993.
[12] K. S. Osterman, T. E. Kerner, D. B. Williams, A. Hartov, S. P. Poplack and K. D. Paulsen, “Multifrequency electrical impedance imaging: preliminary in vivo experience in breast”, Physiological Measurement, vol. 21, pp. 99-109, Feb. 2000.
[13] T. A. Hope and S. E. lles, “Technology review: The use of electrical impedance scanning in the detection of breast cancer”, Breast Cancer Research, vol. 6, pp. 69-74, 2004.
[14] A. Malich, T. Fritsch, R. Anderson, T. Boehm, M. G. Freesmeyer, M. Fleck and W. A. Kaiser. “Electrical impedance scanning for classifying suspicious breast lesions: first results”, European Radiology, vol. 10, no. 10, pp. 1555-1561, May 2000.
[15] S. Grimnes, “Impedance measurement of individual skin surface electrodes”, Medical and Biological Engineering and Computing, vol. 21, no. 6, pp. 750-755, 1983.
[16] E. J. Woo, P. Hua, J. G. Webster, W. J. Tompkins and R. Pallas-Areny, “Skin impedance measurements using simple and compound electrodes”, Medical and Biological Engineering and Computing, vol. 30, no. 1, pp. 97-102, 1992.
[17] J. N. Patel, B. L. Gray, B. Kaminska and B. D. Gates, “Flexible glucose sensor utilizing multilayer PDMS process”, in Proc. Engineering in Medicine and Biology Society 2008, 2008, pp. 5749-5752.
[18] S. P. Lacour, J. Jones, Z. Suo and S. Wagner, “Design and performance of thin film interconnects for skin-like electronic circuits”, Electron Device Letters, IEEE, vol. 25, no. 4, pp. 179-181, Apr. 2004.
[19] J. N. Patel, B. Kaminska, B. L. Gray and B. D. Gates, “PDMS as a sacrificial substrate for SU-8-based biomedical and microfluidic applications”, Journal of Micromechanics and Microengineering, vol. 18, no.9, 095028, Sep. 2008.
[20] L. Nyström, L. Rutqvist, S. Wall, A. Lindgren, M. Lindqvist, S. Ryden, I. Andersson, N. Bjurstam, G. Fagerberg and J. Frisell,, “Breast cancer screening with mammography: overview of Swedish randomised trials”, Lancet, vol. 341, pp. 973-978, 1993.
66
[21] S. J. Otto, J. Fracheboud, C. W. N. Looman, M. J. M. Broeders, R. Boer, J. H. C. L. Hendriks, A. L. M. Verbeek and H. J. de Koning, “Initiation of population-based mammography screening in Dutch municipalities and effect on breast-cancer mortality: a systematic review”, Lancet, vol. 361, pp. 1411-1417, Apr. 2003.
[22] P. T. Huynh, A. M. Jarolimek and S. Daye, “The false-negative mammogram”, RadioGraphics, vol. 18, pp. 1137-1154, Sep. 1998.
[23] The radiology information resource for patients, “Breast ultrasound”, 2011. [Online]. Available: http://www.radiologyinfo.org/en/info.cfm?pg=breastus. [Accessed Jul. 09, 2012].
[24] B. Sahiner, H. P. Chan, M. A. Roubidoux, L. M. Hadjiiski, M. A. Helvie, C. Paramagul, J. Bailey, A. V. Nees and C. Blane, “Malignant and benign breast masses on 3D US volumetric images: effect of computer-aided diagnosis on radiologist accuracy”, Radiology, vol. 242, pp. 716-724, Mar. 2007.
[25] C. M. Chen, Y. H. Chou, K. C. Han, G. S. Hung, C. M. tiu, H. J. Chiou and S. Y. Chiou, “Breast lesions on sonograms: computer-aided diagnosis with nearly setting-independent features and artificial neural networks”, Radiology, vol. 226, pp.504-514, Feb. 2003.
[26] K. Drukker, M. L. Giger, K. Horsch, M. A. Kupinski, C. J. Vyborny and E. B. Mendelson, “Computerized lesion detection on breast ultrasound”, Medical Physics, vol. 29, no. 7, pp.1438-1446, Jun. 2002.
[27] M. P. Andr, M. Galperin, L. K. Olson, K. Richman, S. Payrovi and P. Phan, “Improving the accuracy of diagnostic breast ultrasound”, Acoustical Imaging, vol. 26, pp.453-460, 2002.
[28] M. Costantini, P. Belli, R. Lombardi, G. Franceschini, A. Mule and L. Bonomo, “Characterization of solid breast masses”, Journal of Ultrasound in Medicine, vol. 25, no. 5, pp. 649-659, May 2006.
[29] W. Teh and A. R. M. Wilson, “The role of ultrasound in breast cancer screening. A consensus statement by the european group for breast cancer screening”, European Jouranl of Cancer, vol. 34, no. 4, pp. 449-450, Mar. 1998.
[30] Y. L. huang, D. R. Chen and Y. K. Liu, “Breast cancer diagnosis using image retrieval for different ultrasonic systems”, in Proc. International conference on Image Processing, 2004, pp. 2598-2960.
[31] M. Pamilo, M. Soiva, I. Anttinen, M. Roiha and I. Suramo, “Ultrasonography of breast lesions detected in mammography screening”, Acta Radiologica, vol. 32, no. 3, pp. 220-225, 1991.
[32] A. J. Potterton, D. J. Peakman and J. R. Young, “Ultrasound demonstration of small breast cancers detected by mammogarphic screening”, Clinical Radiology, vol. 49, no. 11, pp. 808-813, Nov. 1994.
67
[33] W. J. Leucht, D. Leucht and L. Kiesel, “Sonographic demonstration and evaluation of microcalcifications in the breast”, Breast Disease, vol. 5, pp.105-123, 1992.
[34] P. B. Gordon and S. L. Goldenberg, “Malignant masses detected only by US. A retrospective review”, Cancer, vol.75, no. 4, pp. 626-630, Aug. 1995.
[35] E. Warner, D. B. Plewes and K. A. Hill, “Surveillance of BRCA1 and BRCA2 mutation carriers with magnetic resonance imaging, ultrasound, mammography, and clinical berast examination”, The Journal of the American Medical Association, vol. 292, no. 11, pp. 1317-1325, Sep. 2004.
[36] C. K. Kuhl, S. Schrading and C. C. Leutner, “Mammography, breast ultrasound, and magnetic resonance imaging for surveillance of women at high familial risk for breast cancer”, Journal of Clinical Oncology, vol. 23, no. 33, pp. 8469-8476, Nov. 2005.
[37] F. Sardanelli, F. Podo and F. Santoro, “Multicenter surveillance of women at high genetic breast cancer risk using mammography, ultrasonography, and contrast-enhanced magnetic resonance imaging ( the High Breast Cancer Risk Italian 1 study): Final results”, Investigative Radiology, vol. 46, no. 2, pp. 94-105, Feb. 2011.
[38] S. P. Weinstein, A. R. Localio and E. F. Conant, “Multimodality screening of high-risk women: A prospective cohort study”, Journal of Clinical Oncology, vol. 27, no. 36, pp. 6124-6128, Nov. 2009.
[39] C. D. Lehman, C. Isaacs and M. D. Schnall, “Cancer yield of mammography, MR, and US in high-risk women: prospective multi-institution breast cancer screening study”, Radiology, vol. 244, pp. 381-388, Aug. 2007.
[40] M. Kriege, C. T. Brekelmans and C. Boetes, “Efficacy of MRI and mammography for breast cancer screening in women with a familial or genetic predisposition”, The New England Journal of Medicine, vol. 351, pp. 427-437, Jul. 2004.
[41] msnbc, “Yearly breast MRIs urged for 1.4 million women” 2007. [Online]. Available: http://www.msnbc.msn.com/id/17818068/ns/health-cancer/t/yearly-breast-mris-urged-million-women/ [Accessed Jul. 15, 2012].
[42] C. K. Kuhl, W. Kuhn, H. Schild, “Management of women at high risk for breast cancer: New imaging beyond mammography”, The Breast, vol. 14, no. 6, pp. 480-486, Dec. 2005.
[43] M. O. Leach, C. R. Boggis and A. K. Dixon, “Screening with magnetic resonance imaging and mammography of a UK population at high familial risk of breast cancer: A prospecitve multicentre cohort study”, Lancet, vol. 365, pp. 1769-1778, 2005.
[44] E. T. McAdams and J. Jossinet, “Tissue Impedance: a historical overview”, Physiological Measurement, vol. 16, A1-13, Aug. 1995.
68
[45] B. Blad and B. Baldetorp, “Impedance spectra of tumour tissue in comparison with normal tissue: A possible clinical application for electrical impedance tomography”, Physiological Measurement, vol. 17, A105-115, Nov. 1996.
[46] R. G. Stern, B. N. Milestone and R. A. Gatenby, “Carcinogenesis and the plasma membrane”, Medical Hypotheses, vol. 52, no. 5, pp. 367-372, May 1999.
[47] F. W. Cope, “A medical application of the Ling Association-Induction Hypothesis: The high potassium, low sodium diet of the Gerson cancer therapy”, Physiological Chemistry and Physics, vol. 10, no. 5, pp. 465-468, 1978.
[48] G. Piperno, E. H. Frei and M. Moshitzky, “Breast cancer screening by impedance measurements”, Frontiers of Medical and Biological Engineering, vol. 2, no. 2, pp.111-117, 1990.
[49] N. Gospodinova, P. Mokreva, T. Tsanov and L. Terlemezyan, “A new route to polyaniline composites”, Polymer, vol. 38, no. 3, pp. 743-746, Feb. 1997.
[50] M. R. Neuman, “Medical instrumentation: application and design”, New York: Wiley, 1998.
[51] S. Na, S. Kim, J. Jo and D, Kim, “Efficient and flexible ITO-free organic solar cells using highly conductive polymer anodes”, Advanced Materials, vol. 20, no. 21, pp. 4061-4067, Nov. 2008.
[52] K. Yoshino, S. Nakajima, M. Fujii and R. I. Sugimoto, “conducting polymer fibre prepared by melt-spinning method from fusible polythiophene derivative”, Journal of Polymer Communications, vol. 28, no. 11, pp. 309-310, Nov. 1987.
[53] A. Khosla, “Micropatternable multifunctional nanocomposite polymers for flexible soft MEMS applications”, Ph.D thesis, Simon Fraser University, Burnaby, BC, 2011.
[54] S. J. Clarson and J. A. Semlyen, “Siloxane Polymers”, Englewood Cliffs, NJ: Prentice Hall, 1993.
[55] Y. Xia and G. M. Whitesides, “Soft lithography”, Annual Review of Materials Science, vol. 28, pp. 153-184, 1998.
[56] X. Wang, L. Ge, J. Lu, X. Li, K. Qiu, Y. Tian, S. Fu and Z. Cui, “Fabrication of enclosed nanofluidic channels by UV cured imprinting and optimized thermal bonding of SU-8 photoresist”, Microelectronic Engineering, vol. 86, no. 4/6, pp. 1347-1349, Apr./Jun. 2009.
[57] J. D. Sudha, S. Sivakala, R. Prasanth, V. L. Reena and P. R. Nair, “Development of electromagnetic shielding materials from the conductive blends of polyaniline and polyaniline-clay nanocomposite-EVA: preparation and properties”, Composites Scienece and Technology, vol. 69, pp. 358-364, 2009.
69
[58] A. N. Lagarkov and A. K. Sarychev, “Electromagnetic properties of composites containing elongated conducting inclusions”, Physical Review B, vol. 53, no. 10, pp. 6318-6336, Mar. 1996.
[59] A. H. Castro Neto, F. Guinea, N. M. R. Peres, K. S. Novoselov, A. K. Geim, “The electronic properties of graphene”, Reviews of Modern Physics, vol. 81, no.1, pp. 109-162, 2009.
[60] H. Yang, A. Jin, Q. Luo, J. Li, C. Gu and Z. Cui, “Electron beam lithography of HSQ/PMMS bilayer resists for negative tone lift-off process”, Microelectronic Engineering, vol. 85, no.5/6, pp. 814-817, May/Jun. 2008.
[61] K. Harada, “Plasma etching durability of poly(methyl methacrylate)”, Journal of Applied Polymer Science, vol. 26, no.6, pp. 1961-1973, Jun. 1981.
[62] A. Khosla, D. Hilbich, C. Drewbrook, D. Chung and B. L. Gray, “Large scale micropatterning of multi-walled carbon nanotube/polydimethylsiloxane nanocomposite polymer on highly flexible 12x24 inch substrates”, in Proc. SPIE Photonics 2011, 2011, 79260L.
[63] M. Giassa, A. Khosla and B. L. Gray, “Application for low frequency impedance analysis systems”, Journal of Electronic testing, Vol. 26, no.1, pp. 139-144, 2010.
[64] D. W. Rickey, P. A. Picot, D. A. Christopher and A. Fenster, “A wall-less vessel phantom for Doppler ultrasound studies”, Ultrasound in Medicine and Biology, vol. 21, no. 9, pp. 1163-1176, 1995.
[65] D. Chung, S. Seyfollahi, A. Khosla, B. L. Gray, M. Parameswaran, R. Ramani and K. Kohli, “Initial experiments with flexible conductive electrodes for potential applications in cancer tissue screening”, in Proc. SPIE Photonics 2011, 2011, 79290Z.
[66] D. Chung, S. Seyfollahi, A. Khosla, B. L. Gray, M. Parameswaran, R. Ramani and K. Kohli, “Embedded process for flexible conductive electrodes for applications in tissue Electrical Impedance Scanning (EIS)”, in Proc. IEEE Sensors 2011, 2011, pp. 1893-1896.
[67] M. Kolb, J. Lichy and J. H. Newhouse, “Comparison of the performance of screening mammography, physical examination, and breast US and evaluation of factors that influence them: an analysis of 27,825 patient evaluations”, Radiology, vol. 225, pp. 165-175, Sep. 2002.
[68] J. Michaelson, S. Satija, R. Moore, G. Weber, E. Halpern, A. Garland, D. B. Kopans and K. Hughes, “Estimates of the sizes which breast cancers become detectable on mammographic and clinical grounds”, Journal of Women’s Imaging, vol. 5, no. 1, pp. 3-10, 2003.
[69] J. Bryzek, K. Peterson and W. McCulley, “Micromachines on the march”, IEEE Spectrum, vol. 31, no. 5, pp. 20-31, May 1994.
70
[70] E. Warner, H. Messersmith and D. B. Plewes, “Systematic review: using magnetic resonance imaging to screen women at high risk for breast cancer”, Annals Internal Medicine, vol. 148, no. 9, pp. 671-679, 2008.

71
Appendices
72
Appendix A. List of Publications
1. D. Chung, S. Seyfollahi, A. Khosla, B. L. Gray, M. Parameswaran, R. Ramani, K. Kohli, “Initial experiments with flexible conductive electrodes for potential applications in cancer tissue screening”, Proc. SPIE 7929, 79290Z, 2011.
2. D. Chung, S. Seyfollahi, A. Khosla, B. L. Gray, M. Parameswaran, R. Ramani, K. Kohli, “Embedded Process for Flexible Conductive Electrodes for Applications in Tissue Electrical Impedance Scanning (EIS)”, IEEE Sensors 2011.
3. A. Khosla, D. Hilbich, C. Drewbrook, D. Chung, B. L. Gray, “Large scale micropatterning of multi-walled carbon nanotube/polydimethylsiloxane nanocomposite polymer on highly flexible 12x24 inch substrates”, Proc. SPIE 7926, 79260L, 2011.
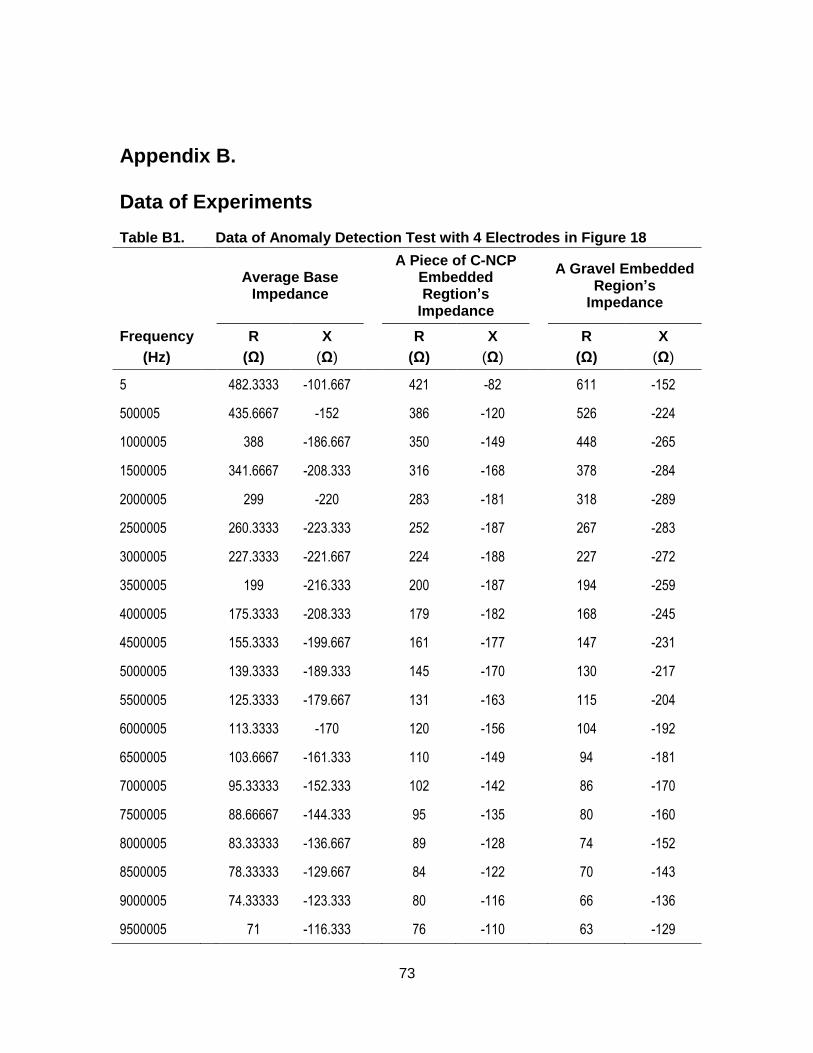
73
Appendix B. Data of Experiments
Table B1. Data of Anomaly Detection Test with 4 Electrodes in Figure 18
Average Base
Impedance
A Piece of C-NCP Embedded Regtion’s
Impedance
A Gravel Embedded
Region’s Impedance
Frequency
(Hz)
R
(Ω)
X
(Ω)
R
(Ω)
X
(Ω)
R
(Ω)
X
(Ω)
5 482.3333 -101.667 421 -82 611 -152
500005 435.6667 -152 386 -120 526 -224
1000005 388 -186.667 350 -149 448 -265
1500005 341.6667 -208.333 316 -168 378 -284
2000005 299 -220 283 -181 318 -289
2500005 260.3333 -223.333 252 -187 267 -283
3000005 227.3333 -221.667 224 -188 227 -272
3500005 199 -216.333 200 -187 194 -259
4000005 175.3333 -208.333 179 -182 168 -245
4500005 155.3333 -199.667 161 -177 147 -231
5000005 139.3333 -189.333 145 -170 130 -217
5500005 125.3333 -179.667 131 -163 115 -204
6000005 113.3333 -170 120 -156 104 -192
6500005 103.6667 -161.333 110 -149 94 -181
7000005 95.33333 -152.333 102 -142 86 -170
7500005 88.66667 -144.333 95 -135 80 -160
8000005 83.33333 -136.667 89 -128 74 -152
8500005 78.33333 -129.667 84 -122 70 -143
9000005 74.33333 -123.333 80 -116 66 -136
9500005 71 -116.333 76 -110 63 -129
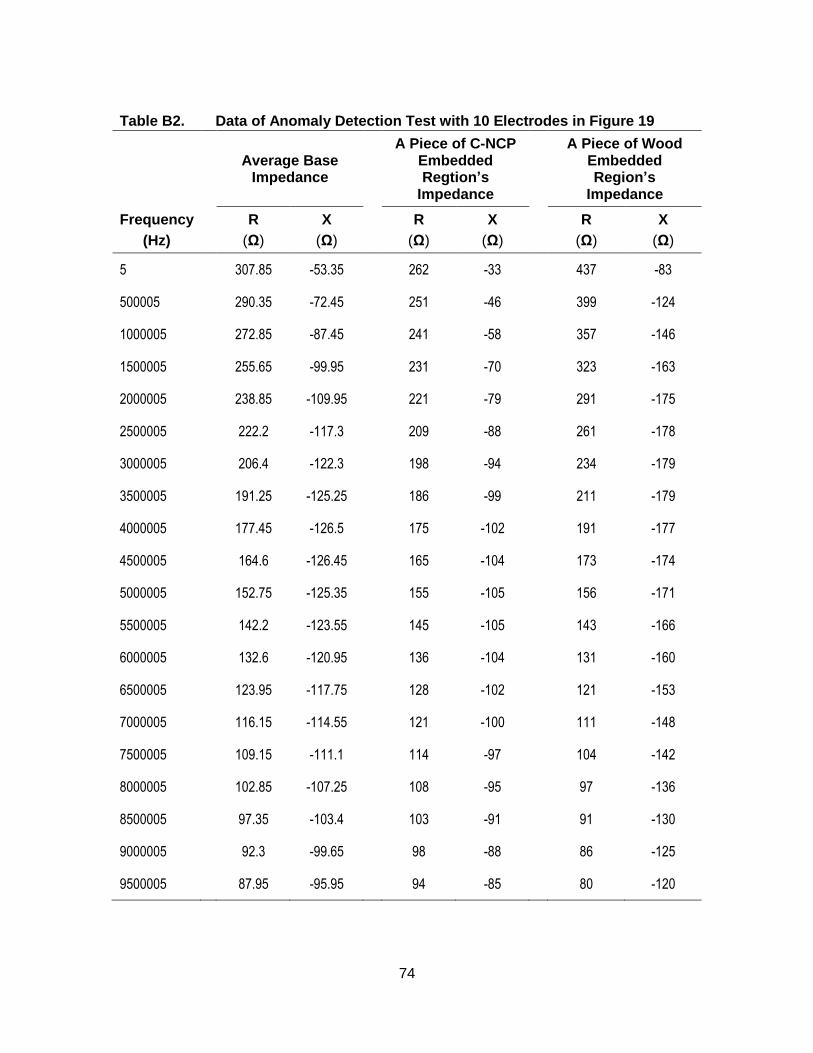
74
Table B2. Data of Anomaly Detection Test with 10 Electrodes in Figure 19
Average Base
Impedance
A Piece of C-NCP Embedded Regtion’s
Impedance
A Piece of Wood Embedded Region’s
Impedance
Frequency
(Hz)
R
(Ω)
X
(Ω)
R
(Ω)
X
(Ω)
R
(Ω)
X
(Ω)
5 307.85 -53.35 262 -33 437 -83
500005 290.35 -72.45 251 -46 399 -124
1000005 272.85 -87.45 241 -58 357 -146
1500005 255.65 -99.95 231 -70 323 -163
2000005 238.85 -109.95 221 -79 291 -175
2500005 222.2 -117.3 209 -88 261 -178
3000005 206.4 -122.3 198 -94 234 -179
3500005 191.25 -125.25 186 -99 211 -179
4000005 177.45 -126.5 175 -102 191 -177
4500005 164.6 -126.45 165 -104 173 -174
5000005 152.75 -125.35 155 -105 156 -171
5500005 142.2 -123.55 145 -105 143 -166
6000005 132.6 -120.95 136 -104 131 -160
6500005 123.95 -117.75 128 -102 121 -153
7000005 116.15 -114.55 121 -100 111 -148
7500005 109.15 -111.1 114 -97 104 -142
8000005 102.85 -107.25 108 -95 97 -136
8500005 97.35 -103.4 103 -91 91 -130
9000005 92.3 -99.65 98 -88 86 -125
9500005 87.95 -95.95 94 -85 80 -120
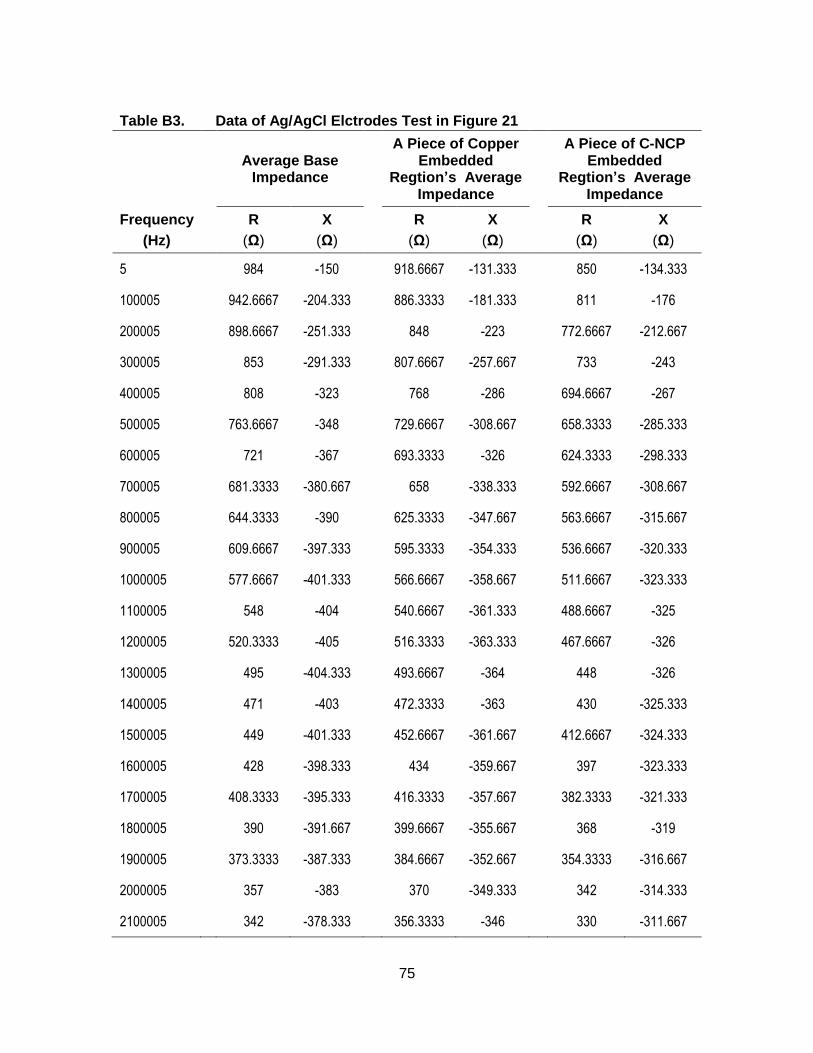
75
Table B3. Data of Ag/AgCl Elctrodes Test in Figure 21
Average Base
Impedance
A Piece of Copper Embedded
Regtion’s Average Impedance
A Piece of C-NCP Embedded
Regtion’s Average Impedance
Frequency
(Hz)
R
(Ω)
X
(Ω)
R
(Ω)
X
(Ω)
R
(Ω)
X
(Ω)
5 984 -150 918.6667 -131.333 850 -134.333
100005 942.6667 -204.333 886.3333 -181.333 811 -176
200005 898.6667 -251.333 848 -223 772.6667 -212.667
300005 853 -291.333 807.6667 -257.667 733 -243
400005 808 -323 768 -286 694.6667 -267
500005 763.6667 -348 729.6667 -308.667 658.3333 -285.333
600005 721 -367 693.3333 -326 624.3333 -298.333
700005 681.3333 -380.667 658 -338.333 592.6667 -308.667
800005 644.3333 -390 625.3333 -347.667 563.6667 -315.667
900005 609.6667 -397.333 595.3333 -354.333 536.6667 -320.333
1000005 577.6667 -401.333 566.6667 -358.667 511.6667 -323.333
1100005 548 -404 540.6667 -361.333 488.6667 -325
1200005 520.3333 -405 516.3333 -363.333 467.6667 -326
1300005 495 -404.333 493.6667 -364 448 -326
1400005 471 -403 472.3333 -363 430 -325.333
1500005 449 -401.333 452.6667 -361.667 412.6667 -324.333
1600005 428 -398.333 434 -359.667 397 -323.333
1700005 408.3333 -395.333 416.3333 -357.667 382.3333 -321.333
1800005 390 -391.667 399.6667 -355.667 368 -319
1900005 373.3333 -387.333 384.6667 -352.667 354.3333 -316.667
2000005 357 -383 370 -349.333 342 -314.333
2100005 342 -378.333 356.3333 -346 330 -311.667
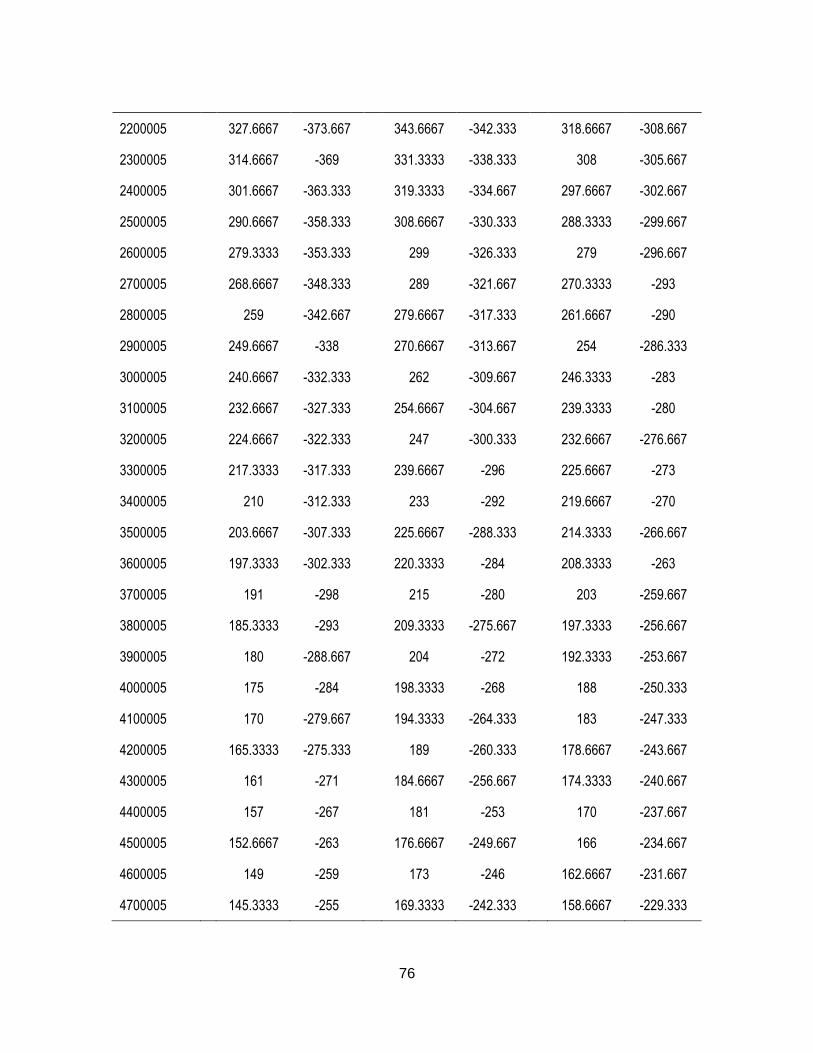
76
2200005 327.6667 -373.667 343.6667 -342.333 318.6667 -308.667
2300005 314.6667 -369 331.3333 -338.333 308 -305.667
2400005 301.6667 -363.333 319.3333 -334.667 297.6667 -302.667
2500005 290.6667 -358.333 308.6667 -330.333 288.3333 -299.667
2600005 279.3333 -353.333 299 -326.333 279 -296.667
2700005 268.6667 -348.333 289 -321.667 270.3333 -293
2800005 259 -342.667 279.6667 -317.333 261.6667 -290
2900005 249.6667 -338 270.6667 -313.667 254 -286.333
3000005 240.6667 -332.333 262 -309.667 246.3333 -283
3100005 232.6667 -327.333 254.6667 -304.667 239.3333 -280
3200005 224.6667 -322.333 247 -300.333 232.6667 -276.667
3300005 217.3333 -317.333 239.6667 -296 225.6667 -273
3400005 210 -312.333 233 -292 219.6667 -270
3500005 203.6667 -307.333 225.6667 -288.333 214.3333 -266.667
3600005 197.3333 -302.333 220.3333 -284 208.3333 -263
3700005 191 -298 215 -280 203 -259.667
3800005 185.3333 -293 209.3333 -275.667 197.3333 -256.667
3900005 180 -288.667 204 -272 192.3333 -253.667
4000005 175 -284 198.3333 -268 188 -250.333
4100005 170 -279.667 194.3333 -264.333 183 -247.333
4200005 165.3333 -275.333 189 -260.333 178.6667 -243.667
4300005 161 -271 184.6667 -256.667 174.3333 -240.667
4400005 157 -267 181 -253 170 -237.667
4500005 152.6667 -263 176.6667 -249.667 166 -234.667
4600005 149 -259 173 -246 162.6667 -231.667
4700005 145.3333 -255 169.3333 -242.333 158.6667 -229.333
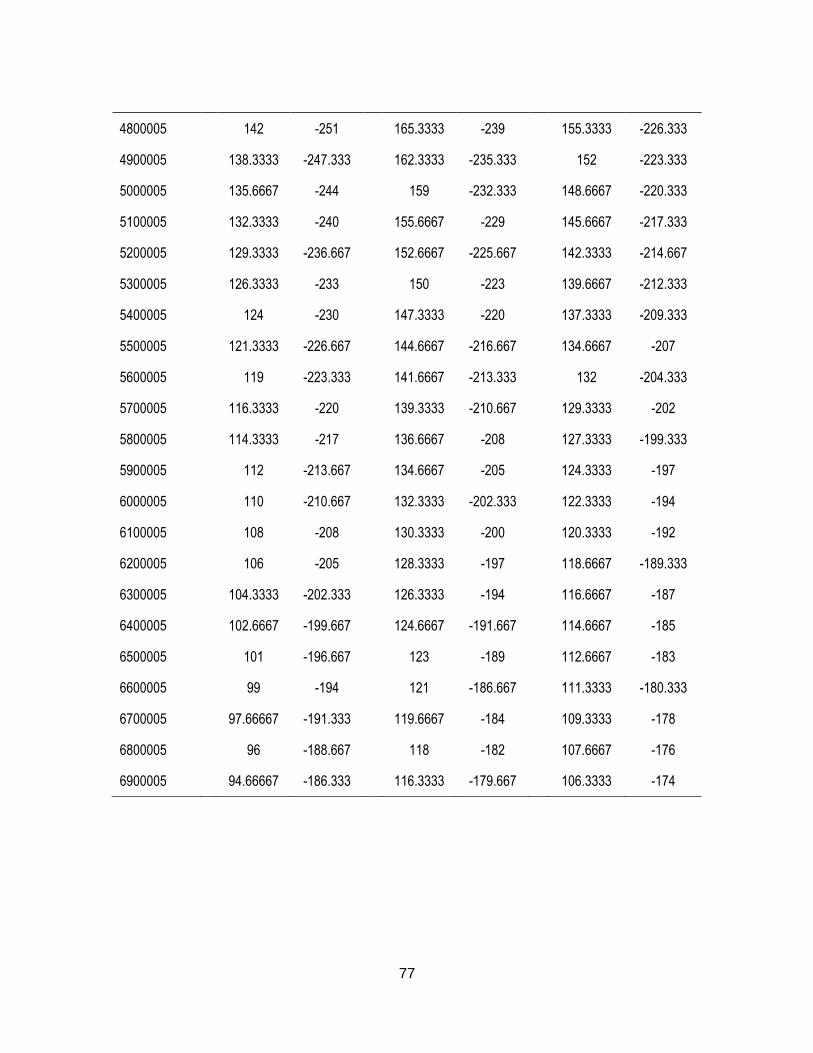
77
4800005 142 -251 165.3333 -239 155.3333 -226.333
4900005 138.3333 -247.333 162.3333 -235.333 152 -223.333
5000005 135.6667 -244 159 -232.333 148.6667 -220.333
5100005 132.3333 -240 155.6667 -229 145.6667 -217.333
5200005 129.3333 -236.667 152.6667 -225.667 142.3333 -214.667
5300005 126.3333 -233 150 -223 139.6667 -212.333
5400005 124 -230 147.3333 -220 137.3333 -209.333
5500005 121.3333 -226.667 144.6667 -216.667 134.6667 -207
5600005 119 -223.333 141.6667 -213.333 132 -204.333
5700005 116.3333 -220 139.3333 -210.667 129.3333 -202
5800005 114.3333 -217 136.6667 -208 127.3333 -199.333
5900005 112 -213.667 134.6667 -205 124.3333 -197
6000005 110 -210.667 132.3333 -202.333 122.3333 -194
6100005 108 -208 130.3333 -200 120.3333 -192
6200005 106 -205 128.3333 -197 118.6667 -189.333
6300005 104.3333 -202.333 126.3333 -194 116.6667 -187
6400005 102.6667 -199.667 124.6667 -191.667 114.6667 -185
6500005 101 -196.667 123 -189 112.6667 -183
6600005 99 -194 121 -186.667 111.3333 -180.333
6700005 97.66667 -191.333 119.6667 -184 109.3333 -178
6800005 96 -188.667 118 -182 107.6667 -176
6900005 94.66667 -186.333 116.3333 -179.667 106.3333 -174
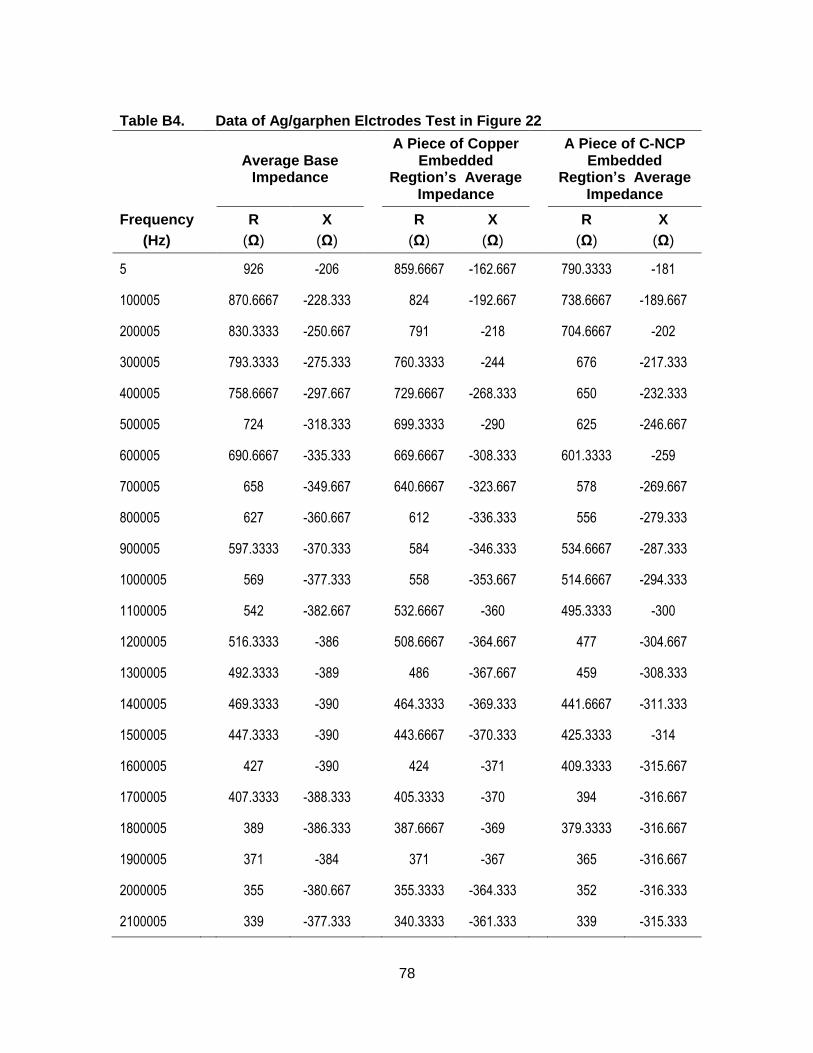
78
Table B4. Data of Ag/garphen Elctrodes Test in Figure 22
Average Base
Impedance
A Piece of Copper Embedded
Regtion’s Average Impedance
A Piece of C-NCP Embedded
Regtion’s Average Impedance
Frequency
(Hz)
R
(Ω)
X
(Ω)
R
(Ω)
X
(Ω)
R
(Ω)
X
(Ω)
5 926 -206 859.6667 -162.667 790.3333 -181
100005 870.6667 -228.333 824 -192.667 738.6667 -189.667
200005 830.3333 -250.667 791 -218 704.6667 -202
300005 793.3333 -275.333 760.3333 -244 676 -217.333
400005 758.6667 -297.667 729.6667 -268.333 650 -232.333
500005 724 -318.333 699.3333 -290 625 -246.667
600005 690.6667 -335.333 669.6667 -308.333 601.3333 -259
700005 658 -349.667 640.6667 -323.667 578 -269.667
800005 627 -360.667 612 -336.333 556 -279.333
900005 597.3333 -370.333 584 -346.333 534.6667 -287.333
1000005 569 -377.333 558 -353.667 514.6667 -294.333
1100005 542 -382.667 532.6667 -360 495.3333 -300
1200005 516.3333 -386 508.6667 -364.667 477 -304.667
1300005 492.3333 -389 486 -367.667 459 -308.333
1400005 469.3333 -390 464.3333 -369.333 441.6667 -311.333
1500005 447.3333 -390 443.6667 -370.333 425.3333 -314
1600005 427 -390 424 -371 409.3333 -315.667
1700005 407.3333 -388.333 405.3333 -370 394 -316.667
1800005 389 -386.333 387.6667 -369 379.3333 -316.667
1900005 371 -384 371 -367 365 -316.667
2000005 355 -380.667 355.3333 -364.333 352 -316.333
2100005 339 -377.333 340.3333 -361.333 339 -315.333
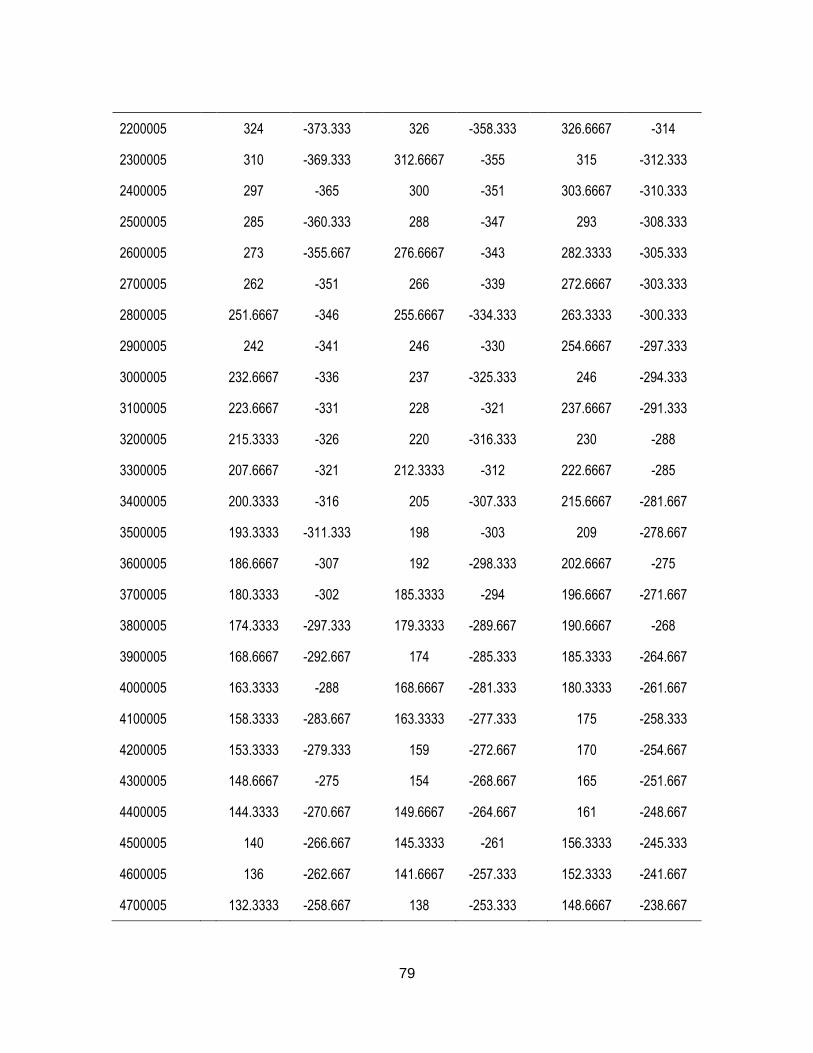
79
2200005 324 -373.333 326 -358.333 326.6667 -314
2300005 310 -369.333 312.6667 -355 315 -312.333
2400005 297 -365 300 -351 303.6667 -310.333
2500005 285 -360.333 288 -347 293 -308.333
2600005 273 -355.667 276.6667 -343 282.3333 -305.333
2700005 262 -351 266 -339 272.6667 -303.333
2800005 251.6667 -346 255.6667 -334.333 263.3333 -300.333
2900005 242 -341 246 -330 254.6667 -297.333
3000005 232.6667 -336 237 -325.333 246 -294.333
3100005 223.6667 -331 228 -321 237.6667 -291.333
3200005 215.3333 -326 220 -316.333 230 -288
3300005 207.6667 -321 212.3333 -312 222.6667 -285
3400005 200.3333 -316 205 -307.333 215.6667 -281.667
3500005 193.3333 -311.333 198 -303 209 -278.667
3600005 186.6667 -307 192 -298.333 202.6667 -275
3700005 180.3333 -302 185.3333 -294 196.6667 -271.667
3800005 174.3333 -297.333 179.3333 -289.667 190.6667 -268
3900005 168.6667 -292.667 174 -285.333 185.3333 -264.667
4000005 163.3333 -288 168.6667 -281.333 180.3333 -261.667
4100005 158.3333 -283.667 163.3333 -277.333 175 -258.333
4200005 153.3333 -279.333 159 -272.667 170 -254.667
4300005 148.6667 -275 154 -268.667 165 -251.667
4400005 144.3333 -270.667 149.6667 -264.667 161 -248.667
4500005 140 -266.667 145.3333 -261 156.3333 -245.333
4600005 136 -262.667 141.6667 -257.333 152.3333 -241.667
4700005 132.3333 -258.667 138 -253.333 148.6667 -238.667
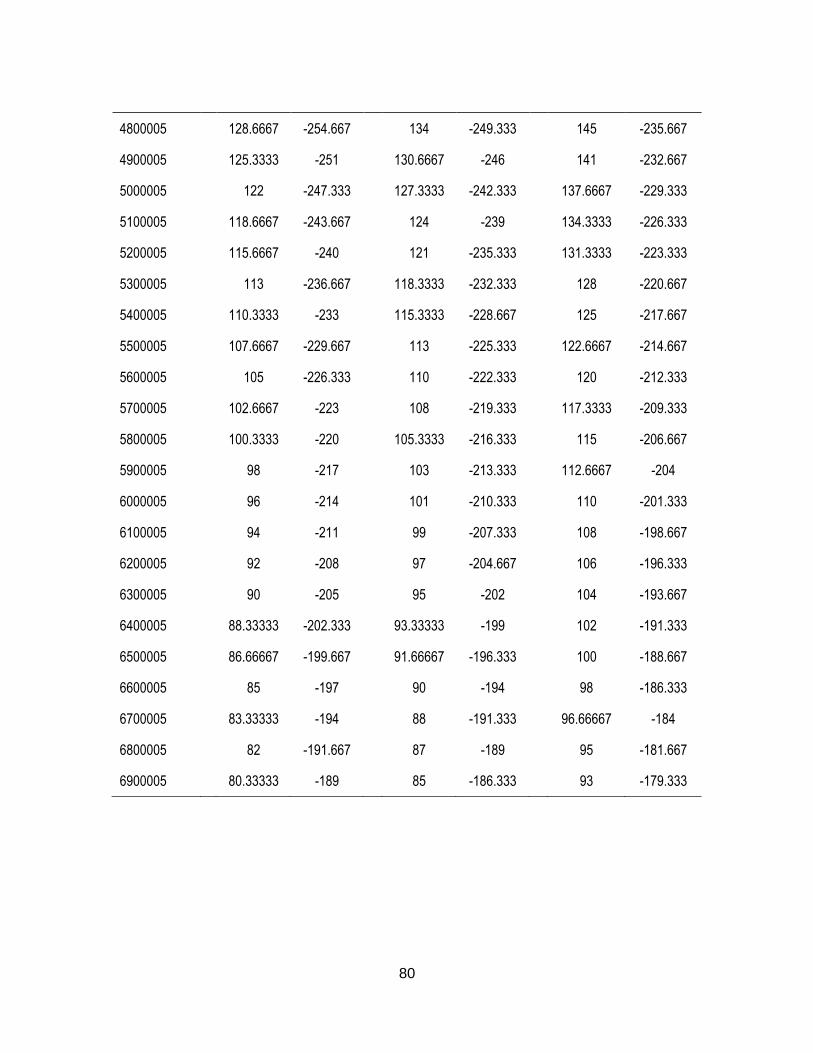
80
4800005 128.6667 -254.667 134 -249.333 145 -235.667
4900005 125.3333 -251 130.6667 -246 141 -232.667
5000005 122 -247.333 127.3333 -242.333 137.6667 -229.333
5100005 118.6667 -243.667 124 -239 134.3333 -226.333
5200005 115.6667 -240 121 -235.333 131.3333 -223.333
5300005 113 -236.667 118.3333 -232.333 128 -220.667
5400005 110.3333 -233 115.3333 -228.667 125 -217.667
5500005 107.6667 -229.667 113 -225.333 122.6667 -214.667
5600005 105 -226.333 110 -222.333 120 -212.333
5700005 102.6667 -223 108 -219.333 117.3333 -209.333
5800005 100.3333 -220 105.3333 -216.333 115 -206.667
5900005 98 -217 103 -213.333 112.6667 -204
6000005 96 -214 101 -210.333 110 -201.333
6100005 94 -211 99 -207.333 108 -198.667
6200005 92 -208 97 -204.667 106 -196.333
6300005 90 -205 95 -202 104 -193.667
6400005 88.33333 -202.333 93.33333 -199 102 -191.333
6500005 86.66667 -199.667 91.66667 -196.333 100 -188.667
6600005 85 -197 90 -194 98 -186.333
6700005 83.33333 -194 88 -191.333 96.66667 -184
6800005 82 -191.667 87 -189 95 -181.667
6900005 80.33333 -189 85 -186.333 93 -179.333
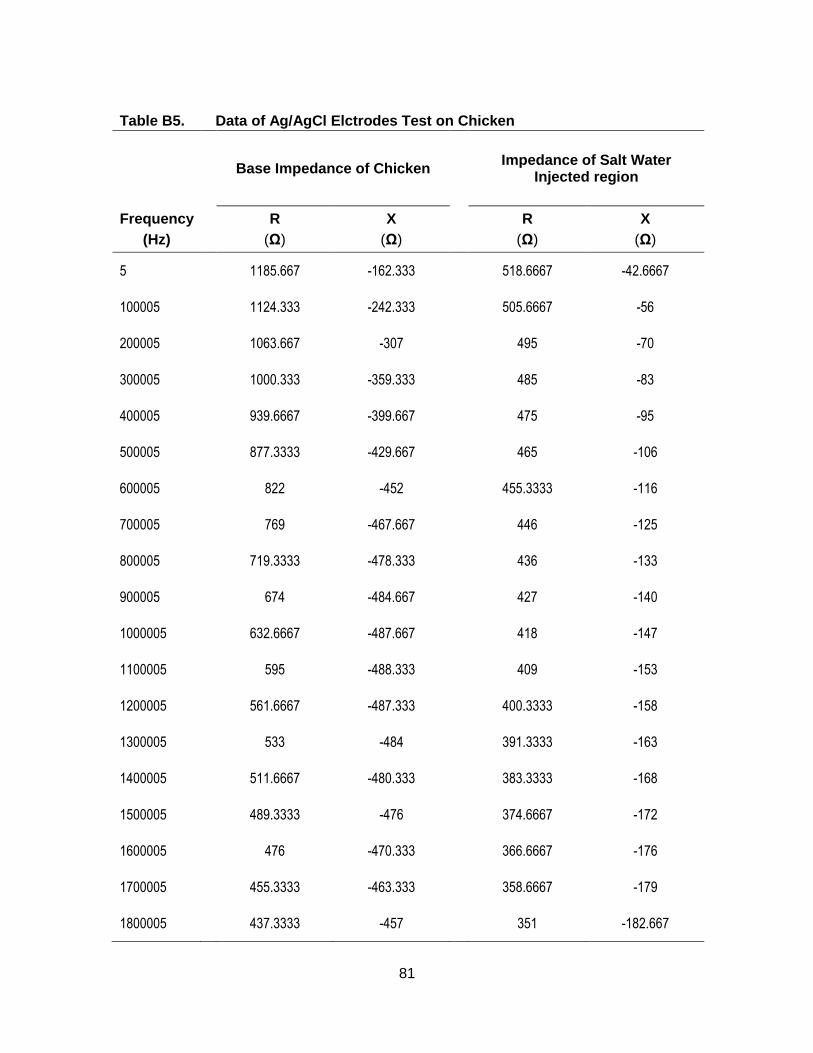
81
Table B5. Data of Ag/AgCl Elctrodes Test on Chicken
Base Impedance of Chicken Impedance of Salt Water
Injected region
Frequency
(Hz)
R
(Ω)
X
(Ω)
R
(Ω)
X
(Ω)
5 1185.667 -162.333 518.6667 -42.6667
100005 1124.333 -242.333 505.6667 -56
200005 1063.667 -307 495 -70
300005 1000.333 -359.333 485 -83
400005 939.6667 -399.667 475 -95
500005 877.3333 -429.667 465 -106
600005 822 -452 455.3333 -116
700005 769 -467.667 446 -125
800005 719.3333 -478.333 436 -133
900005 674 -484.667 427 -140
1000005 632.6667 -487.667 418 -147
1100005 595 -488.333 409 -153
1200005 561.6667 -487.333 400.3333 -158
1300005 533 -484 391.3333 -163
1400005 511.6667 -480.333 383.3333 -168
1500005 489.3333 -476 374.6667 -172
1600005 476 -470.333 366.6667 -176
1700005 455.3333 -463.333 358.6667 -179
1800005 437.3333 -457 351 -182.667
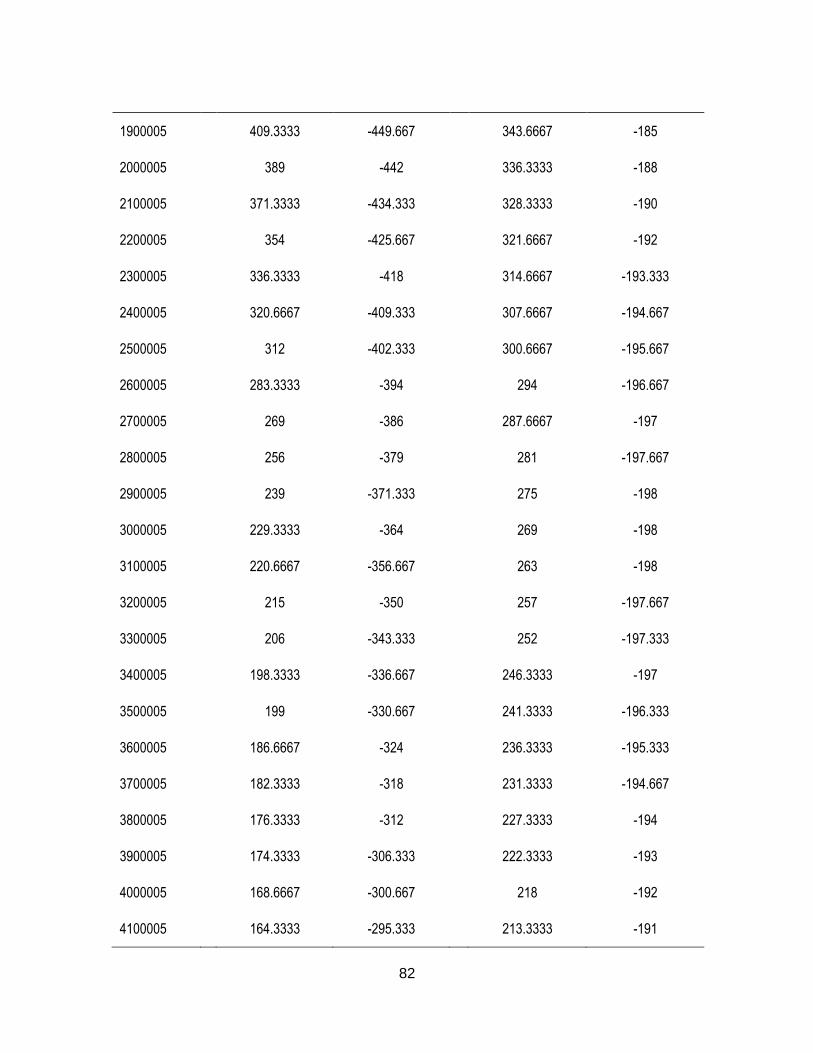
82
1900005 409.3333 -449.667 343.6667 -185
2000005
389 -442 336.3333 -188
2100005
371.3333 -434.333 328.3333 -190
2200005
354 -425.667 321.6667 -192
2300005
336.3333 -418 314.6667 -193.333
2400005
320.6667 -409.333 307.6667 -194.667
2500005
312 -402.333 300.6667 -195.667
2600005
283.3333 -394 294 -196.667
2700005
269 -386 287.6667 -197
2800005
256 -379 281 -197.667
2900005
239 -371.333 275 -198
3000005
229.3333 -364 269 -198
3100005
220.6667 -356.667 263 -198
3200005
215 -350 257 -197.667
3300005
206 -343.333 252 -197.333
3400005
198.3333 -336.667 246.3333 -197
3500005
199 -330.667 241.3333 -196.333
3600005
186.6667 -324 236.3333 -195.333
3700005
182.3333 -318 231.3333 -194.667
3800005
176.3333 -312 227.3333 -194
3900005
174.3333 -306.333 222.3333 -193
4000005
168.6667 -300.667 218 -192
4100005
164.3333 -295.333 213.3333 -191
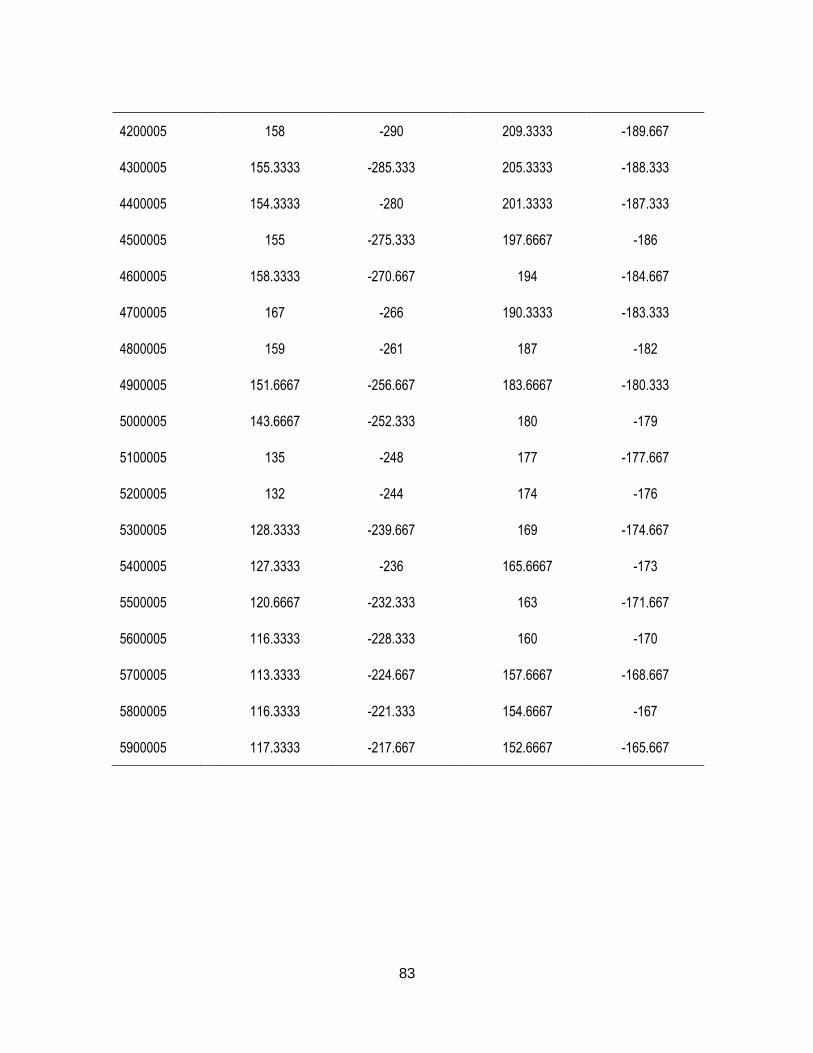
83
4200005
158 -290 209.3333 -189.667
4300005
155.3333 -285.333 205.3333 -188.333
4400005
154.3333 -280 201.3333 -187.333
4500005
155 -275.333 197.6667 -186
4600005
158.3333 -270.667 194 -184.667
4700005
167 -266 190.3333 -183.333
4800005
159 -261 187 -182
4900005
151.6667 -256.667 183.6667 -180.333
5000005
143.6667 -252.333 180 -179
5100005
135 -248 177 -177.667
5200005
132 -244 174 -176
5300005
128.3333 -239.667 169 -174.667
5400005
127.3333 -236 165.6667 -173
5500005
120.6667 -232.333 163 -171.667
5600005
116.3333 -228.333 160 -170
5700005
113.3333 -224.667 157.6667 -168.667
5800005
116.3333 -221.333 154.6667 -167
5900005
117.3333 -217.667 152.6667 -165.667
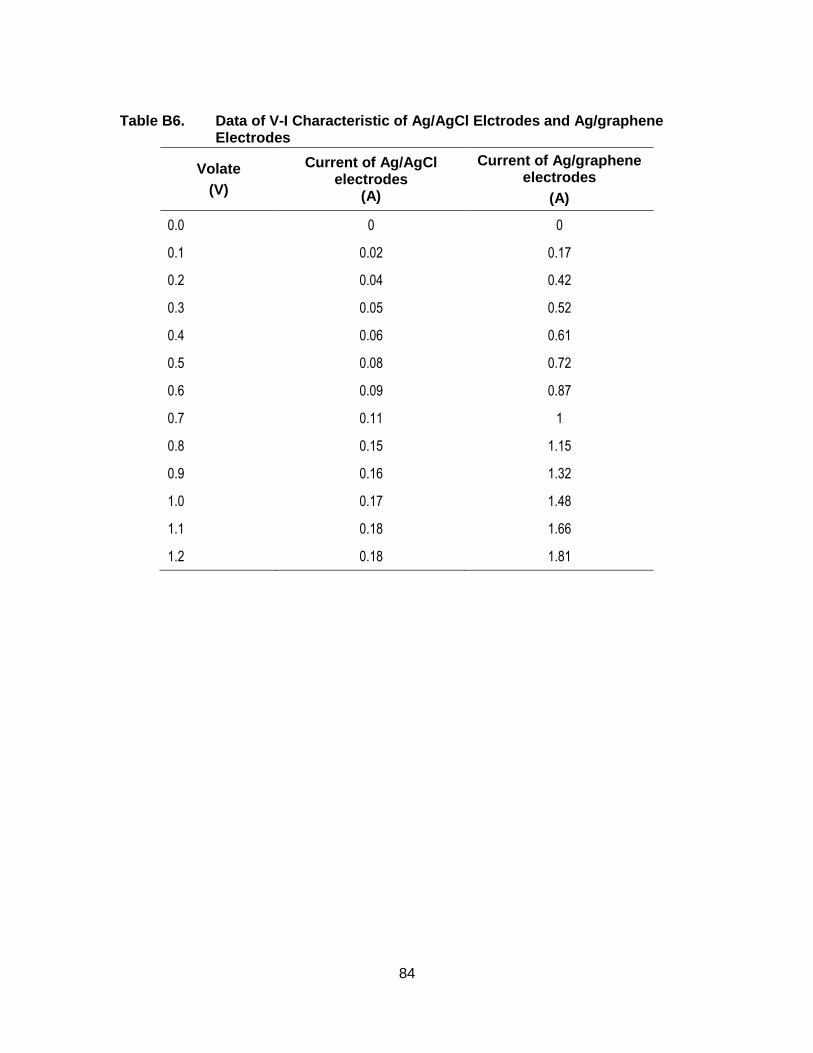
84
Table B6. Data of V-I Characteristic of Ag/AgCl Elctrodes and Ag/graphene Electrodes
Volate
(V)
Current of Ag/AgCl electrodes
(A)
Current of Ag/graphene electrodes
(A)
0.0 0 0
0.1 0.02 0.17
0.2 0.04 0.42
0.3 0.05 0.52
0.4 0.06 0.61
0.5 0.08 0.72
0.6 0.09 0.87
0.7 0.11 1
0.8 0.15 1.15
0.9 0.16 1.32
1.0 0.17 1.48
1.1 0.18 1.66
1.2 0.18 1.81
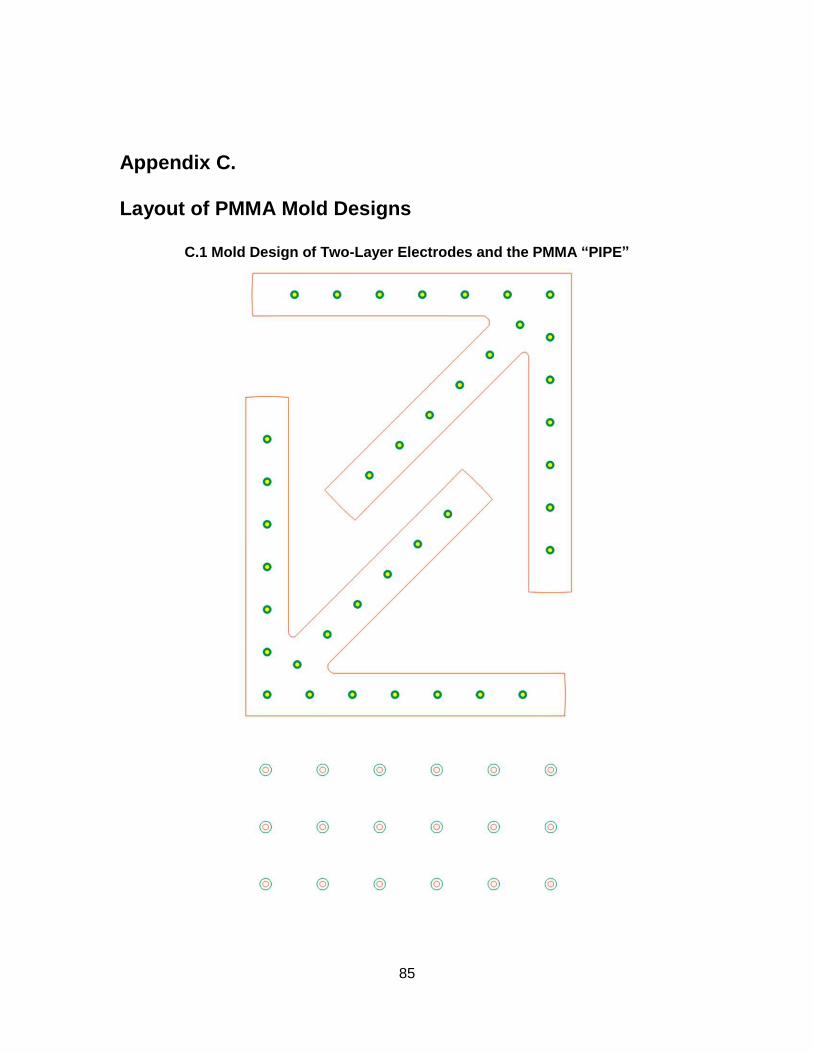
85
Appendix C. Layout of PMMA Mold Designs
C.1 Mold Design of Two-Layer Electrodes and the PMMA “PIPE”
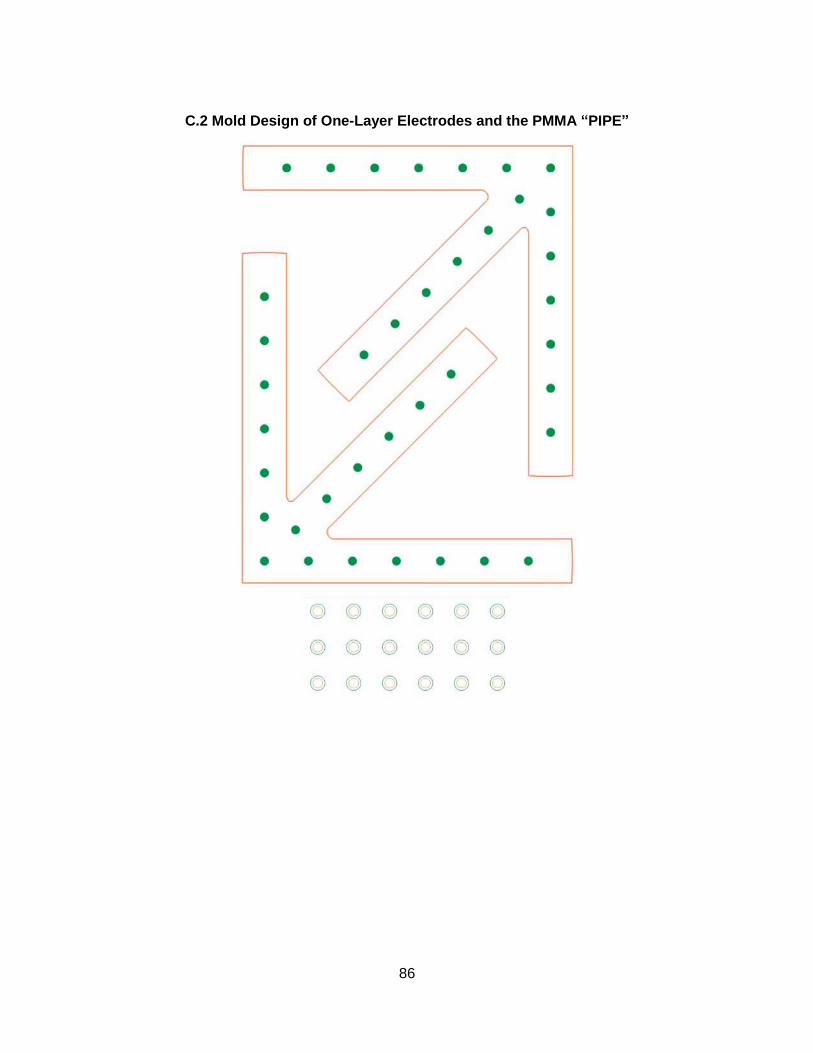
86
C.2 Mold Design of One-Layer Electrodes and the PMMA “PIPE”
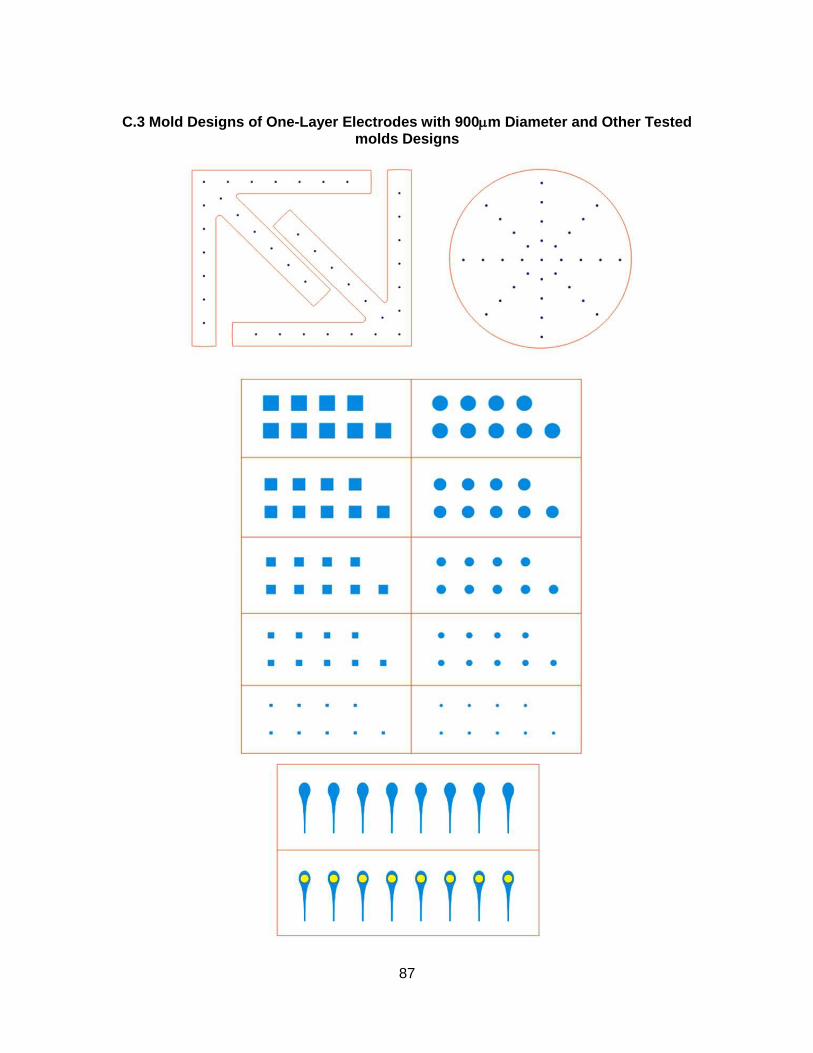
87
C.3 Mold Designs of One-Layer Electrodes with 900m Diameter and Other Tested molds Designs
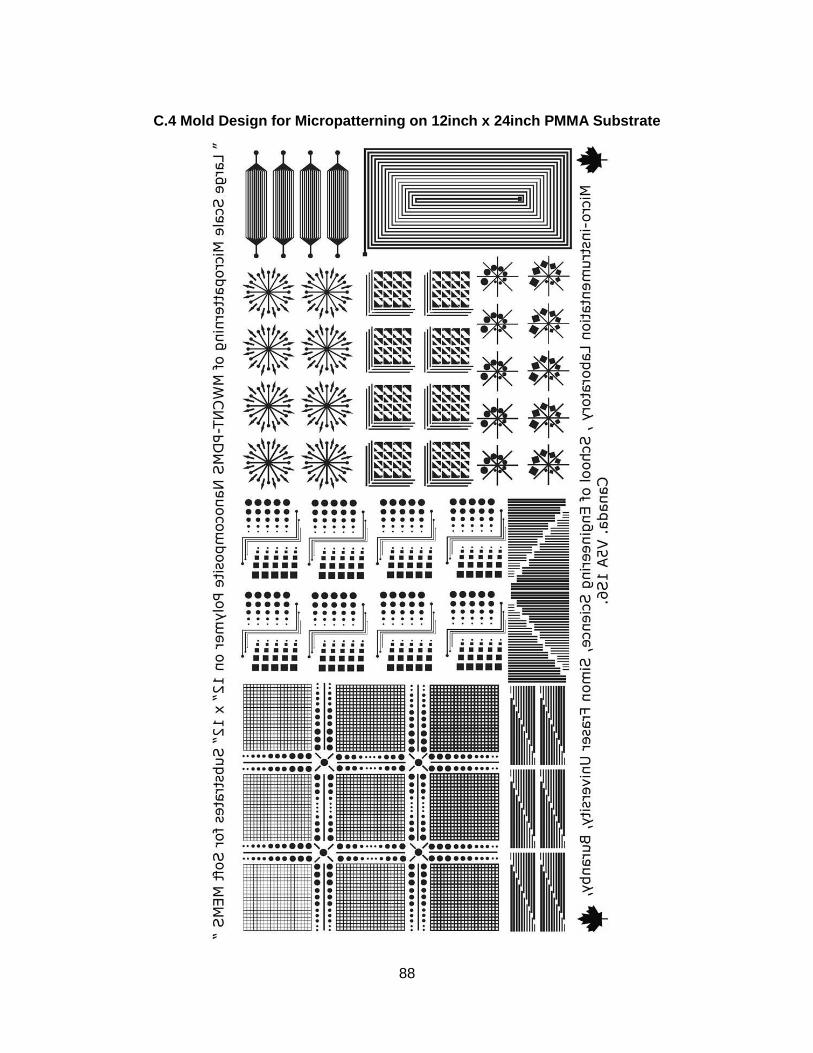
88
C.4 Mold Design for Micropatterning on 12inch x 24inch PMMA Substrate
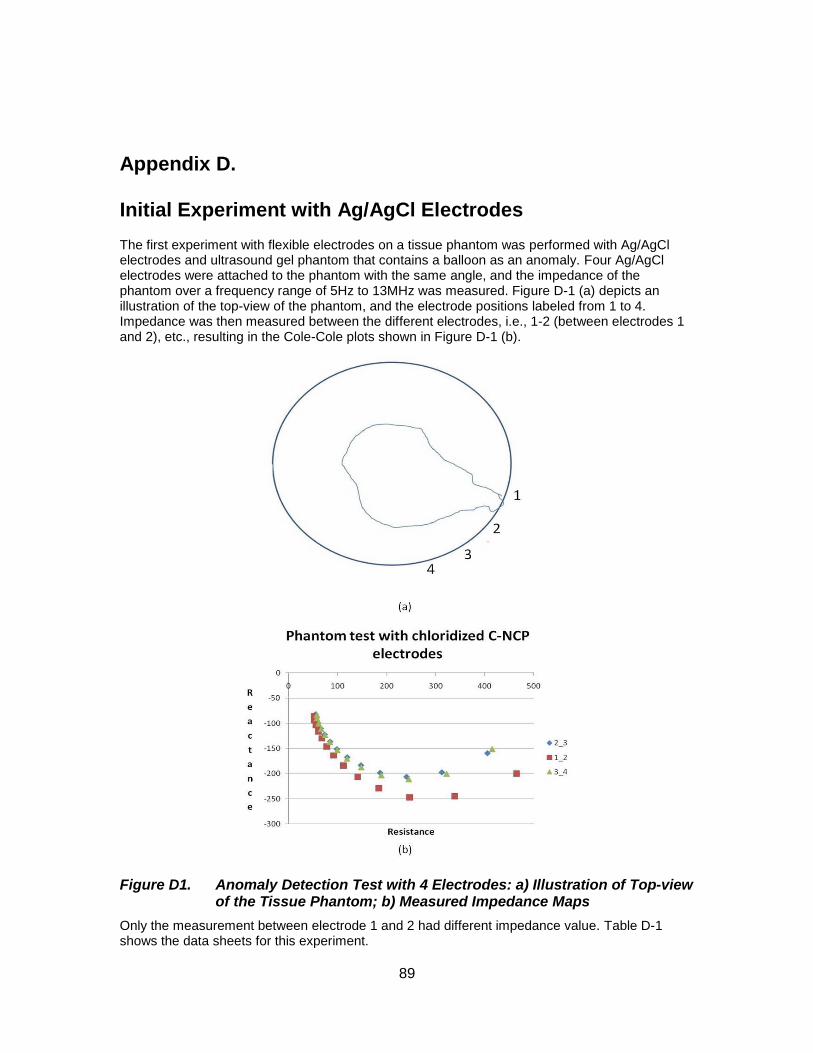
89
Appendix D. Initial Experiment with Ag/AgCl Electrodes
The first experiment with flexible electrodes on a tissue phantom was performed with Ag/AgCl electrodes and ultrasound gel phantom that contains a balloon as an anomaly. Four Ag/AgCl electrodes were attached to the phantom with the same angle, and the impedance of the phantom over a frequency range of 5Hz to 13MHz was measured. Figure D-1 (a) depicts an illustration of the top-view of the phantom, and the electrode positions labeled from 1 to 4. Impedance was then measured between the different electrodes, i.e., 1-2 (between electrodes 1 and 2), etc., resulting in the Cole-Cole plots shown in Figure D-1 (b).
Figure D1. Anomaly Detection Test with 4 Electrodes: a) Illustration of Top-view of the Tissue Phantom; b) Measured Impedance Maps
Only the measurement between electrode 1 and 2 had different impedance value. Table D-1 shows the data sheets for this experiment.
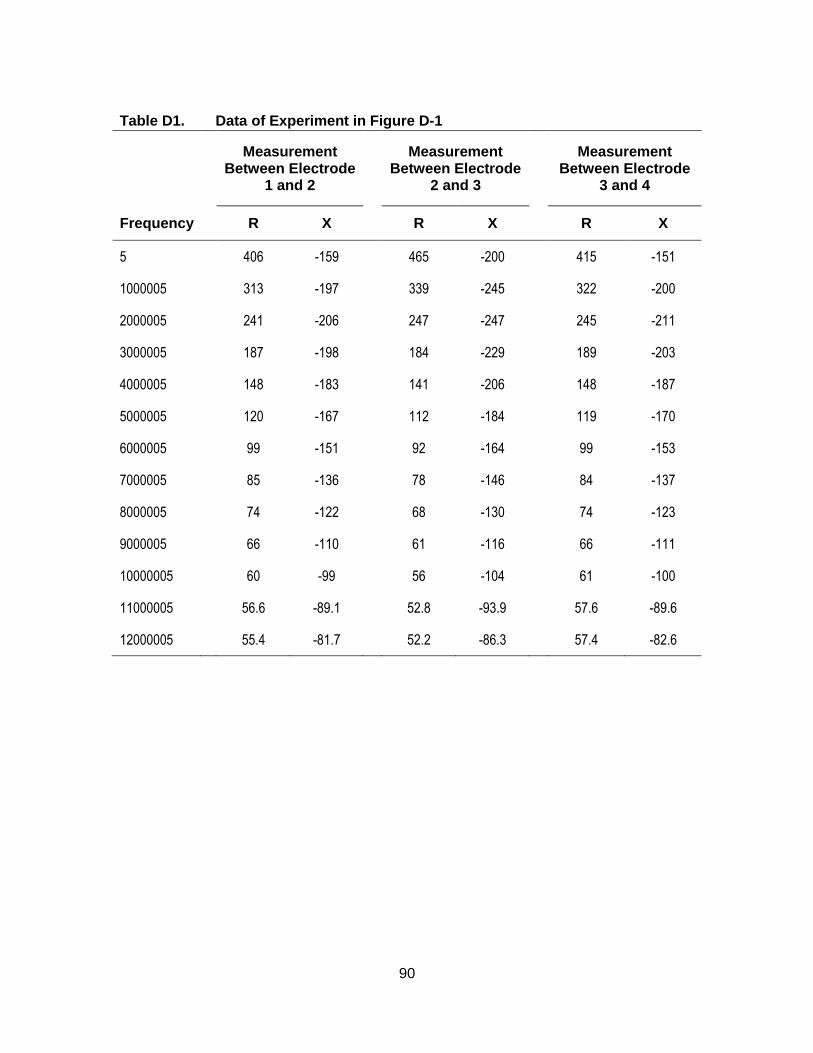
90
Table D1. Data of Experiment in Figure D-1
Measurement
Between Electrode 1 and 2
Measurement
Between Electrode 2 and 3
Measurement
Between Electrode 3 and 4
Frequency R X R X R X
5 406 -159 465 -200 415 -151
1000005 313 -197 339 -245 322 -200
2000005 241 -206 247 -247 245 -211
3000005 187 -198 184 -229 189 -203
4000005 148 -183 141 -206 148 -187
5000005 120 -167 112 -184 119 -170
6000005 99 -151 92 -164 99 -153
7000005 85 -136 78 -146 84 -137
8000005 74 -122 68 -130 74 -123
9000005 66 -110 61 -116 66 -111
10000005 60 -99 56 -104 61 -100
11000005 56.6 -89.1 52.8 -93.9 57.6 -89.6
12000005 55.4 -81.7 52.2 -86.3 57.4 -82.6
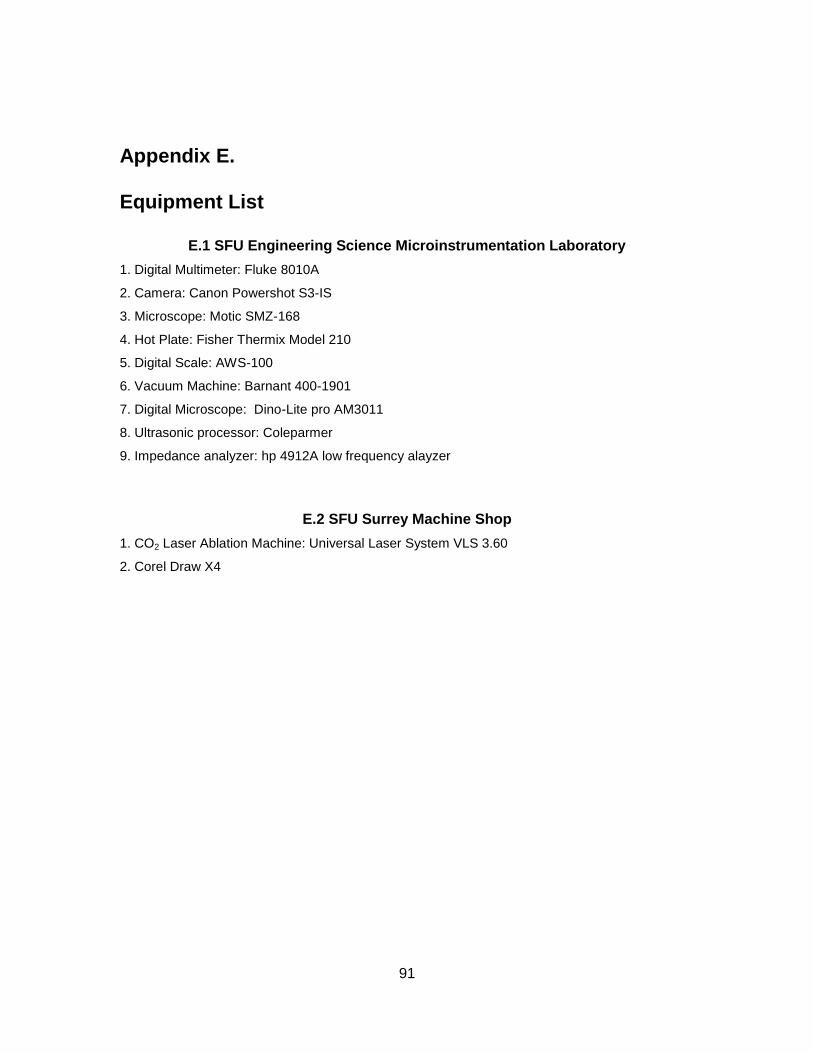
91
Appendix E. Equipment List
E.1 SFU Engineering Science Microinstrumentation Laboratory
1. Digital Multimeter: Fluke 8010A
2. Camera: Canon Powershot S3-IS
3. Microscope: Motic SMZ-168
4. Hot Plate: Fisher Thermix Model 210
5. Digital Scale: AWS-100
6. Vacuum Machine: Barnant 400-1901
7. Digital Microscope: Dino-Lite pro AM3011
8. Ultrasonic processor: Coleparmer
9. Impedance analyzer: hp 4912A low frequency alayzer
E.2 SFU Surrey Machine Shop
1. CO2 Laser Ablation Machine: Universal Laser System VLS 3.60
2. Corel Draw X4